Embed Size (px)
Citation preview

MOOSE-WILSON CORRIDOR USE LEVELS, TYPES, PATTERNS AND IMPACTS IN GRAND TETON
NATIONAL PARK
TECHNICAL REPORT - WINTER 2014 DATA
September 26th, 2014
Submitted By:
CHRISTOPHER MONZ, PH.D ASSOCIATE PROFESSOR, ENVS DEPARTMENT, UTAH STATE UNIVERSITY ASHLEY D’ANTONIO, MS PH.D. CANDIDATE, ENVS DEPARTMENT, UTAH STATE UNIVERSITY KEVIN HEASLIP, PH.D ASSISTANT PROFESSOR, CEE DEPARTMENT, UTAH STATE UNIVERSITY

PAGE 2 OF 57
TABLE OF CONTENTS
Executive Summary .................................................................................................................................................... 3
Methodology ........................................................................................................................................................... 3
Significant Findings ................................................................................................................................................ 3
1. Number of Vehicles on Road .......................................................................................................................... 3
2. Number of Visitors in the Moose-Wilson Corridor ........................................................................................ 4
3. Visitor Movement Patterns and Use Density .................................................................................................. 4
4. Parking Lot Accumulation .............................................................................................................................. 5
5. Photo Documentation of Activity ................................................................................................................... 5
Introduction ................................................................................................................................................................ 6
Study Site .................................................................................................................................................................... 8
Data Collection Needs ................................................................................................................................................ 9
Sampling Period and Data Collection Details ........................................................................................................ 9
Data Collection Methodology .................................................................................................................................. 11
1. Number of Vehicles on Road ............................................................................................................................ 11
2. Number of Visitors in the Moose-Wilson Corridor .......................................................................................... 12
3. Visitor Movement Patterns and Use Density .................................................................................................... 13
4. Parking Lot Accumulation ................................................................................................................................ 14
5. Photo Documentation of Activity ..................................................................................................................... 15
Results ...................................................................................................................................................................... 16
1. Number of Vehicles on Road ............................................................................................................................ 16
2. Number of Visitors in Corridor ......................................................................................................................... 21
3. Visitor Movement Patterns and Use Density .................................................................................................... 25
4. Parking Lot Accumulation ................................................................................................................................ 34
Vehicle Counts .................................................................................................................................................. 34
Winter Activity Type Counts ............................................................................................................................ 42
5. Photo Documentation of Activity ..................................................................................................................... 52
Summary of findings ................................................................................................................................................ 55
Acknowledgements .................................................................................................................................................. 56
Appendices ............................................................................................................................................................... 57
References ................................................................................................................................................................ 57

PAGE 3 OF 57
EXECUTIVE SUMMARY
This report presents a descriptive summary of findings from an interdisciplinary study designed to understand types, levels and patterns of visitor in the Moose-Wilson corridor during the winter season. From October 31st to approximately May 1st, the Moose-Wilson Road is closed to motor vehicular traffic from the Granite Canyon Trailhead to the junction of Death Canyon Road. The road is available during this winter season for non-motorized winter recreation. The winter data collection sampling period occurred during a selected period of winter use, from January 25th to February 9th, 2014. This work is part of an overall study that includes multiple data collection seasons, the first of which took place between July 1 and October 31, 2013. The winter data collection season was the second data collection season, with the third data collection season occurring from June 1st, 2014 through October 2014. This report includes a summary of descriptive findings from the Winter 2014 data collection season.
METHODOLOGY
The Winter 2014 data collection season consisted of an approximately two-week sampling period from January 25th to February 9th. This period was selected to ensure adequate snow coverage would be present to support the full range of winter recreation types in the corridor. The data collected is summarized for the entire two-week sampling period but, when appropriate, weekday and weekend summaries are provided. Various field methodologies—some census-based and some sampling-based—were used simultaneously in order to get a more accurate understanding of visitor use. These methods included the use of TRAFx vehicle counters located on the portions of the Moose-Wilson Road that were opened to vehicular traffic, infrared trail counters (with calibration procedures), motion-activated cameras, Global Positioning System (GPS)-tracking of various use types, parking lot accumulation counts, and observational counts of winter recreationists in the parking lots. Each methodological technique used is described in detail in the body of this report.
SIGNIFICANT FINDINGS
1. NUMBER OF VEHICLES ON ROAD
Four TRAFx vehicle counters were placed along the Moose-Wilson Road to count vehicle use. A fifth counter was placed on the Murie Ranch Road. The Granite Canyon Trailhead end of the Moose-Wilson Road had higher levels of traffic compared to the Death Canyon Road Junction end of the Moose-Wilson Road. During the two-week sampling period, 1347 total vehicles (average of 84 vehicles per day) were counted at the Granite Canyon Trailhead end while 805 total vehicles (average of 58 vehicles per day) were counted at the Death Canyon Road Junction end of the Moose-Wilson Road. Vehicle use was higher on the weekends at both ends of the Moose-Wilson Road. For example, at the Granite Canyon Trailhead end, on average 115 vehicles were counted on weekend days. Vehicle traffic at the Death Canyon Road Junction end of the Moose-Wilson Road was busiest between 9:00am and 3:00pm.

PAGE 4 OF 57
Vehicle traffic at the Granite Canyon Trailhead end of Moose-Wilson Road was busiest between 12:00pm and 4:00pm.
2. NUMBER OF VISITORS IN THE MOOSE-WILSON CORRIDOR
A total of ten infrared counters were placed throughout the non-motorized use areas of the Moose-Wilson Road corridor in order to determine the level of recreation use at various destinations. The infrared counter located on Death Canyon Road had the highest number of visitor use observed. On average, 57 visitors per day used the Death Canyon Road. The next busiest location was the Moose-Wilson Road via the Granite Canyon Trailhead parking area. This counter had an average of 51 visitors accessing the Moose-Wilson Road from the Granite Canyon Trailhead area per day and on average twice as many visitors per day on weekends as weekdays. Overall use was greater on weekends, and very little recreation use was observed on the Woodland Trail and Lake Creek Trail “side trails.” The highest recreation use on other “side trails” was observed on the Granite Canyon Trail (average of 26 visitors per day) and the JY Ranch Winter Road (average of 19 visitors per day).
3. VISITOR MOVEMENT PATTERNS AND USE DENSITY
A random sample of recreationists were asked to voluntarily carry GPS units during their trip and to return them to researchers at the end of their visit. GPS tracking can be used to determine visitor use patterns and densities. A high participation rate was achieved, indicating that a representative sample of recreationists was obtained. All rejections (only 5) came from backcountry skiers. More GPS tracks were collected at the Granite Canyon Trailhead parking area than the Death Canyon Road junction including the adjacent unpaved winter parking area, since use is higher at the Granite Canyon Trailhead parking lot. The majority of visitors tracked were cross-country skiers—which is the most common winter activity occurring in the corridor—but tracks were also collected from backcountry skiers, snowshoers, and hikers/walkers. The observed range of backcountry skiing use was confined to the Death Canyon Road area and surrounding terrain. Cross-country skiers were the most dispersed recreation activity type accessing areas from and around Death Canyon Road, the Laurance S. Rockefeller (LSR) Preserve, Phelps Lake, and Granite Canyon Trail, and also staying confined to the Moose-Wilson Road. The least dispersed group was hikers/walkers—only using the Moose-Wilson Road, some areas near Phelps Lake and some of the Granite Canyon Trail. No hikers/walkers hiked the entire closed portion of the Moose-Wilson Road. Snowshoers were more dispersed in the Moose-Wilson Road corridor compared to hikers/walkers; snowshoers accessed more terrain around Phelps Lake and did cover the entire length of the Moose-Wilson Road. The JY Ranch Winter Road was an important side trail that provided many recreationists access to Phelps Lake.

PAGE 5 OF 57
4. PARKING LOT ACCUMULATION
Hourly counts of the number of vehicles parking in designated lots and overflow parking locations (any car parked along the Moose-Wilson Road) were conducted. Additionally, all recreationists observed in the parking lots during parking lot accumulation data collection were counted and their winter activity type recorded. More local vehicles (non-rental WY-22 plates) were observed in the Granite Canyon Trailhead parking lot (64%) than at the Death Canyon Road Junction and winter parking area (approximately 50%). Very few cars were observed at the Death Canyon junction overflow winter parking area. Vehicle use of overflow parking areas occurred on both weekdays and weekends at the Granite Canyon Trailhead parking area. On weekends, there was an average of 4 cars in both the designated parking lot and the overflow parking area along Moose-Wilson Road at the Granite Canyon Trailhead parking area.
The activity type and number of recreationists were recorded as visitors were observed in the Death Canyon Road junction and winter parking area and the Granite Canyon Trailhead parking area. The most frequently observed activity types were cross-country skiers and backcountry skiers. More cross-country skiers than backcountry skiers were observed at the Granite Canyon Trailhead parking area and an equal number of backcountry and cross-country skiers were observed in the Death Canyon Road Junction and the winter parking area. Most winter recreation use at the Death Canyon Road junction and winter parking area occurred between 9:00am and 1:00pm. At the Granite Canyon Trailhead parking area, most winter recreation use occurred between 10:00am and 2:00pm.
5. PHOTO DOCUMENTATION OF ACTIVITY
Eight motion-activated cameras were placed in combination with infrared counters throughout the Moose-Wilson Road corridor. The cameras provide another means of determining which recreational activity types were using different portions of the Moose-Wilson Road corridor during the winter. Over 76% of the recreationists observed with the motion-activated cameras were either cross-country skiers or backcountry skiers. Almost twice as many cross-country skiers were observed in the corridor than backcountry skiers. Most backcountry skiers (500 out of 567 total) were observed on the Death Canyon Road while most cross-country skiers were observed at the Granite Canyon Trailhead parking area gate on the Moose-Wilson Road. Hikers/walkers were the least common recreational activity observed in the Moose-Wilson Road corridor. The presence of dogs and whether or not they were leashed were also noted when examining the photos collected by the motion-activated cameras; approximately 1/3 of dogs observed were unleashed.

PAGE 6 OF 57
INTRODUCTION This document is the technical report of findings from the Moose-Wilson Corridor Use Levels, Types, Patterns and Impacts in Grand Teton National Park - Winter 2014 data collection effort. All data was collected and analyzed by Utah State University, with the exception of vehicle counter data that was collected by Grand Teton National Park (GRTE) staff and analyzed by Utah State University. This document describes the methodologies used in the field in the Moose-Wilson corridor (see Figure 2), results from the 2014 winter data collection season, which occurred from January 25 through February 11, and a summary of salient findings from the study.
The Moose-Wilson corridor—in the southwest corner of GRTE—is an outstanding representation of the park’s major natural ecological communities, all of which are located within a geographic area that is about seven miles in length, five miles in width, and about 10,300 acres in size. These natural communities include alpine, subalpine, forests, sagebrush flats, wet meadows and wetlands, lakes, rivers, and ponds, and an associated diversity of fish and wildlife. The Moose-Wilson corridor is enclosed roughly by the Teton Range to the west, the Snake River to the east, the community of Moose to the north, and the park’s Granite Canyon entrance to the south.
The corridor contains several primary visitor use areas, including Death Canyon and Granite Canyon trailhead parking areas, Laurance S. Rockefeller (LSR) Preserve, the historic districts of White Grass Ranch and Murie Ranch, and the Sawmill Ponds overlook. Other visitor use areas include Poker Flats horse trails and the Snake River levee road. Connecting visitor use and parking areas within the corridor are Moose-Wilson Road and Death Canyon Road.
The Moose-Wilson Road is the primary access point to destinations within the corridor, and extends 7.1 miles northward from the terminus of Wyoming 390 at the park’s Granite Canyon Entrance to the Teton Park Road at Moose. The narrow, winding, partially gravel road provides access to the south end of Grand Teton National Park, and a rustic, slow driving experience for visitors looking for exceptional scenery and wildlife viewing opportunities. The road is open to through motor vehicle traffic along its entire length seasonally from approximately May 1 to October 31.
After October 31st each year, the road is gated to motor vehicle southbound traffic at the Death Canyon Road intersection and to northbound traffic near the Granite Canyon Trailhead. The closed portion of the Moose-Wilson Road becomes a corridor for non-motorized, recreational use including backcountry skiing (downhill skiing in remote areas), cross-country skiing (ski touring done in less steep terrain, sometimes in groomed tracks), snowshoeing, walking/hiking, and dog walking. The Moose-Wilson Road and associated trails are not groomed in the winter but can become packed down with use, which facilitates use by hikers (walking without snowshoes). Winter parking areas are located at the Granite Canyon Trailhead and the Death Canyon Road junction. The goal of this study is to collect data about levels, types, and patterns of visitor activities in the corridor during the winter season. These data, in combination with results from the 2013 summer/fall visitor use study (Monz et al., 2014) and a 2014

PAGE 7 OF 57
summer/fall visitor use study, will inform the park’s Moose-Wilson corridor planning process. The planning process will assess the type and level of visitor use that can be accommodated while sustaining the desired resource conditions and visitor experience within the corridor. In that planning effort, the National Park Service will use the results from this and other studies, as well as other information, to develop and evaluate a range of alternatives that considers a variety of management strategies within the corridor aimed at achieving desired future conditions. The alternatives will be developed and evaluated through a planning process that engages the public and results in a long-term approach for corridor management.
Figure 1: Left photo shows Granite Canyon Trailhead in the early winter season with snow packed down from use
(NPS photo by Jon Christensen). The right photo shows a pair of snowshoers hiking down Death Canyon Road.

PAGE 8 OF 57
STUDY SITE
Figure 2: Map describing the extent of the Moose-Wilson corridor and the location of the study activities.

PAGE 9 OF 57
DATA COLLECTION NEEDS
SAMPLING PERIOD AND DATA COLLECTION DETAILS
Data collection occurred for approximately two weeks between January 25th and February 9th, 2014. Sampling days were randomly selected to represent both weekend and weekday use levels and activity types. Certain data collection approaches are more suitable for random sampling while other measures were collected continuously throughout the sampling period (see Table 1). Note that all research activities did not occur on all days of the sampling period, but results are generalized to represent winter use during the two-week winter sampling period. A detailed account of all data collection types and locations is provided (Table 1).

PAGE 10 OF 57
Table 1: Summary of all data collection needs, basic methodology and sampling approach for each data need, and data collection-specific site locations (see Figure 2).
Information Need Data Collection Approach
Time Frame Locations
1. Number of Vehicles on Roads
TRAFx vehicle counters
Continuous ▪ Murie Ranch Road
▪ M-W Road between Murie Ranch Road and hill north of Sawmill Ponds overlook
▪ M-W Road north of Death Canyon Road unpaved parking area
▪ M-W Road south of Granite Canyon trailhead parking area
▪ M-W Road south of Granite Canyon entrance station.
2. Number of Visitors by Activity Type in Corridor
Infrared counters Continuous use of counters; activity type will be assessed via manual counts during counter calibrations
▪ M-W Road south of Death Canyon Junction
▪ M-W Road north of Granite Canyon Trailhead
▪ M-W Road between Lake Creek and Woodland Trail crossings
▪ Death Canyon Road near Death Canyon Junction
▪ LSR Preserve Center Road near Moose-Wilson Road
▪ Lake Creek Trail between M-W Road and Phelps Lake
▪ Woodland Trail between M-W Road and Phelps Lake
▪ Levee Access Road
▪ Former JY Ranch Winter Road
▪ Granite Canyon Trail near Granite Canyon Trailhead
3. Visitor Movement Patterns and Use Densities
GPS tracking Stratified random sampling
▪ Granite Canyon TH
▪ Death Canyon Junction
4. Parking Lot Accumulation
Observation Random Sampling ▪ Granite Canyon TH
▪ Death Canyon Junction
5. Photo Documentation of Activity
Motion-Activated Cameras co-located with counters
Continuous ▪ M-W Road @ Death Canyon Jct Gate
▪ M-W Road at Granite Canyon TH Gate
▪ Death Canyon Road
▪ LSR Preserve Road
▪ Woodland Trail
▪ Levee Access Road
▪ JY Ranch Winter Road
▪ Granite Canyon Trailhead

PAGE 11 OF 57
DATA COLLECTION METHODOLOGY
1. NUMBER OF VEHICLES ON ROAD
The number of vehicles travelling on the road to the Granite and Death Canyon winter parking areas were recorded with TRAFx magnetometer-type vehicle counters (Hunt and Hosegood, 2008; TRAFx Research Ltd., 2014). Counters were placed on the ground along the road at four locations (see list below and Figure 2). An additional 5th counter was placed to record vehicle traffic numbers on Murie Ranch Road. Of the counters on the Granite Canyon (south) end of the corridor, the southernmost one counted private residential traffic into the Granite Canon Ranch while the other counted only traffic to the Granite Canyon Trailhead. Of the counters on the Death Canyon (north) end of the corridor, the northernmost one counted private residential traffic into the private residences near the former Hartgraves Ranch while the other counted only traffic to the Death Canyon Junction. The TRAFx counters record the number of vehicles that passed the counter and summarizes by the total number of cars that passed during that hour of the day. The counter does not distinguish direction (note that the road is a dead-end from each direction, so most vehicles would be counted twice; once upon each entry and exit). The TRAFx vehicle counters were provided and installed by GRTE staff before snowfall and removed after snowmelt. GRTE staff downloaded the counters and delivered raw data to Utah State University (USU) for data summary and analysis.
Traffic Counter Locations:
§ Murie Ranch Road § Moose-Wilson Road north of Sawmill Ponds overlook (northernmost) § Moose-Wilson Road north of Death Canyon Road unpaved parking area § Moose-Wilson Road south of Granite Canyon trailhead parking area § Moose-Wilson Road south of Granite Canyon entrance station (southernmost)
Figure 3: Moose-Wilson Road at Granite Canyon Trailhead (photo by Jess Anderson).

PAGE 12 OF 57
2. NUMBER OF VISITORS IN THE MOOSE-WILSON CORRIDOR
Visitor use counts were conducted using TrailMaster infrared trail counters (Pettebone et al., 2010; TrailMaster, 2014). Counters were provided and installed by USU. The counters were placed at trailheads and at important trail junctions between the Death Canyon and Granite Canyon winter parking areas (listed below and on Figure 2). Trail counters collected data continuously throughout the study period. The TrailMaster counters provide a summary of the number of visitors that passed the counter for each hour of the day. USU field technicians calibrated the counters to ensure that our final visitor use estimates were corrected for any counter error observed (Pettebone et al., 2010). Observational calibration techniques were also used to determine proportion of activity types (backcountry skiing, cross-country skiing, snowshoeing, walking, and dog walking) and direction of travel. USU visited the trail counters frequently to check on counter function.
Infrared Trail Counter Locations:
▪ Moose-Wilson Road near Death Canyon Junction ▪ Moose-Wilson Road near Granite Canyon Trailhead ▪ Moose-Wilson Road between Lake Creek and Woodland Trail crossings ▪ Death Canyon Road near Death Canyon Junction ▪ LSR Preserve Center Road near Moose-Wilson Road ▪ Lake Creek Trail between Moose-Wilson Road and Phelps Lake ▪ Woodland Trail between Moose-Wilson Road and Phelps Lake ▪ Granite Canyon Trail near Granite Canyon Trailhead ▪ Levee Access Road ▪ Former JY Ranch Winter Road
Figure 4: Infrared trail counter strapped to a tree on Moose-Wilson Road near Death Canyon junction gate (photo by
Ashley D’Antonio)

PAGE 13 OF 57
3. VISITOR MOVEMENT PATTERNS AND USE DENSITY
Visitor use patterns were determined using GPS-based methodologies (D’Antonio et al., 2010; Hallo et al., 2012). Garmin GPS units were handed out to a random selection of visitors at both the Granite Canyon Trailhead and Death Canyon Road junction and winter parking area (Figure 2). Sampling was conducted using a stratified random approach to ensure representative sample of weekends, weekdays, and times of day. Visitors were randomly intercepted; however, opportunistic sampling was used at the discretion of the researchers to help achieve a representative sample of all three types of visitor activity observed at the trailheads (cross-country skiing, backcountry/all-terrain skiing, walking). Visitors returned the GPS units upon leaving the trailheads to field technicians or, if a field technician could not be found, in drop boxes which were located at the Granite Canyon Trailhead and Death Canyon Road junction. Field technicians checked the drop boxes frequently to retrieve GPS units. No GPS units were lost during the study.
Figure 5: Left photo shows field technician, Jess Anderson, collecting a GPS-unit from a winter recreationist (photo by Annie Weiler). Right photo shows the mailbox that served as the drop-box for GPS units located at the Death
Canyon Road junction (photo by Ashley D’Antonio).

PAGE 14 OF 57
4. PARKING LOT ACCUMULATION
During the time that the road is closed to through motor vehicle traffic, the intersection of the Death Canyon and Moose-Wilson roads becomes a defacto parking area due to its relatively large paved areas and proximity to the closure gate. This area within the intersection is referred to as the Death Canyon junction. The unpaved parking area just north of the junction is used primarily in the winter as a winter parking area. During the summer it is used in a more limited manner and designated for horse trailer parking. In order to determine the level of parking demand at both the Granite Canyon Trailhead parking area and the Death Canyon Road junction and winter parking area, an hourly count of number of parked vehicles, number of local cars, and number of any overflow parking was collected (Lawson et al., 2003). Parking lot sampling occurred at the same time as GPS-tracking of visitors. Parking lot accumulation was conducted in the same manner as the Summer/Fall 2013 Study (Monz et al., 2014). Overflow parking at Granite Canyon was characterized as any parking that occurred outside the boundary of the summer parking lot. Overflow parking at the Death Canyon Road junction included any parking that occurred outside of the unpaved winter parking area or the road junction. In addition to counting cars, the number of visitors observed in the parking lots during GPS-tracking of visitors was also recorded. These visitor parking lot counts were summarized by the hour and visitor activity type was also noted. These counts were taken to help understand the various proportions of visitor activity types occurring in the Moose-Wilson corridor during the winter season.
Figure 6: Left photo shows the Granite Canyon Trailhead Parking Lot. Right photo shows the Death Canyon winter parking area (photos by Jess Anderson).

PAGE 15 OF 57
5. PHOTO DOCUMENTATION OF ACTIVITY
Photo documentation of non-vehicle related visitor activities was conducted using motion-activated cameras. GRTE provided Reconyx brand motion-activated cameras (Conlon, 2014; Reconyx, Inc., 2014). These cameras were set up in combination with the infrared counters provided by USU (see list below). GRTE staff provided initial assistance with the installation of the cameras while USU installed, operated, maintained, and downloaded all cameras for the winter data collection season. The cameras were installed to document levels and patterns of visitor use throughout the Moose-Wilson corridor. Photos were manually analyzed and were used to summarize the total number of visitors, by activity type, observed at each location.
Motion-activated camera locations: ▪ Moose-Wilson Road near Death Canyon Junction ▪ Moose-Wilson Road near Granite Canyon Trailhead ▪ Death Canyon Road near Death Canyon Junction ▪ LSR Preserve Road near Moose-Wilson Road ▪ Woodland Trail between Moose-Wilson Road and Phelps Lake ▪ Granite Canyon Trail near Granite Canyon Trailhead ▪ Levee Access Road ▪ JY Ranch Winter Road
Figure 7: Motion-activated camera placed on the gate of the LSR Preserve to document visitor activity
types (photo by Ashley D’Antonio).

PAGE 16 OF 57
RESULTS
1. NUMBER OF VEHICLES ON ROAD
The total number of vehicles using the Moose-Wilson Road during the winter sampling period was determined using TRAFx vehicle counters. The data from the TRAFx counters which corresponded to the winter data collection season (January 25th-February 9th) were summarized from the Death Canyon Road junction counter and the counter located on the Moose-Wilson Road near the Granite Canyon Trailhead. Overall, the Granite Canyon Trailhead received higher total use compared to the Death Canyon Road junction (Table 1.1). Weekend use at the Granite Canyon Trailhead was almost double that of weekday use, while weekday and weekend use was more consistent at the Death Canyon Road junction (Table 1.1).
Table 1.1: Summary of vehicle use data on the Moose-Wilson Road at the Death Canyon Road junction and the Granite Canyon Trailhead for the two-week sampling period. Averages are reported with ± 1 standard deviation*.
Location Total
Vehicles Daily Average
(vehicles/day ± SD) Weekday Average (vehicles/day ± SD)
Weekend Average (vehicles/day ± SD)
Death Canyon Road Junction
805 58 (± 20) 52 (± 15) 63 (± 23)
Granite Canyon Trailhead
1347 84 (± 41) 65 (± 30) 115 (± 40)
*Standard deviation is a measure of the amount of variation in a dataset. A low standard deviation means the data points are very close together while a larger standard deviation means the data points are more disperse.
Figure 1.1: Vehicles parking along the Moose-Wilson Road at the
Granite Canyon Trailhead (NPS photo by Jon Christensen).

PAGE 17 OF 57
Temporally, there was an increase in vehicle use on the Moose-Wilson Road at the Death Canyon Road junction in early February (Figure 1.2). Use at the Granite Canyon Trailhead appeared to be highest in late January (Figure 1.3). Both locations experienced a spike of vehicle use, representing the highest level of use for both counters during the sampling period, on February 1st (Figures 1.2 and 1.3). Heavy snowfall occurred on January 30th and 31st, possibly leading to a spike of use occurring on that Saturday, February 1st.
Figure 1.2: Total number of vehicles observed on the Moose-Wilson Road at the Death Canyon Road junction for each day of the winter sampling period. Data was missing for January 25th and 26th.
0 20 40 60 80
100 120
Num
ber o
f Veh
icle
s
Date
Daily Vehicle Counts on the Moose-Wilson Road at Death Canyon Road Junction

PAGE 18 OF 57
Figure 1.3: Total number of vehicles observed on the Moose-Wilson Road at the Granite Canyon Trailhead for each day of the winter sampling period.
Vehicle use on the Moose-Wilson Road at the Death Canyon Road junction began to increase at 6:00am, leveling off at around 9:00am, before another increase was observed between 12:00pm and 3:00pm (Figures 1.4 and 1.5). After 3:00pm, vehicle use dropped steadily (Figures 1.4 and 1.5). At the Granite Canyon Trailhead, vehicle use on the Moose-Wilson Road increased slowly from 6:00am to 9:00am. Immediately after 9:00am a rapid increase in vehicle use was observed (Figures 1.4 and 1.5). Use peaked at 12:00pm and remained high until 4:00pm when vehicle use began to decrease rapidly (Figures 1.4 and 1.5).
0
50
100
150
200
Num
ber o
f Veh
icle
s
Date
Daily Vehicle Counts on the Moose-Wilson Road at Granite Canyon Trailhead

PAGE 19 OF 57
Figure 1.4: Total vehicles observed during each hour of the day for the entire sampling period from TRAFx counters located on the Moose-Wilson Road at the Death Canyon Road Trail junction and the Granite Canyon Trailhead.
Figure 1.5: Average number of vehicles observed at each hour of the day for the entire sampling period from TRAFx counters located on the Moose-Wilson Road at the Death Canyon Road Trail junction and the Granite Canyon
Trailhead.
0 50
100 150 200 250
0:00
1:
00
2:00
3:
00
4:00
5:
00
6:00
7:
00
8:00
9:
00
10:0
0 11
:00
12:0
0 13
:00
14:0
0 15
:00
16:0
0 17
:00
18:0
0 19
:00
20:0
0 21
:00
22:0
0 23
:00
Tota
l Veh
icle
s
Hour of Day
Total Vehicle Use by Hour on the Moose-Wilson Road During the Winter Sampling Period
Death Canyon Granite Canyon
0
5
10
15
0:00
1:
00
2:00
3:
00
4:00
5:
00
6:00
7:
00
8:00
9:
00
10:0
0 11
:00
12:0
0 13
:00
14:0
0 15
:00
16:0
0 17
:00
18:0
0 19
:00
20:0
0 21
:00
22:0
0 23
:00
Aver
age
Vehi
cle
Cou
nt
Hour of Day
Average Vehicle Use by Hour on the Moose-Wilson Road During the Winter Sampling Period
Death Canyon Granite Canyon

PAGE 20 OF 57
Figure 1.6: One vehicle remaining in the Granite Canyon Trailhead
parking lot at 4:00pm (photo by Jess Anderson)
NOTE: Although five counters were placed in the Moose-Wilson Corridor, only the two counters closest to the winter parking lot locations were summarized in this report. The data from the remaining three counters was downloaded but not analyzed as part of this project. Both Utah State University and Grand Teton National Park have the raw data from the remaining three counters.

PAGE 21 OF 57
2. NUMBER OF VISITORS IN CORRIDOR
Infrared counters were placed throughout the Moose-Wilson Road corridor for the duration of the winter sampling period. The counters ran continuously at 10 locations (see Figure 2). Manual observations were conducted at each location to allow for correction of any counter error. During these observations, visitor direction of travel and activity type was also noted. Table 2.1 shows results from the observations conducted at each counter. Very little counter error occurred during the winter sampling period. Overall, cross-country skiers were the most frequently observed group in the corridor during counter calibrations; following by backcountry skiers, hikers, and snowshoers (Table 2.1).
Table 2.1: Results from manual counts recorded during calibration observations at each counter during the winter sampling period. The weight value indicates the level of counter error observed. A value of 1 indicates that there was no counter error observed, a value >1 indicates that the counter was underestimating visitor use, and a value <1 indicates that the counter was overestimating visitor use. Counter Location Enter Exit Hike Snow-
Shoe XC-Ski BC-Ski Dog Walking
Total Count Weight
Death Canyon Road 2 21 0 4 0 19 0 23 1.15
MWR @ Death Canyon Gate
2 5 2 2 3 0 0 7 1
LSR Preserve 3 3 0 0 6 0 0 6 1
Woodland Trail 3 2 0 0 5 0 0 5 1
MWR @ Midway 4 2 0 0 6 0 0 6 1
Lake Creek Trail 1 1 0 0 2 0 0 2 1
JY Winter Road 11 8 0 0 19 0 0 19 0.90
Levee Road 4 4 0 0 8 0 0 8 1
MWR @ Granite Gate 25 23 8 4 34 0 2 48 1
Granite Canyon Trailhead
9 14 5 1 1 3 1 23 1.21
Totals 64 81 15 11 84 22 3 147
Percent Of Total 44 55 10 7 57 15 2 Mean: 1.03

PAGE 22 OF 57
The weighted values from Table 2.1 were used to correct the total counts collected by the infrared counters (Table 2.2). From these total counts (Table 2.2 and Figure 2.1), overall averages and weekend and weekday averages were calculated (Table 2.2). The counter location in the Moose-Wilson Road corridor which showed the highest level of winter use was the counter located on Death Canyon Road with, on average, 57 visitors counted on the Death Canyon Road per day (Table 2.2 and Figure 2.2). The next highest used location was the Granite Canyon Trailhead end of the Moose-Wilson Road which saw on average twice the levels of use on weekends than weekdays. On average, 51 visitors passed this counter each day during the winter sampling period (Table 2.2 and Figure 2.2). For all counters in the Moose-Wilson Road corridor, weekend use was higher than weekday use for the two-week winter sampling period (Table 2.2 and Figure 2.2).
Table 2.2: Total and average levels of use at each infrared trail counter placed in the Moose-Wilson Road corridor for the winter sampling period. All values have been corrected using the weight value from Table 2.1.
Trail Use Levels by Counter
Total Use* (# of visitors)
Overall Average*
(visitors/day)
Weekday Average*
(visitors/day)
Weekend Average*
(visitors/day)
Death Canyon Road 1074 57 47 78
MWR @ Death Canyon Gate 340 20 17 27
LSR Preserve 175 8 9 8
Woodland Trail 45 6 4 7
MWR @ Midway 152 15 12 20
Lake Creek Trail 65 4 3 6
JY Winter Road 355 19 8 40
Levee Road 224 16 10 27
MWR @ Granite Gate 866 51 44 97
Granite Canyon Trailhead 370 26 23 31
* All values for all counters have been corrected for counter error using the weight value from Table 2.1

PAGE 23 OF 57
Counter summaries indicate that the majority of visitor use was confined to the Moose-Wilson Road. The JY Ranch Winter Road and the Granite Canyon Trail were the most visited “side trails” during the winter sampling period with an average weekend use level of 40 visitors counted per day and 31 visitors counted per day, respectively (Table 2.2 and Figures 2.1-2.2). The Levee Road and LSR Preserve Road also received moderate levels of total use during the winter sampling period (Table 2.2). However, the Woodland Trail and Lake Creek Trail had very low use levels with, on average, 6 visitors counted per day on the Woodland Trail and 4 visitors counted per day on the Lake Creek Trail (Table 2.2 and Figure 2.2). Phelps Lake was the most popular destination besides the road with the former JY Winter Road, providing a more direct route from the Granite Canyon Trailhead in winter than the Lake Creek or Woodland trails.
Figure 2.1: Total use levels (corrected with weight values) from all infrared trail counters placed in the Moose-Wilson Road corridor during the winter sampling period.
0 200 400 600 800
1000 1200
Cou
nt
Counter Location
Total Visitor Use Levels During the Winter Sampling Period

PAGE 24 OF 57
Figure 2.2: Average use levels (corrected with weight values) from all infrared trail counters placed in the Moose-Wilson Road corridor during the winter sampling period.
Figure 2.3: Left photo shows the orange cones and rope funneling visitors past the gate and towards the counter at the Granite Canyon Trailhead end of the Moose-Wilson Road. Right photo shows the white fence posts housing the
Granite Canyon Trail counter (photos by Jess Anderson).
0 20 40 60 80
100 120
Cou
nts
Counter Location
Average Visitor Use Levels During the Winter Sampling Period
Overall Average (visitors/day) Weekday Average (visitors/day)
Weekend Average (visitors/day)

PAGE 25 OF 57
3. VISITOR MOVEMENT PATTERNS AND USE DENSITY
GPS units were used to determine winter recreationists’ travel paths through the Moose-Wilson Road corridor during the winter sampling period. Winter recreationists were randomly intercepted at Granite Canyon Trailhead parking area or the Death Canyon Road junction/winter parking area and asked to carry GPS units with them during their visit to the Moose-Wilson Road corridor. The GPS units were returned to field technicians at the Granite Canyon Trailhead parking area, or the Death Canyon Road junction, or to drop boxes if technicians were gone for the day. No GPS units were lost during the winter sampling period. For each GPS-based visitor track, the total group size, user activity type, and the presence of dogs were also recorded. A total of 100 GPS-based tracks of winter recreationists were collected from January 25th through February 9th. The Granite Canyon Trailhead end of the Moose-Wilson Road saw higher overall visitor use than the Death Canyon Road junction and winter parking area, and therefore more GPS tracks were collected at the Granite end (Table 3.1). There was a very high acceptance rate of 100% at the Granite Canyon Trailhead parking area and 88% at the Death Canyon Road junction and winter parking area (Table 3.1). This high response rate indicates that a representative sample of winter recreationist tracks was collected during the two-week sampling period. Only 5 rejections were received during the winter sampling period, and all these rejections came from individual groups of backcountry skiers (Table 3.1). Despite the higher rejection rate from backcountry skiers, a total of 6 backcountry skier tracks were collected during the winter sampling period (Table 3.2). The average group size of GPS-tracked winter recreationists was 1.9 visitors per group at Death Canyon Road junction and winter parking area and 2.4 at the Granite Canyon Trailhead parking area.
Table 3.1: Summary of total GPS tracks collected at each sampling location in the Moose-Wilson Road corridor, acceptance and rejection rates, and average group size for the winter sampling period.
Location GPS-Tracks Total
Accept or Reject GPS Unit Average Group Size
(# of visitors) Accept Reject
Death Canyon Road Junction and Winter Parking Area
36 88% 12%* 1.9
Granite Canyon Trailhead Parking Area
64 100% 0% 2.4
*All rejects (5) from backcountry skiers groups on the same day of sampling

PAGE 26 OF 57
The majority of GPS-tracked visitors at both the Death Canyon Road junction and winter parking area and the Granite Canyon Trailhead parking area were cross-country skiers (Table 3.2). Almost a quarter of visitors who carried GPS units starting from the Death Canyon Road junction and winter parking area were backcountry skiers. Only one backcountry skier was given a GPS unit at the Granite Canyon Trailhead parking area (Table 3.2). Snowshoers made up between 10% and 17% of the GPS tracks collected (Table 3.2). A total of 9 GPS tracks were collected for individuals hiking or walking in the Moose-Wilson corridor during the winter sampling period (Table 3.2). At both sampling locations, Death Canyon Road junction and winter parking area and the Granite Canyon Trailhead parking area, a total of 4 dogs were observed with the winter recreationists that were given GPS units (Table 3.3). Calibration techniques (D’Antonio et al., 2010) were used to determine the amount of error associated with the GPS-based tracks of the winter recreationists. The overall error was calculated to be 3.4 meters. GPS-related error was lower at the Granite Canyon Trailhead parking area (2.4 meters) than at the Death Canyon Road junction and winter parking area (5.0 meters). Denser tree cover at the Death Canyon Road Junction and winter parking area is the likely cause of the difference observed in GPS-related error between the two sampling locations.
Table 3.2: Summary of the GPS-based winter recreationist tracks collected in the Moose-Wilson Road corridor by activity type during the winter sampling period.
Activity Type
Location Backcountry skiers
Cross-country skiers
Hikers/Walkers Snowshoers Other*
Death Canyon Road Junction/Winter Parking Area
23% 62% 5% 10% 0%
Granite Canyon Trailhead Parking Area
2% 70% 9% 17% 2%
Overall 6% 69% 9% 15% 1%
*Skateskier

PAGE 27 OF 57
Table 3.3: Total number of dogs observed at each GPS-tracking location in the Moose-Wilson Road corridor during the winter sampling period. Whether or not the dogs were leashed was also documented.
Trailhead Location Total Number of Dogs Death Canyon Road Junction/Winter Parking Area 4 (50% Leashed) Granite Canyon Trailhead Parking Area 4 (100% Leashed)
The GPS units that were carried by winter recreationists recorded the visitor’s locations every 15 seconds. These points were imported into a Geographic Information Systems (GIS) environment and used to display the extent and location of travel for each activity type. A density of the points can then be calculated to look for “hot spots” of recreation activity. A map showing all of the winter recreationist activity in the Moose-Wilson Road corridor indicates that relatively low use occurs throughout the corridor (Figure 3.2). The majority of use emanates from the Granite Canyon Trailhead end of the Moose-Wilson Road and a popular route of travel, shown in yellow on the density map, appears to be to travel from the Granite Canyon Trailhead and up to Phelps Lake via the former JY Ranch winter road (Figure 3.2). The JY Ranch no longer exists, but the former road to the ranch is still distinct, open, and gently graded and therefore used by winter recreationists.
Backcountry skier use was found to be mostly confined to the Death Canyon area of the Moose-Wilson Road corridor (Figure 3.3). Backcountry skier point density was low but did indicate a possible preferred area of terrain accessed via Death Canyon Road for the backcountry skiers tracked during the winter sampling period (Figure 3.4). Cross-country skier tracks were spread throughout the corridor in a very diffuse manner (indicated by no medium or high point densities) (Figure 3.4). Cross-country skiers used the Moose-Wilson Road itself, Death Canyon Road and nearby terrain, the LSR Preserve, terrain to the south of the LSR Preserve that hugs the Snake River, and the area around Phelps Lake for winter recreation (Figure 3.4). Snowshoer use was more confined, with snowshoers sticking mostly to the Moose-Wilson Road, Death Canyon Road, Granite Canyon Trail, and the loop from the JY Ranch winter road to the LSR Preserve summer road (Figure 3.5). Hikers/Walkers were the least dispersed of all winter recreation activities tracked. No hiker or walker tracked reached the middle of the Moose-Wilson Road or traveled up Death Canyon Road or to the LSR Preserve (Figure 3.6). Hiker/Walker destinations were Phelps Lake via a loop originating at the Death Canyon Road junction and winter parking area or a loop at the Granite Canyon Trailhead (Figure 3.6).

PAGE 28 OF 57
Figure 3.1: Photos showing winter recreationists carrying GPS units on their backpacks as they depart from the winter parking lots in the Moose-Wilson Road corridor. GPS units were labeled with bright orange tags (photos by
Jess Anderson).
Note about GPS-Tracking Density Maps: An individual density analysis was calculated, using the same parameters, for each figure below for the specific data shown in that figure. The low, medium, and high density categories were generated using natural breaks found in the GPS-tracking data. The fact that some of the maps do not show areas of medium or high use indicates that winter use is highly dispersed; visitors are not necessarily seeking out a specific destination, instead they may be seeking specific routes of travel. Winter recreation in the Moose-Wilson Corridor provides a variety of route options; the maps below help highlight which routes are more popular with each individual activity type.

PAGE 29 OF 57
Figure 3.2: Map of all recreationist GPS-based tracks collected during the winter sampling period (above) and density analysis of all recreationist GPS-based tracking points (below).

PAGE 30 OF 57
Figure 3.3: Map of backcountry skier GPS-based tracks collected during the winter sampling period (above) and density analysis of all backcountry skier GPS-based tracking points (below).

PAGE 31 OF 57
Figure 3.4: Map of cross-country skier GPS-based tracks collected during the winter sampling period (above) and density analysis of all cross-country skier GPS-based tracking points (below).

PAGE 32 OF 57
Figure 3.5: Map of snowshoer GPS-based tracks collected during the winter sampling period (above) and density analysis of snowshoer GPS-based tracking points (below).

PAGE 33 OF 57
Figure 3.6: Map of hiker/walker GPS-based tracks collected during the winter sampling period (above) and density analysis of hiker/walker GPS-based tracking points (below).

PAGE 34 OF 57
4. PARKING LOT ACCUMULATION
VEHICLE COUNTS
Parking lot accumulation counts occurred during the approximately two-week sampling period at the same time as GPS-tracking of winter recreationists. At the Granite Canyon Trailhead parking area, as well as the unpaved winter parking area and Death Canyon Road junction parking area, the number of vehicles parked was counted at the top of each hour. Designated lots were considered to be the Granite Canyon Trailhead summer parking lot area, the unpaved winter parking area just north of the Death Canyon Road junction, and within the actual intersection of the Moose-Wilson Road and Death Canyon Road. The winter parking area and the Death Canyon Road junction were combined into one designated parking area. Vehicles parked along the Moose-Wilson Road at either the Granite Canyon Trailhead end or the Death Canyon Road end were considered as being located in “overflow” parking areas. The presence of non-rental vehicles with WY-22 (Teton County) license plates (defined as “local use” for the purpose of this study) was also noted. At the Granite Canyon Trailhead parking lot, overall 64% of the parked vehicles had WY-22 license plates (Figure 4.2). While at the Death Canyon Road junction, overall 56% of the parked vehicles had WY-22 license plates (Figure 4.2).
Table 4.1: The percentage of vehicles observed in the designated parking lots with WY-22 license plates at the two winter parking locations in the Moose-Wilson Road corridor during the winter sampling period.
Parking Area Percent WY-22 Plates Observed Death Canyon Road Junction/Winter Parking 56% Granite Canyon Trailhead 64%

PAGE 35 OF 57
The Death Canyon Road junction and winter parking area had a greater capacity for vehicles in designated parking areas than the Granite Canyon Trailhead. The maximum number of vehicles observed at one time in designated parking locations at the Death Canyon Road junction and winter parking area was 21 vehicles (Table 4.2). At the Granite Canyon Trailhead parking lot, the maximum number of vehicles observed at one time was 11 vehicles. Compared to the Death Canyon Road junction and winter parking area, the Granite Canyon Trailhead parking area had a greater maximum number of vehicles observed in overflow parking areas (Table 4.2). During the approximately two-week sampling period, a maximum of 17 vehicles was observed in overflow parking at the Granite Canyon Trailhead and a maximum of 3 vehicles parked in overflow parking was observed at the Death Canyon Road junction and winter parking area. Each of these maximum counts was only seen once during the January 25th-February 9th winter sampling period and represent the most extreme conditions observed at each parking location.
Table 4.2: The maximum number of vehicles parked at one time in designated and overflow parking locations at the Death Canyon Road junction and Granite Canyon Trailhead ends of the Moose-Wilson Road for the winter sampling period.
Designated Parking Area Maximum Number of Vehicles Observed Death Canyon Road Junction/Winter Parking 21 Granite Canyon Trailhead 11 Overflow Parking Area Death Canyon Road Junction/Winter Parking 3 Granite Canyon Trailhead 17

PAGE 36 OF 57
Figure 4.1: Top photo shows the gravel “Winter Parking” area at the Death Canyon Road Junction (NPS photo by Jon Christensen). Bottom photo shows the designated parking lot at the Granite Canyon Trailhead (photo by Jess
Anderson).

PAGE 37 OF 57
On weekdays there were, on average, approximately 11 vehicles parked at the Death Canyon Road junction and winter parking area in designated parking locations and no vehicles parked in overflow parking areas (Table 4.3 and Figure 4.2). On weekends there were, on average, approximately 7 vehicles parked in designated parking locations at the Death Canyon Road junction and winter parking area and approximately 1 vehicle in overflow parking areas (Table 4.3 and Figure 4.2). The Granite Canyon Trailhead had, on average, fewer vehicles parked in designated parking areas but more vehicles parked in overflow parking areas compared to the Death Canyon Road junction and winter parking area. On weekdays, there were approximately 5 vehicles parked in the designated parking lot at the Granite Canyon Trailhead and approximately 2 vehicles parked in overflow areas (Table 4.3 and Figure 4.2). On weekend days, the Granite Canyon Trailhead designated and overflow parking areas contained almost an equal, average number of parked vehicles: 5 vehicles in the designated parking lot and 4 vehicles in overflow parking areas (Table 4.3 and Figure 4.2).
Table 4.3: Average number of vehicles parked in both designated and overflow parking areas at Granite Canyon Trailhead and Death Canyon Road junction and winter parking area during the winter sampling period. Averages are stratified by weekdays and weekends (± 1 standard deviation).
Average Number of Parked Vehicles Designated Parking Area Weekdays Weekends Death Canyon Road Junction/Winter Parking 10.7 (± 3.6) 7.4 (± 5.7) Granite Canyon Trailhead 4.7 (± 1.9) 4.6 (± 3.4) Overflow Parking Area Weekdays Weekends Death Canyon Road Junction/Winter Parking 0 0.5 (± 1.0) Granite Canyon Trailhead 1.4 (± 0.8) 4.1 (± 4.2)

PAGE 38 OF 57
Figure 4.2: Graphical representation of the average number of vehicles parked in both designated and overflow parking areas at Granite Canyon Trailhead and Death Canyon Road junction and winter parking area.
Counts of the number of vehicles observed in both the designated and overflow parking areas were conducted each hour at the Death Canyon Road junction and winter parking area, as well at the Granite Canyon Trailhead. The average number of vehicles that were parked at the Death Canyon Road junction and winter parking designated parking areas, by hour, varied from 1 to 12 vehicles (Table 4.4). Average peak use in the designated parking areas at the Death Canyon Road junction and winter parking areas occurred at 1:00pm (Figure 4.3). Very few vehicles parked in overflow parking at the Death Canyon Road junction and winter parking areas (Table 4.4 and Figure 4.4). On average, approximately 1 vehicle was parked in overflow parking areas, and overflow parking at the Death Canyon Road junction and winter parking was only observed after 1pm (Table 4.4 and Figure 4.4). The Granite Canyon Trailhead designated parking lot held, on average, between 1 and 7 vehicles across a day (Table 4.4). Compared to the Death Canyon Road junction and winter parking area, the Granite Canyon Trailhead had higher levels of overflow parking (Table 4.4 and Figure 4.4). Peak use at the Granite Canyon Trailhead for designated parking occurred around 1:00pm (Table 4.4 and Figure 4.2). Peak use in overflow parking areas at the Granite Canyon Trailhead occurred at approximately 2:00pm (Table 4.4 and Figure 4.4).
0
2
4
6
8
10
12
Death Canyon Desginated
Death Canyon Overflow
Granite Canyon Trailhead
Designated
Granite Canyon Trailhead Overflow
Aver
age
Vehi
cle
Cou
nt
Designated Parking Count During the Winter Sampling Periods: Weekday vs. Weekend Use
Weekday Weekend

PAGE 39 OF 57
Table 4.4: Average number of vehicles parked in both designated and overflow parking areas at Granite Canyon Trailhead and Death Canyon Road junction and winter parking area by hourly counts for the winter sampling period. Averages are shown with ± 1 standard deviation with the exception of values for which we only had one observation or when all observations were identical counts.
Hour of Day Designated Parking Area
7:00 AM
8:00 AM
9:00 AM
10:00 AM
11:00 AM
12:00 PM
1:00 PM
2:00 PM
3:00 PM
4:00 PM
5:00 PM
Death Canyon Road Junction/Winter Parking
1 3 ± 1.4
3.7 ± 0.6
6.7 ± 3.2
7.7 ± 4.5
11.2 ± 6.7
12.4 ± 6.9
11 ±4.4
9.8 ±3.3
7 ±3.0 8
Granite Canyon Trailhead N/A 0.5
± 0.7 1
± 0 4
± 2.8 6
± 0 6.2
± 2.2 7
± 2.2 6.6
±2.2 5.8
±2.5 3.3
±2.1 1
±0.8
Overflow Parking Area
7:00 AM
8:00 AM
9:00 AM
10:00 AM
11:00 AM
12:00 PM
1:00 PM
2:00 PM
3:00 PM
4:00 PM
5:00 PM
Death Canyon Road Junction/Winter Parking
0 0 0 0 0 0.6 ± 1.3
0.4 ± 0.9
0.5 ± 1
0.5 ± 1
0.7 ±1.1 1
Granite Canyon Trailhead 0 1 1 1.5
± 0.7 4.5
± 3.5 4.4
± 3.2 3.8
± 3.6 5
±6.8 4.5
±5.1 1.8
±0.9 1.3
±0.5

PAGE 40 OF 57
Figure 4.3: Graphical representation of the average number of vehicles parked in designated parking areas at Granite Canyon Trailhead and Death Canyon Road junction and winter parking area across an average day.
0
2
4
6
8
10
12
14
7:00 AM
8:00 AM
9:00 AM
10:00 AM
11:00 AM
12:00 PM
1:00 PM
2:00 PM
3:00 PM
4:00 PM
5:00 PM
Aver
age
Vehi
cle
Cou
nt
Average Number of Vehicles Parked Each Hour in Designated Lots During the Winter Sampling
Period
Death Canyon Road Junction Granite Canyon Trailhead

PAGE 41 OF 57
Figure 4.4: Graphical representation of the average number of vehicles parked in overflow parking areas at Granite Canyon Trailhead and Death Canyon Road junction and winter parking area across an average day.
Figure 4.5: Left photo shows vehicles parked in overflow parking at the Granite Canyon Trailhead (photo by Jess Anderson). Right photo shows vehicles parked in overflow parking at the Death Canyon Road junction (NPS photo by
Jon Christensen).
0
1
2
3
4
5
6
7:00 AM
8:00 AM
9:00 AM
10:00 AM
11:00 AM
12:00 PM
1:00 PM
2:00 PM
3:00 PM
4:00 PM
5:00 PM
Aver
age
Vehi
cle
Cou
nt
Average Number of Vehicles Parked Each Hour in Overflow Parking Areas During the Winter
Sampling Period
Death Canyon Road Junction Granite Canyon Trailhead

PAGE 42 OF 57
WINTER ACTIVITY TYPE COUNTS
While GPS-tracking of winter recreationists was taking place in the Death Canyon Road junction and winter parking area and in the Granite Canyon Trailhead parking area, counts of all visitors seen during each hour were recorded. In addition to number of people observed, the activity type of each recreationist was also noted. Dogs, both leashed and unleashed, were also counted. Finally, at the Granite Canyon Trailhead parking area, the number of winter recreationists that travel east from the parking area towards the Snake River was recorded. A counter was not placed in that direction, so observational counts were taken instead. Average counts for all recreation types recorded were calculated for daily use, weekday use, and weekend use.
At the Death Canyon Road junction and winter parking area, almost an equal number of backcountry and cross-country skiers was observed in the parking lot across the entire two-week sampling period (Table 4.5 and Figures 4.4 and 4.6). Weekday use was slightly higher for almost all activity types at the Death Canyon Road junction and winter parking area (Table 4.5 and Figure 4.8). Cross-country skiing was the overwhelming majority activity type observed at the Granite Canyon Trailhead parking area with, on average, 4 cross-country skiers observed per day (Table 4.6 and Figures 4.5 and 4.7). Weekend use was higher across most activity types at the Granite Canyon Trailhead parking area (Table 4.6 and Figure 4.9). Overall, a slightly lower level of use was observed in the Death Canyon Road junction and winter parking area compared to the Granite Canyon Trailhead parking area (Table 4.5 and Table 4.6). Compliance with the leashed dog rule was high at both the Death Canyon Road junction and winter parking area and at the Granite Canyon Trailhead parking area (Table 4.5 and Table 4.6).
Table 4.5: Summary of total counts of winter recreationists counted during parking lot accumulation data collection in the Death Canyon Road junction and winter parking area for the winter sampling period. Averages are shown with ± 1 standard deviation. Death Canyon Road Junction/Winter Parking
Total Count
Daily Average Count
Weekday Average Count
Weekend Average Count
Overall 153 4.78 (± 4.6) 5.09 (± 4.1) 4.62 (± 4.9) Backcountry Skiers 67 2.1 (± 3.0) 2.55 (± 2.9) 1.86 (± 3.2) Cross-Country Skiers 60 1.88 (± 2.5) 2.18 (± 2.7) 1.71 (± 2.4) Snowshoers 19 0.6 (± 1.2) 0.18 (± 0.6) 0.81 (± 1.4) Hikers/Walkers 8 0.25 (± 0.5) 0.18 (± 0.4) 0.29 (± 0.6) Skijoring 0 0 0 0 Skate skiers 0 0 0 0 Dogs Leashed 6 0.19 (± 0.5) 0.27 (± 0.6) 0.14 (± 0.5) Dogs Unleashed 1 0.03 (± 0.1) 0 0.05 (± 0.2)

PAGE 43 OF 57
Table 4.6: Summary of total counts of winter recreationists observed in the Granite Canyon Trailhead parking area during the winter sampling period. Averages are shown with ± 1 standard deviation. Granite Canyon Trailhead Parking Area
Total Count
Daily Average Count
Weekday Average Count
Weekend Average Count
Overall 208 6.5 (± 6.5) 5.45 (± 4.5) 7.05 (± 7.4) Backcountry Skiers 5 0.16 (± 0.6) 0.18 (± 0.6) 0.14 (± 0.6) Cross-Country Skiers 130 4.1 (± 4.3) 3.73 (± 3.7) 4.15 (± 4.6) Snowshoers 35 1.09 (± 1.9) 1.36 (± 2.2) 0.95 (± 1.9) Hikers/Walkers 32 1 (± 2.3) 0.18 (± 0.6) 1.4 (± 2.7) Skijoring 0 0 0 0 Skate skiers 2 0.06 (± 0.3) 0 0.1 (± 0.4) Traveling East* 20 4 (± 2.5) 2 (± 2.8) 5.33 (± 1.5) Dogs Leashed 9 0.28 (± 0.7) 0.09 (± 0.3) 0.38 (± 0.8) Dogs Unleashed 2 0.06 (± 0.2) 0 0.1 (± 0.8) *Individuals traveling east from the Granite Parking lot were also included in the activity type counts.
Figure 4.4: Graph of total counts of winter recreationists, by activity type, observed at the Death Canyon Road junction and winter parking area.
0
10
20
30
40
50
60
70
80
Total Count
Num
ber o
f Peo
ple
Obs
erve
d
Winter Activity Type: Total Counts at Death Canyon Road Junction and Winter Parking Area During the Winter
Sampling Period
Backcountry Skiers
Cross Country Skiers
Snowshoers
Hikes/Walkers
Dogs Leashed
Dogs Unleashed

PAGE 44 OF 57
Figure 4.5: Graph of total counts of winter recreationists, by activity type, observed at the Granite Canyon Trailhead parking area.
Snowshoers were a less frequently observed activity type at both parking areas (Figures 4.6 and 4.7). Snowshoers were more frequently observed at the Granite Canyon Trailhead parking area than at the Death Canyon Road junction and winter parking area (Tables 4.5 and 4.6). At the Death Canyon Road junction and winter parking area, snowshoers—as well as hikers and walkers—were most often observed on weekends (Table 4.5 and Figure 4.8). At the Granite Canyon Trailhead parking area, snowshoers were more frequently observed on weekdays (Table 4.6 and Figure 4.9). At the Death Canyon Road junction and winter parking area, no skate skiers or skijorers (skier pulled over snow by an animal) were observed during parking lot observational counts (Table 4.5). However, 2 skate skiers were observed at the Granite Canyon Trailhead parking area during the two-week winter sampling period (Table 4.6). The pair of skate skiers did not travel far once realizing that the Moose-Wilson Road was not groomed for skate skiing.
0
20
40
60
80
100
120
140
Total Count
Num
ber o
f Peo
ple
Obs
erve
d Winter Activity Type: Total Counts at Granite Canyon
Parking Area During the Winter Sampling Period
Backcountry Skiers
Cross Country Skiers
Snowshoers
Hikers/Walkers
Skate Skiers
Dogs Leashed
Dogs Unleashed

PAGE 45 OF 57
Figure 4.6: Percentage of total winter recreationists by activity type observed in the Death Canyon Road junction and winter parking area.
Figure 4.7: Percentage of total winter recreationists by activity type observed in the Granite Canyon parking area.
43%
39%
12%
5%
Percentage of Winter Activity Type Observed at Death Canyon Road Junction and Winter Parking
Area During the Winter Sampling Period
Backcountry Skiers
Cross-Country Skiers
Snowshoers
Hikers/Walkers
2%
63%
17%
15%
1%
Percentage of Winter Activity Type Observed at Granite Canyon Parking Area During the Winter
Sampling Period
Backcountry Skiers
Cross-Country Skiers
Snowshoers
Hikers/Walkers
Skate-Skiers

PAGE 46 OF 57
.
Figure 4.8: Average daily counts of winter recreationists, by activity type, observed at the Death Canyon Road junction and winter parking area.
Figure 4.9: Average daily counts of winter recreationists, by activity type, observed at the Death Canyon Road junction and winter parking area.
0
0.5
1
1.5
2
2.5
3
Daily Average Count
Weekday Average Count
Weekend Average Count
Aver
age
Cou
nt
Winter Activity Type: Average Counts at Death Canyon Road Junction and Winter Parking Area During the Winter
Sampling Period
Backcountry Skiers
Cross-Country Skiers
Snowshoers
Hikers/Walkers
Dogs Leashed
Dogs Unleashed
0 0.5
1 1.5
2 2.5
3 3.5
4 4.5
Daily Average Count
Weekday Average Count
Weekend Average Count
Aver
age
Cou
nt
Winter Activity Type: Average Counts at Granite Canyon Trailhead Parking Area During the Winter Sampling Period
Backcountry Skiers
Cross-Country Skiers
Snowshoers
Hikers/Walkers
Skate-Skiers
Dogs Leashed
Dogs Unleashed

PAGE 47 OF 57
Most use at the Death Canyon Road junction and winter parking area occurred between 9:00am and 1:00pm (Tables 4.7 and 4.9 and Figure 4.10). Backcountry skier use of the Death Canyon Road junction and winter parking area peaked between 9:00am and 10:00am and then again at 1:00pm (Figures 4.10 and 4.12). Most cross-country skier use at the Death Canyon Road Junction and winter parking area occurred at midday between 11:00am and 2:00pm (Table 4.7 and Figures 4.10 and 4.12). Most other winter recreation activity, such as snowshoeing and hiking/walking, occurred during midday as well (Tables 4.7 and 4.9). At the Granite Canyon Trailhead parking area, 1:00pm was the busiest time of the day (Tables 4.8 and 4.10 and Figure 4.11). Most of the cross-country skier use was observed between 9:00am and 2:00pm with a peak at 1:00pm (Table 4.8 and Figures 4.11 and 4.13). As was observed at the Death Canyon Road junction and winter parking area, use by snowshoers and hikers/walkers was most frequently observed at midday at the Granite Canyon Trailhead parking area (Table 4.8 and Figures 4.11 and 4.13).
Table 4.7: Summary of total hourly counts of winter recreationists observed in the Death Canyon Road junction and winter parking area for the winter sampling period.
Death Canyon Road Junction/Winter Parking
Total Winter Activity Counts
Count Back-
country Skiers
Cross-Country Skiers
Snow-shoers
Hikers/Walkers
Dogs Leashed
Dogs Unleashed
7:00 AM 0 0 0 0 0 0 0 8:00 AM 3 0 0 3 0 0 0 9:00 AM 13 11 2 0 0 0 0 10:00 AM 15 10 2 2 1 2 0 11:00 AM 17 1 14 0 2 0 1 12:00 PM 29 6 17 3 3 2 0 1:00 PM 44 20 12 9 2 1 0 2:00 PM 20 9 11 2 0 0 0 3:00 PM 7 5 2 0 0 1 0 4:00 PM 5 5 0 0 0 0 0

PAGE 48 OF 57
Table 4.8: Summary of total hourly counts of winter recreationists observed in the Granite Canyon Trailhead parking area for the winter sampling period.
Granite Canyon Trailhead Parking
Total Winter Activities
Count Back-
country Skiers
Cross-Country Skiers
Snow-shoers
Hikers/Walkers
Skate Ski
Dogs Leashed
Dogs Unleashed
8:00 AM 7 3 0 4 0 0 0 0 9:00 AM 11 0 5 3 3 0 0 0 10:00 AM 28 0 14 6 8 0 0 1 11:00 AM 10 0 10 0 0 0 1 0 12:00 PM 44 0 26 9 9 0 1 1 1:00 PM 60 0 46 6 5 0 3 0 2:00 PM 34 2 23 1 6 2 1 0 3:00 PM 9 0 3 6 0 0 0 0 4:00 PM 3 0 3 0 0 0 1 0 5:00 PM 2 0 0 0 1 0 2 0
Table 4.9: Summary of average hourly counts of winter recreationists observed in the Death Canyon Road junction and winter parking area during the winter sampling period. Averages are shown ± 1 standard deviation.
Death Canyon Road Junction/Winter Parking
Average Winter Activity Counts
Count Back-
country Skiers
Cross-Country Skiers
Snow-shoers
Hikers/Walkers
Dogs Leashed
Dogs Unleashed
7:00 AM 0 0 0 0 0 0 0
8:00 AM 1.5 ± 2.1 0 0 1.5
± 2.1 0 0 0
9:00 AM 4.33 ± 4.5
3.67 ± 3.5
0.67 ± 1.1 0 0 0 0
10:00 AM 5 ± 2.6
3.33 ± 1.5
0.67 ± 1.1
0.67 ± 1.1
0.33 ± 0.5
0.67 ± 1.5 0
11:00 AM 5.67 ± 5.0
0.33 ± 0.5
4.67 ± 4.0 0 0.67
± 0.5 0 0.33 ± 0.6
12:00 PM 5.8 ± 5.9
1.2 ± 1.6
3.4 ± 3.7
0.6 ± 1.3
0.6 ± 0.8
0.4 ± 0.9 0
1:00 PM 8.8 ± 6.6
4 ± 5.8
2.4 ± 1.8
1.8 ± 2.0
0.4 ± 0.8
0.2 ± 0.4 0
2:00 PM 5 ± 3.1
2.25 ± 2.6
2.75 ± 1.9
0.5 ± 1 0 0 0
3:00 PM 2.33 ± 2.3
1.67 ± 2.8
0.67 ± 0.6 0 0 0.33
± 0.6 0
4:00 PM 1.67 ± 2.8
1.67 ± 2.8 0 0 0 0 0

PAGE 49 OF 57
Table 4.10: Summary of average hourly counts of winter recreationists observed in the Granite Canyon Trailhead parking area during the winter sampling period. Averages are shown ± 1 standard deviation.
Granite Canyon Trailhead Parking
Average Winter Activity Counts
Count Back-
country Skiers
Cross-Country Skiers
Snow-shoers
Hikers/Walkers
Skate Skiers
Dogs Leashed
Dogs Unleashed
8:00 AM 3.5 ± 0.7
1.5 ± 2.2 0 2
± 2.8 0 0 0 0
9:00 AM 5.5 ± 6.3 0 2.5
± 2.1 1.5 ± 2.1
1.5 ± 2.1 0 0 0
10:00 AM 14 ± 4.2 0 7
± 5.6 3
± 4.3 4
± 5.6 0 0 0.5 ± 07
11:00 AM 5 ± 0 0 5
± 0 0 0 0 0.5 ± 0.7 0
12:00 PM 8.8 ± 6.1 0 5.2
± 2.7 1.8
± 2.4 1.8
± 4.0 0 0.2 ± 0.4
0.2 ± 0.4
1:00 PM 12 ± 9.5 0 9.2
± 5.3 1.2
± 1.8 1
± 2.2 0 0.6 ± 1.3 0
2:00 PM 8.5 ± 6.4
0.5 ± 1
5.75 ± 4.4
0.25 ± 0.5
1.5 ± 1.9
0.5 ± 1
0.25 ± 0.5 0
3:00 PM 2.25 ± 3.2 0 0.75
± 0.5 1.5 ± 3 0 0 0 0
4:00 PM 0.75 ± 0.9 0 0.75
± 0.9 0 0 0 0.25 ± 0.5 0
5:00 PM 1 ± 1.4 0 0 0 0.5
± 0.7 0 1 ± 1.4 0

PAGE 50 OF 57
Figure 4.10: Summary of total hourly counts of winter recreationists, by activity type, observed in the Death Canyon Road junction and winter parking area.
Figure 4.11: Summary of total hourly counts of winter recreationists, by activity type, observed in the Granite Canyon Trailhead parking area.
0
5
10
15
20
25
Tota
l Cou
nt
Winter Activity Type: Total Counts at Death Canyon Road Junction and Winter Parking Area by Hour During the Winter Sampling Period
Backcountry Skiers
Cross Country Skiers
Snowshoers
Hikers/Walkers
Dogs Leashed
Dogs Unleashed
0 5
10 15 20 25 30 35 40 45 50
8:00 AM
9:00 AM
10:00 AM
11:00 AM
12:00 PM
1:00 PM
2:00 PM
3:00 PM
4:00 PM
5:00 PM
Tota
l Cou
nt
Winter Activity Type: Total Counts at Granite Canyon Trailhead Parking Area by Hour During the Winter Sampling Period
Backcountry Skiers
Cross Country Skiers
Snowshoers
Hikers/Walkers
Skate Skiers
Dogs Leashed
Dogs Unleashed

PAGE 51 OF 57
Figure 4.12: Summary of average hourly counts of winter recreationists, by activity type, observed in the Death Canyon Road junction and winter parking area.
Figure 4.13: Summary of average hourly counts of winter recreationists, by activity type, observed in the Granite Canyon Trailhead parking area.
0 0.5
1 1.5
2 2.5
3 3.5
4 4.5
5
Aver
age
Cou
nt
Winter Activity Type: Average Counts at Death Canyon Road Junction and Winter Parking Area by Hour During the Winter Sampling Period
Backcountry Skiers
Cross Country Skiers
Snowshoers
Hikers/Walkers
Dogs Leashed
Dogs Unleashed
0 1 2 3 4 5 6 7 8 9
10
Aver
age
Cou
nt
Winter Activity Type: Average Counts at Granite Canyon Trailhead Parking Area by Hour During the Winter Sampling Period
Backcountry Skiers
Cross Country Skiers
Snowshoers
Hikers/Walkers
Skate Skiers
Dogs Leashed
Dogs Unleashed

PAGE 52 OF 57
5. PHOTO DOCUMENTATION OF ACTIVITY
During the two-week winter data collection period, motion-activated cameras were set up in combination with infrared trail counters in order to determine the proportion of various winter activity types in the Moose-Wilson corridor. Overall, cross-country skiing was the most frequently captured winter activity in the corridor, followed by backcountry skiing (Table 5.1 and Figure 5.2). Cross-country skiers were observed at all camera locations. The Death Canyon Road was the most popular location for backcountry skiers. Backcountry skiers were not observed at cameras placed at the LSR Preserve, Woodland Trail, JY Ranch winter road, or the levee road (Table 5.1). More cross-country skiers were observed on the Moose-Wilson Road (most starting at the Granite Canyon Trailhead end) than on the Death Canyon Road. Snowshoeing was the third most observed activity in the Moose-Wilson corridor; most of the snowshoers observed were seen on the Granite Canyon Trail (Table 5.1 and Figure 5.2). Snowshoers were observed at all camera locations. Hikers were the least observed group in the Moose-Wilson Road corridor during the winter; hiking was only observed on the Death Canyon Road, Granite Canyon Trail, and both winter gates (Table 5.1 and Figure 5.2). The majority of use observed on the Moose-Wilson Road appeared to stay confined to the Moose-Wilson Road with few winter recreationists using side roads and trails. However, the JY Ranch winter road was a popular destination for cross-country skiers (Table 5.1 and Figure 5.2). Dogs have recently been allowed on the Moose-Wilson Road on a trial basis, including and recreationists were instructed to keep their dogs leashed at all times. The motion-activated cameras captured 50 dogs in the Moose-Wilson Corridor; 34% of those dogs were unleashed (Table 5.1), and 8 dogs were observed on side trails off of the Moose-Wilson Road (the levee road and Granite Canyon Trailhead). The motion-activated cameras also captured the presence of various species of wildlife that were using the winter recreation trails as travel corridors. These species included fox, wolves, and moose.
Figure 5.1: Left Photo shows backcountry skiers leaving the Death Canyon Road. Right photo shows cross-country
skiers entering the Moose-Wilson Road, covered in new snow, from the Granite Canyon Trailhead gate end. (All photos taken by motion-activated camera).

PAGE 53 OF 57
Table 5.1: Total counts of various winter recreational activities occurring in the Moose-Wilson Road corridor during the winter sampling period. Counts were determined by manually examining all photos taken with the motion-activated cameras.
Camera Location
Back-country Skiers
Cross-Country Skiers
Snow-shoers
Hikers/Walkers Other
Dog (Leashed/ Unleashed) Wildlife
Death Canyon Road 493 122 46 12 0 4 (Leashed) 1 fox
7 wolves Moose-Wilson Road at Death Canyon Gate
10 166 45 5 4 dog walkers
11 (Leashed) 6 (Unleashed)
4 foxes 2 wolves
LSR Preserve 0 59 5 0 0 0 5 foxes 1 wolf
Woodland Trail on Phelps Lake Side
0 19 12 0 0 0 2 foxes 1 moose
Levee Road 0 71 3 0 0 4 (Leashed) 4 foxes
JY Ranch Winter Road 0 158 24 0 0 0 0
Moose-Wilson Road at Granite Canyon Gate
26 277 59 20 2 skijorers
14 (Leashed) 7 (Unleashed) 0
Granite Canyon Trailhead
38 68 161 47 6
mini-snowboards
4 (Unleashed) 2 foxes
Total 567 940 355 84 12 33 (Leashed) 17 (Unleashed)
18 foxes 10 wolves 1 moose

PAGE 54 OF 57
Figure 5.2: Graph of counts of most popular winter recreation activities captured with motion-activated cameras in the Moose-Wilson Road corridor during the winter sampling period.

PAGE 55 OF 57
SUMMARY OF FINDINGS
§ Vehicle TRAFx counters, infrared counters, and observational counts of vehicles and recreationists all indicate that the Granite Canyon Trailhead parking area is the more popular winter recreation destination in the Moose-Wilson Road corridor when compared to the Death Canyon Road junction and winter parking area.
o The Granite Canyon end of the Moose-Wilson Road saw a total of 1347 vehicles counted by the TRAFx counters compared to the 805 vehicles counted at the Death Canyon Road junction and winter parking area during the approximately two-week winter sampling period. This total level of vehicle use at the Granite Canyon Trailhead end of the Moose-Wilson Road averages to 115 vehicles per day.
o The infrared counter placed on the Death Canyon Road end of the Moose-Wilson Road was the most frequently passed counter by winter recreationists, with an average of 57 visitors passing the counter per day during the winter sampling period. The next most frequently passed counter was the one placed on the gate at the Granite Canyon Trailhead end of the Moose-Wilson Road, with an average of 51 winter recreationists passing the counter per day.
§ Vehicle TRAFx counters, infrared counters, and observational counts of vehicles and
recreationists all indicate that weekend use is slightly higher than weekday use at both the Granite Canyon Trailhead end of the Moose-Wilson Road and the Death Canyon Road junction and winter parking area.
§ The busiest times of the day for winter recreation in the Moose-Wilson corridor is late morning to midday.
o Use begins to increase more quickly at the Death Canyon Road junction and winter parking area, with highest levels of use being observed between 9:00am and 1:00pm. Vehicle use, as counted by the TRAFx counters, does not appear to drop off until approximately 3:00pm on the Death Canyon Road junction end of the Moose-Wilson Road.
o At the Granite Canyon Trailhead parking area, winter recreation use is its busiest between 10:00am and 2:00pm, with vehicle use on the Moose-Wilson Road beginning to drop off at 4:00pm.
o The designated parking lots at each end of the Moose-Wilson Road reached their peak
level of use at approximately 1:00pm each day. The Granite Canyon Trailhead parking area experiences higher levels of overflow parking than the Death Canyon Road junction and winter parking area, especially on weekends.

PAGE 56 OF 57
§ Overall, the most popular winter activities in the Moose-Wilson Road corridor are, in order of frequency of observations, cross-country skiing, backcountry skiing, snowshoeing, and hiking/walking. However, cross-country skiers and backcountry skiers combined made up more than 75% of all winter recreationists counted, GPS-tracked, observed manually, or with motion-activated cameras.
o Granite Canyon Trailhead parking area was the more popular starting point for cross-country skiers and, based on GPS-tracking, cross-country skiers dispersed more throughout the Moose-Wilson Road corridor. Use by other activity types, such as snowshoeing and hiking/walking, was more confined to the Moose-Wilson Road, Granite Canyon Trail, or the Phelps Lake shore area.
o Use at the Death Canyon Road junction and winter parking area was dominated by backcountry skiers, who accessed the backcountry via Death Canyon Road. Of the 567 winter recreationists observed with motion-activated cameras using Death Canyon Road, 500 of them were backcountry skiers.
§ With the exception of backcountry skiers, who dispersed via Death Canyon Road, most winter
recreational activity was confined to the Moose-Wilson Road. Infrared counters indicate that use on “side trails” such as the LSR Preserve saw relatively low use during the winter sampling period. The most important side trail for winter recreation was the JY Ranch winter road which was used very frequently by cross-country skiers.
§ Observations of the presence of dogs in the Moose-Wilson Road corridor during the winter sampling period, both manually and with motion-activated cameras, indicate that about 2/3 of winter visitors are keeping their dogs on-leash while recreating.
ACKNOWLEDGEMENTS
The authors thank the National Park Service for their financial support of this research effort and the staff of Grand Teton National Park for logistical support and advice. We also thank Annie Weiler, Jessica Anderson, Abby Kidd, and Dan Blair for their dedication to the project during the many hours of field work. Dr. Robert Manning, University of Vermont, graciously donated his time to conduct a peer-review of this report.

PAGE 57 OF 57
APPENDICES
§ Appendix A: Summary of Results from Additional Infrared Counters
REFERENCES
Conlon, K. (2014). Investigating the Relationship between Trail Conditions and Visitor Behavior Using the Camera Trap Method. Thesis. North Carolina State Univeristy. D'Antonio, A., Monz, C., Lawson, S., Newman, P., Pettebone, D., Courtemanch, A. (2011). GPS-based measurements of backcountry visitors in parks and protected areas: Examples of methods and applications from three case studies. Journal of Park and Recreation Administration, 28(3), 42-60.
Hallo, J.C., Beeco, J.A., Goetcheus, C., McGee, J., McGehee, N.G., Norman, W.C. (2012). GPS as a method for assessing spatial and temporal use distributions of nature-based tourists. Journal of Travel Research, 51(5), 591-606.
Hunt, L.M., Hosegood, S. (2008). The effectiveness of signs at restricting vehicle traffic: A case of seasonal road closures on forest access roads. Canadian Journal of Forest Research, 38(8), 2306-2312.
Lawson, S., Manning, R., Valliere, W., Wang, B. (2003). Proactive monitoring and adaptive management of social carrying capacity in Arches National Park: An application of computer simulation modeling. Journal of Environmental Management, 68, 305-313.
Monz, C., D’Antonio, A., Heaslip, K. (2014). Moose-Wilson Corridor Use Levels, Types, Patterns and Impacts in Grand Teton National Park: Technical Report - Summer/Fall 2013.
Pettebone, D., Newman, P., Lawson, S. (2010) Estimating visitor use at attraction sites and trailheads in Yosemite National Park using automated visitor counters. Landscape and Urban Planning, 97, 229-238.
Reconyx, Inc. (2014).
TRAFx Research Ltd. (2014). TRAFx Products: Vehicle Counters. Retrieved from: http://www.trafx.net/products.htm#vehicle-counter, 3 June 2014.
TrailMaster. (2014). TrailMaster Trail Monitors. Retrieved from: http://www.trailmaster.com/index.php, 3 June, 2014
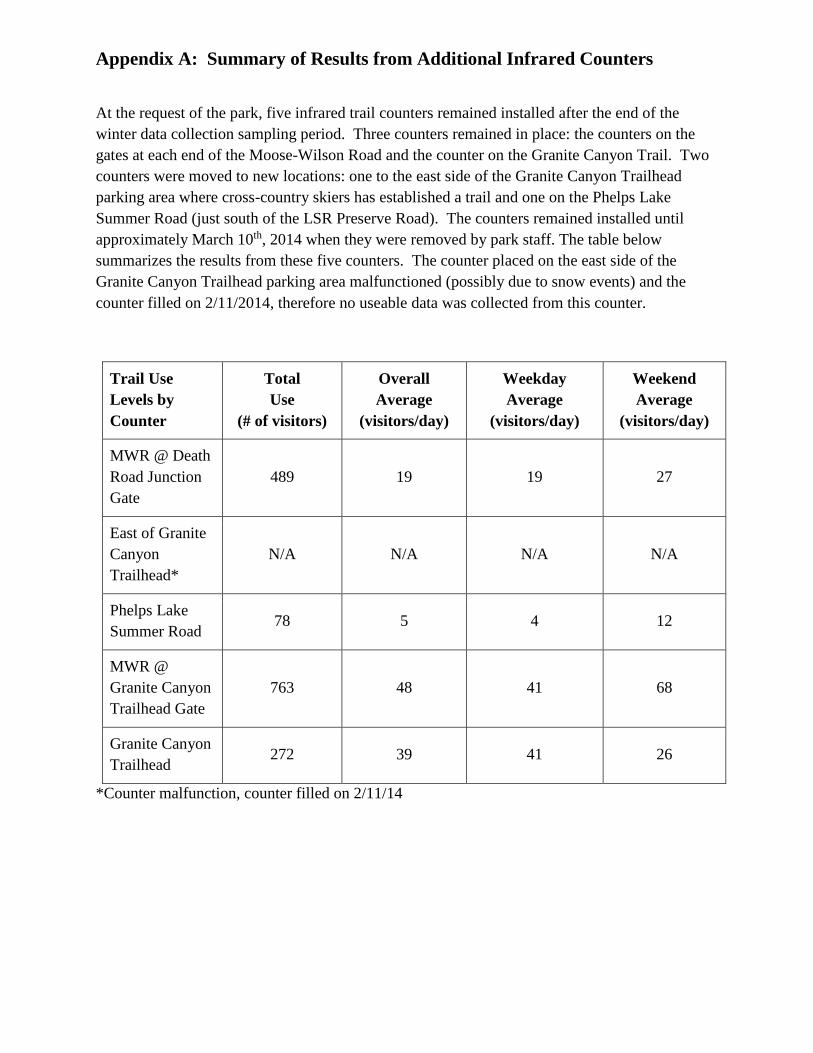
Appendix A: Summary of Results from Additional Infrared Counters
At the request of the park, five infrared trail counters remained installed after the end of the
winter data collection sampling period. Three counters remained in place: the counters on the
gates at each end of the Moose-Wilson Road and the counter on the Granite Canyon Trail. Two
counters were moved to new locations: one to the east side of the Granite Canyon Trailhead
parking area where cross-country skiers has established a trail and one on the Phelps Lake
Summer Road (just south of the LSR Preserve Road). The counters remained installed until
approximately March 10th, 2014 when they were removed by park staff. The table below
summarizes the results from these five counters. The counter placed on the east side of the
Granite Canyon Trailhead parking area malfunctioned (possibly due to snow events) and the
counter filled on 2/11/2014, therefore no useable data was collected from this counter.
Trail Use
Levels by
Counter
Total
Use
(# of visitors)
Overall
Average
(visitors/day)
Weekday
Average
(visitors/day)
Weekend
Average
(visitors/day)
MWR @ Death
Road Junction
Gate
489 19 19 27
East of Granite
Canyon
Trailhead*
N/A N/A N/A N/A
Phelps Lake
Summer Road 78 5 4 12
MWR @
Granite Canyon
Trailhead Gate
763 48 41 68
Granite Canyon
Trailhead 272 39 41 26
*Counter malfunction, counter filled on 2/11/14