Embed Size (px)
Citation preview

Monthly Investment Update May 2017

IndexGROUP FUNDS
Group Asset Allocation Fund . . . . . . . . . . . . . . . . . . . . . . . . . . . . . . . . . . . . . . . . . . . . . . . . . . . . . . . . . . . . . 1Group Equity Index Fund . . . . . . . . . . . . . . . . . . . . . . . . . . . . . . . . . . . . . . . . . . . . . . . . . . . . . . . . . . . . . . . . 2Group Debt Fund . . . . . . . . . . . . . . . . . . . . . . . . . . . . . . . . . . . . . . . . . . . . . . . . . . . . . . . . . . . . . . . . . . . . . . 3Group Liquid Fund . . . . . . . . . . . . . . . . . . . . . . . . . . . . . . . . . . . . . . . . . . . . . . . . . . . . . . . . . . . . . . . . . . . . . 4Group Short Term Debt Fund . . . . . . . . . . . . . . . . . . . . . . . . . . . . . . . . . . . . . . . . . . . . . . . . . . . . . . . . . . . . 5Stable Fund . . . . . . . . . . . . . . . . . . . . . . . . . . . . . . . . . . . . . . . . . . . . . . . . . . . . . . . . . . . . . . . . . . . . . . . . . . . 6Secure Fund . . . . . . . . . . . . . . . . . . . . . . . . . . . . . . . . . . . . . . . . . . . . . . . . . . . . . . . . . . . . . . . . . . . . . . . . . . 8Accelerated Fund . . . . . . . . . . . . . . . . . . . . . . . . . . . . . . . . . . . . . . . . . . . . . . . . . . . . . . . . . . . . . . . . . . . . . . 9Group Blue Chip Fund . . . . . . . . . . . . . . . . . . . . . . . . . . . . . . . . . . . . . . . . . . . . . . . . . . . . . . . . . . . . . . . . . 10Group Equity Fund . . . . . . . . . . . . . . . . . . . . . . . . . . . . . . . . . . . . . . . . . . . . . . . . . . . . . . . . . . . . . . . . . . . . 11Group Growth Fund- II . . . . . . . . . . . . . . . . . . . . . . . . . . . . . . . . . . . . . . . . . . . . . . . . . . . . . . . . . . . . . . . . . 12Group Return Shield Fund . . . . . . . . . . . . . . . . . . . . . . . . . . . . . . . . . . . . . . . . . . . . . . . . . . . . . . . . . . . . . . 13Group Short Term Debt Fund- II . . . . . . . . . . . . . . . . . . . . . . . . . . . . . . . . . . . . . . . . . . . . . . . . . . . . . . . . . 14Group Debt Fund-II . . . . . . . . . . . . . . . . . . . . . . . . . . . . . . . . . . . . . . . . . . . . . . . . . . . . . . . . . . . . . . . . . . . . 15Group Short Term Debt Fund-III . . . . . . . . . . . . . . . . . . . . . . . . . . . . . . . . . . . . . . . . . . . . . . . . . . . . . . . . . 16Group Liquid Fund-II. . . . . . . . . . . . . . . . . . . . . . . . . . . . . . . . . . . . . . . . . . . . . . . . . . . . . . . . . . . . . . . . . . . 17Group Debt Fund-III . . . . . . . . . . . . . . . . . . . . . . . . . . . . . . . . . . . . . . . . . . . . . . . . . . . . . . . . . . . . . . . . . . . 18Group Balanced Gain Fund . . . . . . . . . . . . . . . . . . . . . . . . . . . . . . . . . . . . . . . . . . . . . . . . . . . . . . . . . . . . . 19Group Balanced Gain Fund II . . . . . . . . . . . . . . . . . . . . . . . . . . . . . . . . . . . . . . . . . . . . . . . . . . . . . . . . . . . . 20

Bajaj Allianz Life Insurance Company LtdBajaj Allianz Life Insurance Company Ltd
Asset ClassAsset
AllocationCashFund
DebtFunds Hybrid Funds
IndexFunds
Equity
Type FUND NAMES SFIN Code 1 Month 2 Year3 month 3 Year6 month 5 Year1 Year
Absolute Return CAGR Return
Returns sinceInception CAGR
Inception Date
Equity Shares 62.25% 13.78% 99.87% 64.94%0.00% 0.00%
Money Market Instruments 7.23% 93.08% 3.92% 9.10% 0.13% 7.38%
Fixed Deposits 6.92% 1.40% 8.27% 5.48%0.00% 0.00%
Non Convertible Debentures 6.60% 29.84% 19.40% 4.50%0.00% 0.00%
Govt Securities 23.92% 64.84% 49.44% 12.53%0.00% 0.00%
Equity ETF 5.16%0.00% 0.00% 0.00% 0.00% 0.00%
Grand Total 100% 100% 100% 100% 100% 100%
Fund Performance Summary
AS
SE
T P
RO
FIL
EFU
ND
PE
RFO
RM
AN
CE
SU
MM
AR
Y
CRISIL Balanced Fund - Aggressive Index
CRISIL Balanced Fund - Aggressive Index
Asset Allocation Group Asset Allocation Fund ULGF00926/02/10GRASSALLOC116 1.77% 5.11% 9.63% 15.72% 8.06% 12.77% 14.45% 12.52% 25-Feb-10
2.69% 6.36% 11.14% 15.61% 8.11% 10.46% 12.85%
Cash Fund Group Liquid Fund ULGF00503/11/08GRLIQUFUND116 0.54% 1.52% 3.18% 7.12% 7.61% 7.89% 8.32% 8.89% 01-Nov-08
Cash Fund Group Liquid Fund II ULGF02124/06/13GRLIQUFU02116 0.52% 1.46% 3.05% 7.04% 7.60% 7.91% - 6.70% 13-Sep-13
Crisil Liquid Fund Index 0.59% 1.65% 3.23% 6.96% 7.43% 7.89% 8.28%
Debt Funds Group Debt Fund ULGF00426/03/08GRDEBTFUND116 1.25% 2.27% -0.64% 11.02% 9.74% 10.82% 9.79% 9.84% 26-Mar-08
Debt Funds Group Debt Fund II ULGF01924/06/13GRDEBTFU02116 1.35% 2.36% -0.77% 10.91% 9.33% 10.68% - 10.31% 13-Sep-13
Debt Funds Group Debt Fund III ULGF02202/03/15GRDEBTFU03116 1.48% 2.83% 0.58% - - - - 8.16% 29-Sep-16
Crisil Composite Bond Fund Index 1.34% 2.69% 0.88% 10.95% 9.90% 10.67% 9.42%
Debt Funds Group Short Term Debt Fund ULGF00628/02/09GRSHTRMDEB116 1.02% 1.42% 1.80% 7.63% 7.63% 8.18% 8.08% 7.92% 11-Mar-09
Debt Funds Group Short Term Debt Fund II ULGF01218/04/11GRSHTRDE02116 0.43% 1.16% 2.35% 11.03% 9.58% 9.93% 8.66% 8.33% 21-Jun-11
Debt Funds Group Short Term Debt Fund III ULGF02024/06/13GRSHTRDE03116 0.83% 1.48% 2.50% 7.35% 7.87% 8.78% - 8.10% 13-Sep-13
CRISIL Short Term Bond Fund Index 0.80% 1.92% 2.59% 8.82% 8.69% 9.07% 9.08%
Equity Group Equity Fund ULGF01018/04/11GREQTYFUND116 2.34% 8.74% 17.67% 21.42% 9.51% 15.36% 17.88% 14.22% 21-Jun-11
Equity Group Blue Chip Fund ULGF01118/04/11GRBLUECHIP116 3.08% 7.21% 15.20% 16.34% 6.53% 9.13% 13.63% 9.95% 21-Jun-11
Equity Group Growth Fund II ULGF01311/05/11GRGROWFU02116 1.12% 2.05% 1.34% 5.57% 6.23% 6.95% 7.61% 7.48% 11-May-11
Nifty 50 Index 3.41% 8.35% 16.98% 17.91% 6.78% 9.97% 14.33%
Hybrid Funds Group Balanced Gain Fund ULGF01810/05/13GRBALCEDGA116 0.62% 4.28% 9.73% 13.96% 8.46% 10.54% - 10.29% 25-Mar-14
Hybrid Funds Group Balanced Gain Fund II ULGF02402/03/15GRBALCGA02116 0.83% - - - - - - 9.23% 26-Apr-17
2.69% 6.36% 11.14% 15.61% 8.11% 10.46% 12.85%
Index Group Equity Index Fund ULGF00822/02/10GREQTYINDX116 3.14% 6.95% 14.99% 16.06% 6.33% 8.95% 13.72% 8.17% 19-Feb-10
Nifty 50 Index 3.41% 8.35% 16.98% 17.91% 6.78% 9.97% 14.33%
Hybrid Funds Accelerated Fund ULGF00318/11/04ACCELEFUND116 1.37% 5.75% 7.56% 12.20% 8.06% 10.52% 12.43% 13.00% 18-Nov-04
Hybrid Funds Secure Fund ULGF00215/10/04SECUREFUND116 1.20% 3.64% 4.15% 12.58% 9.93% 11.06% 11.50% 9.96% 15-Oct-04
Hybrid Funds Stable Fund ULGF00115/09/04STABLEFUND116 1.15% 5.00% 5.82% 14.20% 10.32% 12.04% 13.69% 10.91% 31-Oct-04
Hybrid Funds Group Return Shield Fund ULGF01421/06/11RETNSHIELD116 0.55% 2.09% 2.89% 10.05% 8.41% 9.74% 9.69% 9.20% 21-Jun-11
Benchmark - - - - - - - - - -

Fund Objective
Portfolio Allocation
To realize a level of total income, including current income and capital appreciation, which is consistent with reasonable investment risk. The investment strategy will involve a flexible policy for allocating assets among equities, bonds and cash. The fund strategy will be to adjust the mix between these asset classes to capitalize on the changing financial markets and economic conditions.
Group Asset Allocation Fund
May 2017
Actual (%) Stated (%)
Govt. and Govt. approved Securities 0 - 50
Corporate bonds rated AA or above by Crisil* 0 - 50
Money market and other liquid assets 0 - 40
Infrastructure sector as defined by the IRDA 0 - 40
Listed equities 0 - 100
#Net Current Assets
Total #Net current asset represents net of receivables and payables for investments held.*Including instruments rated by Other Rating agencies.
Equity 61.39%
HDFC Bank Limited Financial and Insurance Activities 3.76%
ITC Limited Manufacture of Tobacco Products 3.70%
Larsen & Toubro Limited Civil Engineering (Infra) 3.12%
Reliance Industries Limited Manufacture of Coke and Refined Petroleum Products 3.02%
Housing Development Finance Corporation Limited Financial and Insurance Activities 3.02%
Tata Motors Limited Manufacture of Motor Vehicles, Trailers and Semi-Trailers 2.82%
Hindalco Industries Limited Manufacture of Basic Metals 2.66%
ICICI Bank Limited Financial and Insurance Activities 2.64%
Yes Bank Limited Financial and Insurance Activities 2.59%
MphasiS Limited Computer Programming, Consultancy and Related Activities 2.49%
Others 31.57%
Corporate Bond 6.51%
7.83% LIC Housing Finance Ltd NCD (MD 25/09/2026) (Put Date 26/11/2020) AAA 3.02%
10.63 IOT NCD Series IV-STRIP-6 (MD 20/09/2028) AAA 1.35%
7.90% HDFC Ltd NCD (MD 24/08/2026) AAA 1.01%
8.60% LIC Housing Finance Ltd NCD (MD 28/12/2020) AAA 0.36%
9.30% Sundaram BNP Paribas Home Finance Ltd. (MD 08/05/2018) AA+ 0.35%
9.45% HDFC Ltd (MD 21/08/2019) (Put Date 21/09/2015) AAA 0.31%
9.39% LICHFL NCD (MD 23/08/2024)(Put Date 26/08/2015) AAA 0.05%
8.58% LIC Housing Finance Ltd NCD (MD 01/08/2025) (Put Date 03/05/2019) AAA 0.05%
Sovereign 23.59%
8.24% GOI - 15-Feb-2027 SOV 17.88%
8.24% GOI (MD 10/11/2033) SOV 5.37%
7.68% GOI (MD 15/12/2023) SOV 0.33%
Money Market, Deposits & Other 8.51%
Total 100.00%
Company/Issuer Sector/Rating Exposure (%)
Portfolio
Returns less than or equal to 1 year are absolute. Returns greater than 1 year are compounded annualised growth rate (CAGR), Past performance is not indicative of future performance
PerformancePeriod 1 Month 6 Months 1 Year 2 Years 3 Years Inception
Fund
Benchmark
Asset Class Rating Profile
*Others includes Equity, CBLO, Net receivable/payable and FD
1.77% 9.63% 15.72% 8.06% 12.77% 12.52%
2.69% 11.14% 15.61% 8.11% 10.46% 9.71%
Bajaj Allianz Life Insurance Company LtdBajaj Allianz Life Insurance Company Ltd
Description
SFIN Number ULGF00926/02/10GRASSALLOC116
Launch Date 25-Feb-10
Face Value 10
Risk Profile High
Benchmark CRISIL Balanced Fund - Aggressive Index
Fund Manager Name Sampath Reddy, Reshma Banda, Parimal Heda
Number of funds managed by fund manager:
Equity 18 27 -
Debt - - 26
Hybrid 8 23 23
NAV as on 31-May-17 23.5567
AUM (Rs. Cr) 201.78
Equity 61.39%
Debt 37.23%
Net current asset 1.38%
Fund Details
Growth of Rs. 100
Top 10 Sectors
Sampath Reddy Reshma Banda Parimal Heda
Quantitative Indicators Modified Duration 5.20
Note : ‘Financial & insurance activities’ sector includes exposure to ‘Fixed Deposits’ & ‘Certificate of Deposits’.
1
23.59
5.16
7.13
1.35
61.39
1.38
100.00
95
135
175
215
255
Feb-10 May-11 Jul-12 Sep-13 Dec-14 Feb-16 May-17
Fund Benchmark
0.35% 6.16%
69.90%
23.59%
AA+ AAA Others Sovereign
7.13%
61.39%23.59%
6.51% 1.38%
CBLO Equity G-Secs NCDs Net Receivables
30.72%
15.06%
6.64% 5.07% 4.81% 4.69% 4.51% 4.34% 3.76% 3.70%
0%
20%
40%
Go
vern
men
t o
f In
dia
Fin
anci
al a
nd
Insu
ran
ceA
c�vi
�es
Co
mp
ute
rP
rogr
amm
ing,
Co
nsu
ltan
cy a
nd
Rel
ated
Ac�
vi�
es
Man
ufa
ctu
re o
f M
oto
rV
ehic
les,
Tra
ilers
an
dSe
mi-
Trai
lers
Fin
ance
& In
sura
nce
(Ho
usi
ng
- A
AA
or
Equ
ival
ent)
Man
ufa
ctu
re o
f C
oke
and
Refi
ned
Pet
role
um
Pro
du
cts
Man
ufa
ctu
re o
f B
asic
Met
als
Civ
il En
gin
eeri
ng
(In
fra)
Man
ufa
ctu
re o
fC
hem
ical
s an
d C
hem
ical
Pro
du
cts
Man
ufa
ctu
re o
f To
bac
coP
rod
uct
s

Fund ObjectiveTo provide capital appreciation through investment in equities forming part of NSE NIFTY.
Group Equity Index Fund
May 2017
Returns less than or equal to 1 year are absolute. Returns greater than 1 year are compounded annualised growth rate (CAGR), Past performance is not indicative of future performance
PerformancePeriod 1 Month 6 Months 1 Year 2 Years 3 Years Inception
Fund
Benchmark
Asset Class Rating Profile
*Others includes Equity, CBLO, Net receivable/payable and FD
Description
SFIN Number ULGF00822/02/10GREQTYINDX116
Launch Date 19-Feb-10
Face Value 10
Risk Profile High
Benchmark Nifty 50
Fund Manager Name Reshma Banda
Number of funds managed by fund manager:
Equity 27
Debt -
Hybrid 23
NAV as on 31-May-17 17.7122
AUM (Rs. Cr) 59.52
Equity 99.69%
Debt 0.13%
Net current asset 0.18%
Fund Details
Equity 99.69%
ITC Limited Manufacture of Tobacco Products 9.54%
HDFC Bank Limited Financial and Insurance Activities 8.97%
Reliance Industries Limited Manufacture of Coke and Refined Petroleum Products 7.05%
Infosys Limited Computer Programming, Consultancy and Related Activities 6.84%
ICICI Bank Limited Financial and Insurance Activities 4.49%
Larsen & Toubro Limited Civil Engineering (Infra) 4.25%
Tata Motors Limited Manufacture of Motor Vehicles, Trailers and Semi-Trailers 3.79%
Hindustan Unilever Limited Manufacture of Chemicals and Chemical Products 3.16%
Maruti Suzuki India Limited Manufacture of Motor Vehicles, Trailers and Semi-Trailers 2.98%
Tata Consultancy Services Computer Programming, Limited Consultancy and Related Activities 2.63%
Others 45.99%
Money Market, Deposits & Other 0.31%
Total 100.00%
Company/Issuer Sector/Rating Exposure (%)
Portfolio
Top 10 Sectors
Growth of Rs. 100
Portfolio Allocation Actual (%) Stated (%)
Govt. and Govt. approved Securities 0 - 20
Corporate bonds rated AA or above by Crisil 0 - 40
Money market and other liquid assets 0 - 40
Infrastructure sector as defined by the IRDA 0 - 20
Listed equities 0 - 100
#Net Current Assets
Total
#Net current asset represents net of receivables and payables for investments held.
3.14% 14.99% 16.06% 6.33% 8.95% 8.17%
3.41% 16.98% 17.91% 6.78% 9.97% 9.88%
Bajaj Allianz Life Insurance Company LtdBajaj Allianz Life Insurance Company Ltd
Note : ‘Financial & insurance activities’ sector includes exposure to ‘Fixed Deposits’ & ‘Certificate of Deposits’.
2
-
-
0.13
-
99.69
0.18
100.00
80
110
140
170
200
Feb-10 Mar-11 Mar-12 Mar-13 Apr-14 Apr-15 Apr-16 May-17
Fund Benchmark
21.14%
13.81%9.54% 9.40% 9.03%
6.34% 5.07% 4.79% 4.25% 2.65%
0%
20%
40%
Fin
anci
al a
nd
Insu
ran
ceA
c�vi
�es
Co
mp
ute
rP
rogr
amm
ing,
Co
nsu
ltan
cy a
nd
Rel
ated
Ac�
vi�
es
Man
ufa
ctu
re o
f To
bac
coP
rod
uct
s
Man
ufa
ctu
re o
f C
oke
and
Refi
ned
Pet
role
um
Pro
du
cts
Man
ufa
ctu
re o
f M
oto
rV
ehic
les,
Tra
ilers
an
dSe
mi-
Trai
lers
Man
ufa
ctu
re o
f P
har
ma,
Med
icin
al C
hem
ical
an
dB
ota
nic
al P
rod
uct
s
Man
ufa
ctu
re o
fC
hem
ical
s an
d C
hem
ical
Pro
du
cts
Elec
tric
ity,
Gas
, Ste
aman
d A
irco
nd
i�o
n S
up
ply
Civ
il En
gin
eeri
ng
(In
fra)
Man
ufa
ctu
re o
f O
ther
Tran
spo
rt E
qu
ipm
ent
100.00%
Others
0.13%
99.69%
0.18%
CBLO Equity Net Receivables

Fund ObjectiveTo provide stable returns through investment in various fixed income securities.
Group Debt Fund
May 2017
Returns less than or equal to 1 year are absolute. Returns greater than 1 year are compounded annualised growth rate (CAGR), Past performance is not indicative of future performance
PerformancePeriod 1 Month 6 Months 1 Year 2 Years 3 Years Inception
Fund
Benchmark
Description
SFIN Number ULGF00426/03/08GRDEBTFUND116
Launch Date 26-Mar-08
Face Value 10
Risk Profile Low
Benchmark CRISIL Composite Bond Fund Index
Fund Manager Name Parimal Heda
Number of funds managed by fund manager:
Equity -
Debt 26
Hybrid 23
NAV as on 31-May-17 23.6746
AUM (Rs. Cr) 210.42
Equity -
Debt 97.99%
Net current asset 2.01%
Fund Details
Top 10 Sectors
Growth of Rs. 100
Asset Class Rating Profile
*Others includes Equity, CBLO, Net receivable/payable and FD
Portfolio Allocation Actual (%) Stated (%)
Govt. and Govt. approved Securities 0 - 100
Corporate bonds rated AA or above by Crisil* 0 - 100
Money market and other liquid assets 0 - 40
Listed equities - NIL
#Net Current Assets
Total
#Net current asset represents net of receivables and payables for investments held.
* including Fixed Deposits and instruments rated by Other Rating Agencies
Corporate Bond 29.09%
8.25% Tata Sons Ltd NCD (MD 23/03/2022) AAA 4.92%
7.79% Kotak Mahindra Prime Ltd NCD (MD 07/06/2019) AAA 2.88%
8.57% India Bulls Housing Finance Ltd (MD 30/03/2022) AAA 2.50%
9.71% Tata Motors NCD (MD 01/10/2019) AA+ 2.49%
8.95% Crompton Greaves Consumer Electricals Limited NCD (MD 24/06/2021) AA 2.45%
8.12% ONGC Mangalore Petrochemicals Ltd NCD (MD 10/06/2019) AAA 2.42%
8.75% Indiabulls Housing Finance LTD NCD (MD 26/09/2021) AAA 1.54%
9.4554% Sundaram Finance Ltd. (MD 28/08/2019) (Put Option 28/12/2015) AA+ 1.50%
9.10% Dewan Housing Finance Corporation Limited (MD 16/08/2019) AAA 1.46%
7.9612% Cholamandalam Investment & Finance Co. Ltd NCD (MD 26/02/2019) AA 1.24%
Others 5.68%
Sovereign 64.19%
7.68% GOI (MD 15/12/2023) SOV 15.31%
6.84% GOI (MD 19/12/2022) SOV 11.34%
7.80% GOI (MD 11/04/2021) SOV 9.33%
7.59% GOI (MD 20/03/2029) SOV 6.38%
8.24% GOI (MD 10/11/2033) SOV 6.18%
8.60% GOI (MD 02/06/2028) SOV 5.31%
6.97% GOI (MD 06/09/2026) SOV 4.81%
7.72% GOI (MD 26/10/2055) SOV 3.11%
8.33% GOI (MD 09/07/2026) SOV 1.40%
8.15% GOI (MD 24/11/2026) SOV 1.01%
Money Market, Deposits & Other 6.73%
Total 100.00%
Company/Issuer Rating Exposure (%)
Portfolio
1.25% -0.64% 11.02% 9.74% 10.82% 9.84%
1.34% 0.88% 10.95% 9.90% 10.67% 8.06%
Quantitative Indicators Modified Duration 4.79
Bajaj Allianz Life Insurance Company LtdBajaj Allianz Life Insurance Company Ltd
Note : ‘Financial & insurance activities’ sector includes exposure to ‘Fixed Deposits’ & ‘Certificate of Deposits’.
3
64.19
29.56
4.25
-
2.01
100.00
50
90
130
170
210
250
Mar-08 Mar-09 Apr-10 Apr-11 Apr-12 Apr-13 Apr-14 Apr-15 May-16 May-17
Fund Benchmark
68.43%
12.52%6.65% 3.43% 2.49% 2.42% 1.04% 1.01%
0%
20%
40%
60%
80%
Go
vern
men
t o
f In
dia
Fin
anci
al a
nd
Insu
ran
ceA
c�vi
�es
Fin
ance
& In
sura
nce
(Ho
usi
ng
- A
AA
or
Equ
ival
ent)
Man
ufa
ctu
re o
fEl
ectr
ical
Eq
uip
men
t
Man
ufa
ctu
re o
f M
oto
rV
ehic
les,
Tra
ilers
an
dSe
mi-
Trai
lers
Man
ufa
ctu
re o
f C
oke
and
Refi
ned
Pet
role
um
Pro
du
cts
Man
ufa
ctu
re o
f R
ub
ber
and
Pla
s�cs
Pro
du
cts
Rea
l Est
ate
Ac�
vi�
es
5.69%
5.40%
17.99%
6.73%
64.19%
AA AA+ AAA Others Sovereign
4.25%0.47%
64.19%
29.09%
2.01%
CBLO FDs G-Secs NCDs Net Receivables

Fund ObjectiveTo provide stable returns through investment in various fixed deposits, money market Instruments and short term debt instruments.
Group Liquid Fund
May 2017
Returns less than or equal to 1 year are absolute. Returns greater than 1 year are compounded annualised growth rate (CAGR), Past performance is not indicative of future performance
PerformancePeriod 1 Month 6 Months 1 Year 2 Years 3 Years Inception
Fund
Benchmark
Asset Class Rating Profile
*Others includes Equity, CBLO, Net receivable/payable and FD
Description
SFIN Number ULGF00503/11/08GRLIQUFUND116
Launch Date 01-Nov-08
Face Value 10
Risk Profile Very Low
Benchmark CRISIL Liquid Fund Index
Fund Manager Name Parimal Heda
Number of funds managed by fund manager:
Equity -
Debt 26
Hybrid 23
NAV as on 31-May-17 20.7664
AUM (Rs. Cr) 33.14
Equity -
Debt 98.85%
Net current asset 1.15%
Fund Details
Top 10 Sectors
Portfolio Allocation Actual (%) Stated (%)
Govt. and Govt. approved Securities 0 - 20
Corporate bonds rated AA or above by Crisil* 0 - 20
Money market and other liquid assets 0 - 100
Infrastructure sector as defined by the IRDA
Listed equities - NIL
#Net Current Assets
Total #Net current asset represents net of receivables and payables for investments held.* Including Fixed Deposits
Money Market, Deposits & Other 100.00%
Total 100.00%
Company/Issuer Rating Exposure (%)
Portfolio
0.54% 3.18% 7.12% 7.61% 7.89% 8.89%
0.59% 3.23% 6.96% 7.43% 7.89% 7.59%
Quantitative Indicators Modified Duration 0.11
Bajaj Allianz Life Insurance Company LtdBajaj Allianz Life Insurance Company Ltd
Note : ‘Financial & insurance activities’ sector includes exposure to ‘Fixed Deposits’ & ‘Certificate of Deposits’.
4
-
7.54
91.31
-
-
1.15
100.00
47.45% 45.67%
5.73%
0%
20%
40%
60%
Fin
anci
al a
nd
Insu
ran
ceA
c�vi
�es
Go
vern
men
t o
f In
dia
Fin
ance
& In
sura
nce
(Ho
usi
ng
- A
AA
or
Equ
ival
ent)
45.64%
42.91%
11.45%
A1+ Others Sovereign
34.22%
31.48%
14.15%
7.54%
11.45% 1.15%
CBLO CDs CPs FDs Tbills Net Receivables

Growth of Rs. 100
Fund ObjectiveTo earn moderate returns.
Group Short Term Debt Fund
May 2017
Returns less than or equal to 1 year are absolute. Returns greater than 1 year are compounded annualised growth rate (CAGR), Past performance is not indicative of future performance
PerformancePeriod 1 Month 6 Months 1 Year 2 Years 3 Years Inception
Fund
Benchmark
Asset Class Rating Profile
*Others includes Equity, CBLO, Net receivable/payable and FD
Description
SFIN Number ULGF00628/02/09GRSHTRMDEB116
Launch Date 09-Mar-09
Face Value 10
Risk Profile Low
Benchmark CRISIL Short Term Bond Fund Index
Fund Manager Name Parimal Heda
Number of funds managed by fund manager:
Equity -
Debt 26
Hybrid 23
NAV as on 31-May-17 18.7215
AUM (Rs. Cr) 0.44
Equity -
Debt 87.92%
Net current asset 12.08%
Fund Details
Portfolio
Top 10 Sectors
Portfolio Allocation Actual (%) Stated (%)
Govt. and Govt. approved Securities 0 - 80
Corporate bonds rated AA or above by Crisil* 0 - 100
Money market and other liquid assets 0 - 40
Infrastructure sector as defined by the IRDA
Listed equities - NIL
#Net Current Assets
Total
#Net current asset represents net of receivables and payables for investments held.* Including Fixed Deposits
Sovereign 78.51%
8.12% GOI (MD 10/12/2020) SOV 78.51%
Money Market, Deposits & Other 21.49%
Total 100.00%
Company/Issuer Rating Exposure (%)
1.02% 1.80% 7.63% 7.63% 8.18% 7.92%
0.80% 2.59% 8.82% 8.69% 9.07% 8.05%
Quantitative Indicators Modified Duration 2.92
Bajaj Allianz Life Insurance Company LtdBajaj Allianz Life Insurance Company Ltd
Note : ‘Financial & insurance activities’ sector includes exposure to ‘Fixed Deposits’ & ‘Certificate of Deposits’.
78.51
9.42
-
-
-
12.08
100.00
90
110
130
150
170
190
210
Mar-09 Mar-10 Mar-11 Apr-12 Apr-13 Apr-14 May-15 May-16 May-17
Fund Benchmark
78.51%
9.42%
0%
20%
40%
60%
80%
100%
Go
vern
men
t o
f In
dia
Fin
anci
al a
nd
Insu
ran
ceA
c�vi
�es
21.49%
78.51%
Others Sovereign
9.42%
78.51%
12.08%
FDs G-Secs Net Receivables
5

Equity 19.17%
Hindalco Industries Limited Manufacture of Basic Metals 1.94%
HDFC Bank Limited Financial and Insurance Activities 1.84%
Housing Development Finance Corporation Limited Financial and Insurance Activities 1.52%
GAIL (India) Limited Electricity, Gas, Steam and Aircondition Supply 1.33%
HCL Technologies Limited Computer Programming, Consultancy and Related Activities 1.27%
IndusInd Bank Limited Financial and Insurance Activities 1.12%
Yes Bank Limited Financial and Insurance Activities 1.10%
Infosys Limited Computer Programming, Consultancy and Related Activities 0.93%
ICICI Bank Limited Financial and Insurance Activities 0.83%
Oil & Natural Gas Corporation Extraction of Crude Petroleum and Limited Natural Gas 0.82%
Others 6.47%
Corporate Bond 22.99%
8.28% POWER FINANCE CORPORATION LTD NCD (MD 04/09/2018) AAA 8.08%
8.15% HDFC Ltd NCD (MD 27/07/2018) AAA 3.46%
10.90% DLF Promenade Ltd NCD (MD 11/12/2021) (CALL 12/06/2019) AA 1.82%
8.5687% Sundaram Finance Ltd. (MD 19/03/2018) AA+ 1.73%
8.0505% Cholamandalam Investment & Finance Co. Ltd NCD (MD 25/10/2019) AA 1.72%
8.35% Petronet LNG NCD (14/06/2018) AA+ 1.15%
9.45% HDFC Ltd (MD 21/08/2019) (Put Date 21/09/2015) AAA 1.13%
9.50% HDFC Ltd NCD (MD 13/08/2017) AAA 0.92%
9.95 % Food Corporation of India (MD 07/03/2022) AAA 0.63%
8.75% Indiabulls Housing Finance LTD NCD (MD 26/09/2021) AAA 0.60%
Others 1.76%
Company/Issuer Sector/Rating Exposure (%)
Portfolio
Fund ObjectiveTo provide moderate risk with moderate returns.
Stable Fund
May 2017
Portfolio Allocation Actual (%) Stated (%)
Govt. and Govt. approved Securities 0 - 80
Corporate bonds rated AA or above by Crisil* 0 - 40
Money market and other liquid assets 0 - 20
Infrastructure sector as defined by the IRDA 0 - 25
Listed equities 0 - 35
#Net Current Assets
Total #Net current asset represents net of receivables and payables for investments held.*Including instrument rated by other rating agencies
Description
SFIN Number ULGF00115/09/04STABLEFUND116
Launch Date 31-Oct-04
Face Value 10
Risk Profile Moderate
Benchmark -
Fund Manager Name Sampath Reddy, Reshma Banda, Parimal Heda
Number of funds managed by fund manager:
Equity 18 27 -
Debt - - 26
Hybrid 8 23 23
NAV as on 31-May-17 36.8382
AUM (Rs. Cr) 175.47
Equity 19.17%
Debt 77.41%
Net current asset 3.43%
Fund Details
Sampath Reddy Reshma Banda Parimal Heda
Quantitative Indicators Modified Duration 3.54
Bajaj Allianz Life Insurance Company LtdBajaj Allianz Life Insurance Company Ltd
6
42.49
14.01
10.88
10.03
19.17
3.43
100.00
Sovereign 41.86%
7.16% GOI (MD 20/05/2023) SOV 14.96%
8.69% Tamilnadu SDL (MD 24/02/2026) SOV 7.91%
8.21% Haryana Uday SDL (31/03/2024) SOV 3.53%
8.39% Rajasthan UDAY SDL (MD 15/03/2026) SOV 2.98%
7.74% TAMIL NADU UDAY SDL (MD 22/02/2026) SOV 2.87%
6.79% GOI (MD 26/12/2029) SOV 2.84%
8.26% MAHARASHTRA SDL (MD 12/08/2025) SOV 1.85%
9.20% GOI (MD 30/09/2030) SOV 1.31%
8.92% TAMIL NADU SDL (MD 08/08/2022) SOV 1.21%
8.89% Maharastra SDL (MD 05/10/2021) SOV 1.21%
Others 1.21%
Money Market, Deposits & Other 15.98%
Total 100.00%
Company/Issuer Sector/Rating Exposure (%)

25.59%22.75%
17.15%
8.87% 6.40%2.91% 2.74% 2.36% 1.82% 0.99%
0%
20%
40%
Go
vern
men
t o
f In
dia
Stat
e G
ove
rnm
ent
Fin
anci
al a
nd
Insu
ran
ceA
c�vi
�es
Fin
anci
al a
nd
Insu
ran
ceA
c�vi
�es
(In
fra)
Fin
ance
& In
sura
nce
(Ho
usi
ng
- A
AA
or
Equ
ival
ent)
Co
mp
ute
rP
rogr
amm
ing,
Co
nsu
ltan
cy a
nd
Rel
ated
Ac�
vi�
es
Elec
tric
ity,
Gas
, Ste
aman
d A
irco
nd
i�o
n S
up
ply
Man
ufa
ctu
re o
f B
asic
Met
als
Rea
l Est
ate
Ac�
vi�
es
Man
ufa
ctu
re o
fC
hem
ical
s an
d C
hem
ical
Pro
du
cts
4.39% 3.54%3.24%
16.21%
30.75%
41.86%
A1+ AA AA+ AAA Others Sovereign
6.49%
4.39%
19.17%
1.68%
19.11%22.99%
22.75%
3.43%
CBLO CPs Equity
FDs G-Secs NCDs
SDLs Net Receivables
Returns less than or equal to 1 year are absolute. Returns greater than 1 year are compounded annualised growth rate (CAGR), Past performance is not indicative of future performance
PerformancePeriod 1 Month 6 Months 1 Year 2 Years 3 Years Inception
Fund
Benchmark
1.15% 5.82% 14.20% 10.32% 12.04% 10.91%
- - - - - -
7
Asset Class Rating Profile
*Others includes Equity, CBLO, Net receivable/payable and FD
Top 10 Sectors
Note : ‘Financial & insurance activities’ sector includes exposure to ‘Fixed Deposits’ & ‘Certificate of Deposits’.

Fund ObjectiveTo provide very low principal risk with stable returns.
Secure Fund
May 2017
Returns less than or equal to 1 year are absolute. Returns greater than 1 year are compounded annualised growth rate (CAGR), Past performance is not indicative of future performance
PerformancePeriod 1 Month 6 Months 1 Year 2 Years 3 Years Inception
Fund
Benchmark
Portfolio Allocation Actual (%) Stated (%)
Govt. and Govt. approved Securities 0 - 90
Corporate bonds rated AA or above by Crisil* 0 - 30
Money market and other liquid assets 0 - 20
Infrastructure sector as defined by the IRDA 0 - 25
Listed equities 0 - 20
#Net Current Assets
Total #Net current asset represents net of receivables and payables for investments held.
*Including instrument rated by other rating agencies
1.20% 4.15% 12.58% 9.93% 11.06% 9.96%
- - - - - -
Equity 11.80%
HDFC Bank Limited Financial and Insurance Activities 1.06%
Hindalco Industries Limited Manufacture of Basic Metals 1.00%
Housing Development Finance Corporation Limited Financial and Insurance Activities 0.85%
HCL Technologies Limited Computer Programming, Consultancy and Related Activities 0.75%
GAIL (India) Limited Electricity, Gas, Steam and Aircondition Supply 0.74%
Oil & Natural Gas Corporation Extraction of Crude Petroleum and Limited Natural Gas 0.64%
IndusInd Bank Limited Financial and Insurance Activities 0.62%
Infosys Limited Computer Programming, Consultancy and Related Activities 0.55%
Reliance Industries Limited Manufacture of Coke and Refined Petroleum Products 0.54%
Yes Bank Limited Financial and Insurance Activities 0.53%
Others 4.52%
Corporate Bond 17.29%
8.15% HDFC Ltd NCD (MD 27/07/2018) AAA 2.73%
8.35% HDFC Ltd (MD 13/05/2026) (Put Date 13/11/2017) AAA 2.53%
8.5687% Sundaram Finance Ltd. (MD 19/03/2018) AA+ 2.14%
7.83% LIC Housing Finance Ltd NCD (MD 25/09/2026) (Put Date 26/11/2020) AAA 1.28%
8.85% Sundaram Finance Ltd. (MD 22/12/2017) AA+ 1.26%
8.65% HDFC Ltd NCD (MD 18/09/2020) AAA 1.00%
8.0505% Cholamandalam Investment & Finance Co. Ltd NCD (MD 25/10/2019) AA 0.97%
8.60% Tata Sons Ltd NCD (MD 22/01/2020) AAA 0.59%
8.60% LIC Housing Finance Ltd NCD Option I (MD 26/02/2021) AAA 0.56%
9.95 % Food Corporation of India (MD 07/03/2022) AAA 0.53%
Others 3.70%
Sovereign 47.30%
8.21% Haryana Uday SDL (31/03/2024) SOV 6.85%
7.16% GOI (MD 20/05/2023) SOV 5.16%
8.09% Andhra Pradesh SDL (MD 15/06/2026) SOV 4.09%
8.69% Tamilnadu SDL (MD 24/02/2026) SOV 3.81%
8.21% Uttar Pradesh Uday SDL (29/03/2026) SOV 3.50%
8.21% Haryana Uday SDL (MD 31/03/2022) SOV 3.48%
8.24% GOI - 15-Feb-2027 SOV 3.31%
8.39% Rajasthan UDAY SDL (MD 15/03/2026) SOV 3.05%
8.21% Haryana UDAY SDL (MD 31/03/2026) SOV 2.49%
9.20% GOI (MD 30/09/2030) SOV 2.44%
Others 9.13%
Money Market, Deposits & Other 23.61%
Total 100.00%
Company/Issuer Sector/Rating Exposure (%)
Portfolio
Asset Class Rating Profile
*Others includes Equity, CBLO, Net receivable/payable and FD
Bajaj Allianz Life Insurance Company LtdBajaj Allianz Life Insurance Company Ltd
Description
SFIN Number ULGF00215/10/04SECUREFUND116
Launch Date 15-Oct-04
Face Value 10
Risk Profile Moderate
Benchmark -
Fund Manager Name Sampath Reddy, Reshma Banda, Parimal Heda
Number of funds managed by fund manager:
Equity 18 27 -
Debt - - 26
Hybrid 8 23 23
NAV as on 31-May-17 33.1824
AUM (Rs. Cr) 1,037.08
Equity 11.80%
Debt 81.37%
Net current asset 6.83%
Fund Details
Sampath Reddy Reshma Banda Parimal Heda
Quantitative Indicators Modified Duration 4.00
Top 10 Sectors
Note : ‘Financial & insurance activities’ sector includes exposure to ‘Fixed Deposits’ & ‘Certificate of Deposits’.
8
47.83
24.25
7.98
1.31
11.80
6.83
100.00
33.46%
20.65% 18.91%
10.34%
1.80% 1.31% 1.25% 0.96% 0.66% 0.65%0%
20%
40%
Stat
e G
ove
rnm
ent
Fin
anci
al a
nd
Insu
ran
ceA
c�vi
�es
Go
vern
men
t o
f In
dia
Fin
ance
& In
sura
nce
(Ho
usi
ng
- A
AA
or
Equ
ival
ent)
Co
mp
ute
rP
rogr
amm
ing,
Co
nsu
ltan
cy a
nd
Rel
ated
Ac�
vi�
es
Fin
anci
al a
nd
Insu
ran
ceA
c�vi
�es
(In
fra)
Man
ufa
ctu
re o
f B
asic
Met
als
Elec
tric
ity,
Gas
, Ste
aman
d A
irco
nd
i�o
n S
up
ply
Man
ufa
ctu
re o
f C
oke
and
Refi
ned
Pet
role
um
Pro
du
cts
Man
ufa
ctu
re o
f M
oto
rV
ehic
les,
Tra
ilers
an
dSe
mi-
Trai
lers
2.90% 0.97%
3.40%
12.92%
32.51%
47.30%
A1+ AA AA+ AAA Others Sovereign
5.08%2.90%
11.80%
8.80%
13.84%17.29%
33.46%
6.83%
CBLO CPs Equity
FDs G-Secs NCDs
SDLs Net Receivables
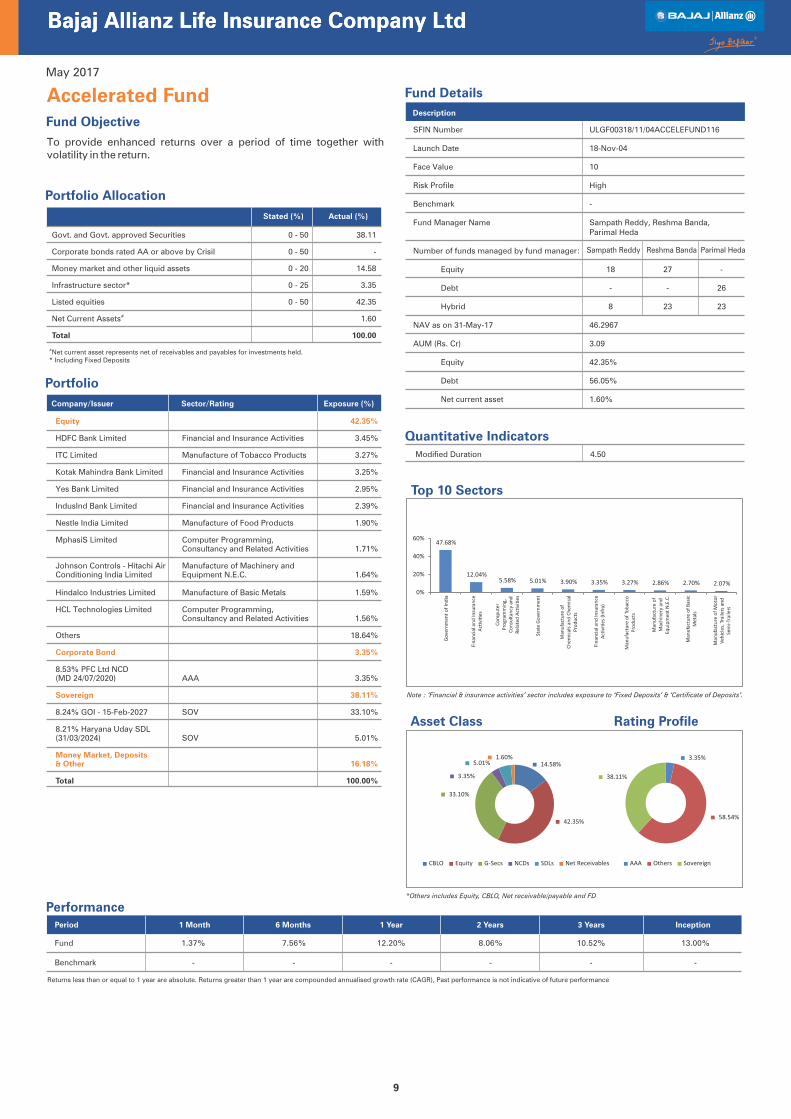
Fund Objective
To provide enhanced returns over a period of time together with volatility in the return.
Accelerated Fund
May 2017
Portfolio Allocation
Actual (%) Stated (%)
Govt. and Govt. approved Securities 0 - 50
Corporate bonds rated AA or above by Crisil 0 - 50
Money market and other liquid assets 0 - 20
Infrastructure sector* 0 - 25
Listed equities 0 - 50
#Net Current Assets
Total
#Net current asset represents net of receivables and payables for investments held.* Including Fixed Deposits
Equity 42.35%
HDFC Bank Limited Financial and Insurance Activities 3.45%
ITC Limited Manufacture of Tobacco Products 3.27%
Kotak Mahindra Bank Limited Financial and Insurance Activities 3.25%
Yes Bank Limited Financial and Insurance Activities 2.95%
IndusInd Bank Limited Financial and Insurance Activities 2.39%
Nestle India Limited Manufacture of Food Products 1.90%
MphasiS Limited Computer Programming, Consultancy and Related Activities 1.71%
Johnson Controls - Hitachi Air Manufacture of Machinery and Conditioning India Limited Equipment N.E.C. 1.64%
Hindalco Industries Limited Manufacture of Basic Metals 1.59%
HCL Technologies Limited Computer Programming, Consultancy and Related Activities 1.56%
Others 18.64%
Corporate Bond 3.35%
8.53% PFC Ltd NCD (MD 24/07/2020) AAA 3.35%
Sovereign 38.11%
8.24% GOI - 15-Feb-2027 SOV 33.10%
8.21% Haryana Uday SDL (31/03/2024) SOV 5.01%
Money Market, Deposits & Other 16.18%
Total 100.00%
Company/Issuer Sector/Rating Exposure (%)
Portfolio
Returns less than or equal to 1 year are absolute. Returns greater than 1 year are compounded annualised growth rate (CAGR), Past performance is not indicative of future performance
PerformancePeriod 1 Month 6 Months 1 Year 2 Years 3 Years Inception
Fund
Benchmark
1.37% 7.56% 12.20% 8.06% 10.52% 13.00%
- - - - - -
Bajaj Allianz Life Insurance Company LtdBajaj Allianz Life Insurance Company Ltd
Quantitative Indicators Modified Duration 4.50
*Others includes Equity, CBLO, Net receivable/payable and FD
Asset Class Rating Profile
Description
SFIN Number ULGF00318/11/04ACCELEFUND116
Launch Date 18-Nov-04
Face Value 10
Risk Profile High
Benchmark -
Fund Manager Name Sampath Reddy, Reshma Banda, Parimal Heda
Number of funds managed by fund manager:
Equity 18 27 -
Debt - - 26
Hybrid 8 23 23
NAV as on 31-May-17 46.2967
AUM (Rs. Cr) 3.09
Equity 42.35%
Debt 56.05%
Net current asset 1.60%
Fund Details
Sampath Reddy Reshma Banda Parimal Heda
Top 10 Sectors
Note : ‘Financial & insurance activities’ sector includes exposure to ‘Fixed Deposits’ & ‘Certificate of Deposits’.
9
38.11
-
14.58
3.35
42.35
1.60
100.00
47.68%
12.04%5.58% 5.01% 3.90% 3.35% 3.27% 2.86% 2.70% 2.07%
0%
20%
40%
60%
Go
vern
men
t o
f In
dia
Fin
anci
al a
nd
Insu
ran
ceA
c�vi
�es
Co
mp
ute
rP
rogr
amm
ing,
Co
nsu
ltan
cy a
nd
Rel
ated
Ac�
vi�
es
Stat
e G
ove
rnm
ent
Man
ufa
ctu
re o
fC
hem
ical
s an
d C
hem
ical
Pro
du
cts
Fin
anci
al a
nd
Insu
ran
ceA
c�vi
�es
(In
fra)
Man
ufa
ctu
re o
f To
bac
coP
rod
uct
s
Man
ufa
ctu
re o
fM
ach
iner
y an
dEq
uip
men
t N
.E.C
.
Man
ufa
ctu
re o
f B
asic
Met
als
Man
ufa
ctu
re o
f M
oto
rV
ehic
les,
Tra
ilers
an
dSe
mi-
Trai
lers
3.35%
58.54%
38.11%
AAA Others Sovereign
14.58%
42.35%
33.10%
3.35%
5.01%1.60%
CBLO Equity G-Secs NCDs SDLs Net Receivables

Fund ObjectiveTo provide capital appreciation through investment in equities.
Group Blue Chip Fund
May 2017
Returns less than or equal to 1 year are absolute. Returns greater than 1 year are compounded annualised growth rate (CAGR), Past performance is not indicative of future performance
PerformancePeriod 1 Month 6 Months 1 Year 2 Years 3 Years Inception
Fund
Benchmark
Asset Class Rating Profile
*Others includes Equity, CBLO, Net receivable/payable and FD
Description
SFIN Number ULGF01118/04/11GRBLUECHIP116
Launch Date 21-Jun-11
Face Value 10
Risk Profile High
Benchmark Nifty 50
Fund Manager Name Reshma Banda
Number of funds managed by fund manager:
Equity 27
Debt -
Hybrid 23
NAV as on 31-May-17 17.5808
AUM (Rs. Cr) 11.62
Equity 97.39%
Debt 2.41%
Net current asset 0.20%
Fund Details
Equity 97.39%
ITC Limited Manufacture of Tobacco Products 9.07%
HDFC Bank Limited Financial and Insurance Activities 7.12%
Infosys Limited Computer Programming, Consultancy and Related Activities 6.60%
Reliance Industries Limited Manufacture of Coke and Refined Petroleum Products 6.47%
Housing Development Finance Corporation Limited Financial and Insurance Activities 6.20%
ICICI Bank Limited Financial and Insurance Activities 4.74%
Larsen & Toubro Limited Civil Engineering (Infra) 4.16%
Tata Motors Limited Manufacture of Motor Vehicles, Trailers and Semi-Trailers 3.72%
Hindustan Unilever Limited Manufacture of Chemicals and Chemical Products 3.05%
Maruti Suzuki India Limited Manufacture of Motor Vehicles, Trailers and Semi-Trailers 2.50%
Others 43.77%
Money Market, Deposits & Other 2.61%
Total 100.00%
Company/Issuer Sector/Rating Exposure (%)
Portfolio
Top 10 Sectors
Growth of Rs. 100
Portfolio Allocation Actual (%) Stated (%)
Equity and equity related securities 60 - 100
Debt and debt related securities /Cash /Money Market instruments**/Fixed Deposit and Mutual funds 0 - 40
#Net Current Assets
Total
#Net current asset represents net of receivables and payables for investments held.
**The exposure to money market instruments may be increased to 100%, keeping in view market conditions, market opportunities, and political, economic and other factors, depending on the perception of the Investment Manager.
3.08% 15.20% 16.34% 6.53% 9.13% 9.95%
3.41% 16.98% 17.91% 6.78% 9.97% 10.63%
Bajaj Allianz Life Insurance Company LtdBajaj Allianz Life Insurance Company Ltd
Note : ‘Financial & insurance activities’ sector includes exposure to ‘Fixed Deposits’ & ‘Certificate of Deposits’.
10
97.39
2.41
0.20
100.00
60
80
100
120
140
160
180
Jun-11 Aug-12 Oct-13 Dec-14 Mar-16 May-17
Fund Benchmark
24.16%
12.67%9.07% 8.75% 8.34%
5.81% 4.67% 4.25% 4.16% 2.63%
0%
20%
40%
Fin
anci
al a
nd
Insu
ran
ceA
c�vi
�es
Co
mp
ute
rP
rogr
amm
ing,
Co
nsu
ltan
cy a
nd
Rel
ated
Ac�
vi�
es
Man
ufa
ctu
re o
f To
bac
coP
rod
uct
s
Man
ufa
ctu
re o
f C
oke
and
Refi
ned
Pet
role
um
Pro
du
cts
Man
ufa
ctu
re o
f M
oto
rV
ehic
les,
Tra
ilers
an
dSe
mi-
Trai
lers
Man
ufa
ctu
re o
f P
har
ma,
Med
icin
al C
hem
ical
an
dB
ota
nic
al P
rod
uct
s
Man
ufa
ctu
re o
fC
hem
ical
s an
d C
hem
ical
Pro
du
cts
Elec
tric
ity,
Gas
, Ste
aman
d A
irco
nd
i�o
n S
up
ply
Civ
il En
gin
eeri
ng
(In
fra)
Man
ufa
ctu
re o
f O
ther
Tran
spo
rt E
qu
ipm
ent
100.00%
Others
2.41%
97.39%
0.20%
CBLO Equity Net Receivables

Fund ObjectiveTo provide capital appreciation through investment in equity shares.
Group Equity Fund
May 2017
Returns less than or equal to 1 year are absolute. Returns greater than 1 year are compounded annualised growth rate (CAGR), Past performance is not indicative of future performance
PerformancePeriod 1 Month 6 Months 1 Year 2 Years 3 Years Inception
Fund
Benchmark
Asset Class Rating Profile
*Others includes Equity, CBLO, Net receivable/payable and FD
Description
SFIN Number ULGF01018/04/11GREQTYFUND116
Launch Date 21-Jun-11
Face Value 10
Risk Profile Very High
Benchmark Nifty 50
Fund Manager Name Sampath Reddy, Reshma Banda
Number of funds managed by fund manager: Sampath Reddy Reshma Banda
Equity 18 27
Debt - -
Hybrid 8 23
NAV as on 31-May-17 22.0529
AUM (Rs. Cr) 53.53
Equity 95.02%
Debt 3.85%
Net current asset 1.13%
Fund Details
Equity 95.02%
HDFC Bank Limited Financial and Insurance Activities 5.54%
Hindalco Industries Limited Manufacture of Basic Metals 5.34%
ITC Limited Manufacture of Tobacco Products 4.95%
Yes Bank Limited Financial and Insurance Activities 4.69%
Kotak Mahindra MF - Kotak Banking ETF - Dividend Payout Option Mutual Fund 4.52%
R*Shares Bank BeES Mutual Fund 4.03%
ICICI Bank Limited Financial and Insurance Activities 3.77%
Larsen & Toubro Limited Civil Engineering (Infra) 3.35%
Housing Development Finance Corporation Limited Financial and Insurance Activities 3.10%
Maruti Suzuki India Limited Manufacture of Motor Vehicles, Trailers and Semi-Trailers 3.10%
Others 52.62%
Money Market, Deposits & Other 4.98%
Total 100.00%
Company/Issuer Sector/Rating Exposure (%)
Portfolio
Top 10 Sectors
Growth of Rs. 100
Portfolio Allocation
Actual (%) Stated (%)
Equity and equity related securities 60 - 100
Debt and debt related securities, Cash/Money Market Instruments/Fixed deposits/Mutual Funds 0 - 40
#Net Current Assets
Total
#Net current asset represents net of receivables and payables for investments held.
2.34% 17.67% 21.42% 9.51% 15.36% 14.22%
3.41% 16.98% 17.91% 6.78% 9.97% 10.63%
Bajaj Allianz Life Insurance Company LtdBajaj Allianz Life Insurance Company Ltd
Note : ‘Financial & insurance activities’ sector includes exposure to ‘Fixed Deposits’ & ‘Certificate of Deposits’.
11
95.02
3.85
1.13
100.00
50
100
150
200
250
Jun-11 Aug-12 Oct-13 Dec-14 Mar-16 May-17
Fund Benchmark
22.68%
9.42% 8.55% 8.47% 8.09% 7.96%4.95% 3.85% 3.35% 3.16%
0%
20%
40%
Fin
anci
al a
nd
Insu
ran
ceA
c�vi
�es
Co
mp
ute
rP
rogr
amm
ing,
Co
nsu
ltan
cy a
nd
Rel
ated
Ac�
vi�
es
Mu
tual
Fu
nd
Man
ufa
ctu
re o
f B
asic
Met
als
Man
ufa
ctu
re o
fC
hem
ical
s an
d C
hem
ical
Pro
du
cts
Man
ufa
ctu
re o
f M
oto
rV
ehic
les,
Tra
ilers
an
dSe
mi-
Trai
lers
Man
ufa
ctu
re o
f To
bac
coP
rod
uct
s
Go
vern
men
t o
f In
dia
Civ
il En
gin
eeri
ng
(In
fra)
Man
ufa
ctu
re o
f C
oke
and
Refi
ned
Pet
role
um
Pro
du
cts
100.00%
Others
3.85%
95.02%
1.13%
CBLO Equity Net Receivables

Corporate Bond 14.02%
11.95% HDFC Ltd (MD 26/11/2018) AAA 4.49%
8.44% RECL NCD (MD 04/12/2021) AAA 2.92%
9.45% HDFC Ltd (MD 21/08/2019) (Put Date 21/09/2015) AAA 2.20%
8.95% HDFC Ltd (MD 19/10/2020) AAA 1.47%
8.82% RECL Ltd NCD (MD 12/04/2023) AAA 1.12%
9.30% Sundaram BNP Paribas Home Finance Ltd. (MD 08/05/2018) AA+ 1.07%
9.75% Rural Electrification Corporation Ltd. (MD 11/11/2021) AAA 0.38%
9.25% Bajaj Finance Limited (MD 03/05/2018) AAA 0.36%
Sovereign 39.06%
7.68% GOI (MD 15/12/2023) SOV 21.91%
8.24% GOI - 15-Feb-2027 SOV 9.33%
8.89% Maharastra SDL (MD 05/10/2021) SOV 7.82%
Money Market, Deposits & Other 46.93%
Total 100.00%
Fund Objective The investment objective of the fund is to provide minimum unit price growth @ 7.35% p.a. compounded annually at the fund closure date by investing in a suitable mix of assets.
Group Growth Fund- II
May 2017
Returns less than or equal to 1 year are absolute. Returns greater than 1 year are compounded annualised growth rate (CAGR), Past performance is not indicative of future performance
PerformancePeriod 1 Month 6 Months 1 Year 2 Years 3 Years Inception
Fund
Benchmark
Asset Class Rating Profile
*Others includes Equity, CBLO, Net receivable/payable and FD
Description
SFIN Number ULGF01311/05/11GRGROWFU02116
Launch Date 11-May-11
Face Value 10
Risk Profile Low
Benchmark -
Fund Manager Name Parimal Heda
Number of funds managed by fund manager:
Equity -
Debt 26
Hybrid 23
NAV as on 31-May-17 15.4799
AUM (Rs. Cr) 28.46
Equity -
Debt 84.94%
Net current asset 15.06%
Fund Details
Top 10 Sectors
Portfolio Allocation
Actual (%) Stated (%)
Debt and debt related securities, Cash, Fixed Deposits, Money market instruments, Mutual funds 0 - 100
Equity and equity related instruments 0 - 50
#Net Current Assets
Total
#Net current asset represents net of receivables and payables for investments held.
Company/Issuer Rating Exposure (%)
Portfolio
1.12% 1.34% 5.57% 6.23% 6.95% 7.48%
- - - - - -
Quantitative Indicators Modified Duration 3.30
Bajaj Allianz Life Insurance Company LtdBajaj Allianz Life Insurance Company Ltd
Note : ‘Financial & insurance activities’ sector includes exposure to ‘Fixed Deposits’ & ‘Certificate of Deposits’.
12
84.94
-
15.06
100.00
46.03%
18.50%
8.16% 7.82% 4.42%
0%
20%
40%
60%
Go
vern
men
t o
f In
dia
Fin
anci
al a
nd
Insu
ran
ceA
c�vi
�es
Fin
ance
& In
sura
nce
(Ho
usi
ng
- A
AA
or
Equ
ival
ent)
Stat
e G
ove
rnm
ent
Fin
anci
al a
nd
Insu
ran
ceA
c�vi
�es
(In
fra)
1.07%
12.94%
46.93%
39.06%
AA+ AAA Others Sovereign
14.79%
17.07%
31.24%
14.02%
7.82%
15.06%
CBLO FDs G-Secs NCDs SDLs Net Receivables

Fund Objective
Portfolio Allocation
To provide capital appreciation with reasonable risk by investing in a suitable mix of debt and equities
Group Return Shield Fund
May 2017
Actual (%) Stated (%)
Debt and Debt related securities 50 - 100
Equity and Equity related securities, Mutual funds, Money market instruments**, fixed deposits 0 - 50
#Net Current Assets
Total
#Net current asset represents net of receivables and payables for investments held.**The exposure to money market instruments may be increased to 100%, keeping in view market conditions, market opportunities, and political, economic and other factors, depending on the perception of the Investment Manager.
Returns less than or equal to 1 year are absolute. Returns greater than 1 year are compounded annualised growth rate (CAGR), Past performance is not indicative of future performance
PerformancePeriod 1 Month 6 Months 1 Year 2 Years 3 Years Inception
Fund
Benchmark
Top 10 Sectors
Equity 5.87%
Infosys Limited Computer Programming, Consultancy and Related Activities 1.56%
Housing Development Finance Corporation Limited Financial and Insurance Activities 0.95%
Sun Pharmaceuticals Industries Manufacture of Pharma, Medicinal Limited Chemical and Botanical Products 0.66%
State Bank of India Financial and Insurance Activities 0.60%
Bata India limited Manufacture of Leather and ` Related Products 0.57%
ITC Limited Manufacture of Tobacco Products 0.49%
Cummins India Limited Manufacture of Machinery and Equipment N.E.C. 0.37%
Castrol India Limited Manufacture of Coke and Refined Petroleum Products 0.33%
Idea Cellular Limited Telecommunications (Infra) 0.27%
Wipro Limited Computer Programming, Consultancy and Related Activities 0.06%
Corporate Bond 38.80%
9.67% Tata Sons Ltd (MD 13/09/2022) AAA 9.20%
9.38% EXIM Bank Ltd. (MD 29/09/2021) AAA 7.49%
9.61% Power Finance Corporation Ltd. Series 75 C (MD 29/06/2021) AAA 6.02%
9.64% Power Grid Corporation Ltd. G ( MD 31/05/2021) AAA 5.64%
9.57% IRFC Ltd (MD 31/05/2021) AAA 3.02%
9.40% HDFC Ltd. (MD 13/04/2021) AAA 2.98%
8.88% LIC Housing Finance Ltd (MD 13/10/2020) AAA 2.92%
9.75% Rural Electrification Corporation Ltd.(MD 11/11/2021) AAA 1.52%
Sovereign 24.99%
8.94% Gujarat SDL (MD 07/03/2022) SOV 14.83%
8.15% GOI (MD 11/06/2022) SOV 7.20%
8.89% Maharastra SDL (MD 05/10/2021) SOV 2.96%
Money Market, Deposits & Other 30.34%
Total 100.00%
Company/Issuer Sector/Rating Exposure (%)
Portfolio
0.55% 2.89% 10.05% 8.41% 9.74% 9.20%
- - - - - -
Asset Class Rating Profile
*Others includes Equity, CBLO, Net receivable/payable and FD
Description
SFIN Number ULGF01421/06/11RETNSHIELD116
Launch Date 21-Jun-11
Face Value 10
Risk Profile Moderate
Benchmark -
Fund Manager Name Reshma Banda, Parimal Heda
Number of funds managed by fund manager: Reshma Banda Parimal Heda
Equity 27 -
Debt - 26
Hybrid 23 23
NAV as on 31-May-17 16.8816
AUM (Rs. Cr) 7.16
Equity 5.87%
Debt 87.14%
Net current asset 6.99%
Fund Details
Quantitative Indicators Modified Duration 3.00
Bajaj Allianz Life Insurance Company LtdBajaj Allianz Life Insurance Company Ltd
Note : ‘Financial & insurance activities’ sector includes exposure to ‘Fixed Deposits’ & ‘Certificate of Deposits’.
13
63.79
29.22
6.99
100.00
28.18%
20.62%17.79%
10.56%5.90% 5.64%
1.61% 0.66% 0.57% 0.49%0%
20%
40%
Fin
anci
al a
nd
Insu
ran
ceA
c�vi
�es
Go
vern
men
t o
f In
dia
Stat
e G
ove
rnm
ent
Fin
anci
al a
nd
Insu
ran
ceA
c�vi
�es
(In
fra)
Fin
ance
& In
sura
nce
(Ho
usi
ng
- A
AA
or
Equ
ival
ent)
Elec
tric
ity,
Gas
, Ste
aman
d A
irco
nd
i�o
n S
up
ply
Co
mp
ute
rP
rogr
amm
ing,
Co
nsu
ltan
cy a
nd
Rel
ated
Ac�
vi�
es
Man
ufa
ctu
re o
f P
har
ma,
Med
icin
al C
hem
ical
an
dB
ota
nic
al P
rod
uct
s
Man
ufa
ctu
re o
f Le
ath
eran
d R
elat
ed P
rod
uct
s
Man
ufa
ctu
re o
f To
bac
coP
rod
uct
s
13.42%
5.87%
9.93%
7.20%
38.80%
17.79%
6.99%
CBLO Equity FDs G-Secs NCDs SDLs Net Receivables
38.80%
36.21%
24.99%
AAA Others Sovereign

Fund Objective
Portfolio Allocation
To earn moderate returns.
Group Short Term Debt Fund- II
May 2017
Actual (%) Stated (%)
Debt and debt related securities, Cash, Fixed Deposits, Money market instruments**, Mutual funds 0 - 100
#Net Current Assets
Total
#Net current asset represents net of receivables and payables for investments held.**The exposure to money market instruments may be increased to 100%, keeping in view market conditions, market opportunities, and political, economic and other factors, depending on the perception of the Investment Manager.
Returns less than or equal to 1 year are absolute. Returns greater than 1 year are compounded annualised growth rate (CAGR), Past performance is not indicative of future performance
PerformancePeriod 1 Month 6 Months 1 Year 2 Years 3 Years Inception
Fund
Benchmark
Asset Class Rating Profile
*Others includes Equity, CBLO, Net receivable/payable and FD
Description
SFIN Number ULGF01218/04/11GRSHTRDE02116
Launch Date 21-Jun-11
Face Value 10
Risk Profile Low
Benchmark CRISIL Short Term Bond Fund Index
Fund Manager Name Parimal Heda
Number of funds managed by fund manager:
Equity -
Debt 26
Hybrid 23
NAV as on 31-May-17 16.0978
AUM (Rs. Cr) 0.71
Equity -
Debt 96.88%
Net current asset 3.12%
Fund Details
Top 10 Sectors
Portfolio
Sovereign 45.94%
7.46% GOI 2017 (M/D. 28/8/2017) SOV 45.94%
Money Market, Deposits & Other 54.06%
Total 100.00%
Company/Issuer Rating Exposure (%)
0.43% 2.35% 11.03% 9.58% 9.93% 8.33%
0.80% 2.59% 8.82% 8.69% 9.07% 9.02%
Quantitative Indicators Modified Duration 0.11
Bajaj Allianz Life Insurance Company LtdBajaj Allianz Life Insurance Company Ltd
Note : ‘Financial & insurance activities’ sector includes exposure to ‘Fixed Deposits’ & ‘Certificate of Deposits’.
14
96.88
3.12
100.00
Growth of Rs. 100
90
100
110
120
130
140
150
160
170
Jun-11 Aug-12 Oct-13 Dec-14 Mar-16 May-17
Fund Benchmark
96.88%
0%
20%
40%
60%
80%
100%
120%
Go
vern
men
t o
f In
dia
54.06%
45.94%
Others Sovereign
50.94%
45.94%
3.12%
CBLO G-Secs Net Receivables

Corporate Bond 31.50%
7.60% NHAI Taxable Bond Series - V - (MD 18/03/2022) AAA 3.47%
7.47% Power Finance Corporation NCD (MD 16/09/2021) AAA 3.31%
8.25% Tata Sons Ltd NCD (MD 23/03/2022) AAA 1.99%
7.40% Power Finance Corporation (MD 30/09/2021) AAA 1.65%
7.52% RECL Ltd NCD (MD 07/11/2026) AAA 1.64%
8.75% Bajaj Finance Ltd NCD (MD 14/08/2026) AAA 1.47%
8.63% IDFC Bank LTD NCD (MD 18/02/2020) AAA 1.28%
7.79% Kotak Mahindra Prime Ltd NCD (MD 07/06/2019) AAA 1.25%
7.17% NHAI Taxable Bond Series - III - (MD 23/12/2021) AAA 1.23%
8.12% ONGC Mangalore Petrochemicals Ltd NCD (MD 10/06/2019) AAA 1.12%
Others 13.09%
Sovereign 62.21%
7.68% GOI (MD 15/12/2023) SOV 34.88%
6.84% GOI (MD 19/12/2022) SOV 9.06%
8.60% GOI (MD 02/06/2028) SOV 6.39%
6.97% GOI (MD 06/09/2026) SOV 5.01%
7.72% GOI (MD 26/10/2055) SOV 2.07%
8.15% GOI (MD 24/11/2026) SOV 1.47%
7.59% GOI (MD 20/03/2029) SOV 1.35%
8.20% GOI 2025 (MD 24/09/2025) SOV 0.73%
8.27% Rajasthan SPL SDL (MD 23/06/2023) SOV 0.71%
8.29% Rajasthan SPL SDL (MD 23/06/2024) SOV 0.53%
Money Market, Deposits & Other 6.29%
Total 100.00%
Fund Objective
Portfolio Allocation
To provide stable returns through investment in various fixed income securities.
Group Debt Fund-II
May 2017
Actual (%) Stated (%)
Debt and Debt related securities incl. FD 40 - 100
Money Market instrument 0 - 60
#Net Current Assets
Total
#Net current asset represents net of receivables and payables for investments held.
Returns less than or equal to 1 year are absolute. Returns greater than 1 year are compounded annualised growth rate (CAGR), Past performance is not indicative of future performance
PerformancePeriod 1 Month 6 Months 1 Year 2 Years 3 Years Inception
Fund
Benchmark
Description
SFIN Number ULGF01924/06/13GRDEBTFU02116
Launch Date 13-Sep-13
Face Value 10
Risk Profile Low
Benchmark CRISIL Composite Bond Fund Index
Fund Manager Name Parimal Heda
Number of funds managed by fund manager:
Equity -
Debt 26
Hybrid 23
NAV as on 31-May-17 14.4007
AUM (Rs. Cr) 727.06
Equity -
Debt 96.18%
Net current asset 3.82%
Fund Details
Company/Issuer Rating Exposure (%)
Portfolio
Growth of Rs. 100
1.35% -0.77% 10.91% 9.33% 10.68% 10.31%
1.34% 0.88% 10.95% 9.90% 10.67% 10.85%
Quantitative Indicators Modified Duration 4.77
Bajaj Allianz Life Insurance Company LtdBajaj Allianz Life Insurance Company Ltd
Asset Class Rating Profile
*Others includes Equity, CBLO, Net receivable/payable and FD
Top 10 Sectors
Note : ‘Financial & insurance activities’ sector includes exposure to ‘Fixed Deposits’ & ‘Certificate of Deposits’.
15
94.54
1.64
3.82
100.00
95
105
115
125
135
145
155
Sep-13 Jun-14 Mar-15 Nov-15 Aug-16 May-17
Fund Benchmark
62.61%
9.13% 8.49% 5.68% 4.98% 1.24% 1.13% 1.12% 0.77% 0.58%0%
20%
40%
60%
80%
Go
vern
men
t o
f In
dia
Fin
anci
al a
nd
Insu
ran
ceA
c�vi
�es
Fin
anci
al a
nd
Insu
ran
ceA
c�vi
�es
(In
fra)
Fin
ance
& In
sura
nce
(Ho
usi
ng
- A
AA
or
Equ
ival
ent)
Civ
il En
gin
eeri
ng
(In
fra)
Stat
e G
ove
rnm
ent
Man
ufa
ctu
re o
fEl
ectr
ical
Eq
uip
men
t
Man
ufa
ctu
re o
f C
oke
and
Refi
ned
Pet
role
um
Pro
du
cts
Elec
tric
ity,
Gas
, Ste
aman
d A
irco
nd
i�o
n S
up
ply
Man
ufa
ctu
re o
f M
oto
rV
ehic
les,
Tra
ilers
an
dSe
mi-
Trai
lers
1.57% 2.51%
27.41%
6.29%
62.21%
AA AA+ AAA Others Sovereign
1.64%0.83%
60.97%
31.50%
1.24%3.82%
CBLO FDs G-Secs NCDs SDLs Net Receivables

Fund Objective
Portfolio Allocation
To earn moderate returns.
Group Short Term Debt Fund-III
May 2017
Actual (%) Stated (%)
Debt and Debt related securities incl. FD 40 - 100
Money Market instrument 0 - 60
#Net Current Assets
Total
#Net current asset represents net of receivables and payables for investments held.
Returns less than or equal to 1 year are absolute. Returns greater than 1 year are compounded annualised growth rate (CAGR), Past performance is not indicative of future performance
PerformancePeriod 1 Month 6 Months 1 Year 2 Years 3 Years Inception
Fund
Benchmark
Description
SFIN Number ULGF02024/06/13GRSHTRDE03116
Launch Date 23-Jan-14
Face Value 10
Risk Profile Low
Benchmark CRISIL Short Term Bond Fund Index
Fund Manager Name Parimal Heda
Number of funds managed by fund manager:
Equity -
Debt 26
Hybrid 23
NAV as on 31-May-17 13.3576
AUM (Rs. Cr) 40.14
Equity -
Debt 88.31%
Net current asset 11.69%
Fund Details
Portfolio
Corporate Bond 12.01%
9.10% Dewan Housing Finance Corporation Limited (MD 16/08/2019) AAA 5.15%
8.6900% L & T FINANCE LTD (MD 13/06/2019) AA+ 2.55%
8.85% Sundaram Finance Ltd. (MD 22/12/2017) AA+ 2.26%
8.69% LIC Housing Finance Ltd NCD (MD 17/05/2019) AAA 2.05%
Sovereign 48.55%
8.12% GOI (MD 10/12/2020) SOV 38.51%
8.27% GOI (MD 09/06/2020) SOV 5.21%
7.46% GOI 2017 (M/D. 28/8/2017) SOV 4.84%
Money Market, Deposits & Other 39.44%
Total 100.00%
Company/Issuer Rating Exposure (%)
0.83% 2.50% 7.35% 7.87% 8.78% 8.10%
0.80% 2.59% 8.82% 8.69% 9.07% 9.45%
Quantitative Indicators Modified Duration 2.07
Bajaj Allianz Life Insurance Company LtdBajaj Allianz Life Insurance Company Ltd
16
75.48
12.83
11.69
100.00
Top 10 Sectors
Note : ‘Financial & insurance activities’ sector includes exposure to ‘Fixed Deposits’ & ‘Certificate of Deposits’.
Asset Class Rating Profile
*Others includes Equity, CBLO, Net receivable/payable and FD
Growth of Rs. 100
90
95
100
105
110
115
120
125
130
135
140
Jan-14 May-14 Sep-14 Jan-15 May-15 Sep-15 Jan-16 May-16 Sep-16 Jan-17 May-17
Fund Benchmark
60.88%
20.23%
7.19%
0%
20%
40%
60%
80%
Go
vern
men
t o
f In
dia
Fin
anci
al a
nd
Insu
ran
ceA
c�vi
�es
Fin
ance
& In
sura
nce
(Ho
usi
ng
- A
AA
or
Equ
ival
ent)
0.50%4.81%
7.19%
38.95%
48.55%
A1+ AA+ AAA Others Sovereign
12.33%
0.50%
14.92%
48.55%
12.01%
11.69%
CBLO CPs FDs G-Secs NCDs Net Receivables

Fund Objective
Portfolio Allocation
To provide stable returns through investment in various fixed deposits, money market Instruments and short term debt instruments.
Group Liquid Fund-II
May 2017
Actual (%) Stated (%)
Debt and Debt related securities incl. FD 0 - 60
Cash, Mutual Funds 0 - 60
Money Market instrument 40 - 100
#Net Current Assets
Total
#Net current asset represents net of receivables and payables for investments held.
Returns less than or equal to 1 year are absolute. Returns greater than 1 year are compounded annualised growth rate (CAGR), Past performance is not indicative of future performance
PerformancePeriod 1 Month 6 Months 1 Year 2 Years 3 Years Inception
Fund
Benchmark
Asset Class Rating Profile
*Others includes Equity, CBLO, Net receivable/payable and FD
Description
SFIN Number ULGF02124/06/13GRLIQUFU02116
Launch Date 13-Sep-13
Face Value 10
Risk Profile Very Low
Benchmark CRISIL Liquid Fund Index
Fund Manager Name Parimal Heda
Number of funds managed by fund manager:
Equity -
Debt 26
Hybrid 23
NAV as on 31-May-17 12.7254
AUM (Rs. Cr) 3.40
Equity -
Debt 99.63%
Net current asset 0.37%
Fund Details
Top 10 Sectors
Money Market, Deposits & Other 100.00%
Total 100.00%
Company/Issuer Rating Exposure (%)
Portfolio
0.52% 3.05% 7.04% 7.60% 7.91% 6.70%
0.59% 3.23% 6.96% 7.43% 7.89% 8.31%
Quantitative Indicators Modified Duration 0.04
Bajaj Allianz Life Insurance Company LtdBajaj Allianz Life Insurance Company Ltd
Note : ‘Financial & insurance activities’ sector includes exposure to ‘Fixed Deposits’ & ‘Certificate of Deposits’.
17
-
-
99.63
0.37
100.00
80.76%
13.00%5.88%
0%
20%
40%
60%
80%
100%
Go
vern
men
t o
f In
dia
Fin
anci
al a
nd
Insu
ran
ceA
c�vi
�es
Fin
ance
& In
sura
nce
(Ho
usi
ng
- A
AA
or
Equ
ival
ent)
18.87%
41.51%
39.62%
A1+ Others Sovereign
41.14%
8.60%10.27%
39.62%
0.37%
CBLO CDs CPs Tbills Net Receivables

Corporate Bond 6.77%
8.57% India Bulls Housing Finance Ltd (MD 30/03/2022) AAA 6.63%
0% Rural Electrification Corporation Ltd (MD 15/12/2020) AAA 0.14%
Sovereign 67.80%
7.68% GOI (MD 15/12/2023) SOV 32.71%
8.60% GOI (MD 02/06/2028) SOV 28.48%
6.97% GOI (MD 06/09/2026) SOV 6.37%
6.84% GOI (MD 19/12/2022) SOV 0.24%
Money Market, Deposits & Other 25.43%
Total 100.00%
Fund ObjectiveTo provide stable returns through investment in various fixed income securities.
Group Debt Fund-III
May 2017
Returns less than or equal to 1 year are absolute. Returns greater than 1 year are compounded annualised growth rate (CAGR), Past performance is not indicative of future performance
PerformancePeriod 1 Month 6 Months 1 Year 2 Years 3 Years Inception
Fund
Benchmark
Asset Class Rating Profile
*Others includes Equity, CBLO, Net receivable/payable and FD
Description
SFIN Number ULGF02202/03/15GRDEBTFU03116
Launch Date 29-Sep-16
Face Value 10
Risk Profile Low
Benchmark CRISIL Composite Bond Index
Fund Manager Name Parimal Heda
Number of funds managed by fund manager:
Equity -
Debt 26
Hybrid 23
NAV as on 31-May-17 10.5381
AUM (Rs. Cr) 63.55
Equity -
Debt 96.56%
Net current asset 3.44%
Fund Details
Top 10 Sectors
Growth of Rs. 100
Portfolio Allocation
Actual (%) Stated (%)
Debt and debt related securities incl. Fixed deposits 60 - 100
Money market instruments, Cash, Mutual funds 0 - 40
#Net Current Assets
Total
#Net current asset represents net of receivables and payables for investments held.
Company/Issuer Rating Exposure (%)
Portfolio
1.48% 0.58% - - - 8.16%
1.34% 0.88% - - - 7.54%
Quantitative Indicators Modified Duration 4.53
Bajaj Allianz Life Insurance Company LtdBajaj Allianz Life Insurance Company Ltd
Note : ‘Financial & insurance activities’ sector includes exposure to ‘Fixed Deposits’ & ‘Certificate of Deposits’.
18
76.12
20.44
3.44
100.00
98
100
102
104
106
108
110
Sep-16 Oct-16 Nov-16 Dec-16 Jan-17 Feb-17 Mar-17 Apr-17 May-17
Fund Benchmark
88.24%
6.63% 1.56% 0.14%0%
20%
40%
60%
80%
100%
Go
vern
men
t o
f In
dia
Fin
ance
& In
sura
nce
(Ho
usi
ng
- A
AA
or
Equ
ival
ent)
Fin
anci
al a
nd
Insu
ran
ceA
c�vi
�es
Fin
anci
al a
nd
Insu
ran
ceA
c�vi
�es
(In
fra)
20.44%
1.56%
67.80%
6.77%
3.44%
CBLO FDs G-Secs NCDs Net Receivables
6.77%
25.43%
67.80%
AAA Others Sovereign

Fund Objective
Group Balanced Gain Fund
May 2017
Returns less than or equal to 1 year are absolute. Returns greater than 1 year are compounded annualised growth rate (CAGR), Past performance is not indicative of future performance
PerformancePeriod 1 Month 6 Months 1 Year 2 Years 3 Years Inception
Fund
Benchmark
Asset Class Rating Profile
*Others includes Equity, CBLO, Net receivable/payable and FD
Description
SFIN Number ULGF01810/05/13GRBALCEDGA116
Launch Date 25-Mar-14
Face Value 10
Risk Profile High
Benchmark CRISIL Balanced Fund - Aggressive Index
Fund Manager Name Sampath Reddy, Reshma Banda, Parimal Heda
Number of funds managed by fund manager:
Equity 18 27 -
Debt - - 26
Hybrid 8 23 23
NAV as on 31-May-17 13.6645
AUM (Rs. Cr) 1.44
Equity 24.02%
Debt 74.77%
Net current asset 1.21%
Fund Details
Equity 24.02%
HDFC Bank Limited Financial and Insurance Activities 1.89%
ITC Limited Manufacture of Tobacco Products 1.79%
Kotak Mahindra Bank Limited Financial and Insurance Activities 1.78%
Yes Bank Limited Financial and Insurance Activities 1.62%
IndusInd Bank Limited Financial and Insurance Activities 1.31%
Nestle India Limited Manufacture of Food Products 1.06%
MphasiS Limited Computer Programming, Consultancy and Related Activities 0.94%
Johnson Controls - Hitachi Air Manufacture of Machinery and 0.90%Conditioning India Limited Equipment N.E.C.
Hindalco Industries Limited Manufacture of Basic Metals 0.87%
HCL Technologies Limited Computer Programming, Consultancy and Related Activities 0.86%
Others 11.01%
Money Market, Deposits & Other 75.98%
Total 100.00%
Company/Issuer Sector/Rating Exposure (%)
Portfolio
Top 10 Sectors
Growth of Rs. 100
Portfolio Allocation Actual (%) Stated (%)
Equity and Equity related securities 0 - 60
Debt and Debt related securities 40 - 100
Money Market instrument/Mutual Funds 40 - 100
#Net Current Assets
Total
#Net current asset represents net of receivables and payables for investments held.
To provide capital appreciation, subject to minimum guaranteed unit price at fund closure. The fund strategy would be to achieve potential upside by investing adequately in debt securities, equities, mutual funds and highly rated debentures.
0.62% 9.73% 13.96% 8.46% 10.54% 10.29%
2.69% 11.14% 15.61% 8.11% 10.46% 12.34%
Sampath Reddy Reshma Banda Parimal Heda
Bajaj Allianz Life Insurance Company LtdBajaj Allianz Life Insurance Company Ltd
Note : ‘Financial & insurance activities’ sector includes exposure to ‘Fixed Deposits’ & ‘Certificate of Deposits’.
19
24.02
-
74.77
1.21
100.00
95
105
115
125
135
145
155
165
175
Mar-14 Sep-14 Feb-15 Jul-15 Jan-16 Jun-16 Nov-16 May-17
Fund Benchmark
74.77%
6.60% 3.06% 2.13% 1.79% 1.56% 1.48% 1.12% 1.09% 1.06%0%
20%
40%
60%
80%
Go
vern
men
t o
f In
dia
Fin
anci
al a
nd
Insu
ran
ceA
c�vi
�es
Co
mp
ute
rP
rogr
amm
ing,
Co
nsu
ltan
cy a
nd
Rel
ated
Ac�
vi�
es
Man
ufa
ctu
re o
fC
hem
ical
s an
d C
hem
ical
Pro
du
cts
Man
ufa
ctu
re o
f To
bac
coP
rod
uct
s
Man
ufa
ctu
re o
fM
ach
iner
y an
dEq
uip
men
t N
.E.C
.
Man
ufa
ctu
re o
f B
asic
Met
als
Man
ufa
ctu
re o
f M
oto
rV
ehic
les,
Tra
ilers
an
dSe
mi-
Trai
lers
Pu
blis
hin
g A
c�vi
�es
Man
ufa
ctu
re o
f Fo
od
Pro
du
cts
100.00%
Others
74.77%
24.02%
1.21%
CBLO Equity Net Receivables

Fund Objective
Group Balanced Gain Fund II
May 2017
Asset Class Rating Profile
*Others includes Equity, CBLO, Net receivable/payable and FD
Description
SFIN Number ULGF02402/03/15GRBALCGA02116
Launch Date 25-April-17
Face Value 10
Risk Profile High
Benchmark CRISIL Balanced Fund - Aggressive Index
Fund Manager Name Sampath Reddy, Reshma Banda, Parimal Heda
Number of funds managed by fund manager:
Equity 18 27 -
Debt - - 26
Hybrid 8 23 23
NAV as on 31-May-17 10.0846
AUM (Rs. Cr) 0.35
Equity -
Debt 94.19%
Net current asset 5.81%
Fund Details
Sovereign 71.38%
7.80% GOI (MD 11/04/2021) SOV 71.38%
Money Market, Deposits & Other 28.62%
Total 100.00%
Company/Issuer Sector/Rating Exposure (%)
Portfolio
Top 10 Sectors
Portfolio Allocation Actual (%) Stated (%)
Equity and Equity related securities 0 - 60
Debt and Debt related securities 40 - 100
Money Market instrument/Mutual Funds 40 - 100
#Net Current Assets
Total
#Net current asset represents net of receivables and payables for investments held.
To provide capital appreciation, subject to minimum guaranteed unit price at fund closure. The fund strategy would be to achieve potential upside by investing adequately in debt securities, equities, mutual funds and highly rated debentures.
Sampath Reddy Reshma Banda Parimal Heda
Bajaj Allianz Life Insurance Company LtdBajaj Allianz Life Insurance Company Ltd
Note : ‘Financial & insurance activities’ sector includes exposure to ‘Fixed Deposits’ & ‘Certificate of Deposits’.
20
-
71.38
22.81
5.81
100.00
28.62%
71.38%
Others Sovereign
22.81%
71.38%
5.81%
CBLO G-Secs Net Receivables
94.19%
0%
20%
40%
60%
80%
100%
Go
vern
men
t o
f In
dia
Returns less than or equal to 1 year are absolute. Returns greater than 1 year are compounded annualised growth rate (CAGR), Past performance is not indicative of future performance
PerformancePeriod 1 Month 6 Months 1 Year 2 Years 3 Years Inception
Fund
Benchmark
0.83% - - - - 9.23%
2.69% - - - - 27.53%
Growth of Rs. 100
95
96
97
98
99
100
101
102
103
104
105
26-Apr-17 3-May-17 10-May-17 17-May-17 24-May-17 31-May-17
Fund Benchmark