Embed Size (px)
Citation preview

Monographie BIPM-6
Thermodynamic Stability
of Radioactivity Standard Solutions
Marie-Gabrielle Iroulart
April 2007
BUREAU INTERNATIONAL DES POIDS ET MESURES
Pavillon de Breteuil, F-92310 SÈVRES

Édité par le BIPM, Pavillon de Breteuil F-92312 Sèvres Cedex France Imprimé par Reproduction Service ISBN 92-822-2220-9

3
Preface
This monograph is one of a series published by the Bureau International des Poids et Mesures (BIPM) on behalf of the Comité Consultatif des Rayonnements Ionisants (CCRI). The aim of this series of publications is to review topics that are of importance for the
measurement of ionizing radiation and especially of radioactivity, in particular those techniques normally used by participants in international comparisons. It is hoped that these publications will prove to be useful reference volumes both for those who are already
engaged in this field and for those who are approaching such measurements for the first time.
The purpose of this monograph, number 6 in the series, is to present the results of an extensive bibliographic search by the LNE-LNHB into the stability of radioactive solutions in glass vessels. This monograph is complementary to Monographie BIPM-1, and it is envisaged
that the publication of this monograph will stimulate further monographs on topics related to source preparation and storage.
G. Moscati A.J. Wallard
President of the CCRI Director of the BIPM
4
ACKNOWLEDGEMENTS
I would like to express our gratitude to Dr Jacques Ly of the CEA (DPC-DEN) at Saclay. We are particularly thankful for his excellent advice and his help in proofreading the text.
We would like to thank Professor Eric Simoni of the Radiochemistry Group of the Nuclear Physics Institute at Orsay (South-Paris University).
We are especially grateful to Patrick Jollivet of the CEA (DIEC-DEN) at Valrho.
We wish to acknowledge the contribution by Dr Isabelle Girandier of the Conservatoire National des Arts et Métiers in Paris.
We are particularly indebted to Dr Guy Ratel of the Bureau International des Poids et Mesures (BIPM).
Finally, we wish to express our particular appreciation of the support provided by Jean-Louis Picolo and also Bruno Chauvenet and Dr Philippe Cassette of the LNE-LNHB.

5
CONTENTS
INTRODUCTION ...................................................................7
I. CHEMICAL PROPERTIES OF SOLUTIONS.............................8
I.1. SOLUBILIZATION MEDIA ..................................................................8
I.1.1. Ultra-pure water ..................................................................................8
I.1.2. Acid media ..........................................................................................9
I.2. CARRIERS ................................................................................. 10
I.2.1. Concentration.................................................................................... 11
I.2.2. Oxidation state of the radioactive element and the carrier..................... 13
II. METHOD OF PREPARATION, PACKAGING AND STORAGE.13
II.1. GLASS AMPOULES....................................................................... 13
II.1.1. Structure of glass ............................................................................. 16
II.1.2. Mechanisms of dissolution of glass..................................................... 18
II.1.3. Sorption at the solid-solution interface ............................................... 28
II.2. QUARTZ AMPOULES .................................................................... 38
II.3. CLEANING AND PACKAGING OF GLASS AMPOULES.................................. 42
II.3.1. Cleaning solutions ............................................................................ 43
II.3.2. Internal surface coatings................................................................... 45
II.3.3. Treatment with carrier solutions ........................................................ 46
CONCLUSION .....................................................................47
REFERENCES......................................................................50


7
INTRODUCTION The basic requirement when preparing radioactivity standard solutions is to guarantee the concentration of a radionuclide1 or a radioelement2, expressed in the form of activity concentration (Ac = A/m (Bq/g), with A: activity and m: mass of solution).
Knowledge of the law of radioactive decay and the half-life of a radionuclide or radioelement makes it possible to determine the activity concentration at any time, and this must be confirmed subsequently by measurement.
Furthermore, when radioactivity standard solutions are prepared, it is necessary to establish optimal conditions of thermodynamic stability of the standard solutions.
Radioactivity standard solutions are prepared by metrology laboratories from original solutions obtained from a range of suppliers.
These radioactivity standard solutions must enable preparation of liquid and/or solid radioactivity standard sources of which measurement by different methods can determine, at a given instant, the activity concentration of the radionuclide or radioelement present in the solution.
There are a number of constraints associated with the preparation of such sources. Here only those that relate to the physical and chemical properties of the standard solution are considered, and therefore need to be taken into account when preparing a radioactivity standard solution.
These issues are considered in this document in accordance with the following plan:
• A first part devoted to the chemical properties of the solutions:
- the solubilization media: ultra-pure water and acid media,
- the carriers: concentration, oxidation state of the radioactive element and the carrier element.
• A second part describing the methodology of the preparation, packaging and storage of standard solutions:
- glass ampoules: the structure of glasses, the mechanisms of their dissolution, the sorption phenomenon at the solid-solution interface,
- quartz ampoules,
- cleaning and packaging: cleaning solutions, internal surface coatings and treatment of the material used with a carrier solution.
• A conclusion, including an assessment of the main points covered and proposals concerning further studies required to eliminate the remaining uncertainties.
1 A radionuclide is a radioactive isotope of an element having also stable isotopes. 2 A radioelement is an element having only radioactive isotopes.

8
I. CHEMICAL PROPERTIES OF SOLUTIONS
I.1. Solubilization media
I.1.1. Ultra-pure water
The properties of the water used for preparing radioactivity standard solutions are particularly important because water can constitute the solubilization medium itself or be used as a basis for other solubilization media (different acids at distinct concentrations).
The water must remain ultra-pure despite any variations in the quality of the water supply due to geographical, geological or seasonal factors. For instance, organic contamination of surface water can be greater in winter than in summer. Particularly in autumn and winter, dead leaves and decomposing plant material can produce high concentrations of organic matter occurring in water reservoirs. Also, the temperature of the water supply is not the same in summer and winter, and the conductivity-meters of the purification equipment automatically compensate for temperature and thus make it possible to obtain ultra-pure water with a constant resistivity of 18.2 MΩ.cm (Millipore, 2002; Elga-Vivendi-waters, 2002).
When ultra-pure water with a resistivity of 18.2 MΩ.cm is in contact with the air, it is immediately contaminated by the absorption of oxygen (O2) and carbon dioxide (CO2) gases.
These two gases can react with metal ions to form insoluble compounds, depending on the pH:
• Oxygen dissolved in water can result in oxidation of a metal ion if it possesses a number of oxidation states. The ion may be oxidized to a particular state in which it can precipitate as an insoluble hydroxide or oxide (Kragten, 1978).
• The carbon dioxide which is absorbed in ultra-pure water in contact with the air behaves as a weak acid. The carbon dioxide dissolved in the water forms anions HCO3
- and CO32- depending on the chemical equilibria at 20 °C as follows (Plummer
and Busenberg, 1982):
CO2 (gas) CO2 (aq.) log K = -1.42
CO2 (aq.) + H2O HCO3- + H+ log K = -6.38
CO2 (aq.) + H2O CO32- + 2 H+ log K = -16.76
log K: logarithm of the equilibrium constant for reaction.
Figure 1 shows the contamination of ultra-pure water with carbon dioxide from the atmosphere at a temperature of 20 °C. The resistivity of the ultra-pure water (expressed in MΩ.cm) is shown as a function of time of exposure to air. At moment t = 0, ultra-pure water was collected and its resistivity was found to be 18.2 MΩ.cm. An hour later, the resistivity dropped to 4 MΩ.cm (Millipore, 2002). It is to be noted that the absorption reaction is relatively rapid. Ultra-pure water is also the basis for different solubilization media preparation. Its purity makes it possible to avoid certain phenomena that can occur or develop in solutions over time.

9
Figure 1
Contamination of ultra-pure water with carbon dioxide from the atmosphere at 20 °C.
Measurement of the resistivity of the ultra-pure water (expressed in MΩ
.cm) as a function of
time of exposure to air. From (Millipore, 2002) by permission.
I.1.2. Acid media
The observation was made that, for most of the standard solutions prepared by the Henri Becquerel National Laboratory, most of the solubilization media were acid media of different concentrations. The effect of the concentration of acids on corrosion of the glass ampoules in which the solutions are generally stored is considered later (paragraph II.1.2). The extremely corrosive effect of alkaline solutions is also covered.
An example is included that shows the importance of the concentration of acid solubilization medium for the results of activity concentration measurements made in an ionization chamber (liquid sources in sealed 5 mL ampoules). Change in the medium can result in a change in the self-absorption of low-energy photons, which modifies the detection yield of the ionization chamber used for measuring the activity concentration of certain radionuclides (such as 133Ba).
Measurement of four sources consisting of a 133Ba solution of approximately 20 kBq/g with different chemical compositions was carried out in an ionization chamber sensitive to x-rays. The chemical compositions of the sources were as follows:
1. 15 µg/g of BaCl2 in 0.1 M HCl,
2. 150 µg/g of BaCl2 in 0.1 M HCl,
3. 15 µg/g of BaCl2 in 1 M HCl,
4. 150 µg/g of BaCl2 in 1 M HCl.

10
The ionization chamber was calibrated with 133Ba solution in a LMRI3 type ampoule (5 mL) with the chemical composition of BaCl2 in 0.1 M HCl. The carrier concentration of this solution was unknown.
The activity concentration values measured and those calculated on the basis of the dilution are shown in Table 1.
Analysis of the results shows that difference in concentration of the carrier did not affect the ionization chamber measurement. However, a change in the molar concentration of the hydrochloric acid from 0.1 M to 1 M resulted in underestimating the measured activity concentration by around 2 %. This underestimation can be explained by the increase in the self-absorption of the low-energy photons emitted by the 133Ba in the more concentrated acid medium.
Chemical compositions of the sources measured
Measured activity concentration
(kBq/g)
Uncertainty
(%)
Dilution activity concentration
(kBq/g)
Uncertainty (%)
Difference (%)
15 µg/g of BaCl2
0.1 M HCl 21.83 0.21 21.72 0.40 0.5
150 µg/g of BaCl2 0.1 M HCl 20.54 0.22 20.44 0.40 0.5
15 µg/g of BaCl2
1 M HCl 19.45 0.21 19.84 0.40 2.0
150 µg/g of BaCl2 1 M HCl 19.52 0.21 19.93 0.40 2.0
Table 1
Activity concentration of 133Ba solution varying with: • carrier concentration: 15 µg/g of BaCl2 and 150 µg/g of BaCl2,
• molarity of the hydrochloric acid solution: 0.1 M and 1 M.
Measurements made in an ionization chamber sensitive to x-rays. The system was calibrated with a solution of BaCl2 in 0.1 M HCl. The carrier concentration of this solution was unknown.
I.2. Carriers
As a general rule, the molar concentrations of the radionuclides in solution are very low. For instance, an activity concentration of 800 kBq/g is equivalent to a concentration of ~ 10-8 M of 54Mn [T1/2 = (312.13 ± 0.03) days] and a concentration of ~ 10-7 M of 133Ba [T1/2 = (10.540 ± 0.006) years].
The solutions are very dilute and adsorption of radioactive ions on the surfaces of containers can be substantial. Adding a carrier makes it possible to reduce the concentration losses due to adsorption on the container walls and thus keep the radioactive ion in solution.
Use of a carrier reduces the final specific activity (activity per element unit mass).
3 The LMRI (Ionising Radiation Measurement Laboratory) and the LPRI (Ionising Radiation Primary Laboratory) were amalgamated for form the LNHB (Henri Becquerel National Laboratory) in July 1999.

11
The carrier of a radionuclide1 is generally made of stable isotopes of the chemical element.
The carrier of a radioelement2 (if its concentration is very low) can be a radioactive isotope with a long half-life or a chemically homologous element in the periodic chart (for instance Barium for Radium, Cesium for Francium, or Tellurium for Polonium (Adloff and Guillaumont, 1993).
I.2.1. Concentration
Concentration of the carrier must be selected on the basis of two main criteria:
• for liquid standard sources, it must be sufficiently high to ensure stability of the solution by minimizing adsorption on the wall of the container,
• for solid standard sources, it must not be excessive in order to reduce radiation self-absorption phenomena in the deposit of salts resulting from evaporation of the solution.
A suitable compromise is therefore required.
The carrier concentration is expressed in micrograms of salt (with the detailed chemical formula) per gram of solution (µg/g). This results from the LNHB practice of dilutions and sample-takings by gravimetry, which makes it possible to minimize uncertainties with regard to volumetry.
The importance of the carrier concentration in the results of measurement of activity concentration can be illustrated by the following example: the activity concentration of a 204Tl solution was measured in the frame of BIPM/CCRI (II)4 international comparisons in 1994 (during a preliminary exercise) and in 1997.
The LMRI3 supplied the two necessary original solutions to the BIPM. The solutions were then diluted, packed in ampoules and distributed to the participants by the BIPM.
In both cases (in 1994 and 1997), the nominal activity concentration of the solution prepared by the BIPM4 was around 70 kBq/g (Ratel, 1999; Ratel and Cassette, 1999).
However, although their chemical composition was identical, the concentration in the carrier varies greatly, being 30 µg/g of TlCl in 0.1 M HCl in 1994 and 260 µg/g of TlCl in 0.1 M HCl in 1997.
During the international comparison in 1997, it was observed that the results of measurement by liquid scintillation were better than those obtained with proportional counters.
It was also noticed that, compared to the international comparison in 1994, the variability of the 1997 results was substantial. The main explanation of the difference was excessive concentration of the carrier in 1997 (260 µg/g), as compared to 1994 (30 µg/g).
Increasing the carrier concentration by some 9 times resulted in increasing the radiation self-absorption for the solid sources measured with proportional counters (Ratel and Cassette, 1999).
4 BIPM: Bureau International des Poids et Mesures. CCRI (II): Consultative Committee for Ionizing Radiation (Section II).

12
If the data sheets of the original solutions supplied by the LMRI are compared, it is found that the carrier concentration effectively changed from 30 µg/g of TlCl in 0.1 M HCl for the preliminary comparison in 1994 to 260 µg/g of TlCl in 0.1 M HCl in the comparison in 1997, but the activity concentrations were originally very different:
• 712 kBq/g on 24/01/1994,
• 12.9 MBq/g on 10/10/1996.
In both cases, the 70 kBq/g standard solutions were prepared by adding identical carrier concentrations to those of the original solutions.
The reason why the carrier concentrations varied so greatly between the two original solutions supplied by the LMRI is that the initial carrier concentrations in the “parent solutions” used to prepare the original solutions by dilution can be very high but can also vary greatly from one supply to another.
This is because the radionuclides are frequently obtained by (n, γ) neutronic activation of elements (as is the case of 204Tl). The activated targets are solid chemically-pure pieces of the element required. However, this element can contain several stable isotopes also able to be activated. Neutronic activation of each isotope depends on the effective cross-section of the activation reaction, the radioactive half-life of the radionuclide obtained, the neutron flux and the duration of activation.
Even though the activated target mass is optimized, there still remains a substantial inactivated fraction. This explains the non-negligible presence of the carrier in the parent solution obtained by dissolution of the solid target in acid, as well as the different carrier concentrations in the two original solutions.
Two inferences can be drawn from this:
• Firstly, increasing the carrier concentration for a given activity concentration, results in increasing of the self-absorption of the radiation emitted by certain radionuclides in solid sources made for measuring the activity concentration of standard solutions. This phenomenon can be detrimental to the quality of the measurements made.
• Secondly, the carrier concentrations in the original solutions provided by different suppliers can be extremely high and very variable from one supply to another, depending on the activity concentration supplied and the mode of production of the radionuclide (for example (n, γ) neutronic activation). Preliminary determination of the carrier concentration of the original solution before dilution is therefore recommended.
In practice, the carrier concentration is determined by considering the radionuclide production method. It can be very high if the radionuclide is produced by (n, γ) neutron activation. In this case, if the pre-existing concentration in the original solution from the supplier is sufficiently high, adding a carrier during dilution would not be necessary. In the
opposite case, the carrier concentration is calculated using the ratio molesactive
molesinactive and the
value chosen to minimize the relative adsorption of the radioactive ion on the container walls. This ratio is established by taking into account the half-life and atomic weight of the radionuclide. The same ratio, determined for a solution with an activity concentration of ~ 1 MBq/g, is applied to all standard solutions of this radionuclide prepared in the laboratory, whatever the activity concentration (Iroulart, 2006).

13
I.2.2. Oxidation state of the radioactive element and the carrier
It is to be noted that, during preparation of a radioactivity standard solution, the more stable oxidation state of the element (if there are many) and its chemical form at the pH established by the solubilization medium are determining factors in establishing the chemical stability of the standard solutions. The same oxidation state and chemical form must be those of the carrier, added in the form of a pure salt. For example, the oxidation level of thallium (I) is considered in the preparation of standard solutions of 204Tl (Ratel and Cassette, 1999) and 201Tl (Ratel and Michotte, 2004).
II. METHOD OF PREPARATION, PACKAGING AND
STORAGE
II.1. Glass ampoules
NOTE: The glass ampoules usually used by the LNHB are referred to as “5 mL LMRI ampoules”. These constitute the containers for:
o radioactivity standard sources measured in ionization chambers, o long-term storage of radioactivity standard solutions.
In the past, large numbers of these ampoules were ordered by the LMRI, to its own specifications and for its own use. The LMRI’s supplier was the Société Française d’Ampoules Mécaniques, which now belongs to the SCHOTT group. The latter supplies glass originating from Germany. The ampoules are produced in France to order by “drawing”.
According to SCHOTT, glass of the “5 mL LMRI ampoules”, specified by the LMRI as being “colourless neutral borosilicate glass” corresponds to their product “FIOLAX® – clear”.
A comparison was made between the chemical compositions of the glass of the current ampoules with that used by some counterparts, in order to choose the composition of the glass to be specified for new supplies of ampoules.
This is because, in long-term storage, a number of phenomena occur at the glass surface in contact with the solution, and must be taken into consideration. These interactions depend on the nature of the ampoule itself, that is, its chemical composition (Adams, 1972).
A comparison of NIST/SIR, NPL and CBNM ampoules made by Sibbens (1991), provides information on the origins of the three types of ampoules encountered:
- Those of the NIST/SIR, manufactured by KIMBLE GLASS in the USA, and used by the NIST (National Institute for Standards and Technology, USA) and also by the BIPM for the International Reference System (SIR).
- Those of the CBNM (Central Bureau for Nuclear Measurements, Belgium), also produced by KIMBLE GLASS, with the same specifications as the NIST/SIR ampoules.
- Those of the NPL (National Physical Laboratory, UK), of which the chemical composition is not indicated in the publication.

14
KIMBLE GLASS belongs to the KIMBLE-KONTESS group. This manufacturer produces borosilicate glass under the tradename “KIMAX®” (Kimble Kontess, 1996).
According to the Adams publication (1972) it is possible to identify the different types of glass. These notably include the borosilicates with their tradenames and classifications as per ASTM E 438-90 (1990). This is summarized in Table 2.
In Table 2 it can be seen that the KIMBLE-KONTESS product KIMAX® corresponds to two Type I glass compositions: KIMAX KG-33® of Class A and KIMAX N51A® of Class B.
According to ASTM E 438-90 (1990), the difference between the composition of “Type I” glass Classes A and B is indicated in Table 3. Class A is designated “borosilicate” while Class B is designated “alumino-borosilicate”.
According to the same specification, the physical properties of glass of Classes A and B are also different (ASTM E 438-90, 1990).
From the NIST, information was obtained about the chemical composition of the glass used for the ampoules made at their request by KIMBLE GLASS in 1976. It can be observed that the glass of these ampoules, containing less than 2.5 % of barium (Ba) (preferably 2.25 %), less than 0.02 % of lead oxide (PbO) and other heavy elements only present in trace amounts, corresponds to glass of Type I.
TYPE TRADENAME USE CLASSIFICATION
Borosilicate A
KIMAX KG-33 PYREX
CORNING 7740 DURAN 50
HYSYL SOLIDEX
Chemical labware including reagent bottles, some vials
and ampoules
Type I Class A
Borosilicate B KIMAX N51A
CORNING 7800 NEUTRAGLAS
Pharmaceutical ampoules and vials,
some chemical glassware
Type I Class B
Table 2
Identification of borosilicate glass in the Adams publication (1972), its classification in accordance with the American regulations is the same as that corresponding to ASTM E 438 – 90 (1990). Adams publication (1972). Copyright (1972). Reprinted by permission of Marcel Dekker Inc. via the Copyright Clearance Center.
Table 3 indicates the chemical compositions of Type I glasses corresponding to ASTM E 438 - 90 (1990) and gives information on the percentages by mass of barium oxide (BaO):
- in trace amounts for borosilicate glass of Class A, - of 0 to 2 % for alumino-borosilicate glass of Class B.
Consequently, the chemical composition of the ampoules made by KIMBLE GLASS for the NIST, BIPM and CBNM would appear to correspond to the following types of glass:
- Type I, Class B to ASTM E 438 – 90 (1990) designated “alumino-borosilicate” (see Table 3).
- The tradename “KIMAX N51A®”, according to the contents of Table 2, mainly intended for pharmaceutical ampoules (Adams, 1972).

15
Type I, Class A BOROSILICATE
GLASS Weight %
Type I, Class B ALUMINO-BOROSILICATE
GLASS Weight %
Major constituents approximate
SiO2 81 73
B2O3 13 10
Al2O3 2 7
BaO see below 0 – 2
CaO see below 1
Na2O 4 6
K2O see below 1
Trace constituents maximum
As2O3 + Sb2O3 0.005 0.1
PbO 0.1 0.1
MgO 0.1 0.3
ZnO 0.1 0.1
CaO 0.1 see above
K2O 0.75 * see above
All other constituents maximum
0.2 1
* Each manufacturer must publish the maximum percentage in his glass because certain limited applications require a level under 0.1 %.
Table 3
Chemical requirements of Type I glasses corresponding to ASTM E 438 – 90 “Standard Specification for Glasses in Laboratory Apparatus”. Reprinted with permission from (ASTM E 438 – 90, 1990), copyright ASTM International, 100 Barr Harbor Drive, West Conshohocken, PA 19428. According to Adams (1972), ampoules are often made from Type I, Class B glass. This makes it possible to avoid the phase separation which can be caused by incorrect annealing of Class A borosilicate glass. This results in substantial loss of chemical resistance if the glass is kept at between annealing and softening temperatures. This phenomenon can occur when ampoules are flame reworked in manufacturing.
The chemical compositions of glasses that would be used for ampoules: from NIST, BIPM and CBNM (KIMAX N51A®) (Kimble Kontess, 1996) and those of the LMRI (FIOLAX®) with regard to glass of Type I, Class B to ASTM E 438 – 90 (1990) were then compared. In both cases it would appear to be “alumino-borosilicate” glass and not “borosilicate” glass.
This finding makes allowance for any concentrations there may be in the components of the glass. According to Adams (1972), concentrations can vary from one manufacturer to another, and over time in the glass of the same manufacturer. Other elements can be present in low concentrations (usually less than 0.1 %). It is also possible for glasses of different compositions to be melted in the same tank, resulting in the presence of contaminants at various concentrations, generally in trace quantities (see Table 3).
In practice, the degrees of contamination of different glasses can vary, the first use glass (non-recycled) must therefore be used.

16
There are also other glasses designated “reference nuclear glasses” which are used in France for the vitrification of high-level nuclear waste. Their chemical composition has been studied and modified as necessary, and is different from that of the ampoules that are used at the LNHB, however the nuclear glasses are also sodium alumino-borosilicate glasses (Jacquet-Francillon, 1994). Pure nuclear glass matrices have been studied and characterized and the corrosion of a nuclear glass matrix as a function of the pH of the solution, which is described in paragraph II.1.2, will be examined.
II.1.1. Structure of glass
In general, three classes of oxides are considered to be suitable for making glass:
- Vitreous network formers: SiO2, B2O3 and P2O5, which are oxides capable of forming glass by themselves.
- Vitreous network modifiers: these are alkaline oxides (Na2O, K2O and Li2O) and alkaline earth oxides (CaO and BaO). The presence of modifying elements is limited, and mainly results in weakening of the structure of the glass. The introduction of an oxide of this type results in breaking of links ≡ Si – O – Si ≡
Thus with sodium, the result is:
≡ Si – O – Si ≡ + Na – O – Na → ≡ Si – O – Na + Na – O - Si ≡
- Vitreous network intermediates: depending on their coordination numbers, these “intermediates” can either be formers or modifiers. This also means that some can occupy mixed positions in the same glass. These oxides are: Al2O3, MgO and PbO.
The structure of glass is characterized by the absence of order in the distribution of the elementary structural pattern beyond 0.5 to 1 nanometers. In “alumino-borosilicates”, the structural patterns are tetrahedral (SiO4, BO4 and AlO4, the former is tetra-coordinated) or flat (BO3, the former is tri-coordinated) (Jacquet-Francillon, 1994; Advocat, 1991).
Figure 2 gives a schematic two-dimensional representation of the atomic arrangement in bulk glass (Adams, 1969).
Figure 2
Two-dimensional representation of the atomic arrangement in bulk glass. Reprinted with permission from (Adams, 1969). Copyright (1969). New Scientist.

17
The nature of the glass surface
According to Adams (1972) “the chemical composition of the surface of glass is not necessarily identical with that of the bulk”. Glassforming and later treatments can cause a glass surface to differ from the bulk.
For example, volatilization during forming, the time elapsed in storage and the method of cleaning can reduce the concentration of such elements as the alkalies and boron. This results in a silica-rich skin (see Figure 3 (a)) that is usually more resistant to chemical attack than the bulk glass.
Another example is constituted by the condensation of volatiles and local migration of glass constituents, such as might occur during the fabrication of ampoules, may increase the concentration of these elements near the heated areas. This can result in a silica-poor skin (see Figure 3 (b)) that is less resistant than the bulk glass.
As a result, there can be localized areas of low or high durability. The low-durability areas will often be manifested after chemical attack as a hazy ring around the container.
Figure 3
Diagrams of typical concentration profiles in the surface of glass (Adams, 1972). Copyright (1972). Reprinted by permission of Marcel Dekker Inc. via the Copyright Clearance Center.
(a) SiO2 enriched surface. (b) SiO2 depleted surface.

18
II.1.2. Mechanisms of dissolution of glass
Experimental work on the dissolution of a wide variety of crystallized and vitreous silicate materials has made it possible to develop and apply theories enabling modelling of the phenomena of corrosion in aqueous solutions (Advocat et al., 1993b).
According to these theories, all heterogeneous chemical reactions proceed as elementary reactions located at the solid-solution interface. The overall process consists of five stages (see Figure 4):
• (1) Transport of reagents to the surface of the glass.
• (2) Adsorption of the reagents at the surface of the glass.
• (3) Surface-chemical reaction in the strict sense.
• (4) Desorption of the reaction products from the surface.
• (5) Transport of the products far from the surface.
The overall process of the dissolution reaction is limited by one of the five stages: the slowest (if the five reactions take place in series).
Thus, when the dissolution of a reagent is limited by stages:
• (1) or (5), control is diffusion-related. Transport of material takes place within a diffuse layer. This may simply consist of a layer of water associated with the surface of the mineral, or a fluid occupying the pores of a deteriorated layer that has developed on the surface of the reagent.
• (2), (3) or (4), corresponding to control by surface reaction. This is generally reaction (4) of desorption of the activated complex which is kinetically the slowest.
Figure 4
Diagram showing the elementary reactions that can occur at the solid-solution interface and explain how any heterogeneous chemical reaction proceeds (Trudgill, 1986). Copyright (1986) John Wiley and Sons Ltd. Reproduced with permission.

19
Transfer of material by diffusion
Dissolution of silicate material can be limited and controlled by the aqueous diffusion of the network forming ions, through a porous surface layer of thickness “e”.
This layer can be:
- residual: as a result of fast and preferential extraction of certain ions weakly linked to the solid network,
- neoformed: precipitation of minerals after a heterogeneous nucleation phenomenon.
The rate of diffusion of ions is controlled by: the porosity and tortuosity of the surface material, the temperature of the medium and the movement of the solutions in contact with the surface.
The movement of material which can occur from the most concentrated regions to the least concentrated ones is quantifiable with the Fick’s first law. Fick’s second law covers the variation of the concentration of the species considered as a function of time and distance (Advocat et al., 1993b). Surface reactions
The surface reactions notably consist of a succession of elementary adsorption and desorption reactions that can catalyze (or inhibit) the kinetics of the overall reaction. These elementary reactions result in the forming of one or more transient molecules, which are mixtures of initial reagents and referred to as activated complexes, of which the desorption consists the final stage of breakdown of the initial reagent (Advocat et al., 1993b).
The phenomenon of adsorption must be taken into account and, in order to minimize it, the concentration of the carrier and the pH of the solution must be established (Campion, 1975).
Examples of adsorption-desorption studies are given in paragraph II.1.3.
Effect of the pH of the solution on the corrosion mechanism
The factors that influence the nature of the corrosion mechanism and the kinetics of dissolution are mainly the following:
- the chemical composition and the structure of the solid, - the chemical composition of the aqueous solution, - temperature.

20
According to Adams (1972), in the case of acid attack, a diffusion-controlled ion-exchange process is established. The protons in the solution are exchanged for the alkali ions present in the glass, as well as alkaline-earth ions to a lesser degree. In general there will be selective removal of elements present as vitreous network modifiers, that is, those that are located in the interstices of the glass network: Li+, Na+, K+, Mg2+, Ca2+ and Ba2+. The diffusion tendency would be in the order indicated (that is in order of increasing size of the cations). Removal of Na+ cations would be greater for borosilicate glass. Boron can also be easily removed.
A soda-silicate glass selectively dissolved in an acid medium by the alkali ions exchange in the glass with protons in the solution (Advocat, 1991). The following reaction could occur in an acid medium:
(SiO – Na)glass + H3O+ ↔ (Si – OH)glass + H2O + Na+ (a)
The preferential extraction of alkali-elements, which are vitreous network modifiers, results in the forming of a de-alkalinized layer at the glass surface. The sodium ions and the protons in the solution would be able to diffuse through this layer.
Some of the silica can also be extracted into the solution, which results in the partial destruction of the leached5 or de-alkalinized layer. The attack front between this layer and the unaltered glass gradually moves inwards. A stationary state of dissolution is reached when the rate of release (by diffusion) of the alkali-elements at the interface between the layer and the solution is equal to the rate of release of the silica. Under these conditions, the thickness of the de-alkalinized layer at the surface becomes constant. Studies by Raman spectrometry indicate a structure substantially different to unaltered glass, designated hydrosilicates (Bunker et al., 1988).
As long as the solution remains acidic, the corrosion of inactive nuclear reference glass R7T7 (which is an alumino-borosilicate) consists in preferential extraction of boron and vitreous network modifiers (Na, Li and Ca, particularly) by interdiffusion with the protons in the aqueous phase. This results in the creation of a hydrated residual glass-layer (Advocat et al., 1993a; Advocat et al., 1993b). The concentration of silanol groups (Si - OH) formed during the reaction (a) increases from the glass surface.
In a neutral aqueous medium, hydrolysis of the glass takes place by the action of the H2O molecules in the solution.
(SiO – Na)glass + H2O ↔ (Si – OH)glass + OH- + Na+ (b)
The hydroxyl ion obtained by reaction (b) immediately reacts with the vitreous network at the siloxane links (Si – O – Si).
(Si – O – Si)glass + OH- ↔ (≡ Si – OH)glass + (≡ Si – O-)glass (c)
The silanol groups at the glass surface are of the (Si – OH) and (Si – O-) forms.
If the solution becomes alkaline, dissolution of the glass becomes stoichiometric, that is all the components are released simultaneously. This occurs at the attack front, but only some of the elements pass into solution, and the remainder constitutes a deteriorated layer covering the surface of the unaltered glass. No hydrated residual glass is observed (Advocat et al., 1993a; Advocat et al., 1993b).
5 Leaching: an operation that consists in slowly passing a solvent through a pulverised product in a thick layer to extract from it one or more soluble components. By extension, leaching is also used to describe the process of passage in the water of the component elements of glass covering a series of reactions that occur at the glass surface due to very different mechanisms (Jacquet-Francillon, 1994).

21
Acids, both inorganic and organic, react much more slowly with glass than do strong alkaline media, with the exception of hydrofluoric acid which rapidly corrodes glass. Also orthophosphoric acid (H3PO4) can be especially corrosive for most glasses (Adams, 1972).
In general, concentrated alkaline media are extremely corrosive for glass and use of them is therefore avoided for solubilization media in the preparation of radioactivity standard solutions.
An example of acid corrosion found in the literature indicates (Preiss and Fink, 1957) that about 0.1 mg of solids is removed per 100 cm2 of Pyrex®6 glass in a 72 hours exposure to 5 % hydrochloric acid solution.
Table 4 gives the concentrations of solids dissolved in distilled water and hydrochloric acid at concentrations of 0.1 M and 1 M after 24 hours and 10 months of storage in Pyrex® glass containers. Several samples of the residues analyzed showing that 60 to 90 % of the inactive metal ions are sodium, the remainder being mainly potassium and silicon. The authors (Lowenthal and Wyllie, 1973) indicate that sodium and potassium are relatively less effective in increasing the self-absorption of radiation in the solid sources than are most other metals.
In the data in Table 4, it can be seen that, for the same storage time of solution, when the concentration of hydrochloric acid is increased from 0.1 M to 1 M (10 times), the concentration of the solids removed from the glass also increases (approximately twice as great).
TYPE OF SOLVENT STORAGE TIME MATERIAL OF
STORAGE VESSEL RESULTS a (µg / mL)
Distilled water 24 hours Pyrex glass b 0.6 - 3
0.1 M HCl c 10 months Pyrex glass b 85 - 93
1 M HCl c 10 months Pyrex glass b 168 - 207
(a) Each result refers to an independent measurement. (b) Pyrex® is a Type A borosilicate glass (see Table 2).
(c) Obtained by dilution of concentrated acid supplied in Pyrex® glass bottles.
Table 4
Concentrations of inactive solids in water and hydrochloric acid removed from a Pyrex® glass
container over a specific time of storage. Reprinted from (Lowenthal and Wyllie, 1973). Copyright (1973), with permission from Elsevier.
A final example of acid corrosion in the literature (Raggon and Bacon, 1954) is quoted in Table 5 and Figure 5.
6 Pyrex is a Type A borosilicate glass (see Table 2).

22
TYPE OF BOTTLE USED
BOROSILICATE A (diluted milk)
BOROSILICATE B (serum)
BOROSILICATE C (reagent)
Rated capacity (mL) 160 240 250
Inside area (cm2)
188 251 231
Rated area/Volume 1.18 1.04 0.93
ANALYSIS (%) SiO2 79.7 74.2 68.7 B2O3 14.0 9.6 10.4 CaO 1.0 0.5 MgO 0.3 2.0 BaO 2.4 3.9 ZnO 0.7 Na2O 4.2 6.3 8.2 K2O 0.02 0.7 1.7
others 2.0 5.6 3.6 total 99.9 100.1 99.7
Table 5
Different types of borosilicate glass bottles exposed to the action of hydrochloric acid solutions at concentrations ranging from 2.10-4 to 6 M for 7 days at 70 °C. See also Figure 5 concerning this study (Raggon and Bacon, 1954). Copyright (1954) Blackwell Publishing. Reproduced with permission.

23
Figure 5
Concentrations of Na2O and SiO2 (ppm) extracted from the various borosilicate glass bottles (see Table 5) as a function of the hydrochloric acid concentration: 2.10-4, 10-3, 10-2, 0.1, 1.0 and 6.0 M.
Experimental conditions: reaction time 7 days at 70 °C (Raggon and Bacon, 1954). Copyright (1954) Blackwell Publishing. Reproduced with permission. The bottles of Type A borosilicate glass with a smoother inner surface are designated (Ab) and the others are designated (Aa). Table 5 indicates the chemical composition of different borosilicate glass bottles in commercial use. These bottles were exposed to hydrochloric acid solutions at different concentrations such as 2.10-4, 10-3, 10-2, 0.1, 1.0 and 6 M, for 7 days at a temperature of 70 °C. The contents of each bottle were then analyzed to determine the concentrations of Na2O and SiO2 (ppm) extracted from the glass into the solutions. Two bottles of each type were tested each time. Figure 5 shows the average concentrations of Na2O and SiO2 (ppm) extracted from the glass as a function of the different hydrochloric acid concentrations,

24
under the experimental conditions described above. The borosilicate glass bottles designated Ab had a smoother inner surface that those designated Aa. The Ab bottles gave higher extraction concentrations than the Aa bottles. In general, for the Ab, B and C bottles, it can be observed that the concentration of SiO2 extracted increased at acid concentrations greater than 0.1 N. The increase was not as great for the concentration of the Na2O leached out (Raggon and Bacon, 1954).
Figure 5 qualitatively shows the accelerated ageing of borosilicate glass. The concentrations of hydrochloric acid used at the LNHB as a solubilization medium are 0.1 M and 1 M. It is to be noted that, at these two concentrations of acid and for the experimental conditions indicated in the figure, concentration of the SiO2 removed is substantial (approximately twice as great) when the concentration of the hydrochloric acid is increased from 0.1 to 1 M. The same effect, but less marked, is observed for the concentration of Na2O.
It can be seen that 1 M HCl hydrochloric acid is therefore more corrosive of borosilicate glass than 0.1 M HCl hydrochloric acid. Consequently, if 0.1 M HCl solubilization medium may be used for preparing a standard solution of a given radionuclide (that is if the solution is stable), it is preferable to use it rather than 1 M HCl as it is less corrosive as regards the glass that constitutes the container of the solution (ampoule).
Table 6 shows a comparison of the corrosion of borosilicate glass by a strong alkali (5 % NaOH) and a strong acid (5 % HCl), in terms of loss of mass (mg/cm2), over a period of 24 hours at a temperature of 95 °C (Adams, 1972). It is found that, under these experimental conditions, alkali attack is in general 1000 times more severe than acid attack.
Mass loss in 24 hours at 95°C (mg/cm2) GLASS TYPE
5 % NaOH 5 % HCl
Borosilicate A 5 5 × 10⁻³
Borosilicate B* 4 5 × 10⁻³
* Glass which corresponds to the chemical composition of glass ampoules (see Table 4).
Table 6
Comparison of the corrosion of borosilicate glass, expressed in terms of mass loss (mg/cm2), in the presence of a strong alkali and a strong acid (Adams, 1972). Copyright (1972) by Marcel Dekker Inc. Reprinted by permission via the Copyright Clearance Center. Figure 6 shows the solubility of borosilicate glass in terms of mass loss (mg/cm2) versus pH of the reagent, under the following experimental conditions: reaction time 50 hours and temperature 95 °C (Adams, 1972). Alkali attack is found to vary greatly with the pH. Mass loss increased by a factor of around 3 for each pH number increment.

25
Figure 6
Alkali attack of borosilicate glass in terms of mass loss (mg/cm2), as a function of the pH of the reagent at 95 °C and a reaction time of 50 hours (Shand, 1958). Courtesy Corning Incorporated. Reprinted with permission. Saline solutions
According to Adams (1972), saline solutions also attack glass. The effect of the salt concentration has also been observed. The greater the concentration of the salt in the solution is, the more the glass is attacked. For instance, a 1 M KCl solution attacks glass more than a 0.1 M KCl solution. Chelating agents
A polydentate ligand can attach itself to a metal ion by two or more “claws” and form a cyclic structure. Such cyclic compounds are called “chelates” and the polydentate reagents “chelating agents”. Chelates are characterized by remarkably high chemical stability, compared to complexes formed with monodentate ligands containing analogous functional groups.
According to Ringbom (1967), a polydentate chelating agent can be compared to an octopus which has seized its prey (a metal ion) with its numerous tentacles. This stability, increased by chelation, is explained by geometrical factors rather than electron factors.
The strongest complex-forming agents are molecules that contain both oxygen and nitrogen as donor atoms. One example is ethylenediaminatetraacetic acid (EDTA).
According to Adams (1972), a number of chelating compounds attack glass at a rate comparable to attack by strong alkaline solutions. The influence of time and temperature is similar to that in the case of alkaline solutions.

26
If the solution is alkaline, oxalate ions [COO--COO-], gluconate ions [CH2(OH)-(CHOH)4-COO-], maleate ions [COO—CH=CH-COO-], EDTA ions [(COO--CH2)2-N(CH2)2N-(CH2-COO-)2], citrate ions [-OOC-CH2-C(OH)(COO-)-CH2-COO-], etc. will all attack glass (Adams, 1972).
Organic solvents
According to Adams (1972), most organic solvents are capable of significant dissolution of certain glass compositions. An example quoted by the author is the extraction of boron from borosilicate glass by methanol. Surface reactions at the interface between the organic solvent and the glass surface would appear to be involved.
Table 7 shows the estimated upper limits of borosilicate glass corrosion by several types of reagents: strong alkali, strong chelate, strong acid, water, salts, and organic solvents. Mass loss (mg/cm2) per day is estimated at two temperatures (25 °C and 100 °C). It will be noticed that corrosion tends to increase with temperature. The most corrosive media correspond to strong alkalis and strong chelates. These are followed by strong acid media, salts and water. Finally, organic solvents would appear to be the least corrosive.
Loss of mass during the first day (mg/cm2)
TYPE OF TEMPERATURE SOLUTIONS SOLUTIONS SOLUTION
GLASS (°C) Strong alkali and strong chelate
Strong acid, water and salts
Organic solvents
Borosilicate A 100 10 10–2
< 10–3
25 0.1 10–4
< 10–5
Borosilicate B* 100 10 10–2
< 10–-3
25 0.1 10–3
< 10–4
* The type corresponding to the chemical composition of the ampoules glass (see Table 3).
Table 7
Estimated upper limits of corrosion of borosilicate glass by various reagents at two different temperatures (Adams, 1972). Copyright (1972). Reprinted by permission of Marcel Dekker Inc. via the Copyright Clearance Center.
The nature of the glass surface was previously discussed in paragraph II.1.1. It is to be noted that all glasses are porous at the 0.1 nanometre level. According to Adams (1972), glass that has been leached to selectively remove certain elements from the surface, can have its porosity increased to a depth of 1 to 10 nanometres. In general, attack by chemical reagents or drawing of the glass can cause such surface structures. Figure 7 shows such structures observed with an electron microscope in the case of borosilicate glass. Figure 7a shows a spongy layer resulting from a chemical reaction. Figures 7b and 7c correspond respectively to alkali salt crystallites and silica globules formed during heating of the glass (Adams, 1969). The glass surface can be further degraded to the point that defects can be

27
Figure 7
Structures of borosilicate glass surface observed with an electron microscope (X 27 000) (Adams, 1969). Photographs courtesy Corning Incorporated:
(a) Spongy layer after chemical reaction. (b) Alkali salt crystallites formed at surface. (c) Globules of silica on surface.

28
observed with the light microscope or with the unaided eye. Such degradation is usually typified by a hazy appearance, adherent deposits and microcracking or spalling.
II.1.3. Sorption at the solid-solution interface
Surface reactions were covered in paragraph II.1.2. Reactions were shown to be a succession of elementary adsorption and desorption reactions. The phenomenon of adsorption-desorption is generally simply referred to as sorption.
According to Hair (1975), anyone who has worked with glass vacuum systems will be well aware of the adsorptive properties of glass surfaces; and the catalytic effect of glass surfaces on biological reactions such as blood clotting is well established. Unfortunately, the fact that glass is a good insulating material makes it very difficult to examine by sophisticated surface techniques involving electron scattering. However, indirect techniques can be used to determine the nature of a glass surface by considering the glass to be an impure form of silica. Infrared gravimetric adsorption data show that the major adsorption sites on a silica surface are surface hydroxyl groups. Depending upon the temperature of pretreatment, these may be either “freely vibrating” or hydrogen-bonded to each other. The adsorptive properties of each type of group are very different. Whereas, water will preferentially adsorb on the hydrogen–bonded hydroxyl groups, compounds containing lone-pair electrons will adsorb preferentially on the freely vibrating hydroxyl groups.
The hydroxylated surface is normally reactive. When a metal oxide is exposed to water or its vapor, surface hydroxyl groups are formed by the dissociative sorption of water molecules (Dzombak and Morel, 1990) (this is also the case for silica and quartz, which are discussed in paragraph II.2).
The schematic diagrams showing the process of hydroxylation of the surface of an oxide are shown in Figure 8. Metal ions in the surface layer of a dry oxide are not fully coordinated (Figure 8a) and water molecules can occupy these vacant coordination sites via chemisorption (Figure 8b). The surface becomes hydroxylated by proton transfer from the bound water molecules to the neighboring oxide ions (Figure 8c), a process that appears to be energetically favoured because better charge neutralization in the lattice is achieved. Additional water can sorb on the hydroxylated surface, possibly as shown in Figure 8d.
Below some examples are given of studies of the phenomenon of sorption found in the literature (Cavellec et al., 1998; Drot and Simoni, 1999; Geelhoed et al., 1997; Manning and Goldberg, 1996; Meng and Letterman, 1993). These show the general behaviour of cations and anions in sorption at the solid-solution interface as a function of the pH. These recent publications show that the sorption isotherms of ions (anions and cations) of various solutions on different solids, as a function of the pH, are of similar form in all cases.
It can also be noticed from these publications that the sorption equilibria are relatively rapidly achieved (in around 5 hours to 15 hours).
For all the isotherms, the experimental data are indicated by the points and the curves are calculated with allowance for different models that can be used to describe the phenomenon of sorption.

29
Figure 8
Schematic cross section of the surface layer of a metal oxide (this also applies to silica and quartz, covered in paragraph II.2), (Dzombak and Morel, 1990). Copyright (1990). Reprinted with permission of John Wiley & Sons, Inc.
(a) Surface ions are not fully coordinated. (b) Surface metal ions coordinate H2O molecules in the presence of water. (c) Protons dissociate form the sorbed H2O molecules, leading to the formation of a
uniformly hydroxylated surface. (d) Sorption of water on the hydroxylated surface.

30
Sorption of cations at the solid-solution interface as a function of pH
From Figures 9 to 13 (Cavellec et al., 1998; Drot and Simoni, 1999; Meng and Letterman, 1993), it can be seen that the sorption isotherms for cations of different solutions on distinct solids, as a function of the pH, are of the same general shape in all cases:
- At low pH values, sorption of cations is minimal. It is to be noted that the solubilization media generally used at the LNHB are: 0.1 M HCl (pH 1), 1 M HCl (pH 0) or 1 M HNO3 (pH 0).
- At high pH values, sorption of cations is maximal. It is to be observed that use of alkaline solubilization media is not normally recommended (see comments on the alkaline corrosion of glass in paragraph II.1.2).
- At intermediate pH values, it is found that the position of the increase sorption front varies with the nature of the element and/or the solid phase. It can be offset to the left or the right of the pH 7 (neutral) position. However, sorption of cations in the vicinity of pH 7 is generally relatively great.
In the particular case of the preparation of radioactivity standard solutions, the sorption of radioactive cations in solutions takes place at the walls of the glass ampoules used for packaging the solutions.
In paragraph II.1.2, the effect of the pH of the solution on the corrosion of the glass has already been discussed. The presence of silanol groups (Si-OH) at the glass surface in acid media is well known. Yet, in neutral aqueous and alkaline media, the silanol groups lose their protons (Si-O-) which favours the sorption of cations of solutions at the glass surface.
Consequently, the preparation of standard solutions of radioactive cations in water or alkaline solubilization medium is to be avoided.

31
Figure 9
Sorption isotherms and calculated curves for the U (VI) / ZrP2O7 system as a function of the pH, in a 0.5 M KNO3 medium. Uranium total concentration of 9.5 × 10⁻⁵ M. Reprinted with
permission from (Drot and Simoni, 1999). Copyright (1999). American Chemical Society.
Figure 10
Sorption isotherms and calculated curves for the Eu (III) / ZrP2O7 system as a function of the pH, in a 0.5 M KNO3 medium. Europium total concentration of 6 × 10⁻⁵ M. Reprinted with
permission from (Drot and Simoni, 1999). Copyright (1999). American Chemical Society.
Figure 11
Sorption isotherms and calculated curves for the Eu (III) / Zr2O(PO4)2 system as a function
of the pH, in a 0.5 M KNO3 medium. Europium total concentration of 6 × 10⁻⁵ M. Reprinted
with permission from (Drot and Simoni, 1999). Copyright (1999). American Chemical Society.

32
Figure 12
Model simulation of cadmium Cd (II) adsorption in aluminium hydroxide suspension Al(OH)3 (5 × 10⁻³ M) and silica suspension SiO2 (1 g/L) as a function of the pH. Cadmium total
concentration Cd (II) of 1.78 × 10⁻⁵ M in a 0.04 M KNO3 medium. Reprinted with permission
from (Meng and Letterman, 1993). Copyright (1993). American Chemical Society.
Figure 13
Isotherms of sorption of curium Cm (III) as a function of the pH. Reprinted with permission from (Cavellec et al., 1998). Copyright (1998). Radiochimica Acta.
(a) Isotherms of sorption of curium Cm (III) onto phosphate materials. (b) Influence of phosphate ions on the sorption isotherms of Cm (III) onto the
zirconium phosphate.

33
Sorption of anions at the solid-solution interface as a function of pH
Figures 14 to 21 (Geelhoed et al., 1997; Manning and Goldberg, 1996; Meng and Letterman, 1993) show the sorption of anions of different solutions on distinct solids as a function of the pH. It is to be noted that the form of the curve is similar in all cases and the behaviours of the anions is opposite to that of cations:
- At low pH (acid media), the sorption of anions is at a maximum. All the examples shown in the figures correspond to around pH 2. Yet the acid solubilization media used by LNHB are generally 0.1 M HCl (pH 1), 1 M HCl or 1 M HNO3 (pH 0), that is even more acidic. However, the shape of the curves suggests that sorption is also at a maximum at the lowest pH.
- At high pH (alkaline media), the sorption of anions diminishes or is at a minimum depending on the nature of the anion in question. This reduction of the sorption occurs relatively suddenly at pH of 7 and higher.
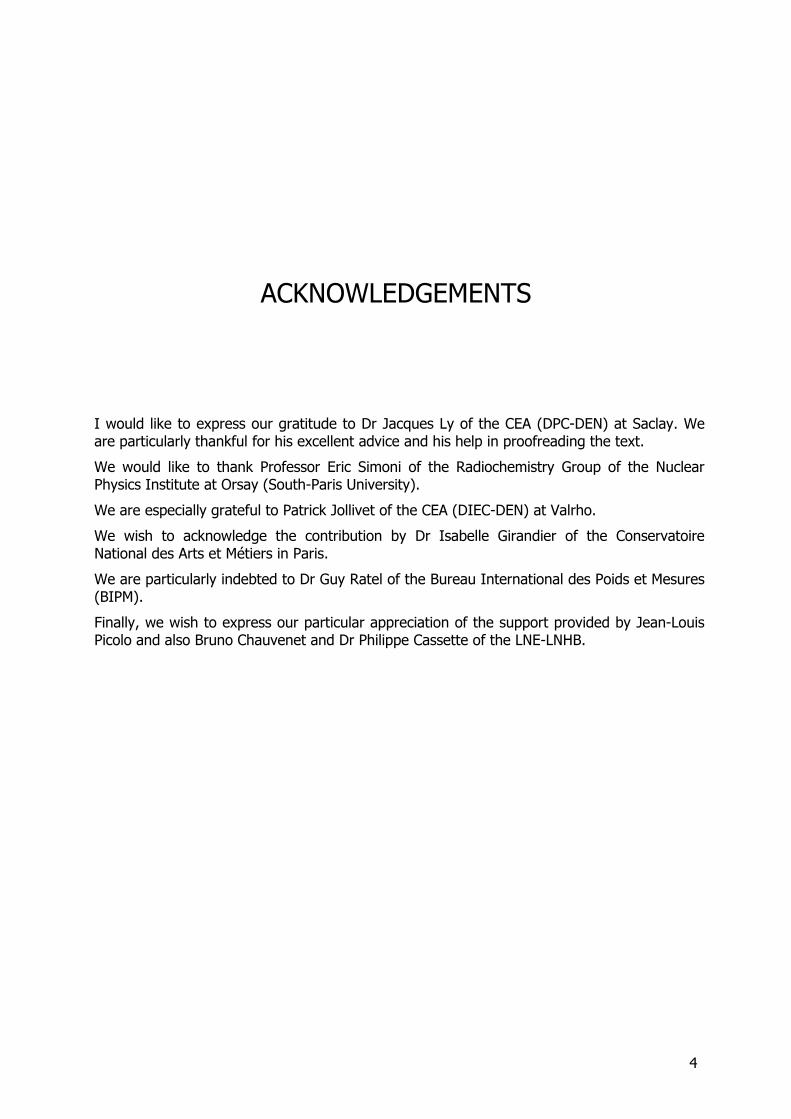
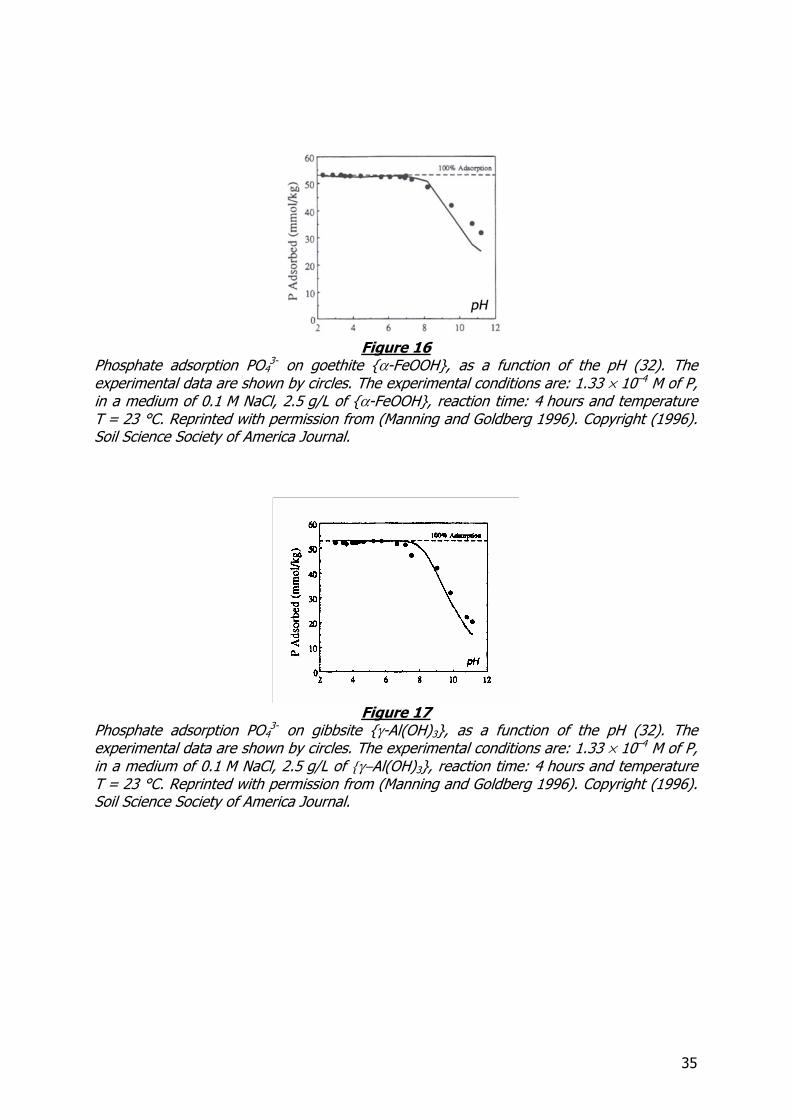
It is to be observed that, for "polyprotic" acid anions such as H3PO4 (see Figures 16 and 17) and H3AsO4 (see Figures 18 and 19), sorption is spread over a wider pH range than in the case of "diprotic" acid anions such as H2SO4 (see Figures 14 and 15) and H2MoO4 (see Figures 20 and 21). For "diprotic" acids, it is to be noted that anion sorption completely disappears at alkaline pH.
At the LNHB, the sorption of anions occurs at the walls of the glass ampoules used for packaging the solutions.
The effect of the pH of the solution on the glass corrosion mechanism has been covered in paragraph II.1.2. When the pH is below 7, the silanol groups at the glass surface are of the form [-Si-OH]. Anions are then sorbed to these groups. However, in neutral and alkaline media, the silanol groups loose their proton [-Si-O-], which counteracts the sorption of anions at the glass surface as a result of electrostatic repulsion. Yet, as observed in paragraph II.1.2 on the glass corrosion by alkaline solutions, the use of alkaline media is generally not recommended.
Consequently, water (H2O) should be the preferred solvent for radioactive anion standard solutions when the corresponding salt is soluble in water and, particularly, by taking due account of its anion chemistry.

34
Figure 14
Influence of pH on sulphate SO42- adsorption –on goethite FeOOH, at different
[SO42-]TOTAL / [goethite] ratios and for distinct ionic strengths. The dashed lines indicate
model calculations for a 0.01 M KNO3 medium and the dotted line for a 0.5 M KNO3 medium. Reprinted from (Geelhoed et al., 1997). Copyright (1997), with permission from Elsevier.
Figure 15
Sulphate adsorptions SO42- as a function of the pH, on different mixtures of aluminium
hydroxide Al(OH)3 and silica (SiO2). The total sulphate concentration is [SO42-]TOTAL = 10–4 M
and the concentration of the medium is [KNO3] = 0.04 M. Reprinted with permission from (Meng and Letterman, 1993). Copyright (1993). American Chemical Society.
(a) The sulphate adsorption matrices are: 10–3 M Al(OH)3, 1 g/L SiO2 and [10–3 M Al(OH)3 + 1 g/L SiO2]. (b) The sulphate adsorption matrices are: 3 × 10⁻³ M Al(OH)3 and
[3 × 10⁻³ M Al(OH)3 + 1 g/L SiO2].
35
Figure 16
Phosphate adsorption PO43- on goethite α-FeOOH, as a function of the pH (32). The
experimental data are shown by circles. The experimental conditions are: 1.33 × 10⁻⁴ M of P,
in a medium of 0.1 M NaCl, 2.5 g/L of α-FeOOH, reaction time: 4 hours and temperature
T = 23 °C. Reprinted with permission from (Manning and Goldberg 1996). Copyright (1996). Soil Science Society of America Journal.
Figure 17
Phosphate adsorption PO43- on gibbsite γ-Al(OH)3, as a function of the pH (32). The
experimental data are shown by circles. The experimental conditions are: 1.33 × 10⁻⁴ M of P,
in a medium of 0.1 M NaCl, 2.5 g/L of γ−Al(OH)3, reaction time: 4 hours and temperature
T = 23 °C. Reprinted with permission from (Manning and Goldberg 1996). Copyright (1996). Soil Science Society of America Journal.

36
Figure 18
Arsenate adsorption AsO43- on goethite (α-FeOOH), as a function of the pH (32). The
experimental data are shown by circles. The experimental conditions are: 1.33 × 10⁻⁴ M of
As (V), in a medium of 0.1 M NaCl, 2.5 g/L of α-FeOOH, reaction time: 4 hours and
temperature T = 23 °C. Reprinted with permission from (Manning and Goldberg 1996). Copyright (1996). Soil Science Society of America Journal.
Figure 19
Arsenate adsorption AsO43- on gibbsite γ-Al(OH)3, as a function of the pH (32). The
experimental data are shown by circles. The experimental conditions are: 1.33 × 10⁻⁴ M of
As (V), in a medium of 0.1 M NaCl, 2.5 g/L of γ-Al(OH)3, reaction time: 4 hours and
temperature T = 23 °C. Reprinted with permission from (Manning and Goldberg 1996). Copyright (1996). Soil Science Society of America Journal.

37
Figure 20
Molybdate adsorption MoO42- on goethite (α-FeOOH), as a function of the pH (32). The
experimental data are shown by circles. The experimental conditions are: 1.33 × 10⁻⁴ M of
Mo (VI), in a medium of 0.1 M NaCl, 2.5 g/L of α-FeOOH, reaction time: 4 hours and
temperature T = 23 °C. Reprinted with permission from (Manning and Goldberg 1996). Copyright (1996). Soil Science Society of America Journal.
Figure 21
Molybdate adsorption MoO42- on gibbsite γ-Al(OH)3, as a function of the pH (32). The
experimental data are shown by circles. The experimental conditions are: 1.33 × 10⁻⁴ M of
Mo (VI), in a medium of 0.1 M NaCl, 2.5 g/L of γ-Al(OH)3, reaction time: 4 hours and
temperature T = 23 °C. Reprinted with permission from (Manning and Goldberg 1996). Copyright (1996). Soil Science Society of America Journal.

38
II.2. Quartz ampoules
The properties of the glass ampoules used to contain radioactive standard solutions has been studied. The properties of quartz ampoules that could be used for the same purpose are now considered.
Silicon dioxide, which is generally referred to as silica, occurs in different crystallographic forms, of which only α-quartz is thermodynamically stable at room temperature, the other
forms being metastable (Cotton and Wilkinson, 1966). It must be borne in mind that when the oxide is exposed to an aqueous solution or water vapour:
• From a macroscopic standpoint, there is a difference in the chemical potential7 of the constituents in both phases in contact. Owing to kinetics (low ionic mobility in the solid) and thermodynamics (solubility product), migration of cations towards the liquid phase and dissolution of the oxide takes place very slowly. The difference in the chemical potential of oxygen does decrease through adsorption of water and dissociation of the adsorbed molecules, which explains the presence of hydroxyl groups on the surface (Jolivet, 2000).
• From a structural standpoint, the coordination number of cations on the surface of an oxide synthesized by “dry” techniques is necessarily lower than that of ions within the solid. Upon exposure to ambient atmosphere, satisfying the coordination number of the surface ion is the driving force behind the chemisorption of water which causes its dissociation and combination (see Figure 22) (Jolivet, 2000), as previously mentioned in paragraph II.1.3 (see Figure 8) (Dzombak and Morel, 1990).
Figure 22
Diagram of the water chemisorption on an oxide surface (Jolivet, 2000). Copyright (2000) John Wiley & Sons Limited. Reproduced with permission. The hydrogen bonds in liquid water are responsible for a number of properties of the liquid and the presence of ions in the liquid does alter its local structure.
7 At the macroscopic scale, the chemical potential of the proton in solution can, for instance, be written as follows:
pH.aLnRT HHHH 06000 −=+= µµµ
(where aH is the chemical activity of the proton; RT Ln = 0.06 Log, at 298 K; 0
Hµ is the standard chemical
potential of the proton) (Jolivet, 2000).

39
The surface groups of the oxide (designated S-OH) ionize in contact with water:
S-O- + H3O+ S-OH + H2O S-OH2
+ + HO-
The surface groups S-OH, S-OH2+ and S-O- are polarized and develop very strong
interactions with water. They also have a very strong structuring effect on the liquid. Measurements of immersion and adsorption heats, as well as dielectric measurements on the oxides α-Fe2O3, ThO2 or SiO2, indicate that the two to three layers of physisorbed water adjacent to the first chemisorbed water layer are immobilized by pairs of hydrogen bonds forming an order similar to that of ice. These bonds are still present at room temperature (see Figure 23) (Mc Cafferty and Zettlermoyer, 1971). See also paragraph II.1.3, Figure 8 (Dzombak and Morel, 1990).
Figure 23
Schematic representation of the adsorption of water on an oxide surface (Mc Cafferty and Zettlermoyer, 1971). Reproduced by permission of The Royal Society of Chemistry. The ordering of solvation layers disappears away from the surface.
The non-specific electrostatic forces caused by the surface charge attract ions of opposite sign (counterions) and repel ions of same charge (co-ions). Depending on the nature of the counterions, their interaction with the surface will be more or less strong.
The role of the counterions on a charged surface is not limited to maintaining the electroneutrality. Since these ions are near the surface, they also shield electrostatic repulsion between charged groups, which modifies the surface charge.
Alkali ions, for example, are adsorbed on negatively charged oxide surfaces in the following sequence: Li+ > Na+ >> Cs+. This order is due to the fact that water molecules are poorly mobile near the surface and compensate the entropy loss by an increase in bond energy with the most strongly hydrated cations (Jolivet, 2000).
The mobility of ions within the solvation layers is limited by the strong structuring of the layer and the strong electrostatic forces near the surface.
This was clearly demonstrated in NMR investigations of the relaxation times of 23Na adsorbed on the surface of silica (Jang and Fuerstenau, 1990). The relaxation time of adsorbed Na+ is longer for ions in solution, but does not allow the formation of ion pairs or complexes with negatively charged sites on the surface. The solvation layers of the adsorbed Na+ do not appear to be affected and, since these ions are only subjected to non-specific electrostatic forces, they are only constrained not to diffuse outside the solvation layer of the particles. Interactions between the ion and the surface probably occur via hydrogen bonding between

40
charged groups and solvated surface groups, as is schematically shown in Figure 24 (Jolivet, 2000).
Figure 24
Schematic representation of the interaction between the Na+ ion and the surface probably taking place via hydrogen bonding between charged groups and solvated surface groups (Jolivet, 2000). Copyright (2000) John Wiley & Sons Limited. Reproduced with permission.
The sorption isotherms for nickel (Ni(II)) on quartz (MUS8) as a function of pH have been studied (Puukko and Hakanen, 1995) and are shown for two different nickel concentrations: 5 × 10⁻¹⁰ M (see Figure 25) and 5 × 10⁻⁷ M (see Figure 26) at a quartz concentration of 60 g/L. Solutions of sodium nitrate (NaNO3) at concentrations of 0.001 M, 0.005 M, 0.01 M and 0.1 M make it possible to study the sorption of nickel in solution ranging from the lowest ionic strength (0.001 M) to the highest (0.1 M).
Figure 25
Sorption isotherms for nickel Ni (II) on quartz (MUS9) as a function of pH. System concentrations are: [Ni] = 5 × 10⁻¹⁰ M and [SiO2] = 60 g/L. NaNO3 medium concentrations are: 0.001 M; 0.005 M; 0.01 M; 0.1 M. From (Puukko and Hakanen, 1995) by permission.
8 (MUS): a commercial product Min-U-Sil 5 supplied by U.S. Silica Company, consisting of natural quartz (α-quartz).

41
Figure 26
Sorption isotherms for nickel Ni (II) on quartz (MUS9) as a function of pH. System concentrations are: [Ni] = 5 × 10⁻⁷ M and [SiO2] = 60 g/L. NaNO3 medium concentrations are: 0.001 M; 0.01 M; 0.1 M. From (Puukko and Hakanen, 1995) by permission.
Figure 27 shows sorption isotherms for sodium (Na(I)) on quartz (MUS9) as a function of pH (Puukko and Hakanen, 1995). Concentrations of the NaNO3 solutions were 0.001 M and 0.1 M. The quartz concentration was 60 g/L. The sorption of the sodium ion in the 0.001 M NaNO3 was low and increased with pH to reach a value of 2.5 % at pH 9. Sorption of the sodium ion in the most concentrated solution of NaNO3, of 0.1 M varied more than the solution of low ionic strength, but were both similar (0.5 % to 1.5 %) at pH less than 7.
Figure 27
Sorption isotherms for sodium Na (I) on quartz (MUS9) as a function of pH. System concentrations are: [SiO2] = 60 g/L; 0.001 M NaNO3 and 0.1 M NaNO3. From (Puukko and Hakanen, 1995) by permission.
If a comparison is made between indications in Figures 25 to 27 and those in Figures 9 to 13, it is once again visible that cation sorption isotherms of the different solutions on distinct solids, as a function of pH, are of very similar shape (see indications concerning the sorption of cations at the solid-solution interface in paragraph II.1.3). The presence of silanol groups

42
(Si-OH or Si-O- depending on the pH of solution) plays a fundamental role in the sorption of the ions of the solution on the oxide surface.
This enables us to conclude that the use of quartz for ampoules would not prevent sorption of ions in the solution on the inner surface of the ampoule. The extra cost of quartz ampoules compared to glass ones is therefore not justified.
II.3. Cleaning and packaging of glass ampoules
The process of deterioration of the glass surface can occur in the presence of the solution and of air (Adams, 1972) as is schematically shown in Figure 28. The phenomena which can occur in sequence or simultaneously are the following: water adsorption, ion exchange, salt formation, leaching, etching, deposit forming, hydration and dehydration.
As previously mentioned in paragraph II.1.2, the glass surface is not smooth on a microscale. All glass is porous at the 0.1 nm level (Adams, 1972). The porosity of glass that has been leached to selectively remove certain elements from the surface can increase to a depth of 1 nm to 10 nm (Adams, 1972). Yet, increasing the porosity of the surface glass results in an increase in the number of adsorption sites. Therefore, the phenomenon of sorption of radioactive ions can occur when the solution is stored in sealed-glass ampoules.
Figure 28
Diagram of the deterioration process of the glass surface in contact with the solution and air. The phenomena which can occur are the following: water adsorption, ion exchange, salt formation , leaching, etching, deposits forming, hydration and dehydration (Adams, 1972). Copyright (1972). Reprinted by permission of Marcel Dekker Inc. via the Copyright Clearance Center.

43
The following topics are now covered in detail:
• the action of different glass cleaning solutions,
• the possibility of “accelerated ageing” of glass prior to its use,
• different possible surface coatings and their drawbacks,
• the treatment of ampoules with carrier solutions before their use for packaging different radioactive standard solutions.
II.3.1. Cleaning solutions
According to Adams (1972), an optimal cleaning technique can be established for each application. It depends on a number of parameters such as the contaminants of the glass, the nature of the glass itself and its use after cleaning.
All glassware used by the LNHB for the preparation of radioactivity standard solutions (including 5 mL ampoules) is currently machine-washed with 4.8 % sodium hydroxide solution and 20 % acetic acid solution. It is given a final rinse with deionized water. However, this cleaning treatment alone is not sufficient to prevent the deterioration process of the glass schematically shown in Figure 28 in the particular case of the 5 mL ampoules for the long-term storage of radioactivity standard solutions.
Different cleaning solutions are described hereafter.
Alkaline cleaning solutions
According to Adams (1972), the action of strong alkaline cleaners, especially when used hot, can be considered to be a “slicing off” of a surface layer of glass. In so doing, surface contaminants are removed. Assuming there is no deposition of insoluble reaction products, a smooth surface should result.
A borosilicate glass cleaned with sodium hydroxide (NaOH), followed by a hydrochloric acid (HCl) dip, produced a surface almost identical to virgin glass (Adams, 1972).
According to Adams (1972), many detergents are essentially alkaline cleaners and it is interesting to note the general correlation between pH of the detergent and the mass loss of borosilicate glass, as shown in Figure 29.
The author indicates that alkaline attack can remove significant amounts of glass. It is important to remember that the glass “skin” can be thus destroyed. If this is the case, the surface may be clean but actually prone to greater chemical attack by the solution to be contained.
Acid cleaning solutions
A classic mixture mentioned in the literature (Adams, 1972; Campion, 1975) for cleaning glassware is sulphuric acid (H2SO4) and sodium dichromate (Na2Cr2O7) (sulfochromic mixture). This mixture is effective in oxidizing organic material and dissolving many salts. According to Adams (1972), the principal hazard, aside from the danger to personnel, is the fact that chromic ions can be adsorbed by the glass. The author indicates that the adsorption

44
of the chromic ions can be avoided if nitric acid is substituted for the dichromate (sulfonitric mixture).
Sulfochromic mixture is dangerous to handle as it rapidly attacks the skin and can give rise to allergic reactions. Dichromates, like all hexavalent chromium salts, are strong irritants, allergy-causing, mutagenic and carcinogenic. It is also a major pollutant for aquatic media. Sulfochromic mixture is therefore not be used and must be replaced (Picot and Grenouillet, 1992). As for the mixture mentioned above (sulfonitric mixture), its use for stripping glassware is not advised as there is an explosion hazard (Picot and Grenouillet, 1992).
An acid that “cleans” more strongly than alkaline cleaners is hydrofluoric acid (Adams, 1972). This acid “cleaning agent” can be dangerous if it is not used properly. It is an irritant and strongly corrosive (Picot and Grenouillet, 1992). It should therefore be used in mixtures containing another acid, which are more effective in dissolving other oxides than silica (SiO2).
A mixture of sulphuric acid (H2SO4) and hydrofluoric acid (HF) is proposed by Adams (1972). The sulphuric acid dehydrates the glass surface.
Figure 29
Mass loss (mg/cm2) from borosilicate glass as a function of the pH of the detergent used (Adams, 1972). Copyright (1972). Reprinted by permission of Marcel Dekker Inc. via the Copyright Clearance Center.
Hydrofluoric acid mixed with nitric acid (HNO3) appears to be effective for cleaning borosilicate glass for vacuum applications (Adams, 1972). Campion (1975) proposes the same mixture with a detergent added.

45
Organic cleaners
Solutions containing chelating compounds can react selectively with contaminants or with the glass. Some such chelating compounds constitute detergents such as EDTA (see paragraph II.1.2). For this reason, chelating compounds should be avoided as complex-forming agents in radioactive cation standard solutions.
Vapor degreasing is also employed for removing organic contaminants. It involves suspending the item to be cleaned in the vapors from a hot organic solvent bath so that they condense on the item and run back into the bath. The choice of solvents is dictated by the contaminant. Such solvents as trichlorethylene, xylene and alcohol are commonly employed. It must be borne in mind, however, that these may be strongly adsorbed on the glass surface (Adams, 1972). Other cleaning processes
Other cleaning processes are described (Adams, 1972) but require further investigation:
• abrasive cleaners,
• ultrasonic agitation,
• heating of the glass to a temperature of around 400°C.
As previously mentioned, machine washing of the 5 mL ampoules is not sufficient to prevent the process of deterioration of the glass surface in a sealed ampoule used for the long-term storage of standard solutions. More thorough bibliographic research is therefore required to find out how these studies have been used and to determine what procedure to adopt.
II.3.2. Internal surface coatings
The inner glass surface of containers can be coated with linings and films in order to protect solutions contained in them.
One of the coating techniques involves the “SO2” treatment (Adams, 1972). It consists in removing the sodium ions in the hot glass for hydrogen ions that are supplied from an acid vapor during processing. The sodium ion that has migrated to the surface is tied up as sodium sulphate, so that diffusion continues. After the treatment, the sodium sulphate bloom is washed away. The net result is to deplete the sodium oxide concentration at the glass surface.
Other coatings and films such as metal oxides have been considered, including stannic oxide and titanium dioxide, as well as silicone and Teflon®9 organic films. However, coatings and films may not be completely effective as a shield, because the presence of defects is generally inevitable (pinholes and tiny cuts) (Adams, 1972). As 100 % integrity of the film cannot be guaranteed, such treatments must be excluded.
9 Registred trademark for a range of fluoropolymers, available as fibres and films, including PTFE polytetrafluoroethylene (PTFE) et fluoro-ethylene-propylene (FEP) (Duval and Duval, 1978).

46
II.3.3. Treatment with carrier solutions
The LNHB has established a cleaning procedure for all the chemical laboratory ware used in the LNHB. This consists of machine washing (see paragraph II.3.1) followed by treatment with the corresponding carrier solution.
The treatment consists in filling the laboratory ware with carrier solution for 24 hours, then emptying it and drying it in an oven. The goal is to avoid the significant adsorption of radioactive ions in the solution on the surface of the glassware used.

47
CONCLUSION Radioactivity standard solutions are prepared with the object to guarantee over time the concentration of a given radioelement or radionuclide, as expressed in the form of activity concentration (Ac = A/m (Bq/g), with A: activity and m: mass of solution). It is necessary to ensure that optimal conditions of thermodynamic stability are established from the preparation of radioactivity standard solutions:
• The chemical nature of the radioactive elements (cation or anion) determines the pH of the solubilization medium used, in relation to the phenomena of sorption which will be generated and of which the kinetics are relatively rapid (some 5 hours to 15 hours).
• The solubilization medium concentration (if it is an acid medium) should be established with due regard for experience feedback on the stability of the solution (low concentrations are to be preferred, so as to minimize acid corrosion of the glass ampoule containing the solution).
• The most stable oxidation state of the radioactive element (if there are more than one) should be selected for the pH of the solubilization medium. The same oxidation state should be adopted for the carrier element added in the same chemical form (pure salt).
• The carrier concentration should be determined to minimize the phenomena of sorption. It was calculated using an inactive to active mole ratio. This ratio was established by taking into account the half-life and atomic weight of the radionuclide. The same ratio, determined for a solution with an activity concentration of ~1 MBq/g, was applied to all standard solutions of this radionuclide prepared in the laboratory, whatever the activity concentration. It is always necessary to make allowance for the carrier concentration already present in the original solution, which can be substantial and vary considerably according to the means of production of the radionuclide and depending on the supplier. Preliminary determination of the concentration before dilution is therefore recommended.
When determining the optimal thermodynamic stability conditions, consideration should also be given to the fact that standard solutions are intended for the preparation of liquid and/or solid standard sources. The basic material for preparing the solubilization media is pure water. It must be made sure that it remains pure in the time. When the results of measurement of the activity concentration of a radionuclide are published, it is necessary to indicate:
o the chemical composition of the standard solution used to prepare the standard source measured: the nature and concentration of the solubilization medium used, and the nature and concentration of the carrier,
o the preparation of the standard source must be described, or a document in which it is described must be quoted.

48
The experimental conditions also constitute part of the results of measurement of an activity concentration, as shown from the following examples:
o Measurement of the activity concentration of a solution of 133Ba in an ionization chamber (liquid sources in sealed ampoules), showed that increasing the HCl acid concentration by 10 times resulted in 2 % error in the activity concentration measurement. Conversely, a similar increase (10 times) in the carrier concentration did not affect the measurement.
o Measurement of the activity concentration of a 204Tl solution was carried out during two BIPM international comparisons (in 1994 and 1997). It was observed that an increase by a factor of 9 of the carrier concentration in the international comparison in 1997, compared to that in 1994, resulted in considerable scatter in the measurement results, particularly for those made with proportional counters (solid sources).
Comparison of the glass ampoules of the NIST (also used by the BIPM for the International Reference System) and those of the CBNM (KIMAX N51A®) with the glass ampoules of the LMRI (FIOLAX®) in terms of specification ASTM E 438–90 indicated that, in both cases, it was “alumino-borosilicate” glass of Type I, Class B.
Examples found in the literature of the acid corrosion of glass show that 1 M HCl is more corrosive than 0.1 M HCl. Consequently, if the solutions are stable at 0.1 M concentration of acid, this concentration is to be preferred to that of a 1 M.
It is noted that the strong alkali hydroxides are more corrosive of glass. It is therefore desirable not to use them in solubilization media.
All glass is porous at the 0.1 nm scale. Glass subjected to leaching, when certain elements are selectively removed from the surface, can have increased superficial porosity to a depth of 1 to 10 nm. Increasing the surface porosity of the glass, results in there being more adsorption sites. Consequently, the phenomenon of sorption of radioactive ions could also occur after corrosion, during the storage of solutions in sealed-glass ampoules.
Examples found in the literature indicate that the sorption isotherms for ions present in different solutions on distinct solids, as a function of the pH, are of similar shapes in all cases:
o For cation sorption isotherms:
at low pH, cation sorption is minimal,
at high pH, cation sorption is maximal,
at intermediate pH, it is observed that the cation sorption increase “front” varies. However, the sorption of cations is generally substantial in the region of pH 7.
o For anion sorption isotherms:
at low pH, anion sorption is maximal,
at high pH, anion sorption diminishes or is minimal, depending on the nature of the corresponding anion. This reduction in sorption occurs relatively suddenly when the pH is in the vicinity of 7 or greater.

49
The presence of silanol groups (Si-OH) at the glass surface at acid pH is unfavourable to the adsorption of cations and favourable to the adsorption of anions. In alkaline and neutral aqueous media, silanol groups lose their proton (Si-O-) which is favourable to the sorption of cations and unfavourable to the sorption of anions at the glass surface. However, the glass corrosion by alkaline solutions is substantial. The use of such solubilization media is therefore to be generally not advised.
Consequently, the solubilization media usually selected for the preparation of standard solutions should be:
• acid for radioactive cations,
• water for radioactive anions (if the corresponding salt is soluble in aqueous solution and, particularly, by taking due account of its anion chemistry).
Quartz ampoules would not prevent sorption of ions of solution on the inner surface of the ampoule. The extra cost of such ampoules would therefore not be justified. All the glassware used by the LNHB for preparing radioactivity standard solutions is previously washed and treated with the corresponding carrier solution to avoid the adsorption of the radioactive ions of the solution on the internal surface of the container. When radioactivity standard solutions are prepared and preserved, to achieve maximum stability, a certain number of remaining uncertainties need to be clarified by carrying out additional studies and experiments. In view of the preceding considerations, The LNHB plans to draw up a single “LNE – LNHB reference document” indicating the chemical compositions to be used when preparing radioactivity standard solutions. These solutions are then used to prepare solid and/or liquid standard sources, which are measured by different techniques in order to determine the activity concentration of the radionuclide present in the standard solution.

50
REFERENCES
Adams P.B., 1969. The biology of glass. New Scientist, 2, pp. 25-27. Adams P.B., 1972. Glass containers for ultrapure solutions. Ultrapurity; methods and techniques. Zief and Speights, Dekker, New York, pp. 293-351 (Chapter 14). Adloff J.P., Guillaumont R., 1993. Fundamentals of radiochemistry. CRC Press, Inc. U.S.A., p. 145. Advocat T., 1991. Les mécanismes de corrosion en phase aqueuse du verre nucléaire R7 T7. Approche expérimentale. Essais de modélisation thermodynamique et cinétique. Thèse d’Université. Université Louis Pasteur (Strasbourg), pp. 15-19. Advocat T., Chouchan J., Ghaleb D., Vernaz E., 1993a. Mécanismes et vitesses de dissolution initiales du verre de référence R7 T7 inactif dans l’eau à 50°C. Technical Note NT-SCD-93-24. DCC-DRDD-CEA. Centre de la vallée du Rhône. BP 171. 30207 Bagnols sur Cèze Cedex, pp. 1-75. Advocat T., Ghaleb D., Vernaz E., 1993b. Mécanismes et lois cinétiques de la dissolution du verre de référence R7 T7 inactif dans l’eau à 90°C : mesures de la vitesse de dissolution initiale. Rapport CEA-R-5633, pp. 1-52. ASTM E 438–90, 1990. Standard Specification for Glasses in Laboratory Apparatus. American Society for Testing and Materials, pp. 296-297. Bunker B.C., Tallant D.R., Headley T.J., Turner G.L., Kirkpatrick R.J., 1988. The structure of leached sodium borosilicate glass. Physics and Chemistry of Glasses, 29, 3, pp. 106-120. Campion P.J., 1975. Procedures for accurately diluting and dispensing radioactive solutions . Monographie BIPM–1, pp. 1-32. Cavellec R., Lucas C., Simoni E., Hubert S., 1998. Structural Characterization of Sorption Complexes of Cm(III) at the Phosphate Minerals – Solution Interface. Using Laser Spectrofluorimetry. Radiochimica Acta, 82, pp. 221-225. Cotton F.A., Wilkinson G., 1966. Advanced inorganic chemistry. Interscience Publishers. John Wiley and Sons, Inc, New York, (Chapter 19, § 6). Drot R., Simoni E., 1999. Uranium (VI) and Europium (III) Speciation at the Phosphate Compounds – Solutions Interface. Langmuir, 15, pp. 4820-4827. Duval C., Duval R., 1978. Dictionnaire de la chimie et de ses applications. Technique et Documentation, 3e édition, p. 989. Dzombak D.A., Morel F.M.M. 1990. Surface complexation modeling: Hydrous Ferric Oxide. John Wiley & Sons, New York, pp. 45-47.

51
Elga-Vivendi-waters, 2002. Guide de l’eau pure et ultrapure, pp. 2-5. Geelhoed J.S., Hiemstra T., Van Riemsdijk W.H., 1997. Phosphate and sulfate adsorption on goethite: Single anion and competitive adsorption. Geochimica et Cosmochimica Acta, 61, 12, pp. 2389-2396. Hair M.L., 1975. Hydroxyl Groups on Silica Surface. Journal of Non-Crystalline Solids, 19, pp. 299-309. Iroulart M.G., 2006. Thermodynamic stability of radioactivity standard solutions. Applied Radiation and Isotopes, 64, 10-11, pp. 1265-1270. Jacquet-Francillon N., 1994. Les verres dans les stockages. Rapport CEA-R-5656, pp. 10-33. Jang H.M., Fuerstenau D.W., 1987. The nature of simple monovalent cation-silica interaction as reflected in the spin-lattice relaxation time of 23Na. Langmuir, 3, pp. 1114-1118. Jolivet J.P., 2000. Metal Oxyde Chemistry and Synthesis. From Solution to Solid State. John Wiley & Sons Ltd, Chichester, pp. 211-217. Kimble Kontess, 1996. The complete laboratory glassware catalog KK-148, p. XVI. Kragten J., 1978. Atlas of metal - Ligand Equilibria in Aqueous Solution. Ellis Horwood Limited Publishers, pp. 25-29. Lowenthal G.C., Wyllie H.A., 1973. The storage of radioactive solutions with standardised disintegration rates. Nuclear Instruments and Methods, 112, pp. 367-371. Manning B.A., Goldberg S., 1996. Modeling Competitive Adsorption of Arsenate with Phosphate and Molybdate on Oxide Minerals. Soil Science Society of America Journal, 60, pp. 121-131. Mc Cafferty E., Zettlermoyer A.C., 1971. Adsorption of Water Vapour on α-Fe2O3. Discussions
of the Faraday Society, 52, p. 248. Meng X., Letterman R.D., 1993. Modeling Ion Adsorption on Aluminium Hydroxide Modified Silica. Environmental Science & Technology, 27, 9, pp. 1924-1929. Millipore, 2002. L’eau pure au laboratoire. Séminaire, Paris (Chapters I and II). Picot A., Grenouillet P., 1992. La sécurité en laboratoire de chimie et de biochimie. 2e édition. Technique et Documentation, Paris, pp. 24-25, 132, 284. Plummer L.N., Busenberg E., 1982. The solubilities of calcite, aragonite and vaterite in CO2-H2O solutions between 0 and 90°C, and an evaluation of the aqueous model for the system CaCO3-CO2-H2O. Geochimica & Cosmochimica Acta, 46, pp. 1011-1040. Preiss I.L., Fink R.W., 1957. Carrier-Free Solution Storage in Glass. Nucleonics, 15, 10, p. 108.

52
Puukko E., Hakanen M., 1995. Surface complexation modelling: Experiments on the sorption of nickel on quartz. Lab. of Radiochemistry. University of Helsinki. Nuclear Waste Commission of Finnish Power Companies. Report YJT-95-12. Finland, pp. 1-19. Raggon F.C., Bacon F.R., 1954. The action of Hydrochloric Acid Solutions on Borosilicate and Soda-Lime glass Bottles. American Ceramic Society Bulletin, 33, 9, pp. 267-271. Ratel G., 1999. Trial comparison of activity measurements of a solution of 204Tl. BIPM. Rapport BIPM–97/03, pp. 1-3. Ratel G., Cassette P., 1999. International comparison of activity measurements of a solution of 204Tl. Working documents of the 15th CCRI (II) meeting, pp. 1-5. Ratel G., Michotte C., 2004. BIPM comparison BIPM.RI (II)-K1.Tl-201 of activity measure-ments of the radionuclide 201Tl. Metrologia, Technical Supplement 06015, pp. 1-18. Ringbom A., 1967. Les complexes en chimie analytique. Dunod, Paris, p. 5. Shand E.B., 1958. Glass Engineering Handbook. The Maple Press Company, York, p. 95. Sibbens G., 1991. A Comparison of NIST/SIR, NPL and CBNM 5 ml Ampoules. IRMM Internal Report GE/R/RN/14/91. Belgium, p. 2. Trudgill S.T., 1986. Solute Processes. John Wiley & Sons Ltd., New York, p. 8.


