Embed Size (px)
Citation preview
Monitoring the Post 2015 Framework for Disaster Risk Reduction : Proposed system of indicators and targets
Kazuko IshigakiRisk Knowledge EconomistUnited Nations Office for Disaster Risk Reduction 23-24 April 2014
The HFA Monitor
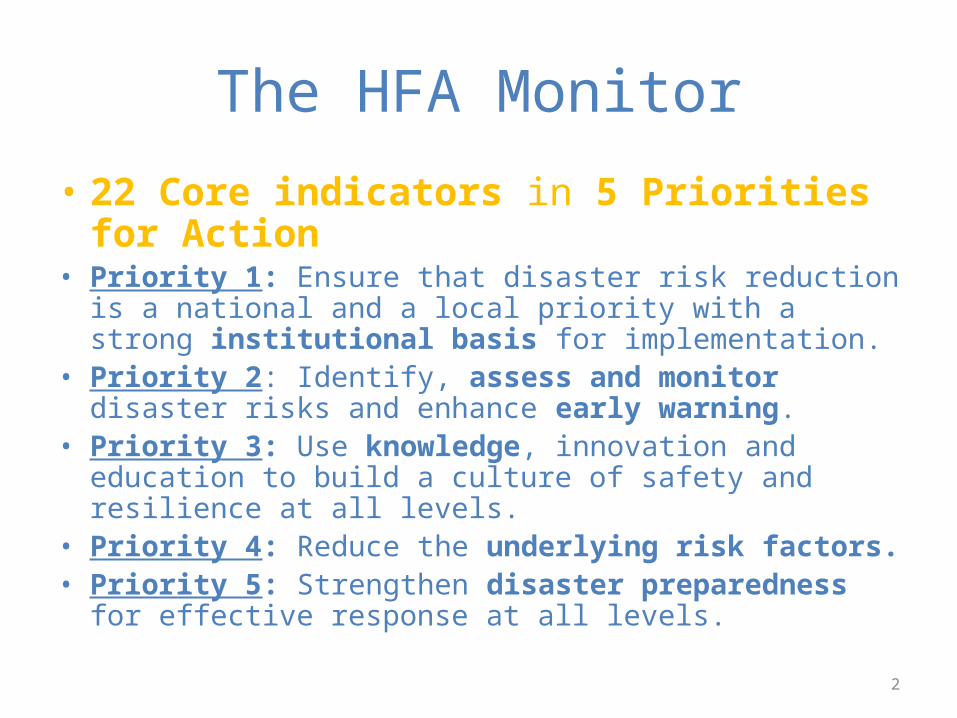
• 22 Core indicators in 5 Priorities for Action• Priority 1: Ensure that disaster risk reduction is a national and
a local priority with a strong institutional basis for implementation.
• Priority 2: Identify, assess and monitor disaster risks and enhance early warning.
• Priority 3: Use knowledge, innovation and education to build a culture of safety and resilience at all levels.
• Priority 4: Reduce the underlying risk factors. • Priority 5: Strengthen disaster preparedness for effective
response at all levels.
2
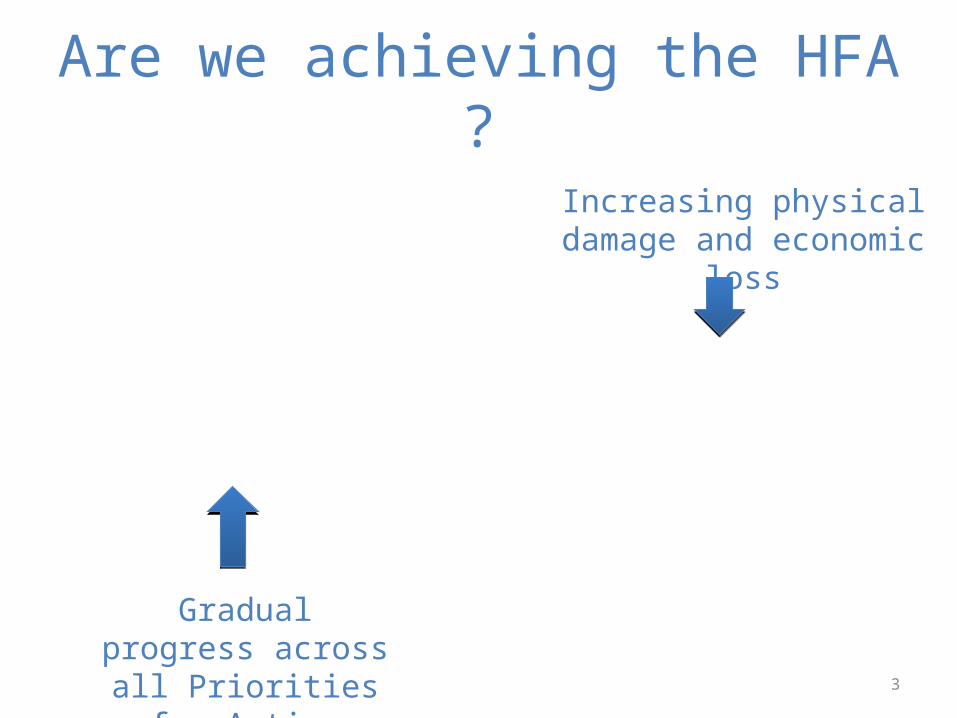
Are we achieving the HFA ?
Gradual progress across all Priorities for
Action
Increasing physical damage and economic loss
3
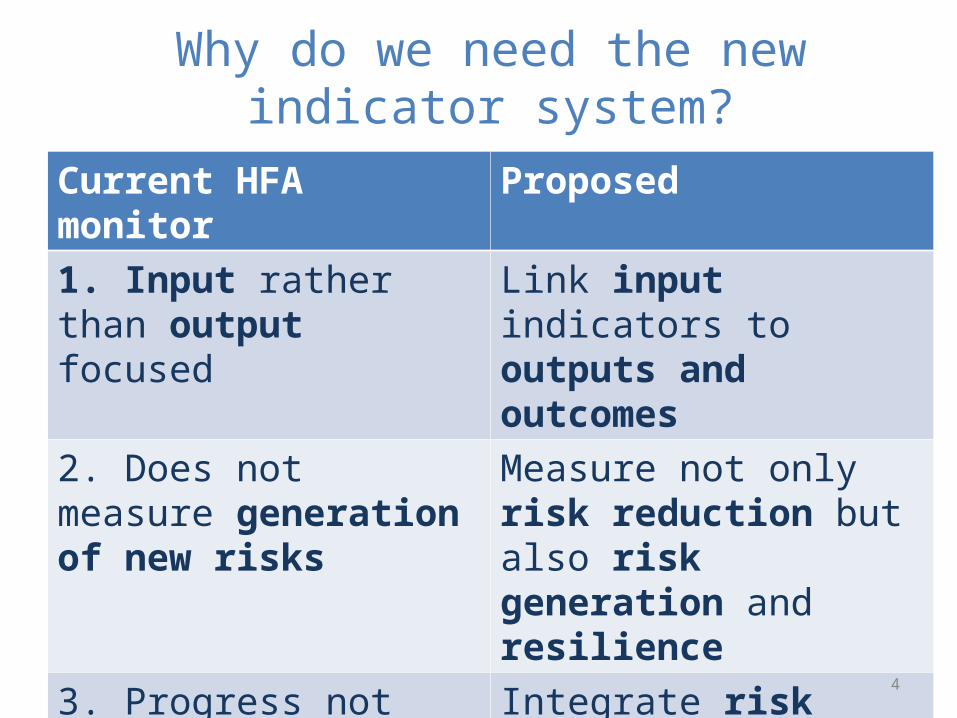
Why do we need the new indicator system?
Current HFA monitor Proposed
1. Input rather than output focused
Link input indicators to outputs and outcomes
2. Does not measure generation of new risks
Measure not only risk reduction but also risk generation and resilience
3. Progress not related to risk levels of country
Integrate risk levels in the system
4. Subjective, not allowing international benchmarking
Objective, supporting peer to peer learning
4
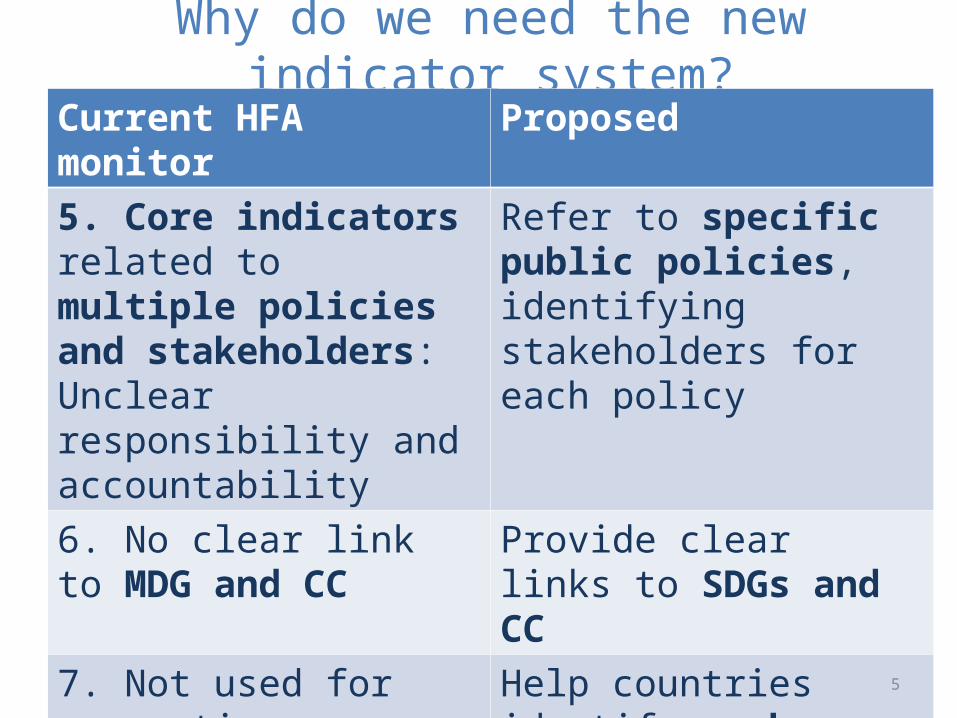
Why do we need the new indicator system?Current HFA monitor Proposed
5. Core indicators related to multiple policies and stakeholders: Unclear responsibility and accountability
Refer to specific public policies, identifying stakeholders for each policy
6. No clear link to MDG and CC
Provide clear links to SDGs and CC
7. Not used for supporting decision making
Help countries identify weak policy area by facilitating systematic understanding of disaster risk mechanism 5
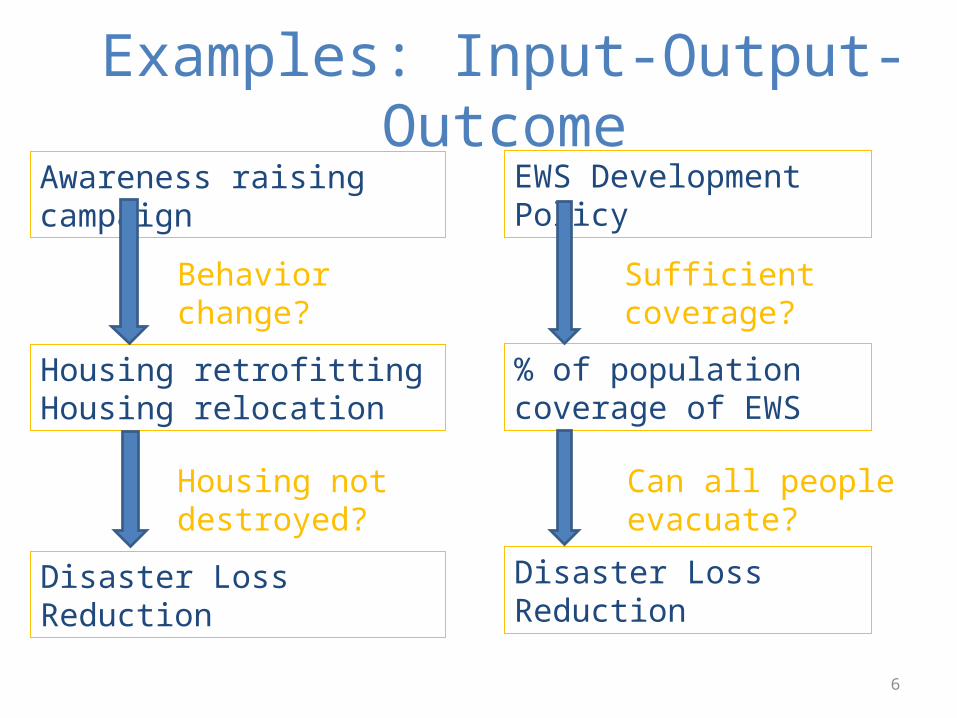
Examples: Input-Output-Outcome
6
EWS Development Policy
Disaster Loss Reduction
% of population coverage of EWS
Awareness raising campaign
Disaster Loss Reduction
Housing retrofittingHousing relocation
Sufficient coverage?
Can all people evacuate?
Behavior change?
Housing not destroyed?
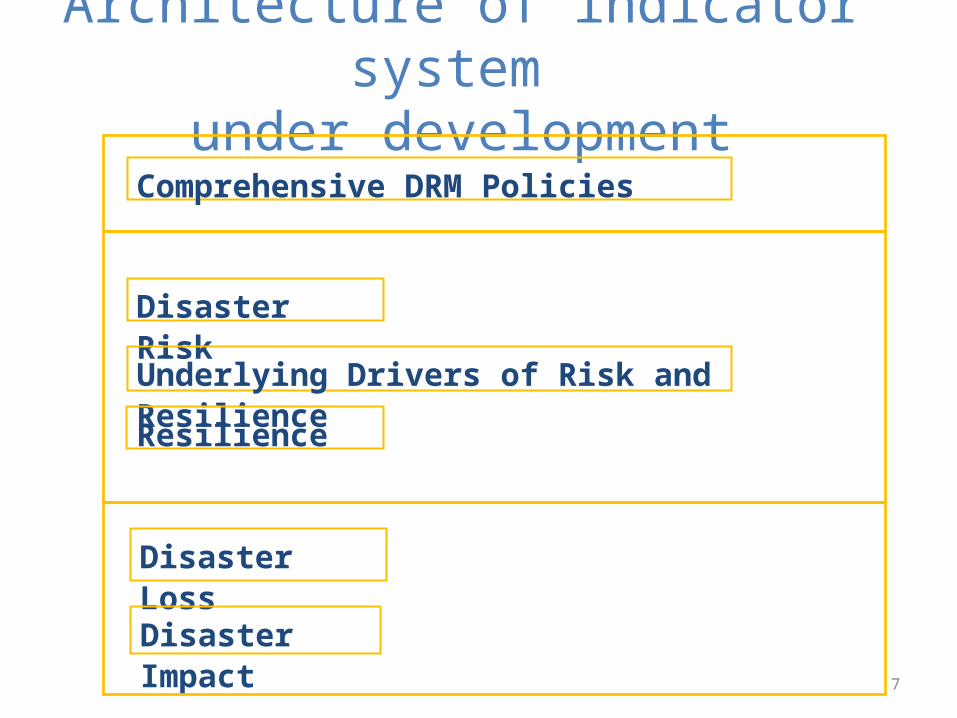
Architecture of indicator system under development
Comprehensive DRM Policies
Disaster Risk
Underlying Drivers of Risk and Resilience
Disaster Loss
Disaster Impact7
Resilience
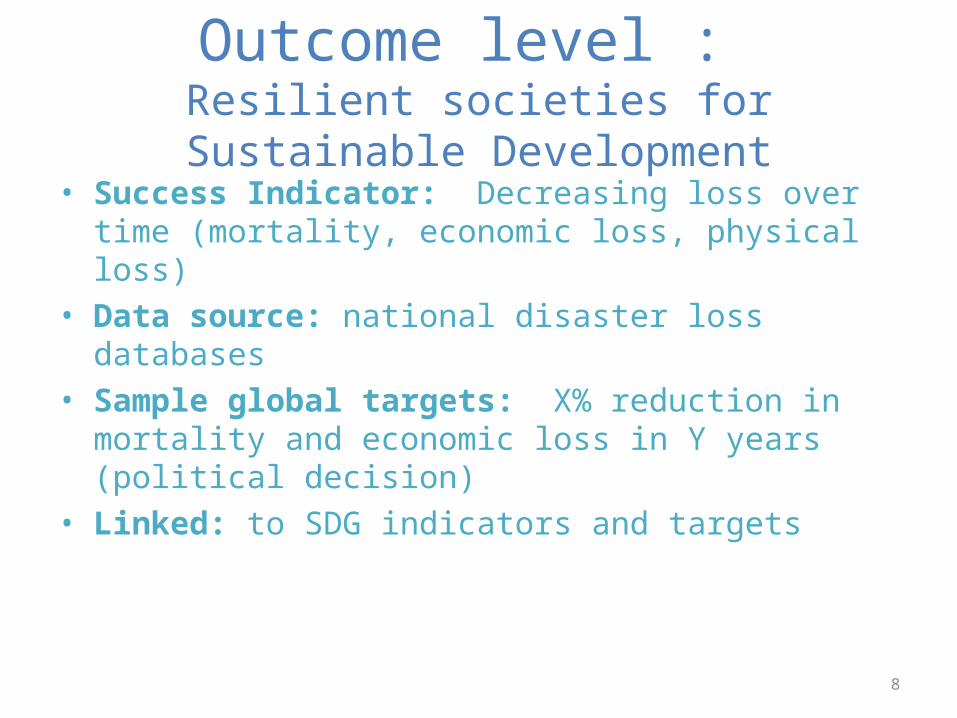
Outcome level : Resilient societies for Sustainable Development
• Success Indicator: Decreasing loss over time (mortality, economic loss, physical loss)
• Data source: national disaster loss databases• Sample global targets: X% reduction in mortality and
economic loss in Y years (political decision)• Linked: to SDG indicators and targets
8
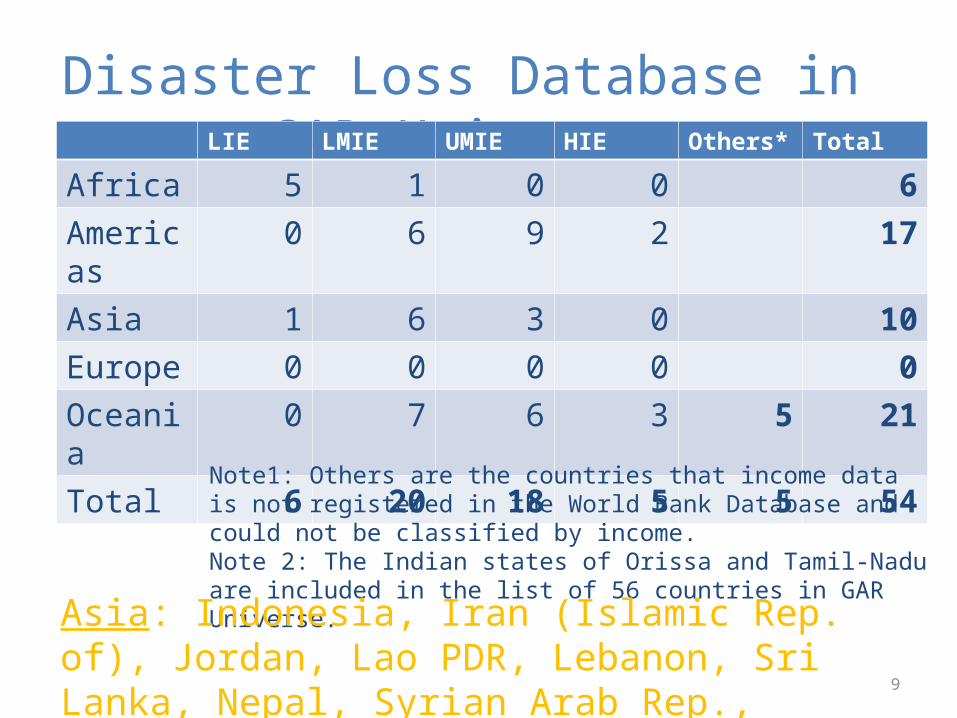
Disaster Loss Database in GAR UniverseLIE LMIE UMIE HIE Others* Total
Africa 5 1 0 0 6Americas 0 6 9 2 17Asia 1 6 3 0 10Europe 0 0 0 0 0Oceania 0 7 6 3 5 21Total 6 20 18 5 5 54
Note1: Others are the countries that income data is not registered in the World Bank Database and could not be classified by income.Note 2: The Indian states of Orissa and Tamil-Nadu are included in the list of 56 countries in GAR Universe.
Asia: Indonesia, Iran (Islamic Rep. of), Jordan, Lao PDR, Lebanon, Sri Lanka, Nepal, Syrian Arab Rep., Vietnam, Yemen.
9
Sustainable Development Goal (SDG)
10
• Post 2015 Millennium Development Goal framework
• 19 focus area: for example, poverty eradication; food security; health : education; gender; water; energy; equality; city and settlements; climate
• Not strong DRR integration at current proposal
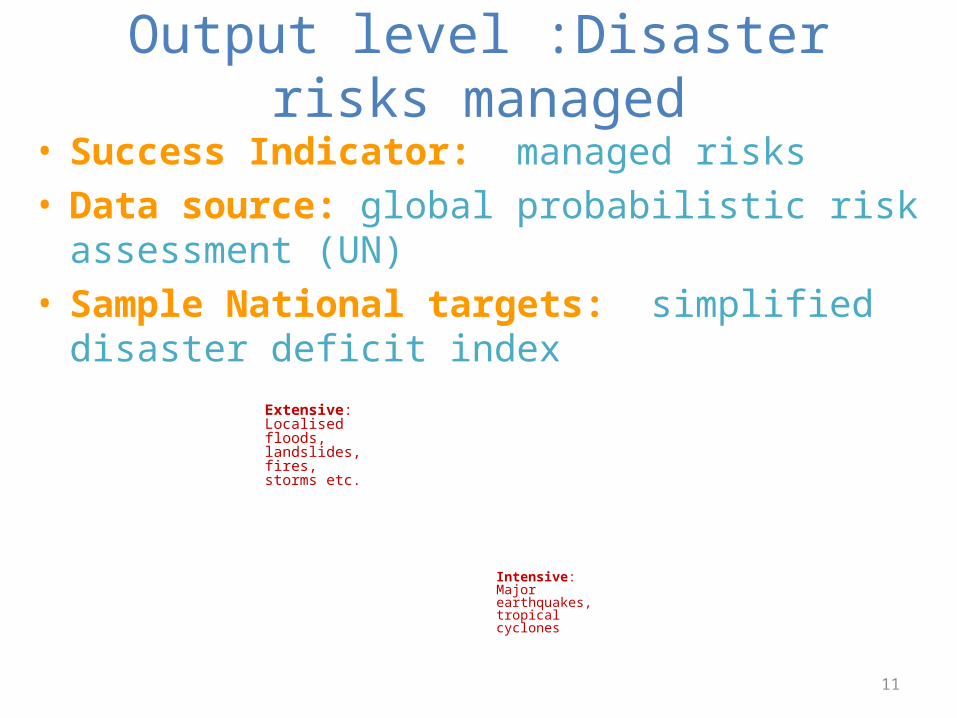
Output level :Disaster risks managed• Success Indicator: managed risks • Data source: global probabilistic risk assessment (UN)• Sample National targets: simplified disaster deficit index
Extensive:Localised floods, landslides, fires, storms etc.
Intensive:Major earthquakes, tropical cyclones
11
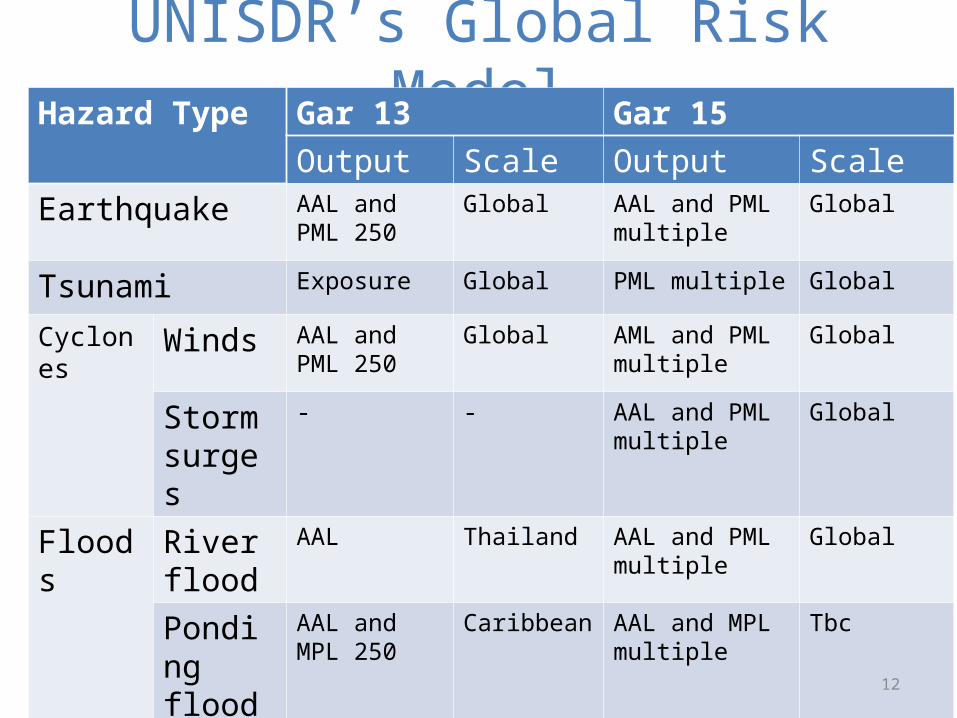
UNISDR’s Global Risk ModelHazard Type Gar 13 Gar 15
Output Scale Output ScaleEarthquake AAL and PML
250Global AAL and PML
multipleGlobal
Tsunami Exposure Global PML multiple Global
Cyclones Winds AAL and PML 250
Global AML and PML multiple
Global
Storm surges
- - AAL and PML multiple
Global
Floods River flood
AAL Thailand AAL and PML multiple
Global
Ponding flood
AAL and MPL 250
Caribbean AAL and MPL multiple
Tbc
Volcanic Ash - - Exposure Global12
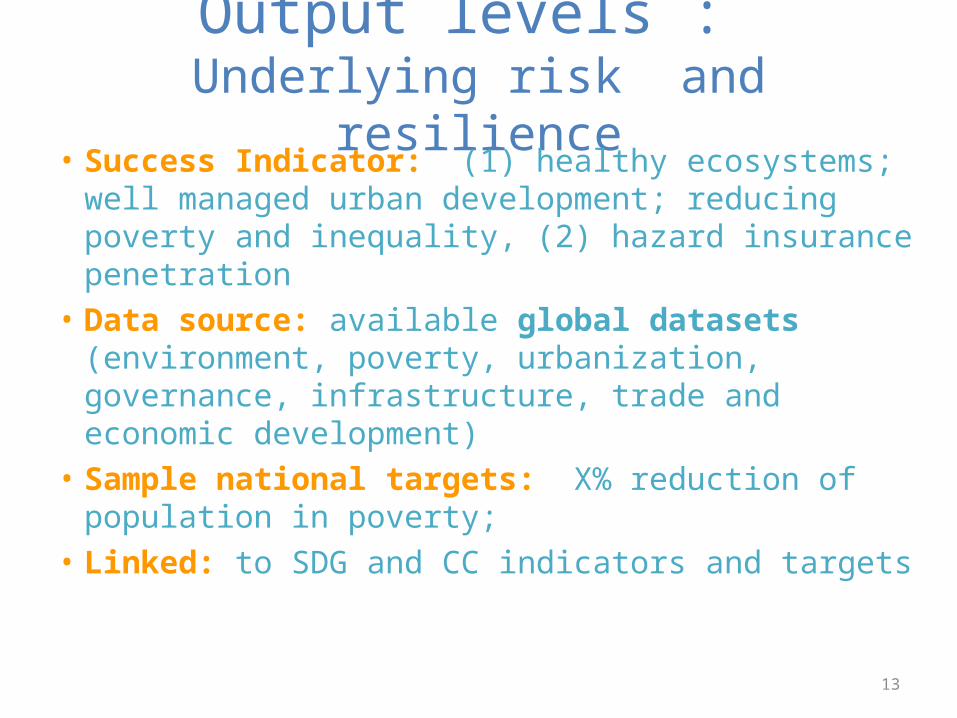
Output levels : Underlying risk and resilience
• Success Indicator: (1) healthy ecosystems; well managed urban development; reducing poverty and inequality, (2) hazard insurance penetration
• Data source: available global datasets (environment, poverty, urbanization, governance, infrastructure, trade and economic development)
• Sample national targets: X% reduction of population in poverty;
• Linked: to SDG and CC indicators and targets
13
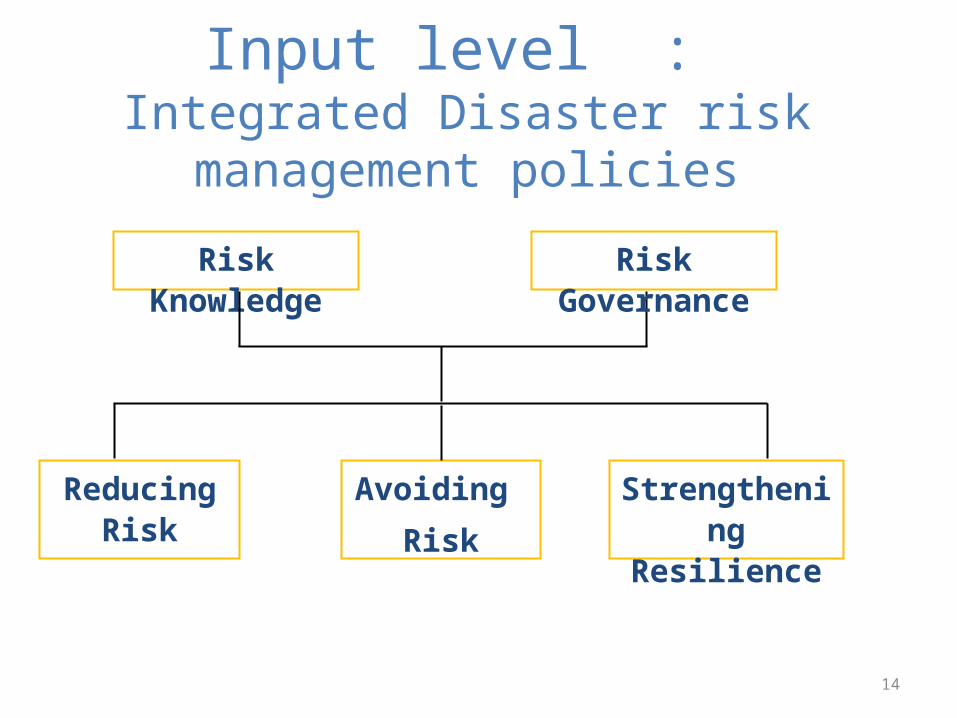
Input level : Integrated Disaster risk management policies
Risk Knowledge
Reducing Risk
Avoiding
Risk
Strengthening Resilience
Risk Governance
14
15
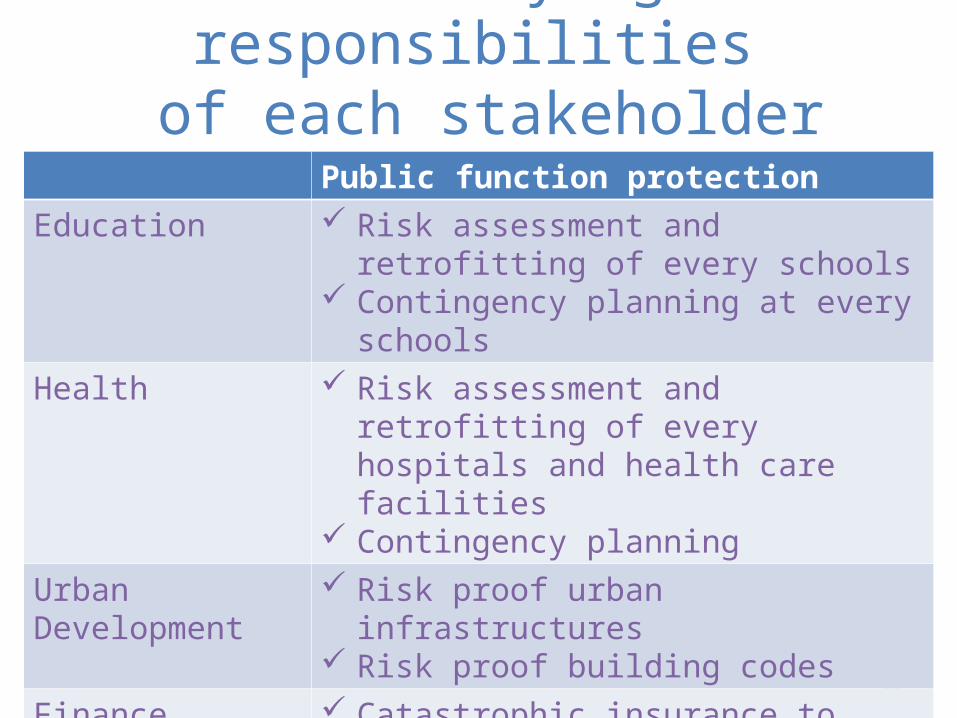
Clarifying responsibilities of each stakeholder (Examples)
Public function protectionEducation Risk assessment and retrofitting of every
schools Contingency planning at every schools
Health Risk assessment and retrofitting of every hospitals and health care facilities
Contingency planningUrban Development Risk proof urban infrastructures
Risk proof building codesFinance Catastrophic insurance to protect public
finance Support for hazard related property
insurance to protect private assets
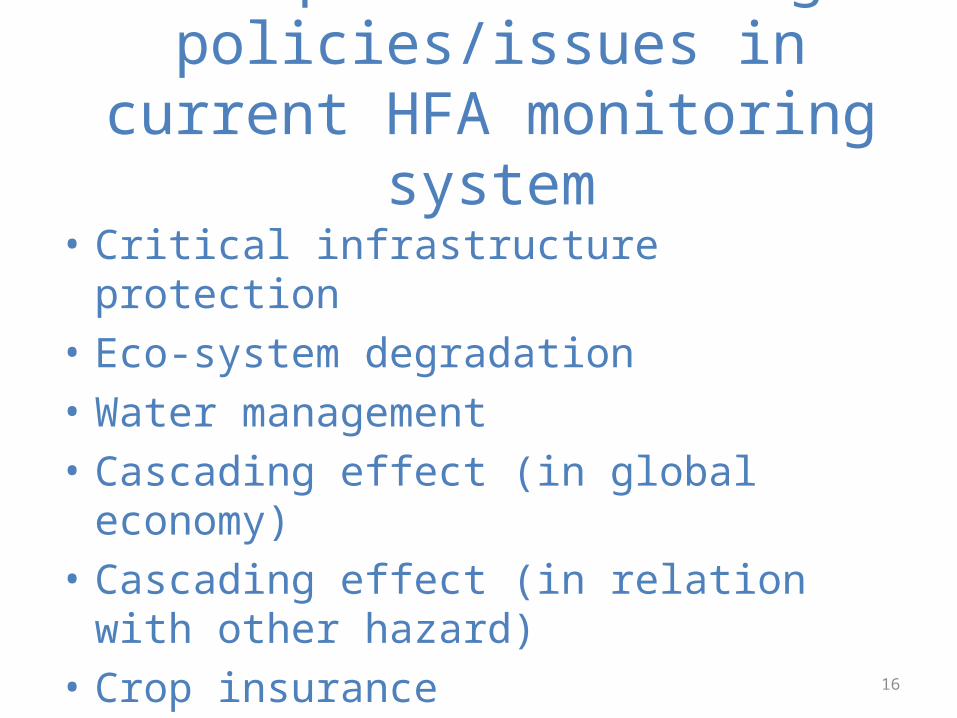
• Critical infrastructure protection• Eco-system degradation• Water management• Cascading effect (in global economy)• Cascading effect (in relation with other hazard)• Crop insurance
16
Examples of missing policies/issues in current HFA monitoring system
Input level : Disaster risk management policies
• Success Indicator: Effective DRM policies in place to support public sector, households and businesses. Wide array of policy indicators proposed as menu
• Data source: national multi-stakeholder monitoring• Sample national targets: % of houses built according to
seismic code; % of households with catastrophe insurance etc.
17
Implementing new indicator system
• Dashboard: each indicator family presented graphically highlighting progress towards targets
• Cluster analysis: groups of countries with similar challenges
• Periodicity of monitoring: every 4 years (suggested) linked to SDG periodicity
18
Timeline for development
• Q4 2013: design of system architecture and rationale (November 11 paper)
• Q1 2014: design of system architecture and rationale, Expert group meeting 1 (Vienna, 10 - 11 February); consultation to UN system and others, identification and testing of indicators
19
Timeline for development• Q2 2014: Expert group meeting 2, pilot testing
of indicator system, briefings at Regional DRR platforms
• Q3 and Q4 2014: Consultations at Prepcons for WCDRR
• Q1 2015: Adoption as part of post 2015 Framework for DRR
20
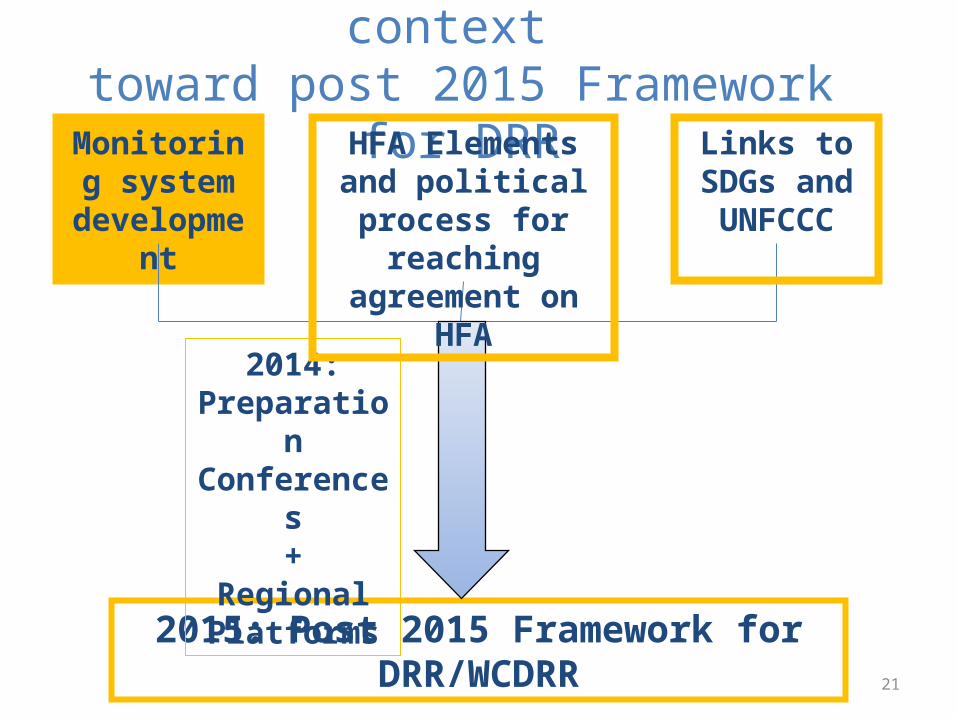
Monitoring system in the context toward post 2015 Framework for DRR
Monitoring system
development
2015: Post 2015 Framework for DRR/WCDRR
2014:Preparation Conferences
+Regional Platforms
HFA Elements and political process for reaching agreement
on HFA
Links to SDGs and UNFCCC
21
22
Discussion points
1. Recommendations for HFA2 monitoring mechanism:
(1) Is the proposed indicator system reasonable? (2) Suggest 3 to 5 recommendations for the
improvement
23
Discussion points
2. Resilience indicators: What should be the key indicators to monitor
resilience? Identify 3 to 5 possible indicators.
24
Discussion points
3.Target: (1)What kind of targets should we have at national level? Identify 3 to 5 possible national targets.
(If time permits)(2) What kind of targets do we need to establish at global level?
Thank you very much
Contact: Kazuko Ishigaki
United Nations Office for Disaster Risk Reduction
Tel: +41 22 917 [email protected]