Embed Size (px)
Citation preview
Monitoring live cell viability: Comparative study of fluorescence, oblique incidence reflection and phase contrast microscopy imaging techniques
Sylvie Landry and Peter L. McGhee Medical Physics Program, TBRHSC, 980 Oliver Road, Thunder Bay, Ontario, Canada, P7B 6V4
Robert J. Girardin and Werden J. Keeler Department of Physics, Lakehead University, 955 Oliver Road, Thunder Bay, Ontario, Canada, P7B 5E1
Abstract: The relative performances of fluorescence, oblique incidence reflection and phase contrast imaging techniques have been studied for the purpose of monitoring long-term cellular activity and cell viability of several types of normal and cancerous cells in cultures. Time-lapse movies of live cell imaging of untagged and green fluorescent protein (GFP) tagged cell lines are presented. Oblique incidence reflection microscopy is the simplest and least expensive method to implement, appears to be the least phototoxic to cells, and is recommended for use in long-term optical monitoring of cell viability.
©2004 Optical Society of America
OCIS codes: (170.0110) Imaging systems; (170.0180) Microscopy; (170.3880) Medical and biological imaging; (999.9999) Live cell imaging.
References and Links 1. T. Misteli (guest editor), “In vivo imaging,” Methods 29, 1-122 (2003). 2. F. Iborra, P. R. Cook and D. A. Jackson, “Applying microscopy to the analysis of nuclear structure and
function,” Methods 29, 131-141 (2003). 3. S.-W. Chu et al., “ In vivo developmental biology study using noninvasive multi-harmonic generation
microscopy,” Opt. Express 11, 3093-3099 (2003), http://www.opticsexpress.org/abstract.cfm?URI=OPEX-11-23-3093. 4. T. Haraguchi (preface to a series of reviews), “Live cell imaging: Approaches for studying protein dynamics
in living cells,” Cell Struct. Funct. 27, 333-334 (2002). 5. R. Ortega, G. Devès and P. Moretto, “In-air scanning transmission ion microscopy of cultured cancer cells,”
Nucl. Instrum. Meth. B 181, 475-479 (2001). 6. D. Margineantu, R. A. Capaldi and A. H. Marcus, “Dynamics of the mitochondrial reticulum in live cells
using Fourier imaging correlation spectroscopy and digital video microscopy,” Biophys. J. 79, 1833-1849 (2000).
7. C.-H. Lee, C.-L. Guo and J. Wang, “Optical measurement of the viscoelastic and biochemical responses of living cells to mechanical perturbation,” Opt. Lett. 23, 307-309 (1998).
8. W. T. Mason (editor), Fluorescent and luminescent probes for biological activity (Academic Press, 1999). 9. D. Yelin et al., “Multiphoton plasmon-resonance microscopy,” Opt. Express 11, 1385-1391 (2003),
http://www.opticsexpress.org/abstract.cfm?URI=OPEX-11-12-1385. 10. A. Miyawaki, A. Sawano and T. Kogure, “Lighting up cells: labelling proteins with fluorophores,” Nat. Cell
Biol. 5, S1-S7 (2003). 11. Y. Sako and T. Yanagida, “Single-molecule visualization in cell biology,” Nat. Rev. Mol. Cell Bio. 4, SS1-
SS5 (2003). 12. F. S. Wouters, P. J. Verveer and P. I. H. Bastiaens, “Imaging biochemistry inside cells,” Trends Cell Biol.
11, 203-211 (2001). 13. G. S. Harms et al., “Autofluorescent proteins in single-molecule research: Applications to live cell imaging
microscopy,” Biophys. J. 80, 2396-2408 (2001). 14. W. A. Mohler and J. G. White, “Multiphoton laser scanning microscopy for four-dimensional analysis of
Caenorhabditis elegans embryonic development,” Opt. Express 3, 325-331 (1998), http://www.opticsexpress.org/abstract.cfm?URI=OPEX-3-9-325.
15. D. Gerlich and J. Ellenberg, “4D imaging to assay complex dynamics in live specimens,” Nat. Cell Biol. 5, S14-S19 (2003).
(C) 2004 OSA 15 November 2004 / Vol. 12, No 23 / OPTICS EXPRESS 5754#5309 - $15.00 US Received 16 September 2004; revised 5 November 2004; accepted 8 November 2004
16. A. B. Verkhovsky et al., “Orientational order of the lamellipodial actin network as demonstrated in living motile cells,” Mol. Biol. Cell 14, 4667-4675 (2003).
17. B. Alberts et al., Molecular biology of the cell (Taylor & Francis Group, New York, 2002). 18. M. A. Lever et al., “Rapid exchange of histone H1.1 on chromatin in living human cells,” Nature 408, 873-
876 (2000). 19. P. B. Shashikanth, P. B. V. Prasad and G. Sambasiva Rao, “Oblique incidence reflection microscopy
(OIRM) study of hydrocarbon films,” Cryst. Res. Technol. 34, 1287-1292 (1999).
1. Introduction
Live cell imaging provides a wealth of information about the biophysics and biochemistry of cells as major technological improvements in optics, lasers, detectors, fluorescent probes and image processing software lead to increasingly sophisticated imaging systems [1-8]. In spite of this, the rapidity of structural movement and macromolecular streaming in healthy cells pose major challenges, particularly if development in a culture of cells is to be observed over tens of hours. First and foremost a suitable environment, including a proper growth medium and constant physiological temperature, must be provided for the specimen to remain healthy and viable. Careful thought must also be given to the choice of illumination source to be used when monitoring cell activity in order to minimize any photodamage effects. Live cell imaging usually involves labeling with fluorescent probes. Such tagging allows the monitoring of the progression of several specific cell components simultaneously [8-14]. However, if nearly continuous illumination is required, photobleaching and phototoxicity will cause degradation of the sample [15]. Thus, alternative approaches that do not require labeling are of particular interest.
Human cell lines that were either unlabeled or transfected with actin-GFP or histone H1-GFP were used in order to assess the relative stresses induced by different types of illumination during the monitoring of live cells.
2. Equipment
2.1 Fluorescence and oblique incidence reflection imaging system
Time-lapse fluorescence imaging was performed using an epi-fluorescence microscope (Nikon Eclipse E400 equipped with a 100W halogen source) and cooled CCD camera system (Apogee Instruments Inc. KX32ME). For the purpose of imaging live cells labeled with GFP, a blue excitation filter cube was used (Nikon B-3A, Excitation: 420-490nm, Dichroic Mirror: cut-on 505nm long-pass (LP), Emission: cut-on 520nm LP).
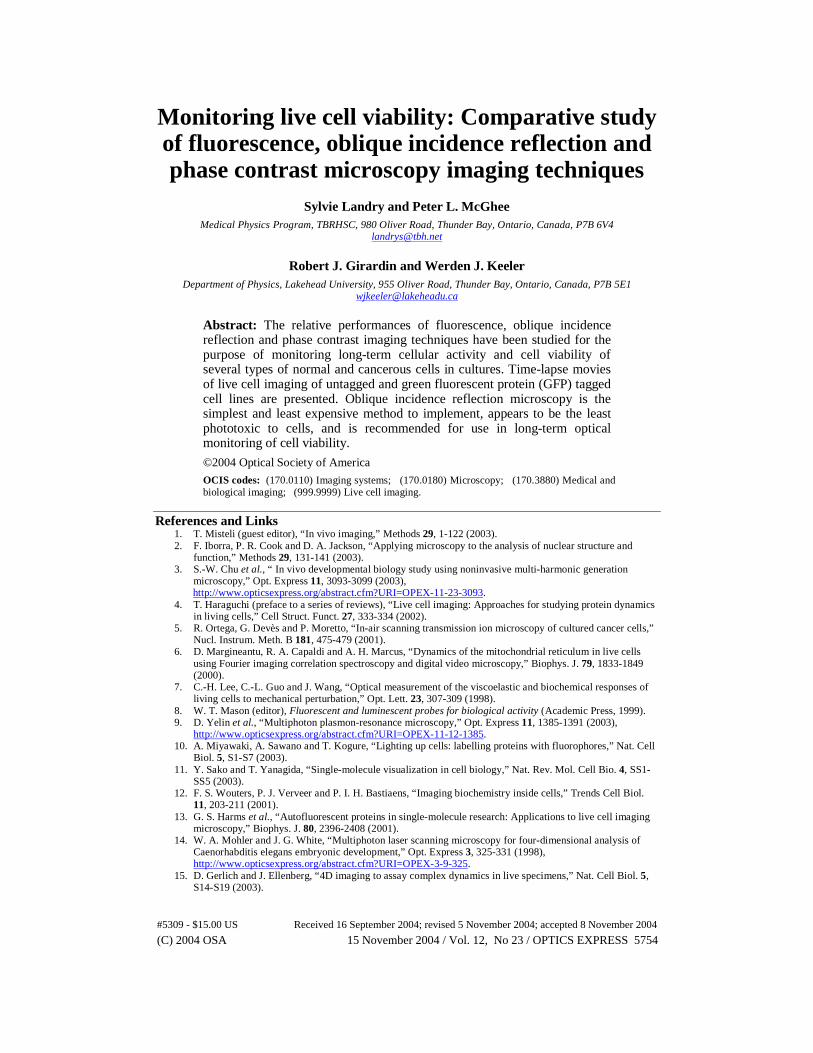
Except for the light source, time-lapse oblique incidence reflection imaging was accomplished with the same imaging system. Two voltage-controlled 25W incandescent bulbs located over the microscope stage were used to uniformly illuminate the sample (see Fig. 1(a)). The configuration is such that the incident light rays strike the cover glass at an oblique angle so light collected by the objective is due to reflection and refraction from structural components in the cell (see Fig. 1(b)).
Fig. 1. (a) Oblique incidence reflection imaging system. Two low-intensity incandescent lamps located over the microscope stage illuminate the sample. (b) Schematic ray diagram showing the useful subset of unfocussed lamp rays interacting with the sample.
(C) 2004 OSA 15 November 2004 / Vol. 12, No 23 / OPTICS EXPRESS 5755#5309 - $15.00 US Received 16 September 2004; revised 5 November 2004; accepted 8 November 2004

In general, optical resolution is inversely proportional to the sum of the numerical aperture (NA) of the objective and the NA of the method of illumination. Oblique illumination occurs in the solid angle around the outside of the tapered front lens assembly of the objective. Oblique imaging thus provides a combined resolution similar to that of dark field microscopy, although both methods yield lower resolution than epi-fluorescence.
Fluorescence and oblique imaging may be performed separately, concurrently or sequentially without changing any optical components. The simplicity of this combined system makes for a low cost, yet highly versatile and useful tool.
In a typical experiment, either a 40X or 60X dry objective lens was used (Nikon CFI Achromat series with NA=0.65 and NA=0.80 respectively). Dry objectives yield lower resolution and sensitivity than liquid immersion alternatives. However, the irregular interface associated with such a liquid produces non-uniformities in the oblique imaging illumination field that leads to unacceptable artifacts. Because of these artifacts, and since oblique imaging is comparatively bright, only dry objectives were used. Pixels were binned 2 by 2 in order to reduce file size and improve the visibility of dimmer cell regions. When in use, the intensity of the epi-fluorescence illuminator was adjusted to the minimum level required to permit fluorescence emission sufficient for acceptable image contrast in a suitable exposure time.
2.2 Phase contrast imaging system
Time-lapse phase contrast imaging was performed using an inverted microscope (Olympus IX51 equipped with a 100W halogen source) and CCD camera system (Photometrics CoolSnapcf). Of all three imaging systems, phase contrast is the most expensive and requires special accessories such as phase objectives and a condenser. Also, a long working distance condenser (hence lower NA) must be used to accommodate the stage incubator.
For all live cell imaging experiments, a 40X phase contrast dry objective lens (Olympus UPLFL series, NA=0.75) and long working distance condenser (Olympus, NA=0.55) were utilized. To minimize photodamage, the intensity of the halogen illuminator was adjusted to the lowest level that would still provide acceptable image brightness and exposure time.
3. Cell culturing and sample preparation
All cell lines used in this study were monolayer-adherent type cultures of human origin, and were kindly donated by Dr. John Th’ng. Table 1 provides information on cell lines for which time-lapse movies are presented. Actin-GFP and histone H1-GFP fusion proteins were selected for their very different visual representation of cycling cells. Actin is one of the major filamentary structural proteins that is a component of the cytoskeleton. It plays a key role in general cell motility [16,17]. Histone H1 belongs to the family of histones that function to organize DNA into chromosomes, and was used to visualize chromosome dynamics throughout cell division [17,18].
Table 1. Cell lines for which time-lapse movies are presented.
Cell Line Description Morphology Lifespana GFP Label HSF-55 Normal skin Fibroblast Limitedb Untagged MCF-7 Breast cancer Epithelial Unlimited Histone H1 HeLa Cervical cancer Epithelial Unlimited Untagged or Actin
aLifespan in vitro. bTypically divides 25 to 40 times before senescence.
Cells were grown at 37oC in a humidified 5% CO2 incubator in Dulbecco’s Modified Eagle’s Medium (DMEM) supplemented with 10% fetal bovine serum (FBS) and 1% antibiotic. In order to improve image contrast, cells were washed once with phosphate buffered saline (PBS) prior to seeding on 22mm round cover glass. This step eliminates the phenol red and substantially reduces background auto-fluorescence. After seeding onto cover glass, cells were incubated in supplemented phenol red-free RPMI 1640 medium. They were
(C) 2004 OSA 15 November 2004 / Vol. 12, No 23 / OPTICS EXPRESS 5756#5309 - $15.00 US Received 16 September 2004; revised 5 November 2004; accepted 8 November 2004

allowed to grow for 36 hours to 48 hours until suitable cell density was reached (typically 40% to 60% area coverage).
A portable heated stage incubator with removable chamber (developed by the authors) was used for all live cell imaging sessions. The chamber is filled with 5% CO2 phenol red-free RPMI 1640 medium, sealed with a cell sample cover glass and maintained at 37oC.
4. Discussion
Fluorescence and phase contrast microscopy are both well-established methods for live cell imaging. Although oblique incidence reflection microscopy has been used in studies of thin films [19], an extensive search of the literature did not reveal any published prior attempt at implementing this technique for monitoring cellular activity. Table 2 provides information associated with each movie presented. Note that image frames were selected and cropped, and movie files were compressed in order to comply with image frame size and movie file size constraints.
Table 2. Time-lapse movies: a summary.
Movie Cell Line GFP Label Technique Figure Exposure Lapsed FPSe Lengthf HeLa Actin Fluorescence 2a 5 s 40 s 24 2.5 h MCF-7 H1 Fluorescence 2b 1 s 15 s 24 1.5 h HeLa Untagged Phase 3 1 s 2 min 12 6 h HeLa Untagged Oblique 4a 5 s 30 s 24 5 h HeLa Untagged Oblique 4b 5 s 30 s 24 4 h HSF-55 Untagged Oblique 4c 5 s 5 min 12 7 h HeLa Actin Fluorescence
and Oblique 7 5 s 40 s 24 5 h
d Approximate time lapse between frames (s = second, min = minute). e Number of frames per second used in making the movie. f Length of movie in real time (h = hour).
Figure 2 presents live cell fluorescence imaging via time lapse sequences of actin-GFP and histone H1-GFP labeled cervical cancer (HeLa) and breast cancer (MCF-7) cells. This highly target-specific tagging technique confers positive identification to cellular structures but employs fluorophores with an excitation light intensity threshold that inevitably results in photodamage. Because of this threshold, photobleaching and decreased cell activity were apparent after only a few hours of continuous illumination (data not presented). The pace of these adverse effects was accelerated when imaging with a high NA objective was attempted (e.g., 100X oil immersion). Selecting for cells that are expressing the fluorescent protein usually requires several cell cycles to achieve. Hence a probing method such as fluorescence is less suited for cell lines of finite lifespan (e.g., normal skin fibroblast HSF-55).
Phase contrast and oblique incidence reflection time-lapse images of unlabeled HeLa and HSF-55 cell lines are presented in Fig. 3 and Fig. 4 respectively. Both imaging methods provide intricate but different visually non-specific representations of unlabeled cells. In addition to cell boundaries, many cell components such as macromolecules, organelles and nucleoli are clearly visible via phase contrast. However, phase images of rolled-up cells are often surrounded by bright halos concealing fainter details. Oblique incidence reflection microscopy provides a means for monitoring rapid macromolecular streaming as well as structural movement while potentially exposing the sample to the least amount of light. Although cell boundaries appear much fainter than bright macromolecules, image processing may be applied to enhance the fainter details (see Fig. 5).
An application of particular interest is the low intensity long-term optical monitoring of live cells that have been therapeutically treated with high intensity light, chemicals, radiation
(C) 2004 OSA 15 November 2004 / Vol. 12, No 23 / OPTICS EXPRESS 5757#5309 - $15.00 US Received 16 September 2004; revised 5 November 2004; accepted 8 November 2004
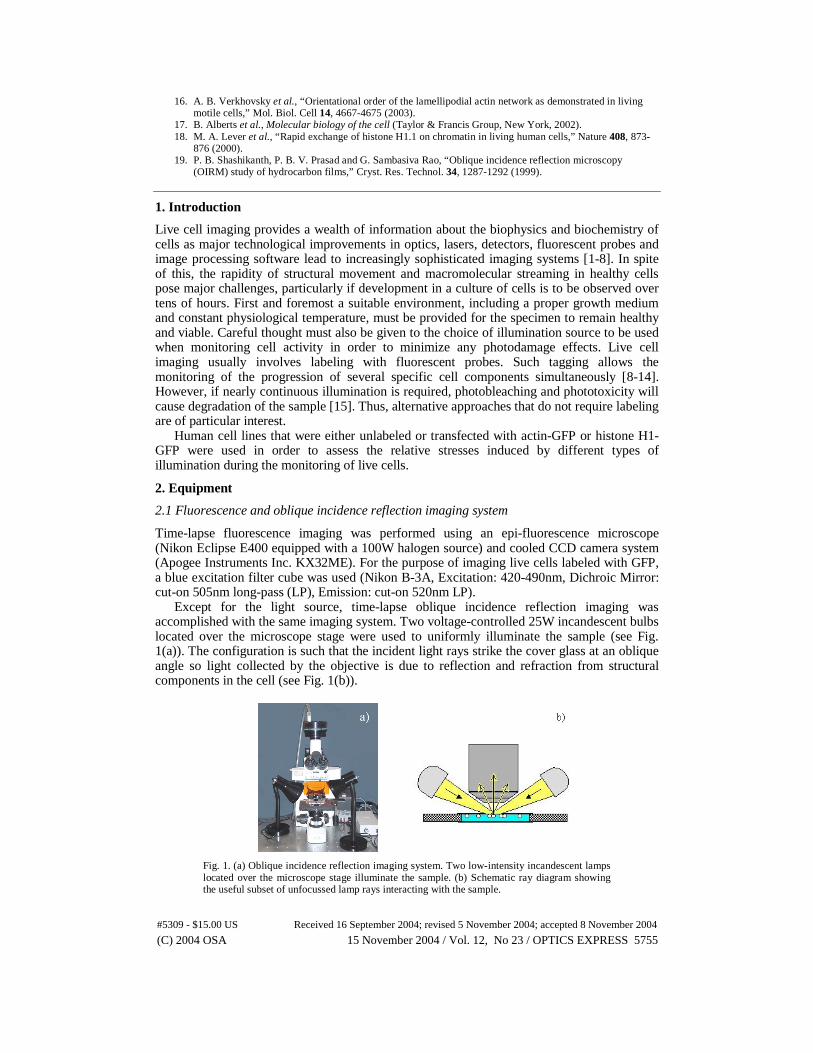
or any combination thereof. Under such treatment conditions, tagging could substantially alter the nature of the sample. Phase contrast, dark field and oblique microscopy methods can all image untagged cells. However, the oblique method does not require a condenser with the associated light concentrating effects and was observed to be the least phototoxic.
Fig. 2. Fluorescence: (a) (2.5 MB) Time-lapse sequence of Actin-GFP labeled HeLa cells showing plasma membrane ruffling (left), cell division (right) and overall cell motility. (b) (2.4 MB) Time-lapse sequence of histone H1-GFP labeled MCF-7 cells illustrating chromosome dynamics throughout mitosis. Scale = 20µm.
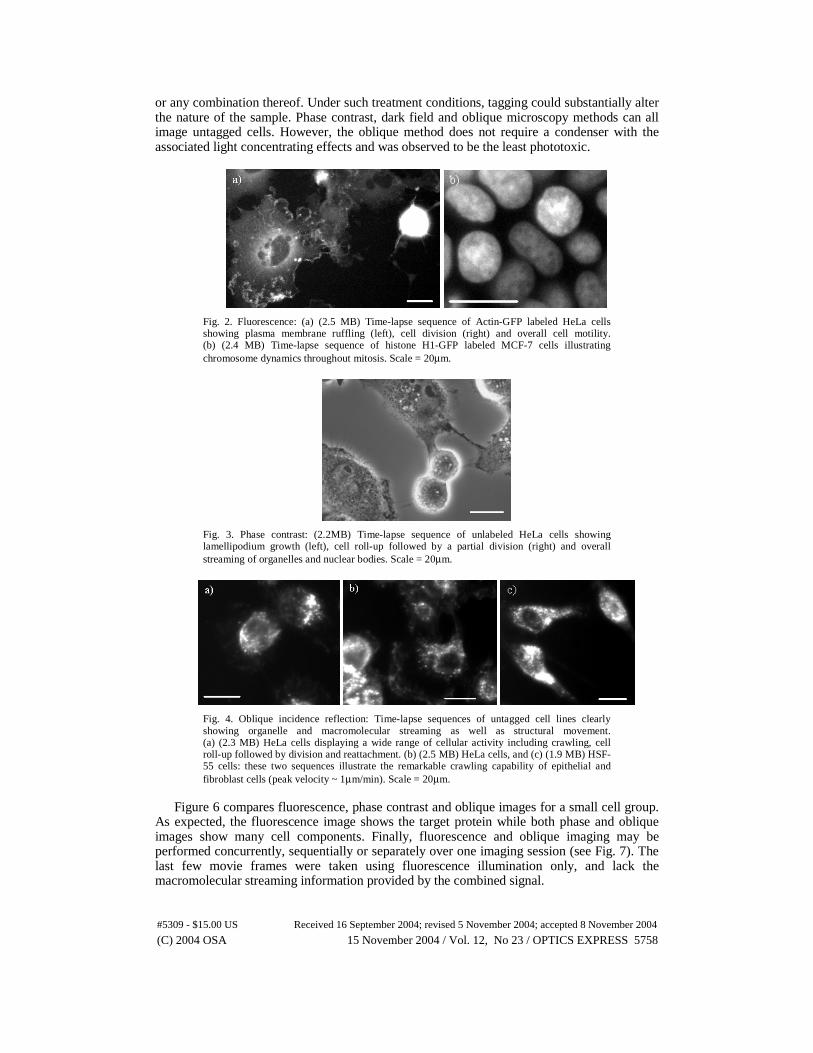
Fig. 3. Phase contrast: (2.2MB) Time-lapse sequence of unlabeled HeLa cells showing lamellipodium growth (left), cell roll-up followed by a partial division (right) and overall streaming of organelles and nuclear bodies. Scale = 20µm.
Fig. 4. Oblique incidence reflection: Time-lapse sequences of untagged cell lines clearly showing organelle and macromolecular streaming as well as structural movement. (a) (2.3 MB) HeLa cells displaying a wide range of cellular activity including crawling, cell roll-up followed by division and reattachment. (b) (2.5 MB) HeLa cells, and (c) (1.9 MB) HSF-55 cells: these two sequences illustrate the remarkable crawling capability of epithelial and fibroblast cells (peak velocity ~ 1µm/min). Scale = 20µm.
Figure 6 compares fluorescence, phase contrast and oblique images for a small cell group.
As expected, the fluorescence image shows the target protein while both phase and oblique images show many cell components. Finally, fluorescence and oblique imaging may be performed concurrently, sequentially or separately over one imaging session (see Fig. 7). The last few movie frames were taken using fluorescence illumination only, and lack the macromolecular streaming information provided by the combined signal.
(C) 2004 OSA 15 November 2004 / Vol. 12, No 23 / OPTICS EXPRESS 5758#5309 - $15.00 US Received 16 September 2004; revised 5 November 2004; accepted 8 November 2004

Fig. 5. Oblique incidence reflection: Untagged HeLa cell still frames 4(a) and 4(b) processed with a non-linear function in order to compress the dynamic range of each image so that the faintest and brightest components of the cells are visible. Scale = 20µm.
Fig. 6. (a) Fluorescence, (b) phase contrast and (c) oblique incidence reflection images of the same histone H1-GFP labeled breast cancer (MCF-7) cell group. Scale = 20µm.
Fig. 7. Fluorescence and oblique incidence reflection imaging: (2.4 MB) Time-lapse series of actin-GFP labeled HeLa cells illustrating concurrent, sequential and separate illuminations. Examples of still frames taken from the sequence: (a) combined fluorescence and oblique, (b) oblique only, and (c) fluorescence only. Scale = 20µm.
5. Summary
Fluorescence imaging requires light levels greater than a minimum excitation threshold resulting in greater photodamage to live cells. Cell viability beyond a few hours could not be maintained with continuous fluorescence illumination. Phase contrast and oblique incidence reflection imaging techniques do not require cell tagging and can image any type of adherent cell culture. They provide live cell monitoring capability for periods that are many hours longer than typically achievable with fluorescence imaging.
Oblique illumination is the simplest and least expensive method to implement and, with no condenser, appears to expose the sample to the least amount of light. Live cell viability for up to 20 hours could be maintained even with continuous illumination and a sealed incubator.
Acknowledgments
We thank John Th’ng for donating the cell lines and for invaluable discussions pertaining to this work. We also thank Ellie Prepas and Allan MacKenzie for access to and use of the phase contrast microscope. This work was funded by the Northern Cancer Research Foundation and the Natural Sciences and Engineering Research Council of Canada.
(C) 2004 OSA 15 November 2004 / Vol. 12, No 23 / OPTICS EXPRESS 5759#5309 - $15.00 US Received 16 September 2004; revised 5 November 2004; accepted 8 November 2004