Embed Size (px)
Citation preview

62
Monitoring and analyzing satellite signals
© g
etty
imag
es®
/ Bla
ckJa
ck3D
Satellite communications
R&S®GSACSM communication system monitoring is a software solution for moni-
toring and analyzing satellite signals. It has a wide array of useful features for
operators of satcom systems, regulatory authorities, and public safety and security
authorities.
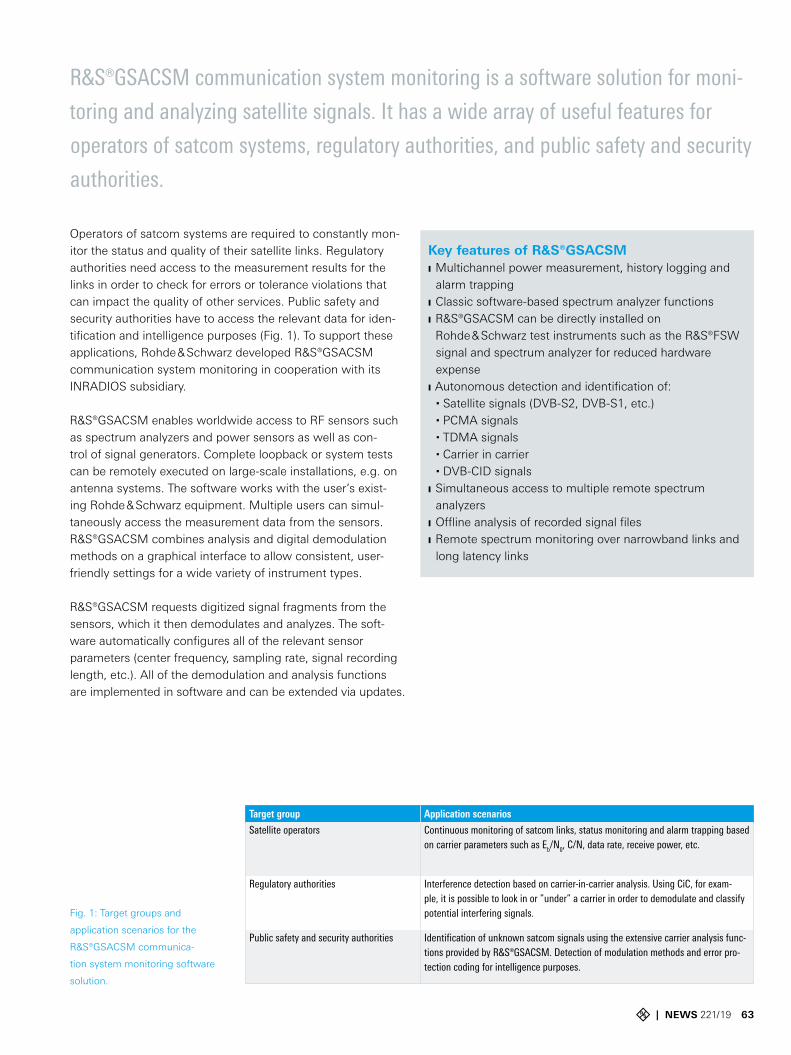
Operators of satcom systems are required to constantly mon-itor the status and quality of their satellite links. Regulatory authorities need access to the measurement results for the links in order to check for errors or tolerance violations that can impact the quality of other services. Public safety and security authorities have to access the relevant data for iden-tification and intelligence purposes (Fig. 1). To support these applications, Rohde & Schwarz developed R&S®GSACSM communication system monitoring in cooperation with its INRADIOS subsidiary.
R&S®GSACSM enables worldwide access to RF sensors such as spectrum analyzers and power sensors as well as con-trol of signal generators. Complete loopback or system tests can be remotely executed on large-scale installations, e.g. on antenna systems. The software works with the user’s exist-ing Rohde & Schwarz equipment. Multiple users can simul-taneously access the measurement data from the sensors. R&S®GSACSM combines analysis and digital demodulation methods on a graphical interface to allow consistent, user-friendly settings for a wide variety of instrument types.
R&S®GSACSM requests digitized signal fragments from the sensors, which it then demodulates and analyzes. The soft-ware automatically configures all of the relevant sensor parameters (center frequency, sampling rate, signal recording length, etc.). All of the demodulation and analysis functions are implemented in software and can be extended via updates.
Target group Application scenarios
Satellite operators Continuous monitoring of satcom links, status monitoring and alarm trapping based on carrier parameters such as Eb/N0, C/N, data rate, receive power, etc.
Regulatory authorities Interference detection based on carrier-in-carrier analysis. Using CiC, for exam-ple, it is possible to look in or ”under” a carrier in order to demodulate and classify potential interfering signals.
Public safety and security authorities Identification of unknown satcom signals using the extensive carrier analysis func-tions provided by R&S®GSACSM. Detection of modulation methods and error pro-tection coding for intelligence purposes.
Fig. 1: Target groups and
application scenarios for the
R&S®GSACSM communica-
tion system monitoring software
solution.
Key features of R&S®GSACSM ❙ Multichannel power measurement, history logging and alarm trapping
❙ Classic software-based spectrum analyzer functions ❙ R&S®GSACSM can be directly installed on Rohde & Schwarz test instruments such as the R&S®FSW signal and spectrum analyzer for reduced hardware expense
❙ Autonomous detection and identification of: ■ Satellite signals (DVB-S2, DVB-S1, etc.) ■ PCMA signals ■ TDMA signals ■ Carrier in carrier ■ DVB-CID signals
❙ Simultaneous access to multiple remote spectrum analyzers
❙ Offline analysis of recorded signal files ❙ Remote spectrum monitoring over narrowband links and long latency links
| NEWS 221/19 63

Examples of standalone and client/server scenarios
1. Standalone 3. Distributed sensors, multiple users
2. Distributed sensors, single user
CSM user
R&S®NRQ6power sensor
R&S®GSACSM user R&S®GSACSM user
Site 1 Site 2
Site 3
R&S®NRQ6power sensor
R&S®NRQ6power sensor
R&S®NRQ6power sensor
R&S®GSACSM user
R&S®GSACSM user
R&S®GSACSM server
R&S®GSACSM server
R&S®GSACSM serverR&S®FSW
signal and spectrum analyzer
R&S®TSME drive test scanner
R&S®FPS signal and spectrum analyzer
R&S®GSACSM user
64
R&S®GSACSM modulesThe software typically includes these modules: ❙ R&S®GSACSM sensor: Recording/digitization of signals from instruments connected to the R&S®GSACSM server via a network or TCP/IP connection, e.g.:
■ R&S®FSW, R&S®FPS, R&S®FSV signal and spectrum analyzers
■ R&S®FSC, R&S®FSG, R&S®FSL spectrum analyzers ■ R&S®TSME6 drive test scanner ■ R&S®NRQ6 power sensor ■ R&S®OSP open switch and control platform ■ R&S®ESMD wideband monitoring receiver ■ R&S®MSR200 dual satellite receiver
❙ R&S®GSACSM server: This software controls and man-ages user interaction with the sensors. It transfers or pro-cesses the measurement results, manages access rights for individual users, and controls multi-user access to the RF sensors. R&S®GSACSM server performs cyclically recur-ring measurements and saves the results (e.g. spectrum data, I/Q signal files, power values) in a database.
❙ R&S®GSACSM user: This graphical user interface plays the role of a classic multi-screen, multi-sensor desktop monitor-ing application. Fig. 2 shows the system’s different operat-ing modes.
Fig. 2: Possible R&S®GSACSM operating modes.
Satellite communications

Fig. 3: SCPC and TDMA satellite signals that can be detected by
R&S®GSACSM, and manufacturer-specific modem designations.
Manufacturer (SCPC) Modem designationCOMTECH LDPC 2/3
LDPC 3/4
VersaFEC 0.642L
VersaFEC 0.789L
VersaFEC 0.803
IDirect TPC 0.793 Infinity
Radyne TPC 3/4 VSAT defacto
Various TPC 3/4
Various TPC 7/8
Various TPC 7/8 VSAT defacto
Manufacturer (TDMA) Modem designation
Viasat LinkWay, LinkWayS2, SurfBeam, SkyLinx DDS
Nortel DASA SKYWAN (IDU 200, 3000, 5000, 7000)
PolarSat VSATPLus II VSATPLus 3
Nera SatLink
Gilat SkyBlaster, FaraWay, SkyEdge SkyEdge II, DialAway, SkyStar VARIANT
Hughes DIRECWAY (IPoS), PE5
Shiron InterSKY
Comtech / Radyne SkyWire
Advantech Satellite Networks Various
Tachyon Networks Various
NEC NEXTAR48 (IC), NEXTAR4A (OC), NEXTAR Band-width On Demand, NEXTARV0
Fig. 4: Users can define spectrum signal masks to ensure that every suspicious carrier is immediately identified. The R&S®GSACSM server can also run
on test instruments such as the R&S®FSW signal and spectrum analyzer, i.e. a separate computer is not required.
R&S®GSACSM server can also run directly on certain Rohde & Schwarz test instruments without a separate com-puter (e.g. on the R&S®FPS or R&S®FSW). This is beneficial for users who already own these instruments and want an easy way to extend them with R&S®GSACSM or who do not have space for extra hardware. Often there is no way to pro-vide additional processing capacity for monitoring purposes, e.g. in mobile satcom terminals. Here too, installation of R&S®GSACSM on an existing Rohde & Schwarz instrument is a way to extend system functionality.
Remote controlled spectrum and signal monitoringR&S®GSACSM accesses the distributed sensors via network or TCP/IP connections. The software not only supports mon-itoring of signals from a single instrument, it can also simul-taneously operate a number of different RF sensors. Fig. 3 shows some of the single carrier per channel (SCPC) and TDMA satellite signals that can be detected.
| NEWS 221/19 65

66
Fig. 5: The spectrogram function produces
color-coded 2D and 3D waterfall charts that are
useful for identifying signal parts.
Spectrogram to identify signal parts using color-coded waterfall chartsSystems using R&S®GSACSM can monitor the power spec-tral density of any spectrum analyzer input signal. This helps identify potential unwanted signal sources. The spectrogram function with 2D and 3D waterfall charts is very helpful in this regard (Fig. 5).
Spectrum density measurement identifies sporadic signal partsThe spectrum density measurement monitors time-varying and superimposed signals by continuously capturing and ana-lyzing spectrums over time. Rare or superimposed events that cannot be detected using ordinary spectrum analyzer func-tions can be visualized in a spectrum density chart.
Satellite communications
Alarm trapping helps automatically identify suspicious signals Alarm thresholds in R&S®GSACSM inform users when unwanted signals occur. Users can define spectrum signal masks to ensure that every suspicious carrier is immediately identified (Fig. 4). Besides identifying suspicious carriers, it is also possible to monitor the frequency and power stability of wanted carriers. The system collects statistics and can send alerts via email when errors occur.
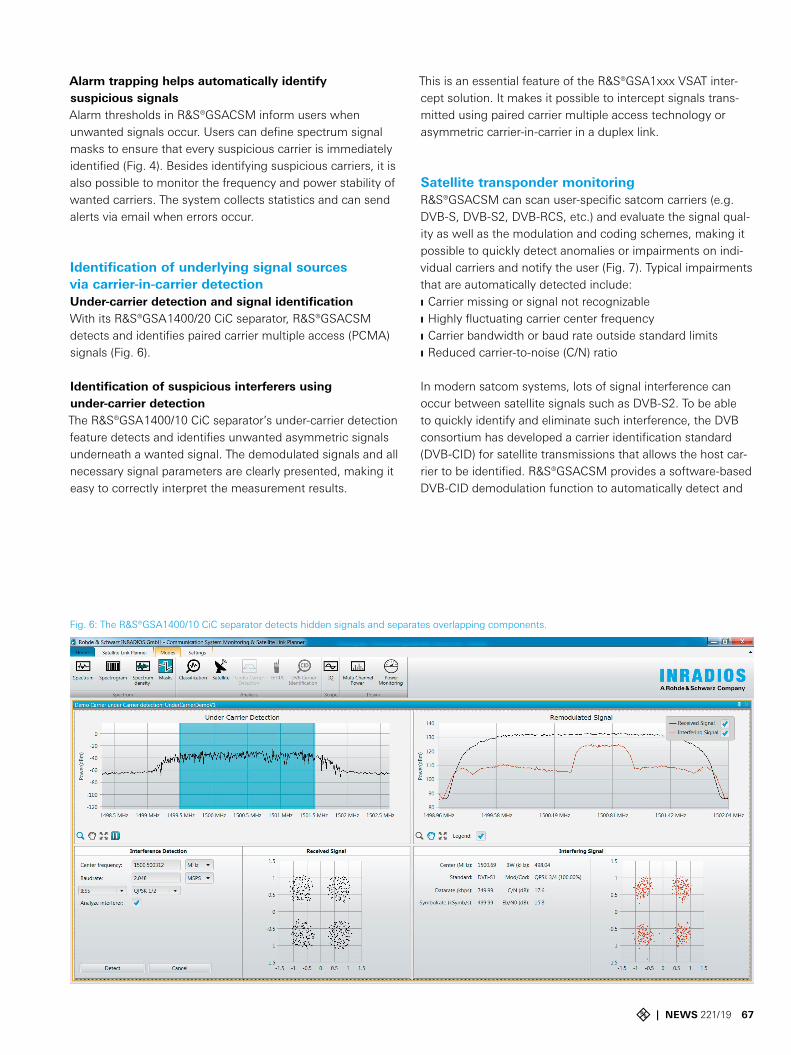
Identification of underlying signal sources via carrier-in-carrier detectionUnder-carrier detection and signal identificationWith its R&S®GSA1400/20 CiC separator, R&S®GSACSM detects and identifies paired carrier multiple access (PCMA) signals (Fig. 6).
Identification of suspicious interferers using under-carrier detectionThe R&S®GSA1400/10 CiC separator’s under-carrier detection feature detects and identifies unwanted asymmetric signals underneath a wanted signal. The demodulated signals and all necessary signal parameters are clearly presented, making it easy to correctly interpret the measurement results.
This is an essential feature of the R&S®GSA1xxx VSAT inter-cept solution. It makes it possible to intercept signals trans-mitted using paired carrier multiple access technology or asymmetric carrier-in-carrier in a duplex link.
Satellite transponder monitoringR&S®GSACSM can scan user-specific satcom carriers (e.g. DVB-S, DVB-S2, DVB-RCS, etc.) and evaluate the signal qual-ity as well as the modulation and coding schemes, making it possible to quickly detect anomalies or impairments on indi-vidual carriers and notify the user (Fig. 7). Typical impairments that are automatically detected include: ❙ Carrier missing or signal not recognizable ❙ Highly fluctuating carrier center frequency ❙ Carrier bandwidth or baud rate outside standard limits ❙ Reduced carrier-to-noise (C/N) ratio
In modern satcom systems, lots of signal interference can occur between satellite signals such as DVB-S2. To be able to quickly identify and eliminate such interference, the DVB consortium has developed a carrier identification standard (DVB-CID) for satellite transmissions that allows the host car-rier to be identified. R&S®GSACSM provides a software-based DVB-CID demodulation function to automatically detect and
Fig. 6: The R&S®GSA1400/10 CiC separator detects hidden signals and separates overlapping components.
| NEWS 221/19 67

68
Fig. 8: Via carrier ID (CID), DVB-S signals can be unambiguously assigned to their operator.
Fig. 7: R&S®GSACSM automatically identifies and demodulates all signals in a user-specific spectrum.
Satellite communications

Measurement of frequency-dependent gain
Receive pathPilot path
Antenna gain
F = 4π rƒc
2
Feed
LNB
Coupling losses
Sat modems
R&S®SGS100A RF source
R&S®GSACSM interface to signal generator for autonomous calibration
Pilot injection path
R&S®FPS spectrum analyzer + R&S®GSACSM
L band
Satellite downlink
Free-space loss
identify the CID of unknown or interfering signals. The CID-specific global unique ID, the uplink GPS coordinates and the operator’s telephone number (if available) are extracted. The global unique ID allows customers to precisely identify their satellite signal. Fig. 8 shows continuous spectrum scanning to detect and demodulate the CID signal until all CID-specific parameters have been successfully identified.
Station and channel measurements with R&S®GSACSM and pilot feedingIn addition to ordinary signal monitoring and analysis, the received signal power is an important criterion for sat oper-ators. It is also mandatory for sat operators to monitor spec-tral power density masks for their carriers in order to prevent interference to adjacent satellite systems. R&S®GSACSM can be used together with signal generators from Rohde & Schwarz to perform extensive measurements. The ground station is retrofitted with a so-called pilot path in addi-tion to the actual receive path. The pilot path provides a pilot signal that can be used to measure the frequency-dependent gain of the entire receive path (“station gain”) from the LNB to the L-band interface (Fig. 9). Based on the measured values, additional carrier parameters can be calculated: ❙ Spectral signal power density at receive antenna ❙ EIRP or power density at satellite ❙ EIRP of carrier at satellite antenna (downlink) ❙ Signal attenuation due to free-space propagation, rain and atmospheric attenuation using known beacon signals
If the satellite beacon power is known, the signal level or gain can be determined at any point on the transmission path (from satellite to modem) for each component (e.g. antenna
Fig. 9: Using the pilot path, the frequency-dependent gain can be deter-
mined for the entire receive path.
– satellite, path, LNB, etc. including influence of optical con-verters). Based on regular measurements, it is possible to detect aging effects and take appropriate countermeasures – all during live operation.
Dr. Steffen Bittner; Dr. Marco Krondorf
| NEWS 221/19 69