Embed Size (px)
Citation preview

Économie internationale 117 (2009), p. 63-97
TRADE OPENNESS AND WAGE INEQUALITY BETWEEN SKILLED AND UNSKILLED
WORKERS IN TUNISIA Monia Ghazali1
Article received on May 15, 2008Accepted on February 23, 2009
ABSTRACT. An important literature emerged in the 90’s about the relationship between integration in the world economy and wage inequality. However, it is more focused on developed countries and Latin America. This paper investigates the impact of trade liberalization process in Tunisia, initiated since the second half of the 1980s, on wage inequality between skilled and unskilled workers, over the period 1975-2002. We provide panel data evidence that trade openness contributes to increasing wage inequality. The results converge with conclusions of many existing studies on developing countries and make it essential to identify explanations for this phenomenon in presence of a high unemployment rate of university graduates, in Tunisia.
JEL Classifi cation: F11; O15.Keywords: Wage Inequality; Trade Openness; Tunisia.
RÉSUMÉ. Une littérature importante s’est constituée, dans les années quatre-vingt-dix autour du lien entre l’intégration dans l’économie mondiale et les inégalités de salaires. Cependant, elle demeure relativement plus orientée vers les pays développés et les pays émergents d’Amérique latine. Cet article s’intéresse à l’impact de la libéralisation commerciale en Tunisie, engagée à partir de la seconde moitié des années quatre-vingt, sur les inégalités de salaires entre travailleurs qualifi és et non qualifi és. L’exploitation de données de panel, sur la période 1975-2002, montre que l’ouverture commerciale contribue à l’accroissement des inégalités de salaires en Tunisie. Ce résultat est conforme aux constats de plusieurs travaux portant sur les pays en développement. Par ailleurs, il suscite une réfl exion sur les facteurs explicatifs d’un tel phénomène en présence, notamment, d’un chômage relativement élevé des diplômés de l’enseignement supérieur.
Classifi cation JEL : F11 ; O15. Mots-clefs : Inégalités de salaires ; ouverture commerciale ; Tunisie.
1. Monia GHAZALI, Lecturer, laboratoire LEDA, Université Paris Dauphine ([email protected]).
CEPII_n°117.indb 63CEPII_n°117.indb 63 18/09/2009 10:32:1018/09/2009 10:32:10

Monia Ghazali / Économie internationale 117 (2009), p. 63-9764
1. INTRODUCTION
The end of the 1990s has witnessed a great deal of research on the effects of trade liberalization on wage inequality in developing countries emphasizing the debate on globalization social costs. The main studies were performed in Latin American countries, such as Mexico (Hanson and Harrison, 1999; Cragg and Epelbaum, 1996; Feliciano, 2001; Robertson, 2004), Peru (Mazumdar and Quispe-Agnoli, 2002), Chile (Beyer et al., 1999) and Colombia (Attanasio et al., 2004). Other studies focused on Asian countries such as the Asian Tigers (Wood, 1997) and India (Marjit and Acharyya, 2003; Milner et al., 2005). Papers discussing the relationship between trade openness and wage inequality in Africa are, however, relatively scarce. We can cite Görg and Ströbl (2001) for Ghana and Bigsten and Durevall (2006) for Kenya.
An overwhelming majority of these empirical studies concluded that trade openness increases wage inequality in developing countries and highlighted different channels through which this effect is transmitted.2 However, these conclusions appear to contradict the neoclassical trade theory prediction that increased trade with the developed countries would lead to a reduction in wage inequality in developing countries by changing goods relative prices.
Furthermore, the scarcity of studies dedicated to African countries and, in particular, to North Africa is widely attributed to the lack of long-term data-series on wages by skill-type and on trade liberalization indicators. Such studies are, nevertheless, extremely useful for at least two reasons. The fi rst is that they are complementary to current literature, widely focused on Latin American and Asian countries. They could improve the understanding of trade liberalization effects on wage inequality in developing countries taking into account their specifi c economic liberalization processes. The second reason explained by Harrison (2006) is that wage inequality is instrumental to the transmission of trade liberalization impact on poverty. Indeed, a high level of wage inequality could reduce the poverty-growth elasticity and thus, the expected results of trade liberalization reforms on poverty. Poverty alleviation being one of Africa’s top economic and social issues, a better understanding of inequality trends and channels in the continent could help better monitor, and ultimately control, poverty.
This paper fi ts into this research framework. We attempt to identify the links between trade liberalization and wage inequality between skilled and unskilled workers in Tunisia over the period 1975-2002. Section 2 presents a brief review of the theoretical literature. Section 3 provides a description of the Tunisian trade liberalization process as well as stylised facts on wage inequality. Section 4 presents the database used in the econometric analysis and the regression results. The Section 5 concludes. The fi ndings reveal that an increase in imports relative to value added worsened the wage inequalities between skilled and unskilled workers over the period 1975-1998. Results also identify a negative and statistically signifi cant relationship between Custom duties on imports and relative wages over the period 1983-1998, after the incorporation of time fi xed effects. Over the period
2. Studies refer to the role of FDI, outsourcing, skill-biased technological change, the increase of the returns to education, the extension of the informal sector due to trade reforms…
CEPII_n°117.indb 64CEPII_n°117.indb 64 18/09/2009 10:32:1018/09/2009 10:32:10

Monia Ghazali / Économie internationale 117 (2009), p. 63-97 65
1998-2002, while the Tunisian trade liberalization process became more active, regression results no longer identify a signifi cant relationship between trade openness proxies and wage inequality. This is probably due to the weak number of observations related to this period. Two main categories of unskilled workers seem to be affected by trade liberalization, namely supervisors and production workers.
2. THEORETICAL LITERATURE OVERVIEW
The primary theoretical reference regarding the impact of trade openness on internal wage inequalities is the Hecksher-Ohlin-Samuelson model or the endowment-based neoclassical theory. By assuming a world divided into two zones, the northern zone and the southern zone, and two production factors, skilled labour and unskilled labour, this model predicts that trade openness will entail in the South a decrease (increase) of the relative price of skill intensive good (unskilled-labour intensive good). This leads the South to specializing in the export of unskilled-labour intensive good and simultaneously activates to the Stolper-Samuelson effects. The Stolper-Samuelson theory (1941) stipulates that when a southern country shifts from autarky to free-trade, the factor relatively more used by the branch whose relative price increases benefi ts from an increase of its relative and real wage income (namely, in this case the unskilled labour). Conversely, the price of skilled labour, initially relatively higher, must decrease. The predicted consequence of liberalization for the South is therefore a reduction in wage inequality between skilled and unskilled workers.
The impact of trade liberalization on income distribution can also be analyzed through the Ricardo-Viner model or the sector-specifi c factors model. This model has a structure similar to the latter, since it has two goods and two factor endowments. However, it allows to distinguish between universal factors that are mobile across sectors and specifi c factors (ex: skilled labour and unskilled labour), which are related to certain sectors. Setting skilled (unskilled) labour as the specifi c factor for the skill-intensive (unskilled-labour) sector and the “general labour” as a sectors-mobile factor, this model predicts that trade liberalization leads to an increase in the relative price of unskilled-labour intensive goods in developing countries. This implies an increase (decrease) in unskilled (skilled) workers real wages, in terms of both goods. Consequences for the “general labour” are ambiguous. These workers undergo an increase in their real wage in terms of the skill-intensive good and a decrease in terms of the unskilled-labour intensive. Consequently, trade liberalization impact on this factor depends on its consumption pattern.
Nevertheless, wage inequality deterioration observed in developing countries appears to contradict neoclassical trade theories3 predictions. Several factors may explain the increase in skilled labour relative wages. Skill-biased technological change is particularly emphasized
3. We should note that Tunisia as other North African countries observes a paradox related to the high level of college graduates unemployment. The neoclassical trade theory does not involve such hypothesis. Furthermore, the majority of developing countries did not experience a uniform trade protection pattern across sectors, before the implementation of liberalization reforms (Cf. Section 3).
CEPII_n°117.indb 65CEPII_n°117.indb 65 18/09/2009 10:32:1018/09/2009 10:32:10

Monia Ghazali / Économie internationale 117 (2009), p. 63-9766
by the recent literature. Technological progress is skill-biased if it raises the relative demand for
skilled labour at given relative factor prices (Haskel and Slaughter, 1998). Furthermore,
trade liberalization and technological bias are not necessarily independent phenomena. Goldberg and Pavcnik (2004) put forward that the latter could be considered as an endogenous response to trade liberalization. Acemoglu (2003) considers that trade liberalization contributes to skill upgrading by increasing developing countries imports of machines and high technology equipments that become less expensive. To the extent that capital goods are complementary with skilled labour, we may expect an increase in the relative demand of the latter. Pissarides (1997) also developed a model where trade liberalization allows Southern fi rms to boost their imports in capital goods from Northern countries. This would consequently enhance the incentives to learn and imitate new technologies, which contributes to raise the relative demand for skilled workers.
The decrease of unskilled workers relative wages could be also induced by a reduction in the industry wage premium4 such as reported by Currie and Harrison (1997), Feliciano (2001) and Cragg and Epelbaum (1996). Indeed, under the assumption of imperfect competition, it may well be the case that some “high-protected” industries benefi t from quasi-rents that are shared with workers, due for example to a high union power.5 In case of labour market rigidity, the adjustment to trade liberalization of these industries would be predominantly made through wages, therefore implying a reduction in the premium. Besides, if the concerned industries are mostly unskilled-labour intensive, then one would expect a deepening of wage inequality.6
The effect of the outsourcing of intermediate goods production on wage inequality was highlighted by Feenstra and Hanson (1996, 1997). Indeed, trade liberalization and foreign direct investment allow for part of the intermediate goods production to be relocated from developed countries to developing countries. By Northern technological standards, these goods are considered unskilled-labour intensive. Inversely, in Southern countries, they are considered skill-intensive goods. Thus, outsourcing contributes to skill upgrading. This leads indirectly to increase wage inequality. More generally, the off shoring of some steps of the production process as well as activities related to the tertiary sector (call centres, hotlines and
4. The “Industry wage premium” is defi ned by Goldberg and Pavcnik (2004) as the portion of worker’s wage that is not explained by observable industry and worker characteristics. It is instead related to industry affi liation. According to Cragg and Epelbaum (1996), we may cite three sources of industry rents: 1- Compensation for differences in job attributes across industries 2- Compensation for specifi c skills 3- Under imperfectly competitive labour market, trade protection may be a source of rent creation. If this rent is shared with workers, this may lead to industry wage differences, given the heterogeneity of the trade protection pattern across sectors.5. Feliciano (2001) reports that almost 40% of workers in Mexican manufacturing industries were unionized. Besides, wages were set through collective bargaining at the fi rm or the sector level. This gives some evidences for rent sharing process in Mexico.6. According to Hanson and Harrison (1999a), Mexico was highly protecting industries that benefi t from comparative advantage. Even if such protection pattern could be unexpected, it is not exclusive to this country. Currie and Harrison (1997) show that Moroccan unskilled-labour intensive industries were relatively the most protected industries. Pavcnik et al. (2004) and Attanasio et al. (2004) report the same fi ndings respectively for Brazil and Colombia.
CEPII_n°117.indb 66CEPII_n°117.indb 66 18/09/2009 10:32:1118/09/2009 10:32:11

Monia Ghazali / Économie internationale 117 (2009), p. 63-97 67
back offi ce services) by Northern fi rms contributes to the increase of the relative demand of skilled labour in host countries (Kirkegaard, 2007 for India).
From this perspective, Zhu and Trefl er (2005) proposed an alternative to the HOS model by combining HOS and Ricardian international technology differences frameworks. According to this model, if the South undergoes a technological ‘catch-up’ process, this implies a migration of the least skill-intensive Northern goods in the South where they become the most skill-intensive goods. The relative demand of skilled workers as well as wage inequality rise in both regions. This is due to the destruction of unskilled-intensive jobs in the North and the creation of skill-intensive jobs in the South. This mechanism is related to that described by Feenstra and Hanson (1996).
According to Wood (1997), the access to the global market of large low-income countries such as Bangladesh, China, India, Indonesia, and Pakistan would alter middle-income countries comparative advantages. Indeed, the latter appear to have relatively more abundant skilled labour than the former. The increase in the relative price of unskilled-labour intensive goods, and thus the expected Stolper Samuelson effects become uncertain in emerging countries.
The informal sector 7 could offer an additional adjustment mechanism to import competing domestic fi rms. In order to reduce their costs, fi rms exposed to foreign competition may indeed attempt to circumvent labour market legislation by subcontracting some of their activities to small, informal fi rms or by hiring temporary workers, (Attanasio et al., 2004; Goldberg and Pavcnik, 2003; Currie and Harrison, 1997). If unskilled workers are relatively more employed in the informal sector (Goldberg and Pavcnik (2003) for Colombia) and that, at given skill level, informal sector workers are less paid than those of the formal sector (Attanasio et al. (2004) for Colombia and Pavcnik et al. (2004) for Brazil), one may expect trade-induced expansion of the informal sector to deteriorate the relative wage income of unskilled workers. However, results given by empirical studies related to the impact of trade liberalization on the probability of working in the informal sector are mitigated and depend on the rigidity of the labour market.8 Goldberg and Pavcnik (2003), for example, don’t identify a signifi cant relationship between informality and tariffs barriers reduction in Brazil, where the labour market is considered to be relatively fl exible. In Columbia, this relationship is positive but only over the period preceding labour market deregulation reforms that were introduced in the 1990s. Indeed, these reforms are considered by Kugler (1999) as contributing to formal employment increase in Columbia. Thus, labour market institutions intervene in trade liberalization impact on the informal sector.
However, Maloney (2004) diverges with the traditional view that considers the informal sector as an opportunity to by-pass labour market regulations, especially when it deals with low-wages countries lacking strong union power. Indeed, the author highlights the weak
7. The most common defi nition of the informal sector is based on the compliance with labour market legislation (minimum wage, social security contribution, fi ring procedures). A broader defi nition reported by Goldberg and Pavcnik (2003, 2004) accounts temporary workers in the formal sector. 8. They also depend on the indicators used to asses the non compliance with labour market legislation.
CEPII_n°117.indb 67CEPII_n°117.indb 67 18/09/2009 10:32:1118/09/2009 10:32:11

Monia Ghazali / Économie internationale 117 (2009), p. 63-9768
portion (20%) of informal Mexican companies involved in subcontracting business and stresses its decrease during the trade liberalization episode. Instead, he suggests considering the informal sector as an unregulated micro entrepreneurial sector chosen by voluntary self-employed workers.
3. TUNISIAN TRADE LIBERALIZATION PROCESS
Tunisia implemented until the fi rst half of the 1980s an import substitution policy characterised by regulatory government interventionism in price setting, private investments and banking system. In 1986, an economic crisis led to the initiation of a structural adjustment plan, instigated by international fi nancial institutions. Numerous actions were taken to re-establish the market forces, deregulate the domestic market and lower tariff and non tariff barriers. Trade liberalization was one of he most important reforms.
During the 1990s, the Tunisian trade process was marked by the signature of the GATT agreements in 1990 followed by the adherence to the WTO and the signature of the EUROMED agreements, in 1995. These agreements imply the establishment of a free trade zone including the majority of industrial products over a period of 12 years while the GATT affi liation entails the reduction of tariffs and non-tariffs barriers.
As shown in TABLE 1, the period 1986-1990 exhibits an important reduction in the effective rate of protection.9 The Sachs and Warner (1995) Openness index classifi es Tunisia as an open economy starting from 1989. Then, from 1990 to 1997, the effective rate of protection increased due to the transformation of non tariff barriers, mainly applied to fi nal consumption goods, into tariff equivalent.10 The trade liberalization process became more active after 1997 as the effective rate of protection decreases from 71% to 49% in 2002.
9. The effective rate of protection is defi ned as the proportional increase in value added resulting from the imposition of protective measures. It measures the percentage by which value added can increase over the free trade level as a consequence of a tariff structure. The effective rate of protection captures protection of intermediate and fi nal goods by tariff or non-tariff protective measures.10. The transformation of non-tariffs barriers into tariff equivalent implies an increase in the nominal protection rate of industry and agriculture outputs. This coupled with a signifi cant reduction of the nominal protection on inputs and intermediate goods lead to the rise of the effective rate of protection.
CEPII_n°117.indb 68CEPII_n°117.indb 68 18/09/2009 10:32:1118/09/2009 10:32:11

Monia Ghazali / Économie internationale 117 (2009), p. 63-97 69
Table 1 - The ERP* in Tunisian manufacturing and non manufacturing industries, 1980-2002
ERP IAA IMCCV IME ICH ITHC ID IMF Mining Agriculture Total
1980 258 198 96 111 272 224 242 10 27 701983 191 185 67 161 175 190 178 24 33 671984 404 nd 92 92 98 nd 153 23 46 741985 553 nd 104 100 203 nd 207 20 48 841986 421 40 88 88 194 101 124 9 46 701987 120 36 73 62 107 88 81 14 43 521988 134 66 63 62 82 74 78 16 25 421989 110 91 98 70 76 78 87 17 22 431990 100 82 101 78 73 80 84 18 24 441991 80 61 55 49 58 54 na na na na1992 90 65 59 50 65 65 na na na na1993 85 75 65 60 105 90 na na na na1994 71 85 64 65 126 102 na na na na1995 115 85 169 65 132 102 114 26 44 561997 59 154 144 102 106 82 98 15 169 731999 60 119 78 78 91 68 80 14 161 662000 65 85 88 60 79 56 72 13 164 642001 69 76 54 39 71 41 62 5 124 512002 70 70 53 45 59 41 58 4 120 49
* Effective Rate of Protection; Domestic market, in %.
Notes: IMF: manufacturing industries. The exact sectors denomination is presented in APPENDIX 5. na: not available.
Source: Institut d’Économie Quantitative, 1998, 2002 and 2003.
4. STYLISED FACTS ON WAGE INEQUALITY IN TUNISIA
The following analysis of the evolution of wage inequality between skilled and unskilled workers in Tunisia aims to identify the episodes of trend return. For this purpose, we adopt a wage inequality standard measure which is the relative annual average wage of skilled workers, (Feenstra and Hanson, 1997; Hanson and Harrison, 1999; Robertson, 2004).11
11. In APPENDIX 1, we also report a second proxy of wage inequality, namely the annual average wage in the tertiary sector relative to that in manufacturing industries. Both ratios exhibit similar trends.
CEPII_n°117.indb 69CEPII_n°117.indb 69 18/09/2009 10:32:1118/09/2009 10:32:11

Monia Ghazali / Économie internationale 117 (2009), p. 63-9770
4.1 Data sources
Data on wages as well as the variables used in the empirical analysis are taken from the database on wages (1998) provided by the Quantitative Economic Institute (IEQ, Tunis).12 It is to our knowledge the only source of data available in Tunisia in relation to sector wages that offers a distinction between the different skill categories (Engineers and senior executives, supervisors, employees, workers and apprentices). These data combine results of industrial activities surveys (1969-1981) and National surveys on economic activity (1983-1996) carried out by the Tunisian Institute of Statistics (INS), as well as results of studies by the Tunisian Ministry of Social Affairs.
Given the importance of studying the episode following 1998, that witnessed a relatively important reduction of effective protection in Tunisia, it was necessary to extend our observation period. The only available data for this purpose are fi rm level data provided by the national annual survey report on fi rms conducted by the (INS) over the period 1997-2002. The main advantage of this database is that it offers a distribution of the workforce according to the skill level. However, it has the inconvenience of not providing a similar decomposition of the fi rm total wage bill. In order to desegregate wage data, we adopted a method applied by Maurin and Parent (1993). Details are presented in APPENDIX 2.
4.2 The measure of wage inequality using the ratio
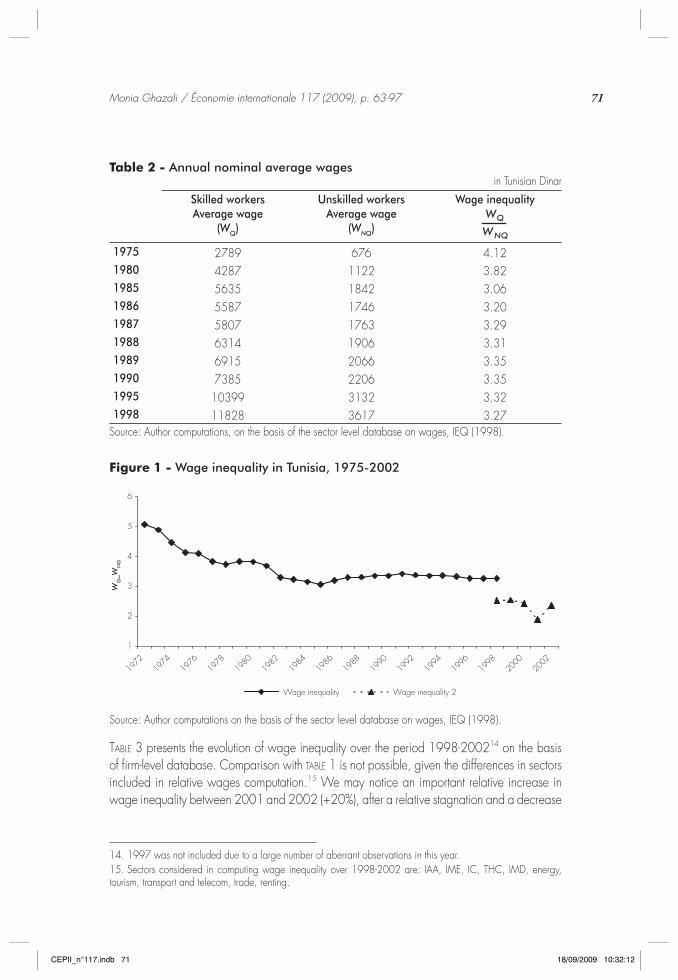
TABLE 2 reports trends in the relative average annual wage of skilled workers belonging to the non agricultural productive sector13 over the period 1975-1998. Skilled workers are here related to the category “engineers and senior executives”. Unskilled workers are “supervisors“, “employees“, “factory workers“ and “apprentices“. Wage inequality is measured by relative wages.
FIGURE 1 shows that the 1970s and the fi rst half of the 1980s were characterised by a reduction in wage inequality in the Tunisian non-agricultural productive sector. A skilled worker was paid in 1975 almost four times the wage of an unskilled worker. In 1985, the relative wages ratio is about 3. This ratio increased after 1986 reaching 3.42 in 1991. During the following years, wage inequality displays a slight decrease as it reduces to 3.27 in 1998. The decreasing trend in wage inequality was therefore interrupted at the implementation of the trade liberalization process.
12. Institut d’économie quantitative.13. This sector includes manufacturing industries (IAA, Agro-food industry; IME, Mechanical, electrical and electronic industry; MCCV, Pottery, glass and other non-metallic mineral industry; IC, Chemical industry; THC, Textiles, wearing apparel, leather and footwear industry; IMD), non manufacturing industries (mining, energy, electricity, water, construction) and productive services (telecom, tourism, trade, other services).
CEPII_n°117.indb 70CEPII_n°117.indb 70 18/09/2009 10:32:1218/09/2009 10:32:12
Monia Ghazali / Économie internationale 117 (2009), p. 63-97 71
Table 2 - Annual nominal average wagesin Tunisian Dinar
Skilled workersAverage wage
(WQ)
Unskilled workers Average wage
(WNQ)
Wage inequality
1975 2789 676 4.121980 4287 1122 3.821985 5635 1842 3.061986 5587 1746 3.201987 5807 1763 3.291988 6314 1906 3.311989 6915 2066 3.351990 7385 2206 3.351995 10399 3132 3.321998 11828 3617 3.27
Source: Author computations, on the basis of the sector level database on wages, IEQ (1998).
Figure 1 - Wage inequality in Tunisia, 1975-2002
1
2
3
4
5
6
1972
1974
1976
1978
1980
1982
1984
1986
1988
1990
1992
1994
1996
1998
2000
2002
WQ_W
NQ
Wage inequality Wage inequality 2
Source: Author computations on the basis of the sector level database on wages, IEQ (1998).
TABLE 3 presents the evolution of wage inequality over the period 1998-200214 on the basis of fi rm-level database. Comparison with TABLE 1 is not possible, given the differences in sectors included in relative wages computation.15 We may notice an important relative increase in wage inequality between 2001 and 2002 (+20%), after a relative stagnation and a decrease
14. 1997 was not included due to a large number of aberrant observations in this year. 15. Sectors considered in computing wage inequality over 1998-2002 are: IAA, IME, IC, THC, IMD, energy, tourism, transport and telecom, trade, renting.
CEPII_n°117.indb 71CEPII_n°117.indb 71 18/09/2009 10:32:1218/09/2009 10:32:12

Monia Ghazali / Économie internationale 117 (2009), p. 63-9772
between 1999 and 2001 of this ratio. The second plot entitled “inequality 2” in FIGURE 1 allows us to examine relative wages movements between over the period 1998-2002.
Table 3 - Wage inequality
Skilled workersAverage wage
(WQ)
Unskilled workers Average wage
(WNQ)
Wage inequality
1998 14002 5558 2.521999 14315 5619 2.552000 14588 5990 2.442001 12113 6398 1.892002 16013 6762 2.37
* There’s no apparent reason for the sharp reduction of skilled workers average annual wage in 2001.Source: Author computations, on the basis of fi rm level data provided by the national annual survey report on fi rms carried out by (INS), 1997-2002.
In order to make some robustness checks on wage inequality trend over the period 1975-1998, we try to explore the evolution of the average wage of engineers and senior executives relative to the average wage of the different subcategories of unskilled workers. FIGURES A3.1 to A3.7 (APPENDIX 3) confi rm previous observations. The decreasing trend of the different indicators computed is interrupted over the second half of the 1980s. An increase is noted then, until the fi rst half of the 1990s, followed by a relative stagnation. It is important to emphasize that between 1975 and 1980, the average wage of skilled workers relative to that of supervisors sets apart from the general decreasing trend by rising by almost 9%. These fi ndings are also discernible in the fi gure that plots the internal wage inequalities within the categories of unskilled workers. The average wage of the various subcategories of unskilled workers relative to the average wage of the most unskilled one which is “apprentices”, is constant over the observation period which implies a perfect substitution between these workers, with the exception of the supervisors in the fi rst half of the 1980s.
Overall, it appears that the increase in wage inequality between skilled and unskilled workers over the period 1986-1991 coincides with a relatively important decrease in the effective rate of protection (from 70% to 44%). TABLE 1 shows that trade reforms pattern was not uniform across manufacturing industries. For instance, the food-processing and textile industries that benefi ted from a relatively higher protection level prior to trade liberalization observe a decrease of their effective protection rates by about 300% and 200% respectively. Within the same period, the construction materials, glass and ceramics industry (from 40% to 82%), the electrical and mechanical industries (from 88% to 101%), and the chemical industries (from 88% to 78%) underwent either an intensifi cation of their rate of protection, or a minor decrease. As the unskilled-labour intensive industries seem to be the most affected by
CEPII_n°117.indb 72CEPII_n°117.indb 72 18/09/2009 10:32:1318/09/2009 10:32:13

Monia Ghazali / Économie internationale 117 (2009), p. 63-97 73
the openness shock, this may contribute to clarify the increase in wage inequality in Tunisia between 1986 and 1991 after trade reforms implementation.16
Over the period 1991-1998, the absence of important movements in relative wages could be explained by the increase of Tunisia’s effective protection rate. An examination of wage inequality trend after 1998 reveals the resumption of wage inequality increase in 2002, coupled with a signifi cant decrease of trade protection.
FIGURES 2 to 5 allow to assess the evolution of wage inequality relatively to trade liberalization proxies, such as custom duties on imports (DD/M), imports and exports on sector value added (M/VA, X/VA), and the effective rate of protection of the Tunisian domestic market (ERP). The increase in wage inequality over the second half of the 1980s is coupled with a relatively important decline in the DD/M ratio and the (ERP) that refl ects the trade protection level. This increase also coincides with the increase in the X/VA ratio and the M/VA ratio (with some delay). The relative stagnation of relative wages in the mid-1990s corresponds to a moderate evolution of trade indictors.
Figure 2 - Wage inequality and trade openness (DD_M *)
1.8
2.8
3.8
4.8
5.8
1972
1974
1976
1978
1980
1982
1984
1986
1988
1990
1992
1994
1996
1998
2000
2002
WQ_W
NQ
0
0.05
0.1
0.15
0.2
0.25
Inequality Inequality 2 DD_M
* The indicator DD_M is the ratio on customs duties to imports. WQ _WNQ is the relative wage of skilled workers.Source: Author computations on the basis of the sector level database on wages, IEQ (1998). Trade data are provided by IEQ.
16. According to Hanson and Harrison (1999a) the neoclassical trade theory implicitly assumes that countries protect relatively more sectors that do not benefi t from comparative advantages.
CEPII_n°117.indb 73CEPII_n°117.indb 73 18/09/2009 10:32:1318/09/2009 10:32:13

Monia Ghazali / Économie internationale 117 (2009), p. 63-9774
Figure 3 - Wage inequality and trade openness (M_VA*)
0
1
2
3
4
5
6
1972
1974
1976
1978
1980
1982
1984
1986
1988
1990
1992
1994
1996
1998
2000
2002
0
0.1
0.2
0.3
0.4
0.5
0.6
0.7
0.8
0.9
Inequality Inequality 2 M_VA
MV
WQ
_WN
Q
* The indicator M_VA is the ratio on imports to value added. WQ _WNQ is the relative wage of skilled workers.Source: Author computations on the basis of the sector level database on wages, IEQ (1998). Trade data are provided by IEQ.
Figure 4 - Trade openness and wage inequality (ERP*)
0
1
2
3
4
5
6
1972
1974
1976
1978
1980
1982
1984
1986
1988
1990
1992
1994
1996
1998
2000
2002
WQ
_W
NQ
inequality inequality 2 ERP
* The indicator ERP is the effective rate of protection. WQ _WNQ is the relative wage of skilled workers. Source: Author computations on the basis of the sector level database on wages, IEQ (1998). Trade data are provided by IEQ.
CEPII_n°117.indb 74CEPII_n°117.indb 74 18/09/2009 10:32:1418/09/2009 10:32:14

Monia Ghazali / Économie internationale 117 (2009), p. 63-97 75
Figure 5 - Wage inequality and trade openness in Tunisia (X_VA*)
0
1
2
3
4
5
6
1972
1974
1976
1978
1980
1982
1984
1986
1988
1990
1992
1994
1996
1998
2000
2002
0
0.1
0.2
0.3
0.4
0.5
0.6
0.7
Inequality Inequality 2 X_VA
X_V
A
WQ
_WN
Q
* The indicator X_VA is the ratio on exports to total value added. WQ _WNQ is the relative wage of skilled workersSource: Author computations on the basis of the sector level database on wages, IEQ (1998). Trade data are provided by IEQ.
5. EMPIRICAL ANALYSIS AND DATA OVERVIEW
The fi rst subsection presents the econometric model and the data set used. The second displays the empirical results.
5.1 Theoretical model and data overview
We consider the following constant elasticity of substitution production function (CES) with two labour inputs,17 namely skilled labour ( LQ ) and unskilled labour ( LNQ ). This approach is also adopted by Katz and Murphy (1992), Katz and Autor (1999) and Autor et al. (2008).
(1)
where:Y: aggregate output; LQ and LNQ : skilled and unskilled labour;at and bt : parameters representing skilled an unskilled augmenting technical change;α : indexes the share of work activities of skilled labour;ρ : a parameter that determines the elasticity of substitution between skilled and unskilled labour.
17. This simple framework is potentially consistent with capital-skill complementarity. Capital is here ignored in order to simplify the model.
CEPII_n°117.indb 75CEPII_n°117.indb 75 18/09/2009 10:32:1518/09/2009 10:32:15

Monia Ghazali / Économie internationale 117 (2009), p. 63-9776
Hicks-neutral technological progress implies a proportionate increase in the parameters at and bt. “Intensive” skill-biased technological changes involve increases in at /bt as defi ned by Johnson and Stafford (1998). An increase in α entails “extensive” skill-biased technological changes. Changes in these technical parameters could also represent, according to Katz and Autor (1999), non-neutral effects on skill groups of changes in the relative prices or quantities of non labour inputs such as capital and shifts in the product demand among industries with different skill intensities.
We suppose perfect competition in goods and labour markets.18 Assuming that skilled and unskilled workers are paid their marginal product we can use equation (1) to solve for the ratio of marginal products of the two types of labour, yielding a relationship between relative
wages in year t and relative supplies in year t given by equations (4) and (5).
(2)
(3)
(4)
Expressed in logarithmic form, equation (4) becomes:
(5)
This can be rewritten as:
(6)
where: indexes relative demand shifts favouring skilled workers.
Changes in relative wages are thus the result of changes in the relative supply and demand of skilled labour. The greater the elasticity of substitution σ between the two skill groups and the smaller the impact of shifts in relative supplies on relative wages, the greater must be fl uctuations in demand shifts ( Dt ). Changes in Dt can occur due to skill biased technological
18. Firms are thus not able to capture rents.
CEPII_n°117.indb 76CEPII_n°117.indb 76 18/09/2009 10:32:1618/09/2009 10:32:16

Monia Ghazali / Économie internationale 117 (2009), p. 63-97 77
change, non-neutral changes in the relative prices or quantities of non-labour inputs and shifts in product demand either from domestic or international fl uctuations.
Implementing an empirical version of equation (6), Katz and Autor (1999) propose to replace the unobserved time series Dt by a time trend and/or relative demand movement’s proxies, such as cyclical indicators or international trade measures. As our main objective is to investigate trade liberalization effects on relative wages in Tunisia, we choose to estimate a specifi cation of equation (6) that substitutes Dt by measures of international trade (we introduce lags to account for inertia effects) and the growth rates of unemployment and GDP that capture labour market cyclical fl uctuations. As Autor et al. (2008), we also incorporate real minimum wages allowing to account for institutional effects. Estimated equation is presented as follows:
where:
- i: represents the sectors;
- t : represents the year;
- ξit : Random disturbances.
The ratio represents the average annual wage of skilled workers relative to that of
unskilled workers.19 corresponds to relative skill supply.
The trade openness proxies used in the empirical analysis don’t benefi t from a general consensus regarding their relevance. Highlighting the diffi culty to conceive a perfectly satisfactory openness measure, Edwards (1998) suggests different proxies as robustness checks.20 Thus, in order to measure trade liberalization, this paper uses three proxies. The fi rst two are the ratios of exports and imports relative to sector value added, namely X/VA and M/VA that are available for all sectors throughout the observation period. These indicators of exposure and dependency on foreign trade do not necessarily refl ect, however, the trade policy strategy of the country and suffer from an economic and econometric endogeneity problem (Edwards, 1998; Pritchett, 1996; Goldberg and Pavcnik, 2004). The third indicator DD/M computed as the custom duties on imports allows to better capture the trade protection policy (Edwards, 1992). This ratio is, however only available over the period 1983-2002.
19. We have applied the Mann-Whitney non-parametric test of hypothesis on the ratio WQ /WNQ in order to assess the null hypothesis of equality in variable means over two sub-periods corresponding respectively to (1975-1986) and (1987-2002) (APPENDIX 5, TABLE A5.1). This test rejects the null hypothesis which supports the intuition that trade liberalization exerts a signifi cant impact on wage inequality.20. In order to study the impact of trade openness on economic growth, Edwards (1998) regressed total factor productivity on nine trade liberalization indexes.
CEPII_n°117.indb 77CEPII_n°117.indb 77 18/09/2009 10:32:1718/09/2009 10:32:17

Monia Ghazali / Économie internationale 117 (2009), p. 63-9778
We would have preferred to use the effective protection rate as a fourth indicator. This measure presents at least two advantages as emphasized by Goldberg and Pavcnik (2004) in their discussion on tariffs. The fi rst is that ERP changes during trade liberalization reform episodes are not sector-uniform. It would have enabled us to distinguish the effects of trade reforms from other economic reforms. The second advantage is that ERP movements in Tunisia during the 1980s, as in many other developing countries such as Brazil and Columbia, result from a governmental decision to fulfi l the GATT and WTO directives. This would have had the effect of minimising the endogeneity risk. This measure is, however, only available for manufacturing industries over the period 1983-1998 and suffer from many shortcomings. It also would have been appropriate to use a measure of non-tariff barriers, as emphasized by Siroën (2001). Such indicator may account for the decline of quantitative restrictions.21 Indeed, Mouelhi (2007) reports that the share of imports subject to licenses decreased from 94% before 1986 to 30% in 1991. This decreasing trend is also observed in the 1990s. Unfortunately, long time series on non-tariffs barriers are not available. All of the indicators were provided by the IEQ. We incorporate sector fi xed effects to take into account the unobservable sector heterogeneity as well as time fi xed effects to capture macroeconomic shocks and other unobservable determinants of wage inequalities.
5.2 Empirical results
We start by applying the Hausman test in order to choose between fi xed effects and random effects estimation. If individual random effects are correlated with the regressors, random effects model estimates are biased and fi xed effect estimator is the best unbiased linear estimator. Despite our relatively limited observation period, we apply specifi c panel data unit root tests (APPENDIX 5, TABLE A5.2). 22 Results reveal that all series are clearly stationary, with the exception of X/VA that is integrated of order 1. Thus, we include this variable in the regression equation in fi rst differenced form. Hausman test results allow us to choose the random effects estimator.
Columns 1 to 3 of TABLE 4 present estimation results for the period 1975-1998. An increase in imports relative to sector value-added is likely to amplify wage inequality between skilled and unskilled workers. This result is quite unexpected as increased trade openness is supposed to reduce wage inequality, according to the neoclassical trade theory of exchanges. This fi nding could, however, be explained by Tunisian imports structure. Indeed, intermediate goods and equipments constitute a large share of Tunisian imports.23 They are then transformed and assembled in offshore and re-exported. To the extent that they are complementary to skilled labour, one may expect that they contribute to increase the relative demand of skilled workers and thus, indirectly raise wage inequality. Such result points out the limits of the HOS model,
21. See Siroën (2001), p. 106. 22. We regress the specifi ed equation over the following sub-periods: 1975-1998, 1983-1998 and 1998-2002. Unit root tests are performed over the period 1975-1998.23. According to (IEQ), an important portion of EU Tunisian imports consists on intermediate goods (37%) and equipments (21%).
CEPII_n°117.indb 78CEPII_n°117.indb 78 18/09/2009 10:32:1718/09/2009 10:32:17

Monia Ghazali / Économie internationale 117 (2009), p. 63-97 79
which confi nes trade exchanges on fi nal consumption goods. The outsourcing of intermediate goods production (Feenstra and Hanson, 1997) or the easier access of developing countries to imported capital goods (Acemoglu, 2003), constitute trade-induced explanations of the positive and statistically signifi cant relationship between imports and wage inequality. The coeffi cient on exports relative to value-added is statistically insignifi cant. These results are robust to the inclusion of sector and time fi xed effects (see Columns 3-4) and to changes in the estimation period (1983-1998) (see Columns 5 and 6). We also incorporate the ratio on custom duties relative to imports. Controlling for sector fi xed effects, we fi nd a negative and statistically signifi cant relationship (at 5% level) between this variable and wage inequality (see Column 8). Hence, over the period 1983-1998, a reduction in tariffs barriers implies a deepening of wage inequality between skilled and unskilled workers. This result converges with the fi ndings of many previous studies on wage inequality in developing countries. However, it raises doubts on the relevance of HOS predictions. Over the period 1998-2002, while the trade liberalization process exhibits a particular strengthening, results do not indicate a statistically signifi cant relationship between openness proxies and relative wages. This could be due to the insuffi cient number of corresponding observations.
The coeffi cient on the relative supply of skilled labour is counter-intuitively positive over the 1975-1998 period (see Column 3). It becomes insignifi cant when it interacts with a dummy variable taking the value of 1, over the years following the initiation of trade liberalization reforms (see Column 4). Over the period 1998-2002, this coefficient is negative and
statistically signifi cant implying an elasticity of substitution of about ( ), as shown
in Column 10. However, this result is not robust to openness proxies changes. The role of minimum wages and labour market cyclical conditions are also investigated. An increase in the real minimum wage yields to compress wage inequality between skilled and unskilled workers. Furthermore, the impact of unemployment growth on the evolution of relative wages is likely to be insignifi cant. Overall, the different regressions underline the central role of trade liberalization in rising wage inequality through skill upgrading.
CEPII_n°117.indb 79CEPII_n°117.indb 79 18/09/2009 10:32:1718/09/2009 10:32:17

Monia Ghazali / Économie internationale 117 (2009), p. 63-9780
Tab
le 4
- R
egre
ssio
n re
sults
1975
-199
819
83-1
998
1998
-200
2ln
WQ
_WN
Qln
WQ
_WN
Qln
WQ
_WN
Qln
WQ
_WN
Qln
WQ
_WN
Qln
WQ
_WN
Qln
WQ
_WN
Qln
WQ
_WN
Qln
WQ
_WN
Qln
WQ
_WN
Q
(1)
(2)
(3)
(4)
(5)
(6)
(7)
(8)
(9)
(10)
ln M
/VA
(– 1
)0.
035
0.03
30.
027
0.02
40.
029
0.02
8– 0
.523
(0.0
13)*
**(0
.014
)**
(0.0
13)*
*(0
.013
)*(0
.011
)***
(0.0
13)*
*(0
.502
)S.
ln X
/VA
0.00
50.
005
0.00
0– 0
.000
0.00
00.
168
– 0.8
79(0
.007
)(0
.008
)(0
.008
)(0
.008
)(0
.006
)(0
.006
)(2
.779
)
ln D
D/M
(– 1
)– 0
.019
– 0.0
50– 0
.047
(0.0
18)
(0.0
21)*
*(0
.393
)ln
L Q/L
NQ
0.03
90.
034
0.08
8 – 0
.034
– 0.0
33– 0
.028
– 0.0
33– 0
.100
– 0.5
49(0
.037
)(0
.040
)(0
.039
)**
(0.0
29)
(0.0
30)
(0.0
29)
(0.0
29)
(0.2
36)
(0.2
48)*
*ln
L Q/L
NQ*D
1987
– 0.0
10(0
.022
)Re
al a
nnua
l min
. wag
e– 0
.000
– 0.0
00– 0
.000
– 0.0
00– 0
.000
– 0.0
00– 0
.000
– 0.0
00– 0
.006
– 0.0
03(0
.000
)***
(0.0
00)*
**(0
.000
)(0
.000
)(0
.000
)**
(0.0
00)
(0.0
00)*
*(0
.000
)**
(0.0
03)*
(0.0
04)
GD
P gr
owth
0.03
70.
037
– 0.6
37– 0
.663
0.01
50.
043
0.03
60.
132
0.27
10.
656
(0.1
01)
(0.1
00)
(0.4
04)
(0.4
06)
(0.0
70)
(0.1
16)
(0.0
70)
(0.1
09)
(1.2
64)
(0.9
17)
Une
mpl
oym
ent g
row
th(0
.043
)0.
042
– 0.0
97– 0
.100
0.01
3– 0
.003
0.06
30.
513
0.27
0– 1
.834
(0.0
82)
(0.0
82)
(0.1
52)
(0.1
53)
(0.0
87)
(0.2
46)
(0.0
86)
(0.2
38)*
*(0
.474
)(2
.462
)Ti
me
dum
mie
s N
oN
oYe
sYe
sN
oYe
sN
oYe
sYe
sYe
sSe
ctor
dum
mie
s N
oYe
sYe
sYe
sYe
sYe
sYe
sYe
sYe
sYe
sO
bser
vatio
ns23
023
023
023
012
012
012
012
035
23Se
ctor
s10
1010
108
88
89
6R
20.
150.
810.
880.
870.
940.
940.
950.
950.
900.
96*
Sign
ifi can
t at 1
0%; *
* sig
nifi c
ant a
t 5%;
***
sign
ifi can
t at 1
%.
CEPII_n°117.indb 80CEPII_n°117.indb 80 18/09/2009 10:32:1718/09/2009 10:32:17

Monia Ghazali / Économie internationale 117 (2009), p. 63-97 81
5.3 Sensitivity tests
Regressing the model using as a dependent variable the ratio on “engineers and senior executives” annual wage relative to those of unskilled workers subcategories reveals that supervisors and factory workers are the main categories affected by trade liberalization reforms (see TABLE 5). Trade induced-technological changes may play an important role in such a trend by favouring engineers and executives relatively to intermediate skills and by modernizing production processes so as to free the most unskilled workers.
Table 5 - Sensitivity tests, 1975-1998
ln WQ / WAM ln WQ / WEMP ln WQ / WOUV ln WQ / WMAN
(1) (2) (3) (4)L.M/VA 0.021 0.019 0.040 0.001
(0.010)** (0.019) (0.019)** (0.020)ln LQ / LAM 0.113
(0.017)***ln LQ / LEMP 0.061
(0.043)ln LQ / LOUV 0.016
(0.036)ln LQ / LMAN 0.037
(0.017)**Unemployment growth 0.171 1.281 0.571 0.906
0.437 (0.728)* (0.675) (0.571)Real min wage 0.000 – 0.000 – 0.000 – 0.000
(0.000) (0.000) (0.000) (0.000)***Observations 230 230 230 230Sectors 10 10 10 10R 2 0.88 0.75 0.88 0.80
Standard errors between parentheses.Signifi cant at 10%; ** signifi cant at 5%; *** signifi cant at 1%.All columns include sector and time fi xed effects.
5.4. Robustness tests
We check results in TABLE 6. We increase the number of lags on trade openness variables to three (see Columns 1 and 4). We also attempt to assess the results relative to the absence of a signifi cant relationship between skilled labour relative supply and relative wages, by substituting the former using the sector workers average education years (Nme). The share of women in the active population is also introduced as an additional control variable. Indeed, women labour supply in Tunisia is sensitive to economic conditions and is generally considered as a fl exible workforce. Finally, we attempt to explore the effect of sector capital intensity on relative wages, which allows to indirectly assess the capital-skill complementarity hypothesis (see Columns 3, 6 and 7). Results confi rm the signifi cant impact of trade openness and minimum wages on wage inequality in Tunisia, over the observation periods including 1998-2002 (see Column 8). The
CEPII_n°117.indb 81CEPII_n°117.indb 81 18/09/2009 10:32:1818/09/2009 10:32:18

Monia Ghazali / Économie internationale 117 (2009), p. 63-9782
statistically insignifi cance of the coeffi cient on sector workers average education years supports the previous fi nding regarding the lack of a dominant role of relative supply in wage inequality movements. Over the period 1983-1998, a high rate of unemployment growth would have contributed to increase relative wages. Unemployment is thus likely to have mainly affected unskilled workers over this period. Women labour supply impacts negatively relative wages, leading to the narrowing of wage inequality 24 (see Column 5). This may be due to the clear improvement of their education level since the second half of the 1980s. However, this result is not robust to changes in regression periods.
Table 6 - Robustness checks1975-1998 1983-1998 1998-2002
L WQ _WNQ L WQ _WNQ L WQ _WNQ L WQ _WNQ L WQ _WNQ L WQ _WNQ L WQ _WNQ L WQ _WNQ
(1) (2) (3) (4) (5) (6) (7) (8)ln M/VA(– 1) (0.027 0.023 – 0.165
(0.013)** (0.014)* (0.404)S.ln X/VA 0.000 0.001
(0.008) (0.008)ln DD/M(– 1) – 0.044 – 0.045 – 0.625
(0.021)** (0.020)** (0.267)**ln M/VA(– 3) 0.023
(0.011)**ln DD/M(– 3) – 0.041
(0.023)*ln LQ _LNQ 0.062 – 0.043 – 0.031
(0.037) (0.035) (0.028)ln NME 0.048 0.110 0.019 1.860 0.765
(0.066) (0.079) (0.038) (1.389) (1.393)ln (K/L) – 0.055 0.076 – 0.472
(0.038) (0.029)*** (0.300)Real min. wage – 0.000 – 0.000 – 0.000 0.000 – 0.000 – 0.000 – 0.008 – 0.007
(0.000)*** (0.000) (0.000) (0.000) (0.000)** (0.000)** (0.002)*** (0.003)**GDP growth – 0.695 – 0.675 – 0.821 – 0.055 0.016 0.636
(0.425) (0.428) (0.776) (0.140) (0.141) (1.102)Unemploymentgrowth
0.207 0.052 0.051 – 0.877 0.552 0.485 – 1.135 – 3.505(0.140) (0.166) (0.168) (0.802) (0.246)** (0.229)** (2.431) (2.799)
ln women share in active pop.
0.629 0.663 – 0.965 – 0.675(0.627) (0.634) (0.496)* (0.468)
Observations 210 230 230 104 120 120 35 23Sectors 10 10 10 8 8 8 9 6R 2 0.34 0.74 0.75 0.98 0.95 0.96 0.90 0.90
24. The population census carried out by (INS) in 1994 shows that women workers are relatively more educated than men: 51.4% of women workers are college or high-school graduates against 40.5% for men.
CEPII_n°117.indb 82CEPII_n°117.indb 82 18/09/2009 10:32:1818/09/2009 10:32:18

Monia Ghazali / Économie internationale 117 (2009), p. 63-97 83
5.5 Endogeneity tests
Given the possible endogeneity of the relative supply variable LQ /LNQ that could bias regression results and yields to the positive counter-intuitive coeffi cient reported in Column 3 of TABLE 4, we chose to instrument this variable using the double least squares estimator. Instruments used over the period 1975-1998 are the lagged values of the variable related to sector workers average education years. Over the period 1983-1998, we use lagged values of sector value-added.
TABLE 7 displays the results of the Sargan over-identifi cation test that does not reject the validity of the instruments. The Hausman test rejects the double least squares estimates in favour of ordinary least squares estimates. Therefore, it does not support the relative supply endogeneity hypothesis.
Two main comments arise from our fi ndings. The fi rst is relative to the positive, signifi cant and relatively robust relationship between trade liberalization and wage inequality in Tunisia, over the periods 1975-1998 and 1983-1998. An increase of 10% of imports relative to the sector value-added contributes to raise relative wages by about 2.5%. Similarly, a reduction of 10% in tariff protection over 1983-1998 increases wage inequality by 5%.
Results are likely to refute the neoclassical trade theory predictions for developing countries. However, they converge with the conclusions of Latin American empirical country-studies. Numerous channels may trigger such a result. The fi rst is the protection pattern prior to trade liberalization, which, contrary to HOS model hypotheses, favoured unskilled-labour intensive sectors. These sectors were from the second half of the 1980s the most affected by trade reforms. They may have seen a dissipation of the quasi-rent induced by protectionism. Trade-induced skill-biased technological and organisational progress plays also an important role in wage inequality through its effects on skill upgrading.
The second observation is relative to the importance of the demand shifts in relative wages movements, whereas relative supply does not appear to have a signifi cant effect. This result could refl ect a supply measurement problem. Indeed, the relative employment variable that is generally used in neoclassical models assuming full employment becomes inadequate when we account for the Tunisian structural unemployment rate of 16%. Therefore, the wage inequality trend does not refl ect here “the competitive adjustment of wages to labour supply and demand shocks for different types of labour. Instead, it highlights the institutional forces leading the labour market”.25
The excess of skilled labour supply, coupled with an upward trend of wage inequality, although moderate, is primarily seen as a paradox and may reveal a restriction of skilled workers demand to preserve economic rents. However, the explanation is essentially related to the inadequacy of some university academic programs with fi rms’ requirements. Unskilled workers unemployment could be induced by institutional wage rigidities as well as by fi rms’ adjustment response to trade liberalization shock.
25. See Lefranc (1997), p. 1052.
CEPII_n°117.indb 83CEPII_n°117.indb 83 18/09/2009 10:32:1818/09/2009 10:32:18

Monia Ghazali / Économie internationale 117 (2009), p. 63-9784
Table 7 - Endogeneity tests
1975-1998 1983-1998ln WQ _WNQ ln WQ _WNQ ln WQ _WNQ
ln LQ /LNQ 1.139 – 1.776 – 1.586(0.66)* (0.407)*** (0.387)***
ln M/VA(– 1) 0.158 0.120(0.08)* (0.053)**
ln DD/M(– 1) – 0.229(0.110)**
S.ln X/VA 0.03 – 0.022 – 3.568(0.04) (0.066) (3.938)
Real minimum wage – 0.000 0.000 0.001(0.00) (0.001) (0.001)
GDP growth rate – 0.555 – 0.050 0.526(2.39) (1.305) (1.142)
Unemployment growth – 0.092 – 1.312 – 3.568(0.763) (4.332) (3.938)
Observations 230 120 120Sectors 10 8 8
0.47 0.35 0.55Instruments ln NME and L.ln NME ln VA and L.ln VA ln VA and L.ln VASargan test of overidentifying restrictions
Chi2 (1)=1.84 Chi2 (1)=0.3 Chi2 (1)=2.4
Hausman test Chi2 (32)=2.33 Chi2 (22)=13.22 Chi2 (21)=10.45Prob>Chi2 = 1.000 Prob>Chi2 = 0.9269 Prob>Chi2 = 0.9724
6. CONCLUSION
In the 1990s, an abundant literature investigated the link between the integration into the world economy and income inequalities. It was primarily dedicated to Latin American developing countries. The increase in wage inequality reported by these studies is likely to contradict the neoclassical trade theory predictions. Trade liberalization contributes to such a phenomenon through different channels. We can cite the increase in some occupation returns that require a high education level, the role of production relocation for intermediate goods, skill-biased technological changes, the dissipation of quasi-rents and the expansion of the informal sector.
This paper attempted to identify, using panel data, the nature of the relationship between trade liberalization initiated in Tunisia from the second half of the 1980s and wage inequality
CEPII_n°117.indb 84CEPII_n°117.indb 84 18/09/2009 10:32:1918/09/2009 10:32:19

Monia Ghazali / Économie internationale 117 (2009), p. 63-97 85
between skilled and unskilled workers, over the period 1975-2002. It, thus, aimed to extend wage inequality studies to North African countries where related studies are relatively scarce. This fi rst investigation highlights the necessity to explore further channels through which the impact of trade liberalization could be transmitted.
The descriptive analysis performed in Section 3 reveals an increase in wage inequality after the implementation of trade liberalization reforms in 1986. This trend is particularly noticeable 26 over 1986-1990 as well as in 2002; periods exhibiting a signifi cant decline of the rate of trade protection. As Katz and Murphy (1992), Katz and Autor (1999) and Autor et al. (2008), we assumed a (CES) production function with two labour inputs, skilled ( LQ ) and unskilled ( LNQ ) labour. We proxy the skilled labour relative demand using trade liberalization measures, instead of a time trend in previous studies. Regression results confi rm the existence of a positive and statistically signifi cant relationship between imports relative to value-added and wage inequality over the period 1975-1998. The decline in trade protection measured by custom duties relative to imports DD/M contributes to the increase of wage inequality over the period 1983-1998. The main unskilled workers subcategories that seem to be affected by trade liberalization are supervisors and manufactory workers. Between 1998 and 2002, estimation results do not allow us to identify a statistically signifi cant relationship between the openness proxies and relative wages. Furthermore, a decrease in real minimum wages is likely to exert an increasing pressure on wage inequality, though moderate.
Further studies based on fi rm level data would allow for a better understanding of the relationship between trade openness and wage inequality in Tunisia by investigating transmission channels as skill-biased technological progress or industry rent dissipation. The objective is to consider the trade liberalization impact on wage inequalities as resulting from different phenomena endogenous to this process.
M. G.27
26. The trade liberalization effect on wage inequality in Tunisia is nevertheless moderate relatively to that observed in some Latin American countries. The gradual implementation of trade reforms in Tunisia highly contributes to explain this fact. 27. The author wishes to thank the anonymous referees whose suggestions improved the paper greatly. The author is also grateful to Mr. Mongi Ben Chaâben from the Tunisian Institute of Quantitative economy, Mrs. Rim Ben Ayed Mouelhi, Mr. Jean-Marc Siroën, Mrs. Aude Sztulman and Mr. Mondher Ghazali for helpful comments. This paper benefi ted from the fi nancial support of the French Ministry of Foreign and European Affairs and the Tunisian Ministry of higher education, scientifi c research and technology within the framework of the Hubert-Curien partnership program-Utique.
CEPII_n°117.indb 85CEPII_n°117.indb 85 18/09/2009 10:32:1918/09/2009 10:32:19

Monia Ghazali / Économie internationale 117 (2009), p. 63-9786
APPENDIX 1THE ALTERNATIVE MEASURE OF WAGE INEQUALITY
Indicator: the ratio of the average wage in the tertiary sector to the average wage in the manufacturing industry
Appendix 1.1 – 1978-1998
Table A1.1 - Annual nominal average wages
1975-1998, in Tunisian dinars
Tertiary sectorAverage wage ( WSCES )
Manufacturing industryAverage wage ( WIMF )
Wage inequality
1975 923.3 847 1.11980 1516.6 1519.6 1.01985 2304.4 2625.1 0.881986 2363.9 2667.4 0.891987 2497.7 2723 0.921988 2690.6 2946.1 0.911989 2837.7 3192 0.891990 3091.2 3307.8 0.931995 4119.3 4622.9 0.891998 4756.2 4932.2 0.96
Source: Author computations on the basis of the sector level database on wages, IEQ (1998).
Figure A1.1 - Ratio* of the average wage in the tertiary sector to the average wage in the manufacturing industry, 1975-2002
0.40
0.50
0.60
0.70
0.80
0.90
1.00
1.10
1.20
1.30
1972
1974
1976
1978
1980
1982
1984
1986
1988
1990
1992
1994
1996
1998
* WSCES _WIMF
Source: Author computations on the basis of the sector level database on wages, IEQ(1998).
CEPII_n°117.indb 86CEPII_n°117.indb 86 18/09/2009 10:32:1918/09/2009 10:32:19

Monia Ghazali / Économie internationale 117 (2009), p. 63-97 87
Appendix 1.2 – 1998-2002
Table A1.2 - Ratio of the annual average wage
1998-2002
Tertiary sector Average wage ( WTER )
Manufacturing industry Average wage ( WIMF )
Wage inequality
1998 10763 9225 1.171999 10833 9572 1.132000 12831 8836 1.452001 10993 8452 1.302002 15213 9264 1.64
Source: Author computations on the basis of the fi rm level database provided by the Institute of Statistics (INS, Tunis), 1997-2002.
APPENDIX 2FIRM TOTAL WAGE BILL28
We defi ne the following variables:
- CS : total wage bill in fi rm i ;
- L : total employment in fi rm i ;
- j :index corresponding to qualifi cation type;
- Lj employment corresponding to category j ;
- J qualifi cation type chosen as reference;
- lj category j’s share in total employment;
- WB average wage bill per worker in fi rm i ;
- WBj average wage bill for the category j ;
It’s possible to express total employment L in fi rm i, as following:
In addition, category j’s share in total employment could be expressed as:
Total wage bill in fi rm I could be presented as follows:
28. See Maurin and Parent, 1993.
CEPII_n°117.indb 87CEPII_n°117.indb 87 18/09/2009 10:32:2018/09/2009 10:32:20

Monia Ghazali / Économie internationale 117 (2009), p. 63-9788
Similarly, average wage bill per worker in fi rm i could be specifi ed as:
Hence, we obtain the following expression: .
The current database provides fi rm data on total wage bill, as well as skilled and unskilled workers employment. Unskilled workers are considered as our category of reference. Assuming that Q indexes the skilled workers category and NQ the unskilled workers category, we obtain the following expression of the average individual wage bill relative to a fi rm i :
This yields to the estimation of the following random coeffi cient model:
Using the Swamy’s estimator, we obtain for each fi rm, average individual wage bills corresponding to each category of workers for the entire period 1998-2002. Then, multiplying them by the corresponding workers’ numbers available for each year, we fi nd skilled and unskilled total wage bills, for each company of the sample and each year of observation.
CEPII_n°117.indb 88CEPII_n°117.indb 88 18/09/2009 10:32:2018/09/2009 10:32:20

Monia Ghazali / Économie internationale 117 (2009), p. 63-97 89
APPENDIX 3
Figure A3.1 - Wage inequality in Tunisia
Unskilled workers category: supervisors
1.2
1.3
1.4
1.5
1.6
1.7
1.8
1.9
2
1972
1974
1976
1978
1980
1982
1984
1986
1988
1990
1992
1994
1996
1998
WQ_W
AM
Note: WQ , average annual wage for executive managers and engineers; WAM, average annual wage for supervisors.Source: Author computations on the basis of the sector level database on wages, IEQ (1998).
Figure A3.2 - Wage inequality in Tunisia
Unskilled workers category: employees
1.4
1.9
2.4
2.9
3.4
3.9
1972
1974
1976
1978
1980
1982
1984
1986
1988
1990
1992
1994
1996
1998
WQ_W
EMP
Note: WQ , average annual wage for executive managers and engineers; WEMP , average annual wage for employees.Source: Author computations on the basis of the sector level database on wages, IEQ (1998).
CEPII_n°117.indb 89CEPII_n°117.indb 89 18/09/2009 10:32:2118/09/2009 10:32:21

Monia Ghazali / Économie internationale 117 (2009), p. 63-9790
Figure A3.3 - Wage inequality in Tunisia
Unskilled workers category: factory workers
2.1
2.6
3.1
3.6
4.1
4.6
5.1
1972
1974
1976
1978
1980
1982
1984
1986
1988
1990
1992
1994
1996
1998
WQ_W
OUV
Note: WQ , average annual wage for executive managers and engineers; WOUV , average annual wage for factory workers.Source: Author computations on the basis of the sector level database on wages, IEQ (1998).
Figure A3.4 - Wage inequality in Tunisia
Unskilled workers category: apprentices
3
4
5
6
7
8
9
10
1972
1974
1976
1978
1980
1982
1984
1986
1988
1990
1992
1994
1996
1998
WQ_W
MAN
Note: WQ , average annual wage for executive managers and engineers; WMAN , average annual wage for apprentices.Source: Author computations on the basis of the sector level database on wages, IEQ (1998).
CEPII_n°117.indb 90CEPII_n°117.indb 90 18/09/2009 10:32:2218/09/2009 10:32:22

Monia Ghazali / Économie internationale 117 (2009), p. 63-97 91
Figure A3.5 - Real wages evolution for sub-categories of unskilled workers
0.80
0.90
1.00
1.10
1.20
1.30
1.40
1.50
1.60
1.70
1.80
1972
1974
1976
1978
1980
1982
1984
1986
1988
1990
1992
1994
1996
1998
WR_AM WR_EMP WR_OUV WR_MAN
Note: CSUP, executive managers and engineers; MAN, apprentices; AM, supervisors; EMP, employees; OUV, factory workers.Source: Author computations on the basis of the sector level database on wages, IEQ (1998).
Figure A3.6 - Wage inequality between sub-categories
Reference category: apprentices
1
2
3
4
5
6
7
8
9
10
1972
1974
1976
1978
1980
1982
1984
1986
1988
1990
1992
1994
1996
1998
OUV_MAN AM_MAN EMP_MAN CSUP_MAN
Note: CSUP, executive managers and engineers; MAN, apprentices; AM, supervisors; EMP: employees; OUV: factory workers.Source: Author computations on the basis of the sector level database on wages, IEQ (1998).
CEPII_n°117.indb 91CEPII_n°117.indb 91 18/09/2009 10:32:2318/09/2009 10:32:23

Monia Ghazali / Économie internationale 117 (2009), p. 63-9792
APPENDIX 4
Figure A4.1 - Annual real minimum wage evolution in Tunisia
0.00
0.50
1.00
1.50
2.00
1972
1974
1976
1978
1980
1982
1984
1986
1988
1990
1992
1994
1996
1998
Source: Author computations on the basis of the sector level database on wages, IEQ(1998).
APPENDIX 5
Table A5.1 - Two-sample Wilcoxon rank-sum (Mann-Whitney) test
Ouv obs Rank sum expected0 120 16398 144601 120 12522 14460Combined 240 28920 28920
Unadjusted variance: 289200.00Adjustment for ties: 0.00 ----------Adjusted variance: 289200.00Ho: WQWNQ1 (OUV = 0) = WQWNQ 1 (OUV = 1)z = 3.604Prob > |z| = 0.0003
CEPII_n°117.indb 92CEPII_n°117.indb 92 18/09/2009 10:32:2418/09/2009 10:32:24

Monia Ghazali / Économie internationale 117 (2009), p. 63-97 93
Table A5.2 - Panel data specific unit root tests
Levin Lin Chu a) Im Pesaran Shin b) Augmented DF Fisher b)
Phillips PerronFisher b)
WQ /WNQ –3.16*** –3.26*** 43.37*** 66.22***[0.000] [0.000] [0.001] [0.000]
M/VA –2.40** –1.43** 37.5** 34.52**[0.008] [0.033] [0.010] [0.023]
DD/M –2.53 –1.32* 24.86* 17.04[0.001] [0.092] [0.072] [0.382]
LQ /LNQ –4.95*** –3.08*** 48.08*** 30.52*[0.000] [0.001] [0.0004] [0.061]
Notes: The null hypothesis is that the series in the panel contain a unit root.Lag lengths for the Levin Lin Chu, the Im Pesaran Shin and the ADF Fisher χ 2 test (for the majority of variables) were selected automatically using the Schwarz Information Criterion. The bandwidths in the kernel estimations of the Levin Lin Chu and the Phillips Perron Fisher χ 2 tests were chosen automatically using the Newey-West method.The test statistics follow an asymptotically normal distribution with the exception of the Fisher tests where the test statistic follows an asymptotic χ 2 -distribution.The probability of the null hypothesis not being rejected is shown in square brackets below the coeffi cient estimate. ***, ** and * signifi es, respectively, that the null hypothesis of a unit root is rejected at the 1%, 5% and 10% confi dence level.For the fi rms’ invariant (min real wage) variable, we apply the augmented Dickey Fuller unit root test specifi c to time series data. Results reject the hypothesis of unit root at the 1% level.a) The test assumes a common unit root process across the sectors.b) The test assumes an individual unit root process for each sector.
CEPII_n°117.indb 93CEPII_n°117.indb 93 18/09/2009 10:32:2418/09/2009 10:32:24

Monia Ghazali / Économie internationale 117 (2009), p. 63-9794
REFERENCES
Acemoglu, D., 2003. Patterns of skill premia, Review of Economic studies 70, 199-230.
Attanasio, O., Goldberg, P., Pavcnik, N., 2004. Trade reforms and wage inequality in Colombia, Journal of development Economics 74, 331-366.
Autor, D., Lawrence, H., Katz, F., Kearney, M., 2008. Trends in U.S wage inequality: Revising the revisionists, Review of Economics and Statistics 90(2), 300-23, May.
Ben Slama, M., Boumediene, M., 2003. L’exportation manufacturière tunisienne et le contenu éducatif de l’emploi, une analyse en termes de motricité intersectorielle, in « Compétitivité, croissance et ouverture économique : enjeux et défi s », proceedings of the conference held in Tunis, October, 23-24, 2003, 30th anniversary of the IEQ, Cahiers de l’IEQ, special issue.
Beyer, H., Vergara, V., 1999. Trade liberalization and wage inequality, Journal of Development Economics 59, 103-23.
Bigsten, A., Durevall, D., 2006. Openness and wage inequality in Kenya, 1964-2000, World Development 34(3), 465-80, March.
Boudhiaf, M., 2001. La politique tunisienne d’ouverture commerciale, in Siroën, J.-M., Boudhiaf, M,, Ouverture et développement économique, Paris: Economica, 309-20.
Cragg, I., Epelbaum, M., 1996. Why has wage dispersion grown in Mexico? Is it the incidence of reforms or the growing demand for skills?, Journal of Development Economics 51, 99-116.
Currie, J., Harrison, A., 1997. Sharing the costs: The impact of trade reform on capital and labour in Morocco, Journal of Labour Economics 15(3), 44-72.
Durevall, D., Munshi, F., 2006. Trade liberalization and wage inequality: Empirical evidence from Bangladesh, Working Paper in Economics 241, Goteborg University.
Edwards, S., 1992. Trade orientation, distortions and growth in developing countries, Journal of Development Economics 39(1), 31-58.
Edwards, S., 1998. Openness, productivity and growth: What do we really know?, The Economic Journal 108(447), 383-98, March.
Feenstra, R., Hanson, G., 1996. Foreign investment, outsourcing and relative wages, in Feenstra, R., Grossman, G., Irwin, D., (Eds.), Political Economy of Trade Policy: Essays in Honour of Jaghdish Bhagwati, MIT press, Cambridge, 89-127.
Feenstra, R., Hanson, G., 1997. Foreign direct investment and relative wages: Evidence from Mexico’s maquiladoras, Journal of International Economics 42, 371-93.
Feliciano, Z., 2001. Workers and trade liberalization: The impact of trade reforms in Mexico on wages and employment, Industrial and Labour Relations Review 55(1), 95-115.
CEPII_n°117.indb 94CEPII_n°117.indb 94 18/09/2009 10:32:2518/09/2009 10:32:25

Monia Ghazali / Économie internationale 117 (2009), p. 63-97 95
Geishecker, I., Holger, G., 2004. International outsourcing and wages: Winners and losers, mimeo, www.etsg.org/ETSG2004/Papers/Geishecker.pdf.
Goldberg, P., Pavcnik, N., 2003. The response of the informal sector to trade liberalization, NBER Working Paper 9443, National Bureau of Economic Research, Inc.
Goldberg, P., Pavcnik, N., 2004. Trade, inequality and poverty: What do we know?, NBER Working Paper 10593, National Bureau of Economic Research, Inc.
Goldberg, P., Pavcnik, N., 2005. Trade, wages and the political economy of trade protection: Evidence from the Colombian trade reforms, Journal of International Economics 66, 75-105.
Görg, H., Ströbl, E., 2001. Relative wages, openness and skill-biased technological change in Ghana, Credit Research Paper 01/18, University of Nottingham.
Grossman, G., Rossi-Hansberg, E., 2006. The rise of offshoring: It’s not wine for cloth anymore, paper presented at Kansas Fed’s Jackson Hole conference for central bankers, http://www.kc.frb.org.
Haouas, I., Yagoubi., M., 2001. Conséquences de l’ouverture sur le marché du travail : le cas tunisien, in Siroën, J.-M., Boudhiaf, M., Ouverture et développement économique, Paris: Economica, 322-40.
Hanson, G., Harrison., A., 1999a. Trade liberalization and wage inequality in Mexico, Industrial and Labour Relations Review 52(2), 271-88.
Hanson, G., Harrison., A., 1999b. Who gains from trade reform? Some remaining puzzles, Journal of Economic Development 59, 125-54.
Harrison, A., (Ed), 2006. Globalization and Poverty, The University of Chicago Press.
Haskel, J., Slaughter., M., 1998. Does the sector bias of skill-biased technical change explain changing wage inequality?, NBER Working Paper 6565, National Bureau of Economic Research, Inc.
Institut d’Économie Quantitative, 1998. Les Cahiers de l’IEQ 5, Ministère du développement économique, Tunis, mars.
Institut d’Économie Quantitative, 2002. Les Cahiers de l’IEQ 16, Ministère du développement économique, Tunis, mars.
Institut d’Économie Quantitative, 2003. Les Cahiers de l’IEQ 17, Ministère du développement économique, Tunis, mars.
Johnson, G., Stafford., F., 1998. Technology regimes and the distribution of real wages, in Greene, C., Eliasson, G. (Eds.), Microfoundations of Economic Growth: A Schumpeterian Perspective, University of Michigan Press.
Katz, L., Kevin, M., Murphy, K., 1992. Changes in relative wages, 1963-87: Supply and demand factors, Quarterly Journal of Economics 10, 35-78.
CEPII_n°117.indb 95CEPII_n°117.indb 95 18/09/2009 10:32:2518/09/2009 10:32:25
Monia Ghazali / Économie internationale 117 (2009), p. 63-9796
Kirkegaard, J., 2007. Offshoring, outsourcing and production-relocation labour market effects in OECD countries and developing Asia, Working Paper series WP 07-2, the Peterson Institute for International Economics, April.
Kugler, A., 1999. The impact of fi ring costs on turnover and unemployment: Evidence from the Colombian labour market reforms, International Tax and Public Finance 6, 389-410.
Lahouel, M., Marouani, M., 2003. Les accords euro-méditerranéens : les enseignements du cas tunisien, séminaire EMMA-RINOS, « Analyse comparatiste des processus d’intégration régionale Nord-Sud », Paris, 26-27 mai.
Leamer, E., 1994. Trade, wages and revolving door ideas, NBER Working Paper 4716, National Bureau of Economic Research, Inc.
Lefranc, A., 1997. Salaires et relatifs et chômage, une analyse comparative France/États-Unis, Revue économique 48(5), 1041-60.
Machin, S., Van Reenen, J., 2007. Changes in wage inequality, special paper 18, Centre of economic performance, the Economic and Social Research Council, April.
Maloney, F., 2004. Informality revisited, World Development 32(7), 1159-78.
Marjit, S., Acharyya, R., 2003. International Trade, Wage Inequality and the Developing Economy: A General Equilibrium Approach, Heidelberg.
Maurin, E., Parent, M.-C., 1993. Productivité et coût du travail par qualifi cations, in Croissance, emploi, productivité, proceedings, 18ème journée des centrales de bilans, Association Française des Centrales de bilans (AFCB), Paris, 23 novembre.
Mazumdar, J., Quispe-Agnoli, M., 2002. Trade and the skill premium in developing countries: The role of intermediate goods and some evidence from Peru, Working Paper 2002-11, Federal Reserve Bank of Atlanta, July.
Mouelhi Ben Ayed, R., 2007. Impact of trade liberalization on fi rm’s labour demand by skill: The case of Tunisian manufacturin, Labour Economics 14(3), 539-63, June.
Pavcnik, N., 2003. What explains skill upgrading in less developed countries?, Journal of Development Economics 71, 311-28.
Pavcnik, N., Blom, A., Goldberg, P., Schady, N., 2004. Liberalization and industry wage structure: Evidence from Brazil, The World Bank Economic Review 18(3).
Pissarides, C., 1997. Learning by trading and the returns to human capital in developing countries, The World Bank Economic Review 11, 17-32.
Pritchett, L., 1996. Measuring outward orientation in LDCs: Can it be done?, Journal of Development Economics 49(2), 307-35.
Redjeb, M., Ghobentini, S., 2005. L’intermédiation sur le marché du travail en Tunisie, Cahiers de la stratégie de l’emploi 2005/19, Unité Recherches et analyses sur l’emploi, Département Stratégie en matière d’emploi, Organisation internationale du travail.
CEPII_n°117.indb 96CEPII_n°117.indb 96 18/09/2009 10:32:2518/09/2009 10:32:25

Monia Ghazali / Économie internationale 117 (2009), p. 63-97 97
Robertson, R., 2004. Relative prices and wage inequality: Evidence from Mexico, Journal of International Economics 64, 387- 409.
Sachs, J., Warner, A., 1995. Economic reforms and the process of global integration, Brookings Papers on Economic Activity 1, 25th anniversary issue, 1-118.
Siröen, J.-M., 2001. L’ouverture commerciale est-elle mesurable ?, in Ouverture et développement économique, proceedings, CNRS, GDR Economie & Finance internationales (11th conference, 2000), Paris: Economica, 103-23.
Wood, A., 1995. How trade hurt unskilled workers?, Journal of Economic Perspectives 9(3), 57-80.
Wood, A., 1997. Openness and wage inequality in developing countries, The Latin American challenge to East Asian conventional wisdom, The World Bank Economic Review 11(1), 33-57.
Zhu, S., Trefl er, D., 2005. Trade and inequality in developing countries: A general equilibrium analysis, Journal of International Economics 65, 21-48.
CEPII_n°117.indb 97CEPII_n°117.indb 97 18/09/2009 10:32:2518/09/2009 10:32:25