Embed Size (px)
Citation preview

Monetary Policy, Labor Income Redistribution and the Credit Channel:Evidence from Matched Employer-Employee and Credit Registers∗
Martina Jasova‡ Caterina Mendicino § Ettore Panetti ¶
José-Luis Peydró‖ Dominik Supera∗∗
Abstract
We document the redistributive effects of monetary policy on labor market outcomes via thecredit channel. For identification, we exploit matched administrative datasets in Portugal –employee-employer and credit registers – and monetary policy since the Eurozone creation. Wefind that softer monetary policy improves wages, hours worked and employment more in smalland young firms, which are more financially constrained. Within these firms, the wage effectsaccrue to incumbent workers, in line with the back-loaded wage mechanism. Consistent withthe capital-skill complementarity mechanism, we document an increase in the skill premium andshow that financially constrained firms increase both physical and human capital investmentthe most. Our findings uncover a central role for the firm-balance sheet and the bank lendingchannels of the monetary policy transmission to labor income inequality, with state-dependenteffects that are stronger during crises. Importantly, we do not find any redistributive effects forfirms without bank credit.
JEL classification: D22, D31, E52, G01, G21Keywords: Monetary policy, Labor income inequality, Firm balance sheet channel, Banklending channel, Capital-skill complementarity.
∗We are grateful to Adrien Auclert, Davide Debortoli, Hans Degryse, Anne Duquerroy, Jordi Galí, Mark Gertler,Daniel Hamermesh, Fatih Karahan, Arvind Krishnamurthy, Kurt Mitman, Makoto Nakajima, Vincenzo Quadrini,Pascal Paul, Monika Piazzesi, Amit Seru, Fabiano Schivardi and Andrei Shleifer and seminar participants atColumbia, European Central Bank, EALE SOLE AASLE World Conference 2020, CEBRA 2020, Monetary Policyand Heterogeneity Conference Board of Governors, 3rd Bank of Italy-CEPR Labor Workshop, Norges Bank WorkshopFrontier Research in Banking, Bank of Portugal, Workshop Empirical Monetary Economics 2020, CREI UniversitatPompeu Fabra, Bank of Italy-CEPR “Closing the Gaps” Conference, European Commission, 10th MoFiRWorkshop onBanking, SED and Liberal Arts Macro Conference for useful comments and suggestions. The authors also thank PauloGuimaraes, Pedro Prospero, Fatima Teodoro, Maria Lucena Vieira and the staff of the “Laboratorio de Investigacaocom Microdado” at the Bank of Portugal (BPLim) for their help with data collection and management and PedroMoreira for research assistance. Jasova and Supera also gratefully acknowledge financial support from the WashingtonCenter for Equitable Growth. This paper started when Panetti was an economist in the Department of EconomicStudies of the Bank of Portugal. The opinions expressed herein are those of the authors and do not necessarily reflectthose of the Bank of Portugal, ECB or the Eurosystem. All errors are our own.‡Barnard College, Columbia University, Department of Economics, 3009 Broadway, New York, NY 10027, USA.
Email: [email protected] Corresponding author§European Central Bank. Email: [email protected]¶University of Naples Federico II, UECE and SUERF. Email: [email protected]‖Imperial College, ICREA-UPF-CREI-BarcelonaGSE, and CEPR. Email: [email protected]∗∗Wharton School, University of Pennsylvania. Email: [email protected]
In recent years inequality has received a great deal of attention in the monetary policy debate(e.g., Bernanke 2015; BIS 2021; Bullard 2014; Lagarde 2020; Mersch 2014; Powell 2019; Yellen2014).1 While monetary policy is not directly intended to redistribute income or wealth in theeconomy, a growing strand of the macroeconomic literature suggests that it is not immune toredistributive consequences (e.g., Doepke and Schneider 2006; Kaplan et al. 2018). The bulk of thediscussion centers on the relationship between monetary policy and wealth through its effects onasset prices.2 However, earnings heterogeneity also represents a relevant source of redistribution(e.g., Auclert 2019). Yet, the quantification of the distribution of these effects across different typesof workers and firms in the economy as well as the underlying mechanisms remain open questions.
The estimation of the redistributive effects of monetary policy on labor market outcomes ischallenging as it requires an exploration of its effects across both workers and firms. The increase inthe dispersion of average earnings between firms is one of the main reasons behind the rise in incomeinequality (see e.g., Song et al. 2018, for the evidence in the U.S.). In addition, firm financial frictionsare crucial in determining how monetary policy transmits to firm-level employment and investment(Cloyne et al. 2018; Gertler and Gilchrist 1994; Ottonello and Winberry 2020) and also contributeto shape wage contracts (Guiso et al. 2013; Michelacci and Quadrini 2009). It follows that, theassessment of the redistributive effects of monetary policy on worker labor market outcomes shouldconsider firms characteristics and financial frictions, in addition to workers characteristics.3
This paper provides novel evidence on the heterogeneous effects of monetary policy on workerlabor market outcomes, and on the importance of the credit channel. We exploit a unique granularadministrative dataset that matches linked employee-employer data and firm loan-level credit registryin Portugal since the Eurozone creation. Softer monetary policy conditions disproportionatelyincrease worker-level wages and hours worked and firm-level employment in small and young firms,which tend to be more financially constrained. We find that, consistent with the back-loadedwage mechanism, monetary policy relaxes financial constrains and allows firms to increase the wageprofile of their incumbent workers whose wages were previously back-loaded. Further, we provide
1According to the comprehensive overview of central banks’ speeches both in advanced and emerging markets inBIS (2021), about 10% of all recent central bankers’ communications mentions keywords “inequality” or “distributionalconsequences/impact of monetary policy”. Inequality and the need for monetary policy to take it into account wasalso among the most debated topics at the listening events of the Federal Reserve and the ECB monetary policystrategy review.
2A number of studies have show that softer monetary policy boosts stock prices (Bernanke and Kuttner 2005),corporate bond prices (Gertler and Karadi 2015) and government bond prices (Hanson and Stein 2015). As richerhousehold hold a disproportionate share of stock and bonds, it has been argued that monetary easing fuels capitalincome and wealth inequality (see e.g., Bernanke et al. 1996; BIS 2021).
3To date, the main evidence on monetary policy and income inequality relies on consumer survey data (e.g.,Coibion et al. 2017) and, hence, it cannot observe firms or follow workers over time as they move across firms todisentangle to importance of worker and firm characteristics on wages.
1

new evidence on the effects of monetary policy on the capital-skill complementarity. Following amonetary policy softening, small and young firms are able to increase both their physical and humancapital investment the most. In addition, we document a rise in the skill premium by showing thathigh-skilled workers benefit the most both in terms of wages and hours worked. Our paper highlightsthe central role played by the credit channel in the transmission of monetary policy to labor incomeinequality. In particular, both the firm balance-sheet and the bank lending channels are importantto explain the heterogeneous effects of monetary policy on labor market outcomes. Finally, we showthat these effects are substantially stronger during crisis times, i.e. when financial constraints arethe most severe.
Our setting allows us to overcome key data and endogeneity challenges. First, we exploit anunparalleled match of granular longitudinal data on workers, firms, banks and loans in Portugal. Theadministrative employee-employer data cover all private sector workers over two full monetary policycycles (1999–2013). The dataset includes rich information on workers (e.g., occupation, education,regular wage, any additional wage supplements, hours worked) as well as employers (e.g., industry,region, age, sales, investment). Hence, it allow us to analyze all critical labor market outcomes(wages, hours worked and employment) and follow workers over many years as they move acrossfirms. Furthermore, a novelty of this paper is that we match the administrative employee-employerdata with the universal coverage of loans from the credit registry to investigate the importance ofthe credit channel.4 To the best of our knowledge, this is the first paper that makes use of theuniversal credit registry matched with administrative employee-employer data covering the entiretyof the private sector employees to study the labor market effects of monetary policy. This allows usto highlight the critical role played by firm and worker characteristics for the redistributive effectsof monetary policy on labor market outcomes and uncover the underlying mechanisms associatedwith the existence of financial frictions at the firm and bank level. Hence, the availability of such acomprehensive and novel dataset enables us to make key contributions to the literature.
Second, the institutional setting helps us overcome potential reverse causality issues betweenmonetary policy and the labor market. Since 1999 Portugal has been part of the Eurosystem andmonetary policy has been jointly set by the European Central Bank (ECB) for all member states.We argue that euro area monetary policy has been mostly exogenous to the state of the Portugueseeconomy as (i) Portugal accounts to 1.8% of Eurozone GDP, (ii) the Portuguese business cyclehas not yet converged to the one of the core euro area economies (Giannone et al. 2011), and (iii)
4The high-quality granular credit registry in Portugal collects information on all firm credit above the reportingthreshold of just EUR 50. In addition to the loan amounts, the credit register includes information on other key loancharacteristics, such as the maturity, currency and loan type.
2

the Portuguese economy was very sluggish at the Eurozone creation (Blanchard 2007; Reis 2013).5
Portugal also represents a suitable laboratory to investigate the state-dependent labor market effectsof monetary policy. As the country was severely hit by the Global Financial Crisis and the EuropeanSovereign Debt Crisis, this setting allows us to study the importance of the credit channel not onlyin normal times, but also in crisis times, when credit frictions matter the most.
In this paper, we examine the redistributive effects of monetary policy on a number of labormarket outcomes (hourly wages, hours worked and employment) and the role of the credit channel.Our baseline measure of monetary policy conditions is the overnight interbank interest rate for theEurozone (EONIA) as in Jimenez et al. (2014) but we also show that the results are robust to theuse of the shadow rate (Wu and Xia 2016) and monetary policy surprises (Jarocinski and Karadi2020). Using the administrative employee-employer data, we follow workers over time as they moveacross firms to disentangle the time effects as well as permanent firm- and worker- component intheir labor market outcomes using time, firm and worker fixed effects. This modelling approach isconsistent with the seminal contribution by Abowd et al. (1999). We build on this framework andexplore heterogeneous responses across different firms and workers. In terms of firm heterogenieties,we start with firm size and age as proxies of financial constraints, and next we introduce micro-level credit data to directly measure firm-level credit sensitivity to monetary policy. In terms ofworker heterogeneity, we explore the differences between stayers and new hires as well as the role ofthe skill premium as measured by each worker educational attainment (e.g., college degree, STEMeducation).6
We establish four findings. First, softer monetary policy conditions improve labor marketoutcomes more in small and young firms, which tend to be more financially constrained. Followinga 1 percentage point (pp) decrease in the monetary policy rate, workers in small (young) firmsexperience a 1.16 pp (0.4 pp) stronger increase in wages in the following year compared to workersin large (old) firms. These effects also persist in subsequent periods. While the magnitude of theimpact is the largest in the first year, the positive and statistically significant effect lasts for atleast the next three years. Within small and young firms, we find that the wage effects accrue to
5It is also important to note that the ECB raised monetary rates in 2011 when Portugal was in the middle of aneconomic and financial downturn. Further, the ECB did not conduct quantitative easing during our sample period1999–2013. The ECB only introduced its expanded asset purchase program in March 2015 (i.e., seven years afterthe onset of the crisis). In addition, we overcome remaining concerns regarding the endogeneity by showing that ourresults are consistent and robust to a range of alternative monetary policy measures (e.g., monetary policy surprises orshadow rates) and also for inclusion of macroeconomic and financial control variables, as in line with the Taylor-typeinterest rate rule logic. This is similar in spirit to the approach in Christiano et al. (1999).
6The focus of this analysis is to study the redistributive labor market effects associated with monetary policy. Tothis end, in our estimations we control for the heterogeneous effects of the domestic business cycle and of the globalfinancial cycle.
3
existing workers. We argue that, consistent with the back-loaded wage mechanism (Guiso et al.2013; Michelacci and Quadrini 2009), monetary policy relaxes financial constrains and allows firmsto increase wage profiles for their incumbent workers whose wages were previously back-loaded. Tothis end, we first show that small and young firms indeed tend to offer below-equilibrium wages.7
Our results are important because they suggest that these firms “pay back” to their existing workersand increase the wage profile of the incumbent workers whose wages were previously back-loaded.8
A 1 pp decrease in the monetary policy rate reduces the wage gap between small and large firmsby approximately 5%, and between young and old firms by about 4.4%. In addition to the wageeffects, we show that softer monetary policy also increases employment and hours worked by morein small and young firms. A 1 pp decrease in the monetary policy rate is associated with a 1.73pp stronger increase in employment in small firms compared to large firms, and a 2.16 pp largerincrease in employment in young firms compared to old firms. Taken together, softer monetarypolicy improves labor market outcomes more in small and young firms and hence reduces inequalitybetween firms in the economy.
Second, we take a step further and explore worker-level heterogeneity with respect to skill.The existing literature has provided substantial evidence that the composition of workers acrossfirms plays a pivotal role in understanding wage dispersion in the economy (Abowd et al. 1999;Card 1999; Card et al. 2013). We show that following a monetary policy softening, high-skilledworkers benefit the most both in terms of wages and hours worked. A 1 pp decrease in themonetary policy rate is associated with a 1.14 pp stronger increase in wages and 2.7 pp increasein hours worked for high-skilled workers relative to the outcomes of low-skilled workers. Next, wecombine worker and firm heterogeneity and show that the skill-premium effects are concentratedin small (young) firms. As high-skilled and high-wage workers tend to be mostly employed bylarge and high-wage firms (Engbom and Moser 2017), a monetary policy softening is associatedwith a labor reallocation of skilled workforce towards smaller firms. Consistent with the capital-skill complementarity mechanism, softer monetary policy allows financially constrained firms toincrease both capital investment and employment of skilled workers. In addition, by exploitingthe availability of detailed education coding in the micro-level data, we show that the increasedemployment of skilled workers and the rise in the skill-premium are more pronounced for workerswith STEM degrees. Overall, our findings lend further support to the capital-skill complementarymechanism.
7By comparing wages of workers in the same region, industry and job title across firms, we find the wage differentialto be around 23% between small and large firms and 9% between young and old firms.
8The results in support of the back-loaded wage mechanism are also robust to the inclusion of firm-time fixedeffects.
4

Third, we document the importance of the credit channel for the redistributive effects of monetarypolicy through the labor market. We start by comparing the effect on wages for firms with andwithout bank credit. We find that monetary policy is associated with economically and statisticallysignificant wage effects in small and young firms only for firms with previous bank-borrowingrelationships. On the contrary, the effects are null for workers in firms that do not have any bankborrowing in the previous periods. To further corroborate these findings, we also show a strongersensitivity of worker wages in small and young firms when these firms are highly levered.
Next, we exploit the richness of the credit registry data and show that both the firm balance-sheet channel and the bank lending channel play an important role in explaining the heterogeneouseffects of monetary policy on labor market outcomes.9 We analyze the firm balance-sheet channelby proposing a novel, agnostic approach that allows us to compute the firm-level credit sensitivityto monetary policy changes. While we validate that our measure relates to commonly used proxiesfor financial constraints such as size and age (see e.g., Cloyne et al. 2018), the proposed strategyoffers a flexible approach that does not require to observe (or take an ex-ante stance on) whichfirm characteristics are the main drivers of the heterogeneous response to monetary policy.10 Next,we turn to the analysis of the bank lending channel. We proxy for bank financial constraint byusing measures of bank health (Amiti and Weinstein 2018; Bernanke and Gertler 1995; Jimenezet al. 2012) and bank liquidity positions (Kashyap and Stein 2000). Our findings show that byalleviating firm and bank financial constraints, softer monetary policy allows easier access to creditfor constrained firms and for firms borrowing from more constrained banks. Most importantly, weshow that workers in these firms benefit more in terms of wages, hours worked and employment.11
Fourth, we show that the redistributive effects of monetary policy are state dependent. Theeffects of softer monetary policy on worker labor market outcomes are 2 to 3.5 times stronger in crisisperiods than in normal times. Crucially, both the firm balance-sheet and the bank lending channels
9According to the firm balance-sheet channel, firms’ borrowing ability is directly related to the value of theirnet worth, which gives rise to an external finance premium. Softer monetary policy increases firms’ asset value andconsequently decreases the external finance premium improving their capacity to raise external funds (Bernanke et al.1996; 1999). The bank lending channel predicts that if banks cannot frictionlessly rely on uninsured sources of funds,expansionary monetary policy positively affects the provision of bank credit supply to the economy. The magnitudeof this effect depends on the strength of the bank balance channel and its liquidity position (Bernanke and Blinder1988; Kashyap and Stein 2000).
10Importantly, in the estimation of the firm-level credit sensitivity to monetary policy changes we introduce bank-time fixed effects to control for the time-varying bank-level credit supply, and industry-region-time fixed effects toabsorb any heterogeneity at the industry-region-time including changes in the firm demand for credit which could betriggered by local and industry time-varying conditions. Our results are also robust to alternative estimations.
11We examine the relative importance of the firm-balance sheet and bank lending channels by augmenting theworker-level regressions to simultaneously include proxies for the two channels. Both remain significant. Thus, ourresults highlight that the two versions of the credit channel complement each other in the transmission of monetarypolicy to labor income inequality.
5

display stronger effects in crisis times. Our results suggest that monetary policy is particularlyeffective in alleviating bank and firm financial constraints during periods of financial distress, therebymitigating labor income inequality.
Related literature. Our paper relates to four strands of the academic literature. First, wecontribute to the recent and growing literature that studies the redistributive effects of monetarypolicy (e.g., Auclert 2019; Coibion et al. 2017; Gornemann et al. 2016). While existing papers mainlyexplore the relationship between monetary policy and wealth inequality (e.g., Andersen et al. 2021;Holm et al. forthcoming), we focus on labor income inequality. Auclert (2019) decomposes aggregateconsumption into a number of channels and demonstrates that the earning heterogeneity channel isimportant for the transmission of monetary policy to consumption. We closely examine all relevantmargins (wages, hours worked and employment) and uncover the crucial role of both firms andworkers characteristics for the redistributive effects of monetary policy on labor market outcomes.In particular, our results show that the redistributive effects of monetary policy are mainly drivenby small and young firms and highlight the importance of the back-loaded wage mechanism (e.g.,Guiso et al. 2013; Michelacci and Quadrini 2009) for firm heterogeneity and of the capital-skillcomplementarity mechanism for worker heterogeneity (e.g., Krusell et al. 2000). We also show thatfirm and bank financial constraints play a crucial role in propagating the effects of monetary policyto worker labor market outcomes. The assessment of the credit channel (e.g., Bernanke and Gertler1995; Drechsler et al. 2017; Kashyap and Stein 2000) for the heterogeneous effects of monetary policyon labor market outcomes had been left unexplored and represents one of our novel contributionsto the existing literature on the redistributive effects of monetary policy.
Our paper closely relates to Coibion et al. (2017) who, using survey data, show that expansionarymonetary policy decreases inequality in the U.S.. The quantification of the redistributive effectsof monetary policy on worker labor market outcomes based on the exploration of its effects acrossboth workers and firms distinguishes our analysis from other existing work. Consumer survey datado not allow to observe firms (and measure their financial constraints) or to follow workers overtime as they move across firms to disentangle the importance of worker and firm characteristics onwages. Instead, we use linked employee-employer administrative data (covering all private sectorfirms in Portugal), which allow us to observe workers over time as they move across different firms.This is crucial as it enables us to explore the critical role of firm heterogeneity on worker wages (seee.g., Song et al. 2018).12 In addition, it also allow us to quantify the importance of the underlyingmechanisms associated with firm and bank financial constraints, and hence their implications for
12Importantly, Song et al. (2018) finds that the increase in the dispersion of average earnings between firms is oneof the main reasons behind the rise in income inequality in the United States.
6
the effects of monetary policy labor income inequality.Second, the reliance on the employee-employer data also connects our paper to a large body of
literature that investigates the evolution of inequality over time (Card et al. 2015; Alvarez et al. 2018;Song et al. 2018). Our modelling approach is consistent with the framework proposed by Abowdet al. (1999), as we follow individuals over time as they move across firms. Relative to the existingwork, this paper is explicit about the source of wage changes over time. In particular, we studyhow monetary policy affects labor income inequality (while controlling for other macroeconomic andfinancial conditions). To this end, we analyze how these worker and firm characteristics interactwith monetary policy conditions and provide new evidence on how monetary policy propagates towages and hours worked across various workers of different characteristics.
Third, we complement existing studies on the labor market effects of credit shocks (Barbosa et al.2019; Berton et al. 2018; Chodorow-Reich 2014; Giroud and Mueller forthcoming; Moser et al. 2021).In particular, Chodorow-Reich (2014) exploits syndicated-loan data to show the heterogeneouseffects of the Lehman crisis on U.S. firm-level employment outcomes. By using a rich dataset thatmatches the credit register loan-level information with employment data for workers, firms andbanks, Berton et al. (2018) document the impact of credit supply shocks on employment acrossfirms, workers, and job contracts in the Veneto region of Italy. More recently, Moser et al. (2021)use the ECB’s negative interest rate policy as implemented in 2014 to explore the employment andwage effects of a credit supply shock in Germany. A number of distinctive features of our analysismakes our work complementary to other studies. First, our results are not related to a particularcredit supply shock, but summarize the impact of monetary policy changes on labor earnings for theuniverse of Portuguese private sector workers over 14 years. Specifically, our sample includes normaland crisis times and enables us to show the state-dependent effects of the credit channel. Second,our comprehensive datasets allows us to analyze all private sector employees in the economy andthe full universe of loan data.13 This allows us to contribute to the existing literature by uncoveringthat workers in small firms benefit the most from a monetary policy softening. Third, we documentthe importance of back-loaded wage and capital-skill complementarity mechanisms in the monetarypolicy transmission.14
13Moser et al. (2021) use syndicated-loan data in Germany which allows them to cover 36% of the labor force,primarily in large firms. Berton et al. (2018) analyze data from a single Italian region relying on the credit reportingthreshold of 75,000 EUR (later 30, 000 EUR). We observe all credit contracts above just 50 EUR which allows us to(i) observe the entirety of bank borrowing of private sector non-financial firms in the economy, (ii) use firms that arenot borrowing for external validity to corroborate the importance of the credit channel.
14Our result on the capital-skill complementarity mechanisms also relates to Dolado et al. (2021) who reportaggregate and industry-level evidence that monetary policy increases labor income inequality between high- and low-skilled workers. We add to their findings by showing that firm characteristics matter. Specifically, by exploitinggranular micro-level data, we can show that the redistributive effects of monetary policy are driven by small and
7

Fourth, our work relates to the large literature that studies the role of the firm balance-sheetchannel (Bernanke and Gertler 1995) and the bank lending channel (Bernanke and Blinder 1992;Drechsler et al. 2017; Kashyap and Stein 2000) for the transmission of monetary policy. We buildon the recent studies that use micro-level credit registry data to provide evidence on the impactof monetary policy (e.g., Jimenez et al. 2012; 2014) or other credit supply shocks (e.g., Amiti andWeinstein 2018; Khwaja and Mian 2008; Paravisini 2008; Schnabl 2012) on lending to firms andfirm-level real outcomes. Our work also complements recent papers on the effects of monetary policyon firm-level outcomes (e.g., Bahaj et al. 2019; Cloyne et al. 2018). Existing papers focus on theinvestment and employment effects through the firm balance-sheet channel. We show that monetarypolicy has also important heterogeneous effects on worker wages and hours worked. Furthermore,both the firm balance sheet and the bank lending channels are important for the monetary policytransmission mechanism and are substantially stronger in crisis times. Finally, we find no effect forfirms without bank credit.
The remainder of the paper is organized as follows. Section 1 discusses data and identificationchallenges and introduces our dataset. We present the results on the redistributive monetary policyon wages in Section 2 and on employment and hours worked in Section 3. Section 4 explores theeffects of capital-skill complementarity. Section 5 analyzes the role of the credit channel. Section6 compares the effects in normal times and in crisis periods. Section 7 presents the robustnessanalysis. Finally, Section 8 concludes.
1 Identification Challenges and Data
1.1 Identification and data challenges
Our setting allows us to overcome key identification and data challenges. First, the analysisrequires granular longitudinal data on firms and workers. The recent literature has highlightedthe importance of firm identity on worker wages (see e.g., Alvarez et al. 2018; Card et al. 2013;Engbom and Moser 2017; Song et al. 2018). In particular, Song et al. (2018) show that the increasein the dispersion of average earnings between firms is one of the main reasons behind the rise inincome inequality in the U.S.. To date, existing evidence has primarily relied on survey data (e.g.,Coibion et al. 2017) which cannot identify firms or track the same workers over time as they movein the labor market. On the contrary, our administrative employee-employer dataset enable us tofollow workers over time as they move across different firms. This is important because it allows
young firms which are able to disproportionately increase both human and physical capital investment.
8

us to disentangle the permanent worker and firm component in wages, following the modellingapproach of Abowd et al. (1999). Hence, we can examine the effects of the additional variationassociated with monetary policy changes.
Second, the analysis of the credit channel and financial frictions in the monetary policy transmissionmechanism requires a detailed picture of firm borrowing conditions. To this end, we exploit anunparalleled match of granular employee-employer and credit registries. The Portuguese creditregistry provides the universal credit coverage and allows us to examine the role of credit acrossall firms in the economy including SMEs. To the best of our knowledge, this is the first paper thatmakes use of the universal credit registry matched with administrative employee-employer datacovering the entirety of private sector employees.
Third, the focus on Portugal also helps us address potential concerns regarding reverse causalityissues, as monetary policy can react to labor market dynamics.15 Portugal joined the Eurozone in1999 and monetary policy is jointly set for all of its member states by the ECB. Portuguese GDPconstitutes on average only 1.8% of the euro area GDP. Importantly, the Portuguese economy wasvery sluggish following the Eurozone creation (Blanchard 2007; Reis 2013) and its business cycle hasnot converged to that of the core countries (Giannone et al. 2011). Furthermore, it is also importantto highlight that the ECB raised monetary rates in 2011 when Portugal was in the middle of aneconomic and financial downturn. Further, the ECB only started to conduct quantitative easingin 2015 (outside of our 1999–2013 sample period). As a result, we argue that euro area monetarypolicy has been rather exogenous to the state of the Portuguese economy. To further addressthis issue, in our regression analysis we control for business cycle and financial sensitivity usingthe Portuguese GDP growth and VIX. In addition, we further address any potential remainingendogeneity challenges by replacing the overnight interest rate measure (EONIA) with the high-frequency monetary policy surprises (as measured by Jarocinski and Karadi (2020)) and we showthat all our results are robust to the use of unexpected monetary policy surprises as an alternativemeasure of monetary policy. As labor market outcome are only observed at the annual frequency,changes in the monetary policy rate are more appropriate for our benchmark analysis. Nevertheless,in Section 7, we show that our results are robust to alternative monetary policy measures includingmonetary policy surprises.
Fourth, Portugal also represents a suitable laboratory to investigate the state-dependent labormarket effects of monetary policy. Portugal was severely hit by the Global Financial Crisis andthe European Sovereign Debt Crisis. This allows us to study the importance of the credit channel
15This challenge is particularly salient in the U.S. where full employment is part of the Federal reserve dual mandate.On the contrary, in the Eurozone, the ECB follows a single (price-stability) target.
9

not only in normal times, but also during crisis times, when financial frictions matter the most.The focus on Portugal presents a valuable novel setting complementary to other contemporaneousevidence using data from Norway (Holm et al. forthcoming) or Germany (Moser et al. 2021), i.e.economies that were not as adversely affected by the crisis.
1.2 Data
We build a novel granular dataset that matches the employee-employer and credit registers inPortugal. It allows us to fully track the transmission of monetary policy via banks and firms toworker labor market outcomes. We focus on the period since the creation of the Eurozone in 1999until 2013, i.e. a sample that covers two monetary policy cycles.
Employee-employer data. Quadros de Pessoal (QP) is the linked employee-employer datasetcovering all private sector employees in Portugal constructed by the Portuguese Ministry of Labor,Solidarity and Social Security. Private sector firms in Portugal with at least one paid employee arerequired to submit information on their entire workforce on a yearly basis. The dataset includesinformation on employee’s occupation, education, regular monthly salary, any additional wagesupplements, hours worked, etc. On the employer’s side, we observe the firm’s industry, region,founding year and sales in the previous year. In addition to the rich description of worker and firmobservables, the dataset also allows us to follow workers over time as they move across differentfirms.16
Credit register. One of the main contributions of this paper is to analyze the role of the creditchannel in the transmission of monetary policy to labor market redistribution. For this purpose, weexploit the match of QP with the credit registry - Central de Responsabilidades de Credito (CRC) -collected and managed by the Bank of Portugal. CRC reports monthly level data on all loans abovethe reporting threshold of 50 EUR that firms receive from credit institutions supervised by the Bankof Portugal. The dataset includes information on loan amounts and key loan characteristics, such
16There are the two limitations of the QP dataset. First, while the dataset covers the universe of private sectoremployees, it abstracts from government employees (approximately 20% of the Portuguese workforce). Second, QPprovides a snapshot of labor market outcomes as of the reference month (October). Individuals who happen tobe unemployed or out of the labor force at the time of the census have no labor market record for that year. Weaddress these challenges by checking for significant discrepancies in the coverage of the QP dataset. We match theQP data with the aggregate quarterly labor statistics and we do not identify any potential concerns for our analysis.In particular, we do not observe substantial flows of workers between the private and public sector over the sampleperiod. In addition, the annual data collection occurs in late October and therefore, it does not suffer from significantflows of seasonal workers and appears to be representative of overall labor market conditions. The annual frequencyof the data also does not pose any major challenge as wages are generally renegotiated only once per year. It iscommon in the literature to focus on annual data even if higher frequency data is available (see e.g., Patterson 2019;Sorkin 2018).
10

as maturity, currency, type of the loan, and guarantee/collateral used to secure the loan, if any. Inthis paper, we utilize the credit registry data on total credit (drawn credit as well as unused creditlines) between private NFCs and banks. We restrict the focus to domestic banks and domesticsubsidiaries of foreign banks.
Additional bank and firm data. We augment the dataset with firm-level annual censusdata Informacao Empresarial Simplificada (IES) managed by the Bank of Portugal. IES providesdetailed annual information on firm balance sheets, income statements, etc. We use this informationto construct key firm-level variables such as size (total assets), total debt or investment. Additionally,we use a set of bank variables from the Bank of Portugal’s proprietary dataset on bank balancesheet - Balanco das Instituicoes Monetarias e Financeiras - to construct a bank liquidity measure.
Monetary policy. Finally, we measure ECB monetary policy conditions using the overnightinterbank interest rate, i.e. the Euro Overnight Index Average (EONIA). EONIA signals ECBmonetary policy conditions and is analogous to the U.S. Fed funds rate. Overnight rates arecommonly used in the literature to capture monetary policy conditions (e.g., Kashyap and Stein2000; Jimenez et al. 2014). For robustness, we also use alternative monetary policy measures,namely the shadow rates constructed by Wu and Xia (2016) and the annualized monetary policysurprises provided by Jarocinski and Karadi (2020).
Table 1 summarizes the data. Our sample covers the 1999–2013 period.17 We focus on worker’sprimary occupation in year t.18 In total, we observe more than 5.5 million prime age workersemployed for a total of almost 800,000 firms. 33% of all workers are employed in firms with fewerthan 50 employees and we denote these firms as small.19 11% of the workforce is employed in youngfirms, i.e. firms with an age below five years.20 The average worker in our dataset is 38 years old.The fraction of workers above the age of 35 years is 57%. In addition, 61% of the workers have atleast a high school degree and 23% have a college degree or higher. Finally, 45% of the workforceare women.
17Due to restrictions to match the employee-employer and the credit registries, the analysis cannot be extendedthe analysis beyond 2013.
18If the worker has multiple occupations in year t, we define the primary occupation based on the years employedin the firm and the salary size.
19The 50-employee cut-off is consistent with the staff headcount definition of small and medium-sized enterprises(SMEs) in the European Union.
20Our age categorization is consistent with other papers in the literature (e.g., Haltiwanger et al. 2013; Babinaet al. 2019).
11

2 Redistributive Wage Effects
2.1 Empirical strategy
We start the analysis by studying the heterogeneous effects of monetary policy conditions on wagesacross different types of firms in the economy as summarized by the following regression:
log(wageHrw,f,t
)= αt + αw + αf + β(Rt−1 ×Hf ) + γ(Xt−1 ×Hf ) + ζCw,t−1 + εw,f,t. (1)
Our outcome variable is the log of the hourly wage of worker w in firm f in year t. In line withCard et al. (2015), we construct hourly wages by dividing the sum of a worker’s base salary plusearnings supplements by the hours worked.21 The lagged level of the interest rate (Rt−1) capturesmonetary policy conditions. Our baseline measure is the effective overnight reference rate (EONIA),as in Jimenez et al. (2014). The results are robust to alternative monetary policy measures, such asthe shadow rate by Wu and Xia (2016) and monetary policy surprises as constructed by Jarocinskiand Karadi (2020).22 Firm heterogeneity is denoted by Hf .23 The estimate of β on the interactionbetween the monetary policy rate and firm characteristics is our main coefficient of interest. Itmeasures by how much more wages for workers in firms of a certain type (Hf,t−1) react to monetaryrate changes compared to a reference group of workers. Next, we also control for the heterogeneouseffects on wages of the domestic business cycle and the global financial cycle. Specifically Xt−1
denotes the lagged real GDP growth for Portugal and the lagged log level of the U.S. VIX.24 Thissetting allows us to control for the heterogeneous firm effects driven by business cycle dynamics andfinancial distress, and to focus on the effects associated with monetary policy.25
Using the administrative employee-employer data, we follow workers over many years as theymove across different firms in the labor market to disentangle the permanent worker- and firm-component in wages using fixed effects. This modelling approach is consistent with the seminalframework proposed by Abowd et al. (1999). We progressively saturate our specification with fixed
21We focus on hourly instead of monthly wages to disentangle the impact of monetary policy directly on wagesfrom any potential effects triggered by adjustments in the working time. Our results are robust to the use of the logof monthly wages. Moreover, in Section 3 we also analyze hours worked and employment.
22The robustness results are reported in Section 7.23When applicable, we consider both a time-varying (Hf,t−1) and a time-invariant (Hf ) versions.24We also show robustness to the additional inclusion of euro area macro controls in Section 7. In line with the
standard Taylor (1993) rule logic, we include Eurozone GDP growth and inflation.25In Online Appendix Table A1, we present the results on the relationship between monetary policy, economic
conditions and wage dynamics in Portugal. In all specifications, the relationship of wages and the monetary policyrate is negative, whereas it is positive with the Portuguese GDP growth.
12

effects until we reach the benchmark specification (Equation 1). To absorb time variation as wellas the unobserved permanent worker and firm components of the individual’s annual wage, we usetime, firm and worker fixed effects denoted as αt, αw and αf , respectively. We also add controls forworker characteristics (Cw,t−1), namely a quadratic polynomial in worker age. We cluster standarderrors at the firm and worker level.
2.2 Results
In this section, we report the heterogeneous effect of monetary policy on worker wages across firms ofdifferent size and age. Our focus on these firm characteristics is motivated by theoretical literatureon the role of credit market frictions in the transmission of monetary policy (see e.g., Bernanke andGertler 1989; Kiyotaki and Moore 1997). Furthermore, previous empirical literature has documenteda stronger response to monetary policy shocks for small and young firms which are presumably morefinancially constrained (see e.g., Gertler and Gilchrist 1994; Kashyap et al. 1994; Cloyne et al. 2018;Bahaj et al. 2019).
Firm size. Table 2 Columns (1)–(4) present the estimates of Equation 1 where we interact themonetary policy rate with the firm size. A dummy variable SmallFirmf takes a value of 1 if thefirm has fewer than 50 employees, and 0 otherwise. We run several additional specifications withdifferent combinations of fixed effects to corroborate the robustness of our results. We start withthe empirical specification without any fixed effects (Column 1) and saturate it gradually with time,firm and worker fixed effects until we reach the baseline specification in Column (4) correspondingto Equation 1. We find that small firms increase wages by more than large firms following softermonetary policy conditions. The baseline estimate in Column (4) shows that a 1 percentage point(pp) decrease in the monetary policy rate is associated with a 1.16 pp stronger increase in wages ofworkers in small firms compared to large firms.26 Our results are robust to the coefficient stabilityand omitted variable bias test proposed by Oster (2019).27
The effect is quantitatively very similar also when we account for additional industry/regiontime-varying fixed effects (see Online Appendix Table A2 Columns (2)–(4)). The results are notdriven by the presence of micro firms in which all workers might have close ties to the owner and/or
26Column (1) reports a sanity check in the full sample without the use of any fixed effects. The estimates suggestthat following a monetary policy softening wages on average increase and the rise is larger for small firms. Whilethe magnitudes decrease by half after saturating the model with the relevant time, worker and firm fixed effects, theeffect on the wage dispersion between small and large firms continues to be economically and statistically significant.
27We compute lower bound of the size estimate using the coefficients and R-squared in Columns (1) and (4), δ = 0and max R2 of 1. Later, in the analysis we also perform the robustness test for firm age using Columns (5) and (8).In both cases, we find that the calculated lower bounds are close to the estimated coefficients and satisfy the Oster(2019) test.
13

mobility patters could substantially differ. Following Andrews et al. (2008), we eliminate firms atbottom 10th and 25th percentile and we find that these estimates are consistent with the resultsreported in the main sample (see Online Appendix Table A3).
Figure 1 Panel (a) shows the effect of monetary policy conditions on log hourly worker wagesfor each quintile of firm size. Each point represents the coefficient estimate for each bin (quintile) offirm size interacted with the monetary policy. We omit the top quintile (80-100 percentile) which weuse as a reference category. Consistent with the results in Table 2, workers in the bottom quintileof the firm size distribution (smallest firms) benefit the most from monetary policy softening. Inaddition, the effects appear to be markedly linear in firm size – the workers in the smallest firmsbenefit the most and the effect progressively decreases in firm size.
Our findings relate to the large literature showing that smaller firms are more exposed to thepropagation of the monetary policy (e.g., Gertler and Gilchrist 1994; Kashyap et al. 1994; Cloyneet al. 2018). This result has often been interpreted as supporting evidence on the importance ofthe credit channel. We explore these implications more formally in Section 5. More broadly, smallfirms are also found to be more vulnerable to credit supply shocks (see e.g., Khwaja and Mian 2008;Chodorow-Reich 2014; Greenstone et al. forthcoming).
Firm age. Table 2 Columns (5)–(8) show that following a monetary policy softening, youngfirms increase wages by more than old firms. Using Equation 1, we interact the monetary policyrate with a dummy variable YoungFirmf,t−1 that takes value of 1 if the firm is younger than fiveyears, and 0 otherwise. The baseline estimate in Column (8) show that a 1 pp reduction in themonetary policy rate is associated with an approximately 0.4 pp larger increase in wages for workersin young firms compared to workers in old firms. This relationship does not attenuate when weintroduce additional time-varying region and/or industry fixed effects (see Online Appendix TableA2 Columns (5)–(7)).
Figure 1 Panel (b) illustrates the heterogeneous effects of monetary policy conditions for workersby quintiles of firm age. We show that the effect is the largest for the workers in the youngest firms(bottom quintile). In addition, the effect of monetary policy on wages for the two lowest quantities(p0–p20 and p20–p40) is statically significantly different from the estimates for workers in the oldestfirms (our reference group). Our results complement recent papers on the effects of monetary policyon labor market outcomes at the firm level. In particular, Bahaj et al. (2019) show that young firmsare more sensitive to monetary policy and react more in terms of firm-level employment. We showthat workers in young firms are also more strongly effected in terms of wages.
Finally, in Online Appendix Table A2, we show that both the firm size and the age marginare economically relevant. In Column (1), we horse-race the effects of monetary policy interacted
14

with small firms and young firms respectively and find that both estimates remain negative andstatistically significant.
Existing literature has highlighted that workers in small or young firms tend to earn lowerwages (see e.g., Brown and Medoff 1989; Oi and Idson 1999). In Appendix Table A4, we computethe wage gaps by comparing wages of workers in the same region, industry and job title acrosssmall/large and young/old firms. We find that the wage differential is around 23% for small vs.large firms, 9% for young vs. old firms. Taken together, our findings highlight that softer monetarypolicy contributes to a decrease in the wage dispersion across firms in the economy. In terms ofmagnitudes, a 1 pp decrease in the monetary policy rate reduces the wage gap between small andlarge firms by approximately 5%, and between young and old firms by 4.4%. In Figure 1 Panel (c),we further corroborate this finding by splitting firms into qualities according to their position in thewage distribution in year t − 1. We find that following a monetary policy softening, the wages ofworkers in low-wage firms increase more than the wages of workers in high-wage firms. Therefore,our results highlight that softer monetary policy reduces income inequality between firms.
Persistence. Finally, in Appendix Table A5 we show that the heterogeneous firm size and ageeffects of monetary policy on wages are persistent over time. We find that softer monetary policyconditions increase wages more in small and young firms not only in the following year but also inthe subsequent three years. While the magnitude of the effects decreases after the first year, theeffects remains stable, economically and statistically significant at least for the next three years.
2.3 Back-loaded wage mechanism
Our findings highlight that workers in small and young firms benefit more from a decrease in themonetary policy rate. This suggests that softer monetary policy narrows the wage gap across firmsin the economy. In light of these findings a question naturally emerges: Why do workers in smalland young firms benefit more?
A large body of the labor literature has provided ample evidence that young and small firmstend to offer lower wages to their workers and the wage differential is mainly associated with firms’financial constraints. Michelacci and Quadrini (2009) and Guiso et al. (2013) show that financiallyconstrained firms tend to offer back-loaded wages. In particular, Michelacci and Quadrini (2009)develop a labor market equilibrium model which documents that financially constrained firms offeran increasing wage profile, i.e. they pay (below frictionless market) entry wages with a promise ofa steeper wage profile in the future once the firms become unconstrained. The mechanism has alsobeen empirically examined by Guiso et al. (2013) who exploit the heterogeneity in credit market
15

developments across Italian provinces and show that firms operating in less developed local marketsimplicitly borrow from their workers by paying back-loaded entry wages but offer a faster wagegrowth as the local credit markets converge. Recently, Howell and Brown (2020) also documentthe importance of the back-loaded wage mechanism across small high-tech firms in the US whichreceive a sudden positive cash flow shock by winning R&D grants. According to this mechanism, asoftening in monetary policy conditions should benefit the most the incumbent workers in financiallyconstrained firms whose wages were originally back-loaded.
In Table 3 we explore how small vs. large firms share rents with their workers following amonetary policy softening. We show that stayers in small firms drive the aggregate effects andbenefit the most from an accommodative monetary policy. This holds for the baseline specificationcontrolling for worker, firm and time fixed effects in Column (1), as well as for the within-firmanalysis using firm-time fixed effects in Column (2). In Columns (3) and (4), we compare the wagedynamics of stayers and new hires in the sample of large firms and we find the opposite (positive)effect in favor of new hires. Finally, Columns (5) and (6) present the analysis for the entire universeof all firms in Portugal. Column (5) shows that while on average, all workers in small firms gaindisproportionately more than workers in large firms, stayers in small firms are by and large the mainbeneficiaries of a monetary policy softening. The positive effect for stayers in small firms remainsstrong also when we introduce firm-time fixed effects in Column (6).
Overall, these results lend support to the back-loaded wage contract mechanism. As small firmstend to be more financially constrained, they offer lower entry wages. Softer monetary policy leadsto a relaxation of financial constraints and enables small firms to increase the wage profile forexisting workers whose wages were previously back-loaded.28 As a result, softer monetary policynarrows the wage differential across workers in small and large firms in the economy and narrowsdown the between firm inequality.
3 Redistributive Employment Effects and Hours Worked
So far, we have showed that softer monetary policy conditions reduce workers wage differentialsacross firms and workers in the economy. In this section, we investigate the redistributive effects ofmonetary policy across different types of firms with a focus on employment and hours worked.
28In Section 5, we provide additional evidence of firm financial constraint by means of a credit registry analysisand explore its relation to firm size.
16

3.1 Empirical strategy
First, we analyze the heterogeneous effect of monetary policy on workers’ total hours worked byestimating the following regression:
log (1 + HrsWorkedw,f,t) = αt + αw + αf + β(Rt−1 ×Hf ) + γ(Xt−1 ×Hf ) + ζCw,t−1 + εw,f,t. (2)
Our outcome variable is total hours worked by worker w in firm f in year t. Equation 2 tracksthe hours worked of individuals as they move over time across different firms. This allow us todisentangle hours worked into a firm and a worker component. Total hours worked takes the value0 if the worker is unemployed, and the reported hours worked if the worker is employed.29 The restof the coefficients in Equation 2 are consistent with the wage analysis (see Equation 1 in Section2). The standard errors are two-way clustered at the firm and worker level.
Second, we focus on employment at the firm level. We analyze heterogeneity in the employmenteffects of different types of firms in response to softer monetary policy using the following set-up:
log(Employmentf,t
)= αt + αf + β(Rt−1 ×Hf ) + γ(Xt−1 ×Hf ) + εf,t, (3)
where log(Employmentf,t
)denotes log of the number of workers employed in firm f at time
t. As in our previous analysis, Rt−1 captures monetary policy conditions and Hf denotes firmscharacteristics. The estimate of β on the interaction between the monetary policy rate and firms’characteristics is our main coefficient of interest. We further saturate the specification with firmand year fixed effects. The standard errors are clustered at the firm level.
3.2 Results
Table 4 presents the results of the interaction of the monetary policy rate with the firm size andage. Columns (1) and (2) report the effects for worker-level hours worked following Equation 2. Amonetary policy softening implies a larger increase in hours worked for workers in small (young)
29For employed workers, the estimation is straightforward as we observe firm characteristics and firm identity toimplement firm fixed effects. For unemployed workers, we impute firm observables and firm fixed effects as follows.If the worker is unemployed only for one period, we assign hours worked to 0 and use the information on worker’slast employer to impute her firm fixed effects and firm observables. If the worker is unemployed for two periods,we follow the same procedure for the first year of unemployment. For the second year of unemployment, we assignhours worked to 0 and we match the worker with the next firm that hires her in the subsequent period to imputefirm fixed effects and firm observables. Finally, if the worker is unemployed for three or more periods, we impute firmcharacteristics for the first and the last year as above and we exclude the remaining middle periods.
17
firms compared to large (old) firms. In Columns (3) and (4), we report the effects on firm-levelemployment following the specification in Equation 3. A 1 pp decrease in the monetary policy rateis associated with a 1.05 pp stronger increase in employment in small firms compared to large firms,and a 2.11 pp stronger increase in employment in young firms compared to old firms. In Column(5) and (6), we introduce additional time-varying industry and region fixed effects and find similar(slightly larger) coefficients.
4 Capital-Skill Complementarity
Our findings on firm heterogeneity highlight that workers in low-wage (small and young) firmsbenefit the most from a monetary policy softening. In this section, we investigate the effects ofmonetary policy on worker-level heterogeneity based on high- vs. low- skilled workers. The focus onthe skill premium is motivated by the large body of labor literature that has investigated the linkbetween educational attainment (skill) and labor market outcomes (e.g., Autor et al. 2008; Card2001; Mincer et al. 1974) and the importance of the capital-skill complementarity (e.g., Acemoglu1998; Krusell et al. 2000). Recently, the finance literature has also documented the effects of financialfriction on firm-level employment (Berton et al. 2018), and labor and capital reallocation (Bai et al.2018; Fonseca and Van Doornik 2021). In what follows, we contribute to the above literature byanalyzing the interaction of monetary policy, firm financial frictions and the worker skill premium.
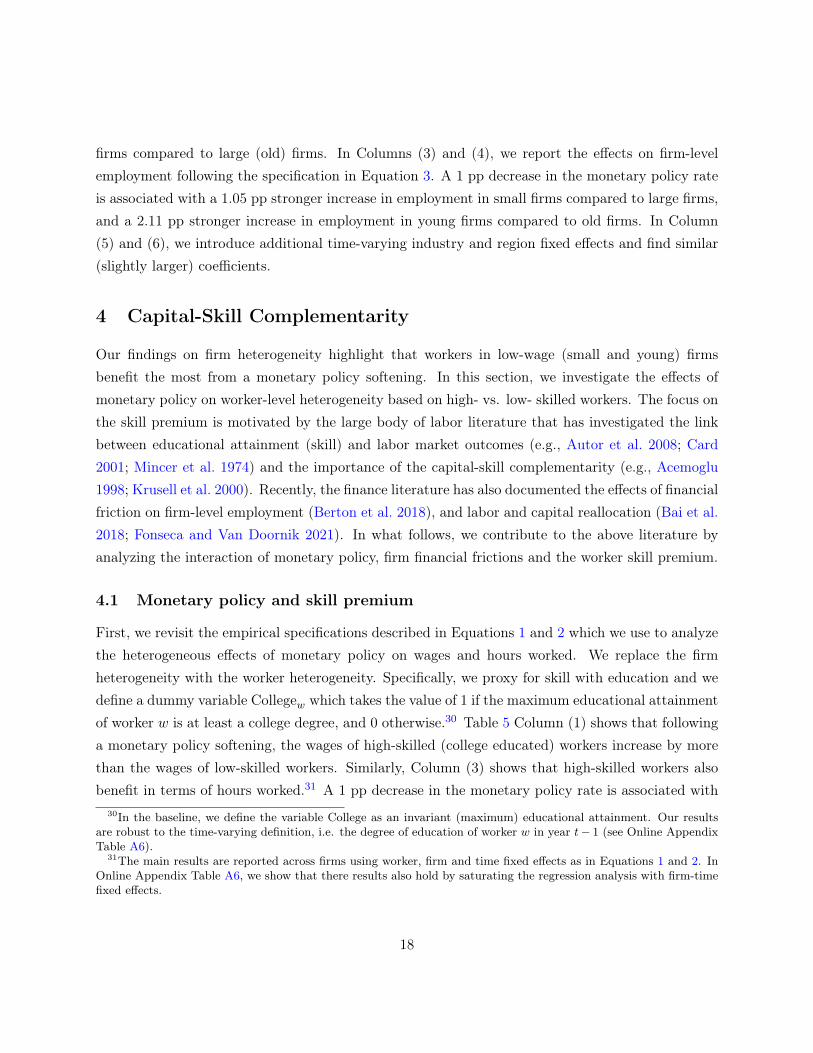
4.1 Monetary policy and skill premium
First, we revisit the empirical specifications described in Equations 1 and 2 which we use to analyzethe heterogeneous effects of monetary policy on wages and hours worked. We replace the firmheterogeneity with the worker heterogeneity. Specifically, we proxy for skill with education and wedefine a dummy variable Collegew which takes the value of 1 if the maximum educational attainmentof worker w is at least a college degree, and 0 otherwise.30 Table 5 Column (1) shows that followinga monetary policy softening, the wages of high-skilled (college educated) workers increase by morethan the wages of low-skilled workers. Similarly, Column (3) shows that high-skilled workers alsobenefit in terms of hours worked.31 A 1 pp decrease in the monetary policy rate is associated with
30In the baseline, we define the variable College as an invariant (maximum) educational attainment. Our resultsare robust to the time-varying definition, i.e. the degree of education of worker w in year t− 1 (see Online AppendixTable A6).
31The main results are reported across firms using worker, firm and time fixed effects as in Equations 1 and 2. InOnline Appendix Table A6, we show that there results also hold by saturating the regression analysis with firm-timefixed effects.
18

a 1.14 pp larger increase in wages and 2.7 pp larger increase in hours worked.The richness of our administrative employee-employer data allows to further differentiate the
skill premium across workers. While college graduates might on average have higher skills, newtechnologies might be more complementary to specific fields and workers performing non-routinecognitive tasks (Acemoglu and Autor 2011; Fonseca and Van Doornik 2021). To this end, wedifferentiate the educational attainment into the college degree obtained in the STEM fields orother (non-STEM) fields.32 The results are reported in Columns (2) and (4) of Table 5. We findthat while monetary policy exacerbates the effect college premium for all high-skilled workers, thebenefit is concentrated in the wages and hours worked of STEM-degree high-skilled workers.
4.2 Firm heterogeneity and capital-skill complementarity
How is the rise in skill premium related to firm heterogeneity? In Figure 2, we report the estimatesof the interaction of firm size and worker skill premium. We examine the heterogeneous effects ofmonetary policy on hours worked using the college educated workers in large firms as a referencecategory. We find that while college premium rises both in large and small firms, the effect onhours worked is most pronounced for high-skilled workers in small firms. This is consistent with ourfindings in Section 3 which highlight a stronger employment response to monetary policy for smallfirms. In fact, the estimates in Figure 2 show that both high- and low- skilled workers in small firmsbenefit more than the reference category while low-skilled workers in large firms benefit the least.Furthermore, as high-skilled (high-wage) workers tend to be mostly employed by large (high-wage)firms (Engbom and Moser 2017), a monetary policy softening is associated with a labor reallocationof skilled workforce towards smaller firms.
In Table 6, we focus on the final missing piece of the capital-skill complementarity: the effectof monetary policy on firm capital investment. Using firm balance sheet data, we construct theoutcome variable as the year-on-year change in capital scaled to the lagged value of firm’s totalassets. In line with the previous analysis, we explore the heterogeneous effect of monetary policyby firm size and age and find that expansionary monetary policy is also associated with a strongerincrease in investment in small and young firms.
Overall, we provide new evidence on the effects of monetary policy on capital-skill complementarityat the most granular firm- and worker-level. Our findings relate to Dolado et al. (2021) who usingaggregate and industry level document that a monetary policy easing exacerbates labor incomeinequality between high- and low-skilled workers, and that the increase in high-skill employment
32We denote as STEM the degrees in Natural Sciences, Technology, Engineering, Economics and Math. Our resultsare robust to the exclusion of the Economics/Business degrees.
19

encourages capital investment. Our results stress the importance of the firm identity on inequality(see e.g., Card et al. 2013; Song et al. 2018). In particular, we show that the redistributive effectsof monetary policy are primarily driven by small and young firms. Following a monetary policysoftening, small and young firms are able to disproportionately increase their capital investment aswell as wages and hours worked of their high-skilled workers. Furthermore, in the next section wedirectly connect our evidence to the credit channel, and show that credit plays a critical role in thetransmission of monetary policy towards small and young firms and it affects the dispersion of thelabor market outcomes of workers.
5 Credit Channel
In the previous sections, we have shown that following a monetary policy softening, labor marketoutcomes of workers employed in smaller and younger firms improve more than in larger and olderfirms. A natural next step is to examine the channel through which monetary policy changesheterogeneously affect wages and employment across firms in the economy. Guided by the largebody of literature that emphasizes the crucial role played by financial frictions for small firms, weinvestigate the importance of the credit channel. Balance sheet positions and credit frictions arekey elements in the heterogeneous transmission of monetary policy across firms and banks (e.g.,Gertler and Gilchrist 1994; Kashyap and Stein 2000; Jimenez et al. 2012; Drechsler et al. 2017).Furthermore, financial market imperfections contribute to shape wage contracts (e.g., Michelacci andQuadrini 2009; Guiso et al. 2013). Still, the literature is lacking a systematic empirical investigationof the importance of the effects of the credit channel for the transmission of monetary policy toworker-level labor market outcomes.
In this section, we exploit a novel dataset which links the employee-employer and credit registriesto investigate the role of credit in the transmission mechanism of monetary policy to worker-levelwages and hours worked and firm-level employment. We examine the effect of the firm balance-sheetand bank lending channels and show that both versions of the credit channel play a important rolein explaining the redistribute labor income effects of monetary policy.
We start by showing the overall importance of bank credit. To this purpose, we augmentEquation 1 with a triple interaction of monetary policy, firm heterogeneity (size or age) and variablecapturing the importance of bank credit at the firm level. We measure the latter in two ways. First,since not all firms in Portugal have active bank borrowing relationship, we compare the labormarket outcomes for workers in small (young) firm with and without bank credit. To this end,we define a dummy variable ExistCreditf,t−1 that takes the value of 1 if the firm had an existing
20

bank borrowing relationship in previous periods, and 0 otherwise. Second, we turn to the use ofa continuous variable - leverage - which is a commonly used as an empirical proxy to measurefinancial conditions (e.g., Ippolito et al. 2018; Ottonello and Winberry 2020). Leveragef,t−1 denotesthe leverage ratio computed as a share of firm’s bank debt to total assets in time t− 1.33
Table 7 reports the results. The estimates in Column (1) show that the wage effects for workersin small firms is fully driven by firms with existing bank borrowing relationship. Instead, thecoefficient estimate for small firms without bank credit has the opposite (positive) sign and it isnot statistically significant. In Column (2), we replace the categorical variable with a continuousmeasure of firm leverage and we find stronger response for workers in small firms especially if thesefirms are highly levered. Following the same approach, we repeat the estimation for young vs. oldfirms and we report consistent results in Columns (3) and (4).
5.1 Firm balance-sheet channel
In this section, we study the role of the firm balance-sheet channel by proposing a novel, agnosticapproach that allows us to compute the sensitivity of the individual firm credit to monetary policy.According the the firm-balance sheet channel, softer monetary policy increases firms’ asset valueand net worth, and thus extends firms’ capacity to raise external funds (Bernanke and Gertler1995). If this channel is also associated with the redistributive labor market effects, monetary policyshould propagate more strongly to wages and hours worked in firms with higher credit sensitivityto monetary policy. To test this hypothesis, we a strategy that does not require to take an explicitstance regarding which firm characteristics are the main drivers of the firm heterogeneous responsesto monetary policy.
Our methodology consists of two steps. First, we use loan-level credit data to estimate thefollowing regression:
log(creditf,b,t) = κb,t + κs,r,t + βfRt−1 + γfXt−1 + εf,b,t, (4)
where the outcome variable log(creditf,b,t) denotes the log level of total credit that firm f borrowsfrom bank b at time (quarter) t. Our main coefficient of interest βf denotes the firm-level creditsensitivity to monetary policy in an agnostic manner. That is, using loan-level credit data, weestimate the sensitivity for each firm to monetary policy without taking a stance on which observable
33While in most cases the two measures capture a previous firm reliance on bank credit in a consistent way(ExistCreditf,t−1 as a dummy and Leveragef,t−1 as a continuous variable), some differences might occur. Namely, ifa firm reports a previous bank borrowing relationship but it was fully repaid by t− 1, the value of 1 while would beassigned to ExistCreditf,t−1 while the variable Leveragef,t−1 would not signal any credit outstanding.
21

firm characteristics are the main drivers of the transmission mechanism. Given that a decrease ininterest rates on average leads to an increase in credit available to a firm, a more negative βf isassociated with a stronger sensitivity of firm level credit to monetary policy. In the rest of the creditanalysis, we use this estimated firm-level credit sensitivity to monetary policy as a proxy for thefirm-balance sheet channel and we denote it as FBCf .
Estimating the effect of monetary policy through the credit transmission mechanism poses twoimportant identification challenges. First, in addition to the firm-level credit sensitivity, individualfirms are connected to different banks which can respond heterogeneously to monetary policy interms of their credit supply effects. For instance, an ample body of the bank-lending channelliterature has shown that banks with worse balance sheet health (Bernanke and Blinder 1988;Jimenez et al. 2012; Amiti and Weinstein 2018) or less liquid banks (Kashyap and Stein 2000) tendto be have more sensitive credit supply response to monetary policy. In Equation 4, we addressthis concern by introducing bank-firm fixed effects (κb,t) to control for the time-varying bank-levelcredit supply.
Second, in addition to monetary policy, firm-level credit sensitivity can also be driven by otherfirm, industry or region specific changes that could confound the results. We address this concernin a number of ways. In the baseline specification (Equation 4), we saturate our model withindustry-region-time fixed effects (κs,r,t) to control for any heterogeneity at the industry-region-time including changes in the firm demand for credit which could be triggered by local and industrytime-varying conditions. As detailed in Online Appendix B, we show that our results are also robustto alternative specifications in which we control for time-varying demand shocks by first estimatingthe credit sensitivity to monetary policy for the bank-firm loan pair and then aggregating it on thefirm level.
We estimate Equation 4 using quarterly credit registry data for Portuguese firms for the 1999–2013 period. In order to provide systematic evidence for the external validity of our measure offirm-level credit sensitivity to monetary policy, we investigate whether our agnostic FBCf measureis consistent with commonly used proxy measures of the firm balance-sheet channel such as firmsize or age (see e.g., Cloyne et al. 2018). According to the existing literature, smaller and youngerfirms tend to be more financially constrained, and consequently benefit more from softer monetarypolicy. Table 8 summarizes the results of the range of univariate and multivariate regressions whichexamine the relationship between FBCf and firm size or/and age. We find that our agnostic firm-level credit sensitivity to the monetary policy rate is correlated with the proxies previously used bythe literature. Specifically, younger and smaller firms exhibit stronger sensitivity of their credit tomonetary policy (i.e., more negative FBCf ).
22

These results further corroborate the importance of the back-loaded wage mechanism highlightedin Section 2.3. In particular, we show that small and young firms tend to offer back-loaded wages totheir workers and softer monetary policy conditions allow these firms to increase wages by more, thusnarrowing the wage dispersion across firms. The matched employee-employer and credit registrydata allow us to further elaborate on the actual credit sensitivity of firms to monetary policy. Thesefindings also support the capital-skill complementarity mechanism by showing that in responseto softer monetary policy, financially constrained firms increase both physical and human capitalinvestment.
While we validate that this agnostic measure of firm-level credit sensitivity to monetary policyrelates to more explicit proxies (size, age), our proposed measure offers a novel and flexible approachto examine the heterogeneous effects of monetary policy without having access to or taking an ex-ante stance on the role of specific firm-level observables as main drivers of such heterogeneity. Asa result, we use the estimate of the agnostic firm-level credit sensitivity to monetary policy as asource of heterogeneity in the labor market regressions:
yw,f,t = αt + αw + αf + θ(Rt−1 × FBCf ) + γ(Xt−1 × FBCf ) + ζCw,t−1 + εw,f,t. (5)
If the firm balance-sheet transmission mechanism is at work in shaping the labor market outcomes,we should expect that wages, hours worked or employment of workers associated with firms witha stronger sensitivity of their credit to monetary policy (low FBCf firms) would increase by morecompared to workers associated with firms with a weaker sensitivity (high FBCf firms). Hence, wewould expect the coefficient θ to be positive and statistically significant.
5.2 Bank lending channel
The empirical banking literature has extensively shown that contractionary monetary policy reducesbank credit supply and has negative effects on firm credit and real economic activity (Bernankeand Blinder 1992; Kashyap and Stein 2000; Jimenez et al. 2012). In this section, we present themethodology that we use to test the hypothesis that monetary policy propagates more stronglyto workers’ wages in firms borrowing from banks with worse balance sheet health (Bernanke andGertler 1995; Ashcraft 2005; Jimenez et al. 2012; Amiti and Weinstein 2018) and lower liquid assetsholdings (Kashyap and Stein 2000).
First, we match the credit registry and bank balance sheet data and construct two measures ofstrength of the bank lending channel: (i) bank health and (ii) bank liquidity. Similarly to Amiti andWeinstein (2018), we use loan-level credit data to estimate bank credit supply shocks as a measure
23

of bank health and financial constraint. Formally, we decompose the credit of an individual firm f
with a bank b at time t into the time-varying firm shocks and bank shocks:34
log(creditf,b,t) = αb,t + αf,t + εf,b,t, (6)
where αb,t denotes bank health (captured with bank-time fixed effects). For bank liquidity, weconstruct LiqAssb,t as a ratio of the sum of all bank liquid assets (i.e., cash holdings, bond holdingsand short-term loans to other monetary financial institutions) to total assets following Kashyap andStein (2000).
Second, we compute the firm-level exposure to the bank lending channel (BLCf,t) as the laggedcredit weighted average of a bank-level measure of the bank lending channel. Formally, we define itas
BLCf,t =∑b
BLCb,t × Creditb,f,t−1,
where BLCb,t ∈ {Healthb,t, LiqAssb,t} represents one of the proxies for bank lending channel.
Finally, we plug our measures of firm exposure to the bank lending channel (BLCf,t−1) into theworker-level labor market regressions as the key source of heterogeneity:
yw,f,t = αt + αw + αf + ϑ(Rt−1 ×BLCf,t−1) + γ(Xt−1 ×BLCf,t−1) + ζCw,t−1 + εw,f,t. (7)
If the bank lending channel is at work, we would expect wages, hours worked and employmentof workers in firms borrowing from banks with more financially constrained banks increase by morein response to softer monetary policy conditions. Consequently, the estimate of ϑ would be positiveand statistically significant.
5.3 Results
In this section, we present the results of the analysis on the credit channel of monetary policy ona range on labor market outcomes. Table 9 summarizes the effect on worker-level wages. Column(1) reports the estimates for the firm-balance sheet channel. Consistent with our hypothesis, wefind that following a decrease in the monetary policy rate, wages of workers in firms with strongercredit sensitivity to monetary policy increase by more compared to firms with a weaker creditsensitivity. Columns (2) and (3) present the results for the bank lending channel using bank health
34This analysis is similar in spirit to Amiti and Weinstein (2018). Given that our labor market analysis is performedon levels, we also estimate bank-supply shocks using credit levels rather that credit differences.
24

and liquidity, respectively. We find that firms borrowing from more financially constrained bankspropagate monetary policy changes to wages more strongly.
In Table 10, we examine the effect on the credit channel on worker-level hours worked and firm-level employment. Similarly to the wage analysis, we report positive and statistically significantcoefficients across all specifications. This suggests that the credit channel plays an important rolein the transmission of monetary policy also in the extensive margin, using employment and hoursworked.
Our findings relate to the long standing empirical macroeconomic literature that studies theimportance of the firms’ balance sheet strength as a mechanism through which monetary policyinteracts with credit market imperfections and affect firms’ outcomes (e.g, Gertler and Gilchrist1994; Bernanke and Gertler 1995). Our results confirm that firms more reliant on banks as theirprimary source of funding are more responsive to monetary policy. Furthermore, we uncover theimportance of this channel for the previously undocumented redistributive effects of monetary policyon labor market outcomes.
As a final step, we include both the firm balance-sheet and the bank lending channel in the sameregression. Hence, we augment the worker-level wage regression (Equation 5) to simultaneouslyinclude our agnostic measure of firm balance-sheet channel and one of the two proxies of the banklending channel. In addition, we also horse-race the two versions of the proxy for the bank-lendingchannel, i.e. we use both bank health and bank liquidity measure in the same regression. Finally,we run a regression which include all three measures. The results are presented in Online AppendixTable B2. We find that all proxies for the credit channel continue to be statistically and economicallysignificant. Hence, our findings demonstrate that the credit channels captured by our proxiescomplement one another in the heterogeneous transmission of monetary policy to wages acrossfirms in the economy.
6 Monetary policy in crisis times
So far, we have discussed the average effects of monetary policy on labor income redistribution. Inthis section, we explore whether the impact of monetary policy on wages also depends on the stateof the economy. In particular, we analyze to what extend a monetary policy softening affects laborincome inequality differently in good times and in times of crisis, i.e. when financial frictions aremore pronounced.
In Table 11, we revisit our main findings and augment the analysis by introducing a tripleinteraction term of monetary policy, firm heterogeneity and the state of the economy. For simplicity,
25

we measure the state of the economy with domestic GDP growth.35 Columns (1)–(4) focus on thewage effects. The estimates suggest that workers in constrained firms benefit more from softermonetary policy conditions especially in times of crisis when firms face more severe financialconstraints. In Columns (1) and (2), we proxy firm financial constraints by size and age. Inboth cases we find that workers in small and young firms benefit more from softer monetary policyand these effects are amplified in periods of low GDP growth (positive triple interaction term).In Column (3), we use our agnostic measure of the firm balance-sheet channel. We find that thebenefit of softer monetary policy for workers in firms with higher credit sensitivity are substantiallylarger in crisis times. In Column (4), we further show that the effects propagated through the banklending channel are also stronger in times of crisis. Columns (5)–(8) find similar results using thehours worked as an outcome variable.
Overall, our results demonstrate that the effects of monetary policy through the credit channelare 2–3.5 times stronger in crisis periods compared to normal times.36 We provide evidence insupport of the effectiveness of monetary policy in alleviating bank and firm constraints especiallywhen they are most needed, i.e. in crisis periods, contributing to labor income redistribution viaboth hourly wages and hours worked.
Our findings contribute to the recent and growing literature on the effects of monetary policy onfirm-level outcomes (e.g., Bahaj et al. 2019; Cloyne et al. 2018) by showing important heterogeneouseffects of monetary policy changes on worker-level wages and hours worked though the credit channel.In addition, we also complement recent work that documents positive firm-level employment effectsof monetary policy though the bank lending channel (see e.g., Luck and Zimmermann 2020; Jasovaet al. 2021), by showing that the same channel is also important for the transmission of a monetarypolicy to labor income inequality across workers in the economy. Finally, we provide novel evidenceon the state-dependent effects of the credit channel of the transmission of monetary policy to laborincome.
7 Robustness to alternative monetary policy measures
In what follows we show that our results are robust to the use of different measures of monetarypolicy conditions. To this end, we re-estimate both the wage and hours worked analyses and reportthe results for the wage heterogeneity in the Online Appendix Table C1 and for the credit channel
35Our results are robust to alternative proxies such as a crisis dummy.36Crisis times are defined as periods of GDP growth of -2.0% which is the average GDP growth in the 2008–2009
and 2011–2013 periods. The average GDP growth in normal times is about 1.8% and covers the 1999–2007 periodand year 2010. In the latter year, GDP growth was about 1.9%.
26

in the Online Appendix Table C2.First, we augment our baseline specifications with additional macroeconomic controls for the
euro area. The macroeconomic literature largely summarizes the conduct of monetary policy withthe Taylor rule, according to which the policy interest rate is set as a function of contemporaneousdeviations in inflation and activity (see e.g., Christiano et al. 1999). In line with the standard Taylor(1993) rule logic, we complement the baseline macro controls (GDP growth in Portugal and VIX)with additional terms and interact the firm heterogeneity with the lagged values of euro area GDPgrowth and inflation, respectively.
Second, to take into account the overall stance of monetary policy beyond what is strictlyobserved through the change in policy interest rates, we use the euro area shadow rate computedby Wu and Xia (2016). The shadow rate is a measure of monetary policy conditions that alsosummarizes the use of unconventional policy measures. Thus, unlike the observed overnight interbankinterest rate (EONIA), it also accounts for additional monetary expansions associated with forinstance fixed-rate full allotment, LTRO liquidity operations or the announcement of OutrightMonetary Transactions.37
Third, we connect to the growing literature on monetary policy surprises (Gertler and Karadi2015; Nakamura and Steinsson 2018; Jarocinski and Karadi 2020). Specifically, we use the index ofmonetary policy surprises computed by Jarocinski and Karadi (2020). We aggregate the surprises atthe yearly level (by summing them) as in Ottonello andWinberry (2020). The use of monetary policysurprises allows us to further mitigate the remaining potential endogeneity concerns discussed inSection 1. It is important to highlight while the onset of the Sovereign Debt Crisis could potentiallyimpact the endogeneity in the final two years of our sample (2010–2013). In fact, the ECB raisedmonetary rates in 2011 when Portugal was in the middle of an economic and financial downturnand did not introduce quantitative easing. To summarize, Online Appendix Tables C1 and C2report that all our key findings are robust to the use of additional macro controls, shadow rates orunexpected monetary policy surprises.38
37It is important to note that the most important unconventional monetary policy measures (negative rates andquantitative easing) did not occur during our sample period 1999–2013. The ECB reduced the deposit facility rateinto negative territory for the first time only in June 2014 and it launched expanded asset purchase program only inMarch 2015.
38The baseline results estimates have similar magnitudes to specifications using additional Taylor-rule macrocontrols and shadow rates. By construction monetary policy surprises have smaller values and as a result the reportedestimates are by a magnitude larger. In terms of standard deviations, all effects are quantitatively similar.
27
8 Conclusion
We analyze how monetary policy affects labor income redistribution across both workers and firmsvia the credit channel. We show that a monetary policy softening is associated with improved labormarket outcomes and higher capital investment, especially in small and young firms. By relaxingfinancial constraints, softer monetary policy allows these types of firms to increase the wage profileof their incumbent workers, as consistent with the back-loaded mechanism. Hence, since small andyoung firms tend to offer lower wages, softer monetary policy narrows the wage differential betweenfirms in the economy. In addition, small and young firms are able to increase their investment inboth physical capital and human capital, in line with the capital-skill complementarity mechanism.
We find that monetary policy is associated with strong effects only for small and young firmswith existing borrowing relationships. By exploiting the richness of the credit registry data, weshow the key role of the credit channel for the heterogeneous effects of monetary policy on labormarket outcomes. To analyze the importance of the firm balance-sheet channel, we develop a novelapproach that estimates the firm-level credit sensitivity to monetary policy. Further, we show thatthe bank-lending channel is also relevant for the redistributive effects of monetary policy.
Our paper has several important implications. We show that the redistributive effects ofmonetary policy are mainly driven by small and young firms. Our results suggest that the back-loaded wage mechanism (e.g., Michelacci and Quadrini 2009; Guiso et al. 2013) is also at work inresponse to a monetary policy softening, as well as the capital-skill complementarity mechanism(e.g., Krusell et al. 2000). By showing that firm and bank financial constraints play a critical rolefor the redistributive effects of monetary policy, and especially so in crisis times, we also uncovernew insights into the importance of the credit channel.
Our findings also have relevant implications for the growing heterogeneous agent literature(e.g., Auclert 2019; Kaplan et al. 2018). We show the importance of the heterogeneous effectsof monetary policy on labor market outcomes and the central role played by the credit channel.By highlighting the critical role of firms and workers characteristics for the redistributive effectsof monetary policy on labor market outcomes, our empirical evidence suggests that heterogeneousagents models should not neglect the impact of monetary policy across both workers and firms whenstudying the redistributive effects of monetary policy. Our results also advocate that the modellingof firm and bank financial constraints is vital to understand the heterogenous effects of monetarypolicy on labor market outcomes. Furthermore, our paper increases awareness of the key margins ofthe distributional consequences of central banking actions and are thus, informative for the futureconduct of monetary policy.
28

References
Abowd, John, Francis Kramarz, and David Margolis, 1999, High wage workers and high wage firms,Econometrica 67, 251–334.
Acemoglu, Daron, 1998, Why do new technologies complement skills? Directed technical changeand wage inequality, The Quarterly Journal of Economics 113, 1055–1089.
Acemoglu, Daron, and David Autor, 2011, Skills, tasks and technologies: Implications foremployment and earnings, in Handbook of Labor Economics, volume 4, 1043–1171 (Elsevier).
Alvarez, Jorge, Felipe Benguria, Niklas Engbom, and Christian Moser, 2018, Firms and the declinein earnings inequality in Brazil, American Economic Journal: Macroeconomics 10, 149–89.
Amiti, Mary, and David E. Weinstein, 2018, How much do idiosyncratic bank shocks affectinvestment? Evidence from matched bank-firm loan data, Journal of Political Economy 126,525–587.
Andersen, Asger Lau, Niels Johannesen, Mia Jørgensen, and José-Luis Peydró, 2021, Monetarypolicy and inequality.
Andrews, Martyn J, Len Gill, Thorsten Schank, and Richard Upward, 2008, High wage workers andlow wage firms: Negative assortative matching or limited mobility bias?, Journal of the RoyalStatistical Society: Series A (Statistics in Society) 171, 673–697.
Ashcraft, Adam B., 2005, Are banks really special? New evidence from the FDIC-induced failureof healthy banks, American Economic Review 95, 1712–1730.
Auclert, Adrien, 2019, Monetary policy and the redistribution channel, American Economic Review109, 2333–67.
Autor, David H, Lawrence F Katz, and Melissa S Kearney, 2008, Trends in US wage inequality:Revising the revisionists, The Review of Economics and Statistics 90, 300–323.
Babina, Tania, Wenting Ma, Christian Moser, Paige Ouimet, Rebecca Zarutskie, et al., 2019, Pay,employment, and dynamics of young firms.
Bahaj, Saleem, Gabor Pinter, Angus Foulis, and Paolo Surico, 2019, Employment and the collateralchannel of monetary policy.
29

Bai, John, Daniel Carvalho, and Gordon M Phillips, 2018, The impact of bank credit on laborreallocation and aggregate industry productivity, The Journal of Finance 73, 2787–2836.
Barbosa, Luciana, Andrada Bilal, and Clair Celerier, 2019, Capital inflows, credit growth, and skill(mis)allocation.
Bernanke, Ben, 2015, Monetary policy and inequality, Brookings.
Bernanke, Ben, and Alan Blinder, 1988, Credit, money, and aggregate demand, American EconomicReview 78, 435–39.
Bernanke, Ben, and Alan Blinder, 1992, The federal funds rate and the channels of the monetarytransmission, American Economic Review 82, 901–21.
Bernanke, Ben, and Mark Gertler, 1989, Agency costs, net worth, and business fluctuations,American Economic Review 79, 14–31.
Bernanke, Ben, and Mark Gertler, 1995, Inside the black box: The credit channel of monetarypolicy transmission, Journal of Economic Perspectives 9, 27–48.
Bernanke, Ben, Mark Gertler, and Simon Gilchrist, 1996, The financial accelerator and the flightto quality, The Review of Economics and Statistics 78, 1–15.
Bernanke, Ben S, Mark Gertler, and Simon Gilchrist, 1999, The financial accelerator in aquantitative business cycle framework, Handbook of Macroeconomics 1, 1341–1393.
Bernanke, Ben S, and Kenneth N Kuttner, 2005, What explains the stock market’s reaction tofederal reserve policy?, The Journal of Finance 60, 1221–1257.
Berton, Fabio, Sauro Mocetti, Andrea F. Presbitero, and Matteo Richiardi, 2018, Banks, firms, andjobs, The Review of Financial Studies 31, 2113–2156.
BIS, 2021, BIS annual economic report, Bank for International Settlements.
Blanchard, Olivier, 2007, Adjustment within the euro. The difficult case of Portugal, PortugueseEconomic Journal 6, 1–21.
Brown, Charles, and James Medoff, 1989, The employer size-wage effect, Journal of PoliticalEconomy 97, 1027–1059.
30

Bullard, James, 2014, Income inequality and monetary policy: A framework with answers to threequestions, Speech delivered at the C. Peter McColough Series on International Economics, Councilon Foreign Relations.
Card, David, 1999, The causal effect of education on earnings, in Handbook of Labor Economics,volume 3, 1801–1863 (Elsevier).
Card, David, 2001, Estimating the return to schooling: Progress on some persistent econometricproblems, Econometrica 69, 1127–1160.
Card, David, Ana Rute Cardoso, and Patrick Kline, 2015, Bargaining, sorting, and the gender wagegap: Quantifying the impact of firms on the relative pay of women, The Quarterly Journal ofEconomics 131, 633–686.
Card, David, Jorg Heining, and Patrick Kline, 2013, Workplace heterogeneity and the rise of WestGerman wage inequality, The Quarterly Journal of Economics 128, 967–1015.
Chodorow-Reich, Gabriel, 2014, The employment effects of credit market disruptions: Firm-levelevidence from the 2008-09 financial crisis, The Quarterly Journal of Economics 129, 1–59.
Christiano, Lawrence J, Martin Eichenbaum, and Charles L Evans, 1999, Monetary policy shocks:What have we learned and to what end?, Handbook of Macroeconomics 1, 65–148.
Cloyne, James, Clodomiro Ferreira, Maren Froemel, and Paolo Surico, 2018, Monetary policy,corporate finance and investment, National Bureau of Economic Research Working Paper.
Coibion, Olivier, Yuriy Gorodnichenko, Lorenz Kueng, and John Silvia, 2017, Innocent bystanders?Monetary policy and inequality, Journal of Monetary Economics 88, 70–89.
Doepke, Matthias, and Martin Schneider, 2006, Inflation and the redistribution of nominal wealth,Journal of Political Economy 114, 1069–1097.
Dolado, Juan, Gergo Motyovszki, and Evi Pappa, 2021, Monetary policy and inequality under labormarket frictions and capital-skill complementarity, American Economic Journal: Macroeconomics13, 292–332.
Drechsler, Itamar, Alexi Savov, and Philipp Schnabl, 2017, The deposits channel of monetary policy,The Quarterly Journal of Economics 132, 1819–1876.
31
Engbom, Niklas, and Christian Moser, 2017, Returns to education through access to higher-payingfirms: Evidence from US matched employer-employee data, American Economic Review: Papersand Proceedings 107, 374–378.
Fonseca, Julia, and Bernardus Van Doornik, 2021, Financial development and labor marketoutcomes: Evidence from Brazil, Journal of Financial Economics.
Gertler, Mark, and Simon Gilchrist, 1994, Monetary policy, business cycles, and the behavior ofsmall manufacturing firms, The Quarterly Journal of Economics 109, 309–340.
Gertler, Mark, and Peter Karadi, 2015, Monetary policy surprises, credit costs, and economicactivity, American Economic Journal: Macroeconomics 7, 44–76.
Giannone, Domenico, Michele Lenza, and Lucrezia Reichlin, 2011, Market freedom and the globalrecession, IMF Economic Review 59, 111–135.
Giroud, Xavier, and Holger Mueller, forthcoming, Firms’ internal networks and local economicshocks, American Economic Review.
Gornemann, Nils, Keith Kuester, and Makoto Nakajima, 2016, Doves for the rich, hawks for thepoor? Distributional consequences of monetary policy, CEPR Discussion Paper No. DP11233.
Greenstone, Michael, Alexandre Mas, and Hoai-Luu Nguyen, forthcoming, Do credit market shocksaffect the real economy? Quasi-experimental evidence from the great recession and ‘normal’economic times, American Economic Journal: Economic Policy.
Guiso, Luigi, Luigi Pistaferri, and Fabiano Schivardi, 2013, Credit within the firm, The Review ofEconomic Studies 80, 211–247.
Haltiwanger, John, Ron S Jarmin, and Javier Miranda, 2013, Who creates jobs? small versus largeversus young, Review of Economics and Statistics 95, 347–361.
Hanson, Samuel G, and Jeremy C Stein, 2015, Monetary policy and long-term real rates, Journalof Financial Economics 115, 429–448.
Holm, Martin Blomhoff, Pascal Paul, and Andreas Tischbirek, forthcoming, The transmission ofmonetary policy under the microscope, Journal of Political Economy.
Howell, Sabrina T, and J David Brown, 2020, Do cash windfalls affect wages? Evidence from R&Dgrants to small firms, National Bureau of Economic Research Working Paper No. 26717.
32

Ippolito, Filippo, Ander Perez, and Ali Ozdagli, 2018, Bank loans and the transmission of monetarypolicy: The floating rate channel, Journal of Monetary Economics 95, 319–338.
Jarocinski, Marek, and Peter Karadi, 2020, Deconstructing monetary policy surprises - the role ofinformation shocks, American Economic Journal: Macroeconomics 12.
Jasova, Martina, Caterina Mendicino, and Dominik Supera, 2021, Policy uncertainty, lender of lastresort and the real economy, Journal of Monetary Economics 118, 381–398.
Jimenez, Gabriel, Steven Ongena, Jose-Luis Peydro, and Jesus Saurina, 2012, Credit supply andmonetary policy: Identifying the bank balance-sheet channel with loan applications, AmericanEconomic Review 102, 2301–26.
Jimenez, Gabriel, Steven Ongena, Jose-Luis Peydro, and Jesus Saurina, 2014, Hazardous times formonetary policy: What do twenty-three million bank loans say about the effects of monetarypolicy on credit risk-taking?, Econometrica 82, 463–505.
Kaplan, Greg, Benjamin Moll, and Giovanni Violante, 2018, Monetary policy according to HANK,American Economic Review 108, 697–743.
Kashyap, Anil, Owen A. Lamont, and Jeremy C. Stein, 1994, Credit conditions and the cyclicalbehavior of inventories, The Quarterly Journal of Economics 109, 565–592.
Kashyap, Anil K., and Jeremy C. Stein, 2000, What do a million observations on banks say aboutthe transmission of monetary policy?, American Economic Review 90, 407–428.
Khwaja, Asim Ijaz, and Atif Mian, 2008, Tracing the impact of bank liquidity shocks: Evidencefrom an emerging market, American Economic Review 98, 1413–42.
Kiyotaki, Nobuhiro, and John Moore, 1997, Credit cycles, Journal of Political Economy 105, 211–248.
Krusell, Per, Lee E Ohanian, José-Víctor Ríos-Rull, and Giovanni L Violante, 2000, Capital-skillcomplementarity and inequality: A macroeconomic analysis, Econometrica 68, 1029–1053.
Lagarde, Christine, 2020, The monetary policy strategy review: some preliminary considerations,Speech delivered at the “ECB and Its Watchers XXI” conference.
Luck, Stephan, and Tom Zimmermann, 2020, Employment effects of unconventional monetarypolicy: Evidence from QE, Journal of Financial Economics 135, 678–703.
33

Mersch, Yves, 2014, Monetary policy and economic inequality, Keynote speech, Corporate CreditConference, Zurich.
Michelacci, Claudio, and Vincenzo Quadrini, 2009, Financial markets and wages, The Review ofEconomic Studies 76, 795–827.
Mincer, Jacob A, et al., 1974, Schooling, experience, and earnings, National Bureau of EconomicResearch.
Moser, Christian, Farzad Saidi, Benjamin Wirth, and Stefanie Wolter, 2021, Credit supply, firms,and earnings inequality, CEPR Discussion Paper.
Nakamura, Emi, and John Steinsson, 2018, High-frequency identification of monetary nonneutrality:The information effect, The Quarterly Journal of Economics 133, 1283–1330.
Oi, Walter Y, and Todd L Idson, 1999, Firm size and wages, Handbook of Labor Economics 3,2165–2214.
Oster, Emily, 2019, Unobservable selection and coefficient stability: Theory and evidence, Journalof Business & Economic Statistics 37, 187–204.
Ottonello, Pablo, and Thomas Winberry, 2020, Financial heterogeneity and the investment channelof monetary policy, Econometrica 88, 2473–2502.
Paravisini, Daniel, 2008, Local bank financial constraints and firm access to external finance, TheJournal of Finance 63, 2161–2193.
Patterson, Christina, 2019, The matching multiplier and the amplification of recessions.
Powell, Jerome, 2019, Transcript of Chair Powell’s press conference, Chair Powell’s PressConference, July 31, 2019.
Reis, Ricardo, 2013, The Portuguese slump and crash and the euro crisis, National Bureau ofEconomic Research.
Schnabl, Philipp, 2012, The international transmission of bank liquidity shocks: Evidence from anemerging market, The Journal of Finance 67, 897–932.
Song, Jae, David J Price, Fatih Guvenen, Nicholas Bloom, and Till von Wachter, 2018, Firming upinequality, The Quarterly Journal of Economics 134, 1–50.
34

Sorkin, Isaac, 2018, Ranking Firms Using Revealed Preference, The Quarterly Journal of Economics133, 1331–1393.
Taylor, J., 1993, Discretion versus policy rules in practice, Carnegie Rochester Conference Series onPublic Policy.
Wu, Jing Cynthia, and Fan Dora Xia, 2016, Measuring the macroeconomic impact of monetarypolicy at the zero lower bound, Journal of Money, Credit, and Banking 48, 253–291.
Yellen, Janet, 2014, Perspectives on inequality and opportunity from the survey of consumerfinances, Speech delivered at the Conference on Economic Opportunity and Inequality, FederalReserve Bank of Boston.
35

Graphs and Tables
Table 1: Descriptive statistics
Firms:Fraction of workers in small firms 0.3321Fraction of workers in young firms 0.1101Mean bank leverage 0.2081Mean share of college educated workers in firm 0.1250
Workers:Mean age 38.16Fraction > 35 years old 0.5712Fraction with high school degree 0.6152Fraction with college degree 0.2295Fraction females 0.4469
Mean weekly hours 38.8134Std. weekly hours 4.1300Mean log hourly wage 2.9935Std. log hourly wage 0.6484
Number worker-year obs. 28,779,857Number of workers 5,587,862Number of firms 795,369Notes: The sample consists of yearly data from 1999 to 2013. All statistics are calculated across worker-year observations
36

Table 2: Monetary policy, wages and firm heterogeneity
log(wageHrw,f,t)
(1) (2) (3) (4) (5) (6) (7) (8)
SmallFirmf× Rt−1 -2.75*** -2.87*** -1.88*** -1.16***(0.398) (0.395) (0.201) (0.163)
YoungFirmf,t−1× Rt−1 -0.56 -0.36 -0.40*** -0.40***(0.68) (0.701) (0.137) (0.118)
Rt−1 -3.67*** -5.11***(0.396) (0.177)
Controls Yes Yes Yes Yes Yes Yes Yes Yes
Time FE Yes Yes Yes Yes Yes Yes
Firm FE Yes Yes Yes Yes
Worker FE Yes Yes
N 23,441,331 23,441,331 23,408,044 22,584,310 28,449,288 28,449,288 28,372,955 27,578,607R2 0.10 0.11 0.54 0.83 0.02 0.03 0.52 0.81
Notes: This table shows the worker-level wage effects of 1 pp increase in the monetary policy rate, as described in Equation 1. Rt−1 is a lagged value ofEONIA rate. SmallFirmf is a dummy variable that takes a value of 1 if the firm has fewer than 50 employees, and 0 otherwise. YoungFirmf,t−1 is a dummyvariable that takes a value of 1 if the firm is younger than five years, and 0 otherwise. Controls denote additional variation of small (young) firm and GDPand VIX, as well as the polynomial of worker’s age. Standard errors are two-way clustered at the firm and worker level. ∗ p < 0.10, ∗∗ p < 0.05, ∗∗∗ p < 0.01.
37

Figure 1: Firm heterogeneities by quintiles
(a) Firm size
-2-1.5
-1-.5
0.5
Estim
ates
0-20 20-40 40-60 60-80 80-100Percentiles
(b) Firm age
-1-.5
0.5
Estim
ates
0-20 20-40 40-60 60-80 80-100Percentiles
(c) Firm wage
-2.5
-2-1.5
-1-.5
0Estim
ates
0-20 20-40 40-60 60-80 80-100Percentiles
Notes: This figure presents the redistributive wage effects of 1 pp increase in the monetary policy rate using firm heterogeneities.Each point represents a coefficient estimate from the Equation 1 with separate independent variables for each bin (quintile)of distribution ordered by firm size (Panel (a)), firm age (Panel (b)) and firm wages in t − 1 (Panel (c)). The top quintile(p80–p100) is the reference (omitted) category. Standard errors are two-way clustered at the firm and worker level. Verticallines denote 95% confidence intervals.
38

Table 3: Back-loaded wage mechanism and monetary policy
log(wageHrw,f,t)
Small Firms Large Firms Full sample
(1) (2) (3) (4) (5) (6)
Stayerw,t−1 ×Rt−1 -0.21*** -0.15* 0.17 0.45*** 0.07 0.32*(0.068) (0.077) (0.263) (0.170) (0.256) (0.170)
SmallFirmf ×Rt−1 -0.71***(0.269)
SmallFirmf× Stayerw,t−1 ×Rt−1 -0.45* -0.58***(0.268) (0.190)
Controls Yes Yes Yes Yes Yes Yes
Worker FE Yes Yes Yes Yes Yes Yes
Time FE Yes - Yes - Yes -
Firm FE Yes - Yes - Yes -
Firm-Time FE Yes Yes Yes
N 9,462,425 8,560,216 7,503,550 7,503,269 17,146,584 16,247,310R2 0.82 0.88 0.86 0.88 0.85 0.88
Notes: This table shows how firms of different size share rents with their workers following a 1 pp increase in the monetarypolicy rate. Rt−1 is a lagged value of EONIA rate. SmallFirmf is a dummy variable that takes a value of 1 if the firm has fewerthan 50 employees, and 0 otherwise. Stayerw,t−1 takes the value of 1 if the worker did not change the firm in the past year,and 0 otherwise. Controls denote additional variation of small firm and GDP and VIX, as well as the polynomial of worker’sage (in line with Equation 1). Standard errors are two-way clustered at the firm and worker level. ∗ p < 0.10, ∗∗ p < 0.05, ∗∗∗p < 0.01.
39

Table 4: Monetary policy, employment and hours worked
log(1+ HrsWorkedw,f,t) log(Employmentf,t)
(1) (2) (3) (4) (5) (6)
SmallFirmf ×Rt−1 -7.03*** -1.05*** -1.73***(0.61) (0.18) (0.20)
YoungFirmf,t−1 ×Rt−1 -2.87*** -2.11*** -2.16***(0.79) (0.06) (0.06)
Controls Yes Yes Yes Yes Yes Yes
Firm FE Yes Yes Yes Yes Yes Yes
Time FE Yes Yes Yes Yes - -
Worker FE Yes Yes n/a n/a n/a n/a
Industry-Time FE Yes Yes
Region-Time FE Yes Yes
N 26,919,089 36,078,494 3,349,200 3,421,880 3,349,189 3,421,856R2 0.27 0.25 0.87 0.88 0.87 0.89
Notes: This table shows the worker-level hours worked effects (Equation 2) and firm-level employment effects (Equation 3) of1 pp increase in the monetary policy rate. The outcome variable in Columns (1)–(2) denoted as log(1+HrsWorked) measurestotal hours worked by worker w in firm f in year t. It takes the value of 0 if the worker is unemployed and the reported hours ifthe worker is employed. The outcome variable in Columns (3)–(6) is log(Employmentf,t) which denotes the log of the numberof workers employed in firm f at time t. Rt−1 is a lagged value of EONIA rate. SmallFirmf is a dummy variable that takes avalue of 1 if the firm has fewer than 50 employees, and 0 otherwise. YoungFirmf,t−1 is a dummy variable that takes a value of1 if the firm is younger than five years, and 0 otherwise. Controls denote additional variation of small (young) firm and GDPand VIX, and in Columns (1)–(2) also the polynomial of worker’s age. n/a stands for not applicable. Standard errors two-wayclustered at the firm and worker level in Columns (1)–(2) and at the firm level in Columns (3)–(6). ∗ p < 0.10, ∗∗ p < 0.05,∗∗∗ p < 0.01.
40

Table 5: Monetary policy and skill premium
log(wageHrw,f,t) log(1 + HrsWorkedw,f,t)
(1) (2) (3) (4)
Collegew × Rt−1 -1.14*** -2.70***(0.103) (0.353)
STEM Collegew × Rt−1 -1.66*** -4.64***(0.113) (0.351)
Other Collegew × Rt−1 -0.60*** -1.39***(0.087) (0.474)
Controls Yes Yes Yes YesTime FE Yes Yes Yes YesFirm FE Yes Yes Yes YesWorker FE Yes Yes Yes Yes
N 22,452,141 22,452,141 30,433,138 30,433,138R2 0.82 0.82 0.25 0.25
Notes: This table shows the estimates of worker-level heterogeneity on wages and hours worked of 1 pp increase in the monetarypolicy rate, as described in Equations 1 and 2, respectively. Rt−1 is a lagged value of EONIA rate. Collegew takes the value of1 if the highest educational attainment of worker w is at least a college degree, and 0 otherwise. We further split to College intotwo subcategories STEM Collegew takes the value of 1 if a worker received a degree in STEM fields and Other Collegew denotesnon-STEM degrees. Controls denote additional variation of college variable(s) and GDP and VIX, as well as the polynomial ofworker’s age. Standard errors two-way clustered at the firm and worker level. ∗ p < 0.10, ∗∗ p < 0.05, ∗∗∗ p < 0.01.
41

Figure 2: Firm and worker heterogeneity
-10
-50
5Es
timat
es
Small FirmsCollege Workers
Small FirmsNon-College Workers
Large FirmsCollege Workers
Large FirmsNon-College Workers
Notes: This figure presents the redistributive wage effects of 1 pp increase in the monetary policy rate using a combination offirm and worker heterogeneity. The outcome variable is log hours worked. Firms with fewer than 50 employees are denoted asSmall Firms, and as Large Firms otherwise. Workers are denoted as College Workers if their highest educational attainment isat least a college degree. College educated workers in large firm are taken as the reference (omitted) category. Standard errorsare two-way clustered at the firm and worker level. Vertical lines denote 95% confidence intervals.
42

Table 6: Monetary policy and investment
∆ Capitalf,t/TAf,t−1
(1) (2) (3) (4)
SmallFirmf ×∆Rt−1 -2.20*** -1.59***(0.18) (0.18)
YoungFirmf,t−1 ×∆Rt−1 -1.20*** -1.10***(0.12) (0.11)
Controls Yes Yes Yes Yes
Time FE Yes Yes Yes Yes
Firm FE Yes Yes
N 597,877 558,559 619,856 577,022R2 0.01 0.41 0.03 0.42
Notes: This table shows the estimates of the heterogeneous effects on monetary policy on firm-level investment of 1 pp increasein the monetary policy rate. The outcome variable as the year-on-year change in capital scaled to the lagged value of firm’s totalassets. SmallFirmf is a dummy that takes a value of 1 if the firm has fewer than 50 employees, and 0 otherwise. YoungFirmf,t−1
is a dummy that takes a value of 1 if the firm is younger than five years, and 0 otherwise. Controls denote additional variationof small (young) firm and GDP and VIX. Standard errors are clustered at the firm level. ∗ p < 0.10, ∗∗ p < 0.05, ∗∗∗ p < 0.01.
43

Table 7: Importance of the credit channel
log(wageHrw,f,t)
(1) (2) (3) (4)
SmallFirmf× Rt−1 0.38 -0.97***(0.69) (0.22)
SmallFirmf× Rt−1× ExistCreditf,t−1 -1.63***(0.62)
SmallFirmf× Rt−1× Leveragef,t−1 -1.34**(0.66)
YoungFirmf,t−1× Rt−1 1.70 -0.22**(1.12) (0.11)
YoungFirmf,t−1× Rt−1× ExistCreditf,t−1 -2.10**(0.88)
YoungFirmf,t−1× Rt−1× Leveragef,t−1 -0.45**(0.19)
Controls Yes Yes Yes Yes
Time FE Yes Yes Yes Yes
Worker FE Yes Yes Yes Yes
Firm FE Yes Yes Yes Yes
N 22,584,310 22,584,310 27,578,607 27,578,607R2 0.83 0.83 0.81 0.81
Notes: This table shows the worker-level wage effects of 1 pp increase in the monetary policy rate. We expand Equation 1with additional interaction capturing the importance of bank credit. ExistCreditf,t−1 takes the value of 1 if the firm has everhad an existing bank borrowing relationship, and 0 otherwise. Leverage denotes the ratio of firm bank debt to total assets int − 1. Rt−1 is a lagged value of EONIA rate. SmallFirmf is a dummy that takes a value of 1 if the firm has fewer than 50employees, and 0 otherwise. YoungFirmf,t−1 is a dummy that takes a value of 1 if the firm is younger than five years, and 0otherwise. Controls denote interaction terms of small (young) firms and the respective credit proxy, triple interaction of small(young) firms, credit proxy and GDP/VIX, double interactions of credit proxy and GDP / VIX / monetary policy rate, doubleinteraction of small (young) firms and GDP / VIX, as well as the polynomial of worker’s age. Standard errors are two-wayclustered at the firm and worker level. ∗ p < 0.10, ∗∗ p < 0.05, ∗∗∗ p < 0.01.
44

Table 8: Relationship between firm credit sensitivity to monetary policy rate and proxy variables
FBCf(1) (2) (3) (4) (5) (6)
Agef 0.17∗∗∗
(0.008)log(TotalAssetsf ) 0.27∗∗∗
(0.061)log(Employmentf ) 0.23∗∗∗
(0.097)YoungFirmf -5.99∗∗∗ -6.03∗∗∗
(0.002) (0.003)SmallFirmf -7.04∗∗∗ -5.47∗∗∗
(0.877) (0.993)
N 272,042 284,881 272,645 272,042 257,783 257,232R2 0.0015 0.0002 0.0002 0.0022 0.0002 0.0024
Notes: This table presents coefficients from firm-level univariate regressions FBCf = α + φXf + εf , where FBCf denotesfirm-balance sheet channel which is estimated as a firm-level credit sensitivity to monetary policy conditions from loan-levelregression following Equation 4. Xf represents average size or age of firm f over the sample period. YoungFirmf is a dummythat takes a value of 1 if the firm is younger than five years, and 0 otherwise. SmallFirmf is a dummy that takes a value of 1if the firm has fewer than 50 employees, and 0 otherwise. ∗ p < 0.10, ∗∗ p < 0.05, ∗∗∗ p < 0.01.
45

Table 9: Labor income heterogeneity and credit channel
log(wageHrw,f,t)
(1) (2) (3)
FBCf ×Rt−1 0.73***(0.166)
BLCHealthb,tf,t−1 ×Rt−1 0.63***(0.224)
BLCLiqAssb,tf,t−1 ×Rt−1 2.03**(0.898)
Controls Yes Yes Yes
Time FE Yes Yes Yes
Firm FE Yes Yes Yes
Worker FE Yes Yes Yes
N 18,616,412 16,839,851 20,368,059R2 0.79 0.80 0.81
Notes: This table shows the coefficients from the credit channel analysis on wages following a 1 pp increase in the monetarypolicy rate. Column (1) reports the coefficients from the firm balance-sheet channel regression, as described in Equation 5.Columns (2) and (3) report the coefficients from bank lending channel regression, as described in Equation 7, using the credit-weighted firm-level exposure to the bank lending channel proxied by bank health and bank liquidity, respectively. Rt−1 is alagged value of EONIA rate. Controls denote additional variation of FBC/BLC measure with GDP and VIX, as well as thepolynomial of worker’s age. Standard errors are two-way clustered at the firm and worker level. ∗ p < 0.10, ∗∗ p < 0.05, ∗∗∗p < 0.01.
46
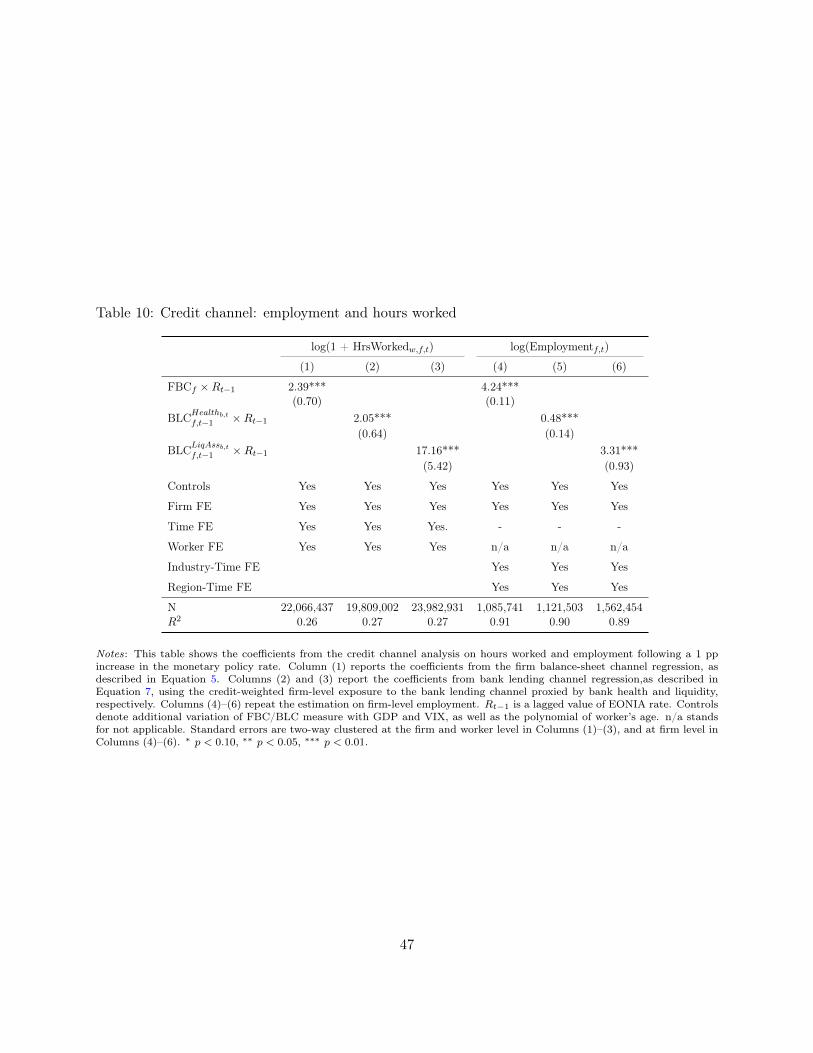
Table 10: Credit channel: employment and hours worked
log(1 + HrsWorkedw,f,t) log(Employmentf,t)
(1) (2) (3) (4) (5) (6)
FBCf ×Rt−1 2.39*** 4.24***(0.70) (0.11)
BLCHealthb,tf,t−1 ×Rt−1 2.05*** 0.48***(0.64) (0.14)
BLCLiqAssb,tf,t−1 ×Rt−1 17.16*** 3.31***(5.42) (0.93)
Controls Yes Yes Yes Yes Yes Yes
Firm FE Yes Yes Yes Yes Yes Yes
Time FE Yes Yes Yes. - - -
Worker FE Yes Yes Yes n/a n/a n/a
Industry-Time FE Yes Yes Yes
Region-Time FE Yes Yes Yes
N 22,066,437 19,809,002 23,982,931 1,085,741 1,121,503 1,562,454R2 0.26 0.27 0.27 0.91 0.90 0.89
Notes: This table shows the coefficients from the credit channel analysis on hours worked and employment following a 1 ppincrease in the monetary policy rate. Column (1) reports the coefficients from the firm balance-sheet channel regression, asdescribed in Equation 5. Columns (2) and (3) report the coefficients from bank lending channel regression,as described inEquation 7, using the credit-weighted firm-level exposure to the bank lending channel proxied by bank health and liquidity,respectively. Columns (4)–(6) repeat the estimation on firm-level employment. Rt−1 is a lagged value of EONIA rate. Controlsdenote additional variation of FBC/BLC measure with GDP and VIX, as well as the polynomial of worker’s age. n/a standsfor not applicable. Standard errors are two-way clustered at the firm and worker level in Columns (1)–(3), and at firm level inColumns (4)–(6). ∗ p < 0.10, ∗∗ p < 0.05, ∗∗∗ p < 0.01.
47
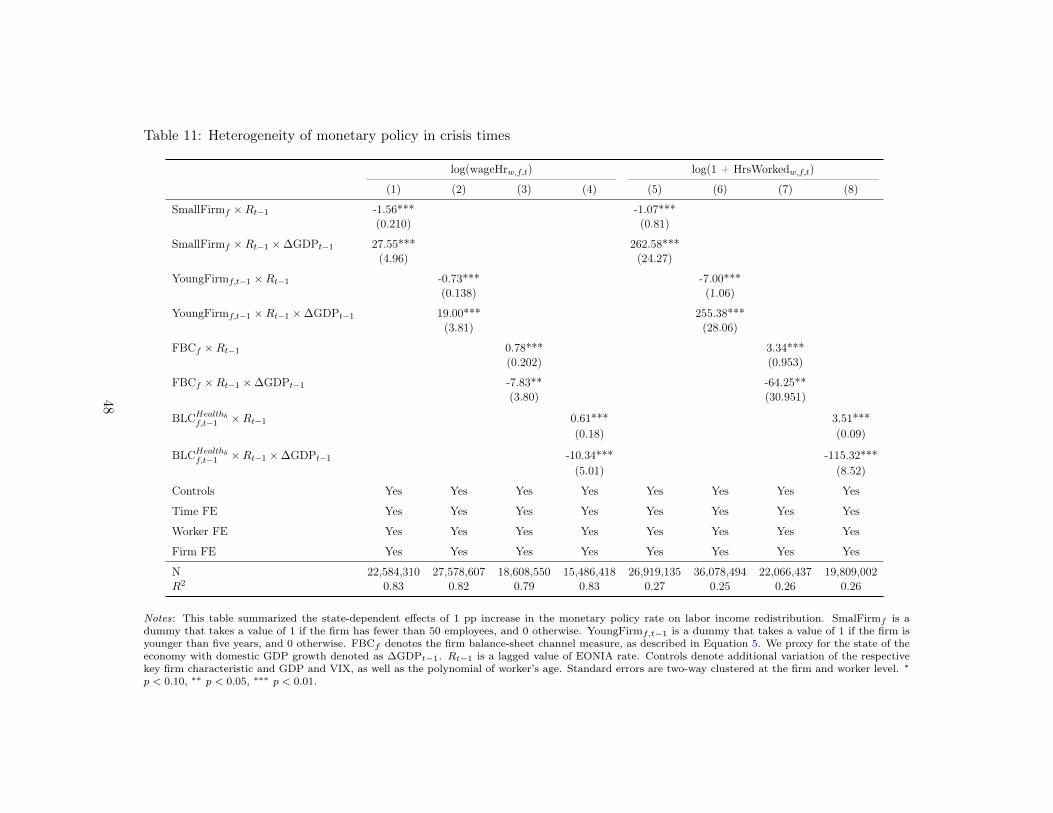
Table 11: Heterogeneity of monetary policy in crisis times
log(wageHrw,f,t) log(1 + HrsWorkedw,f,t)
(1) (2) (3) (4) (5) (6) (7) (8)
SmallFirmf ×Rt−1 -1.56*** -1.07***(0.210) (0.81)
SmallFirmf ×Rt−1 ×∆GDPt−1 27.55*** 262.58***(4.96) (24.27)
YoungFirmf,t−1 ×Rt−1 -0.73*** -7.00***(0.138) (1.06)
YoungFirmf,t−1 ×Rt−1 ×∆GDPt−1 19.00*** 255.38***(3.81) (28.06)
FBCf ×Rt−1 0.78*** 3.34***(0.202) (0.953)
FBCf ×Rt−1 ×∆GDPt−1 -7.83** -64.25**(3.80) (30.951)
BLCHealthbf,t−1 ×Rt−1 0.61*** 3.51***(0.18) (0.09)
BLCHealthbf,t−1 ×Rt−1 ×∆GDPt−1 -10.34*** -115.32***(5.01) (8.52)
Controls Yes Yes Yes Yes Yes Yes Yes Yes
Time FE Yes Yes Yes Yes Yes Yes Yes Yes
Worker FE Yes Yes Yes Yes Yes Yes Yes Yes
Firm FE Yes Yes Yes Yes Yes Yes Yes Yes
N 22,584,310 27,578,607 18,608,550 15,486,418 26,919,135 36,078,494 22,066,437 19,809,002R2 0.83 0.82 0.79 0.83 0.27 0.25 0.26 0.26
Notes: This table summarized the state-dependent effects of 1 pp increase in the monetary policy rate on labor income redistribution. SmalFirmf is adummy that takes a value of 1 if the firm has fewer than 50 employees, and 0 otherwise. YoungFirmf,t−1 is a dummy that takes a value of 1 if the firm isyounger than five years, and 0 otherwise. FBCf denotes the firm balance-sheet channel measure, as described in Equation 5. We proxy for the state of theeconomy with domestic GDP growth denoted as ∆GDPt−1. Rt−1 is a lagged value of EONIA rate. Controls denote additional variation of the respectivekey firm characteristic and GDP and VIX, as well as the polynomial of worker’s age. Standard errors are two-way clustered at the firm and worker level. ∗p < 0.10, ∗∗ p < 0.05, ∗∗∗ p < 0.01.
48

Online Appendix
Monetary Policy, Labor Income Redistribution and the Credit Channel:
Evidence from Matched Employer-Employee and Credit Registers
A Additional Figures and Tables
Table A1: Monetary policy, economic conditions and wage dynamics
log(wageHrw,f,t) log(1+HrsWorkedw,f,t)
(1) (2) (3) (4) (5) (6)
Rt−1 -5.51*** -4.44*** -4.68*** -3.70*** -4.00*** -3.00***(0.166) (0.089) (0.072) (0.218) (0.214) (0.223)
∆GDPt−1 0.51*** 0.46*** 0.40*** 3.69*** 3.87*** 3.76***(0.043) (0.026) (0.024) (0.126) (0.127) (0.123)
Controls Yes Yes Yes Yes Yes Yes
Firm FE Yes Yes Yes Yes
Worker FE Yes Yes
N 28,779,857 28,702,159 27,907,080 36,834,680 36,815,735 36,776,921R2 0.01 0.52 0.81 0.001 0.11 0.24
Notes: This table shows the coefficients from worker-level wage and hours worked sensitivity of wages to a 1 pp increase in themonetary policy rate. Rt−1 is a lagged value of EONIA rate. ∆GDPt−1 denotes lagged values of the Portuguese GDP growth.Controls denote the polynomial of worker’s age. Standard errors are two-way clustered at the firm and worker level. *p < 0.05,** p < 0.01, *** p < 0.001
49

Table A2: Firm heterogeneity robustness: small and young firms
log(wageHr)w,f,tBaseline Baseline
(1) (2) (3) (4) (5) (6) (7)
SmallFirmf× Rt−1 -1.11*** -1.16*** -1.15*** -1.08***(0.163) (0.163) (0.149) (0.118)
YoungFirmf,t−1× Rt−1 -0.25** -0.40*** -0.36*** -0.32***(0.113 ) (0.118) (0.109) (0.094)
Controls Yes Yes Yes Yes Yes Yes Yes
Time FE Yes Yes - - Yes - -
Firm FE Yes Yes Yes Yes Yes Yes Yes
Worker FE Yes Yes Yes Yes Yes Yes Yes
Sector-Time FE Yes - Yes -
Region-Time FE Yes - Yes -
Sector-Region-Time FE Yes Yes
N 22,325,965 22,584,310 22,584,272 22,583,423 27,578,607 27,578,577 27,577,770R2 0.83 0.83 0.83 0.83 0.81 0.82 0.82
Notes: This table shows the robustness to the worker-level wage effects of 1 pp increase in the monetary policy rate, as describedin Equation 1. Rt−1 is a lagged value of EONIA rate. SmallFirmf is a dummy variable that takes a value of 1 if the firm hasfewer than 50 employees, and 0 otherwise. YoungFirmf,t−1 is a dummy variable that takes a value of 1 if the firm is youngerthan five years, and 0 otherwise. Controls denote additional variation of small (young) firm and GDP and VIX, as well as thepolynomial of worker’s age. Standard errors are two-way clustered at the firm and worker level. ∗ p < 0.10, ∗∗ p < 0.05, ∗∗∗p < 0.01.
50
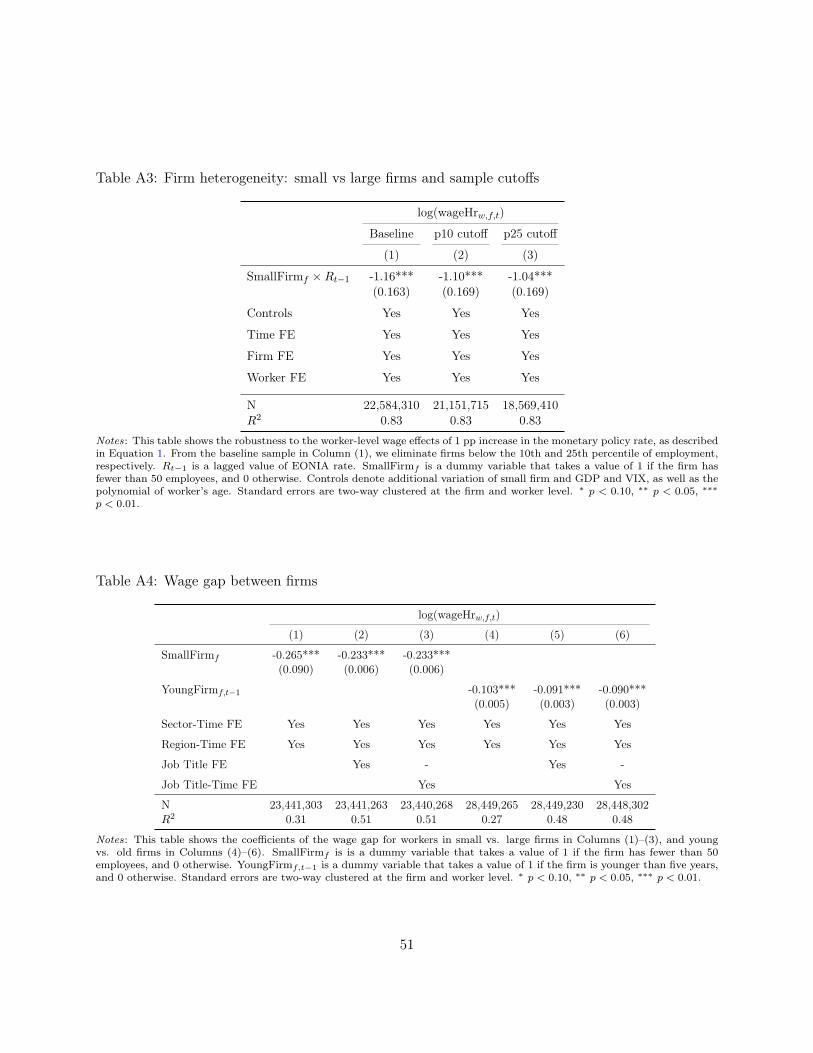
Table A3: Firm heterogeneity: small vs large firms and sample cutoffs
log(wageHrw,f,t)
Baseline p10 cutoff p25 cutoff
(1) (2) (3)
SmallFirmf ×Rt−1 -1.16*** -1.10*** -1.04***(0.163) (0.169) (0.169)
Controls Yes Yes Yes
Time FE Yes Yes Yes
Firm FE Yes Yes Yes
Worker FE Yes Yes Yes
N 22,584,310 21,151,715 18,569,410R2 0.83 0.83 0.83
Notes: This table shows the robustness to the worker-level wage effects of 1 pp increase in the monetary policy rate, as describedin Equation 1. From the baseline sample in Column (1), we eliminate firms below the 10th and 25th percentile of employment,respectively. Rt−1 is a lagged value of EONIA rate. SmallFirmf is a dummy variable that takes a value of 1 if the firm hasfewer than 50 employees, and 0 otherwise. Controls denote additional variation of small firm and GDP and VIX, as well as thepolynomial of worker’s age. Standard errors are two-way clustered at the firm and worker level. ∗ p < 0.10, ∗∗ p < 0.05, ∗∗∗p < 0.01.
Table A4: Wage gap between firms
log(wageHrw,f,t)
(1) (2) (3) (4) (5) (6)
SmallFirmf -0.265*** -0.233*** -0.233***(0.090) (0.006) (0.006)
YoungFirmf,t−1 -0.103*** -0.091*** -0.090***(0.005) (0.003) (0.003)
Sector-Time FE Yes Yes Yes Yes Yes Yes
Region-Time FE Yes Yes Yes Yes Yes Yes
Job Title FE Yes - Yes -
Job Title-Time FE Yes Yes
N 23,441,303 23,441,263 23,440,268 28,449,265 28,449,230 28,448,302R2 0.31 0.51 0.51 0.27 0.48 0.48
Notes: This table shows the coefficients of the wage gap for workers in small vs. large firms in Columns (1)–(3), and youngvs. old firms in Columns (4)–(6). SmallFirmf is is a dummy variable that takes a value of 1 if the firm has fewer than 50employees, and 0 otherwise. YoungFirmf,t−1 is a dummy variable that takes a value of 1 if the firm is younger than five years,and 0 otherwise. Standard errors are two-way clustered at the firm and worker level. ∗ p < 0.10, ∗∗ p < 0.05, ∗∗∗ p < 0.01.
51

Table A5: Monetary policy, wages and firm heterogeneity: persistence over time
log(wageHrw,f,...)
t t+1 t+2 t+3 t t+1 t+2 t+3
Baseline Baseline
(1) (2) (3) (4) (5) (6) (7) (8)
SmallFirmf × Rt−1 -1.16*** -0.57*** -0.51*** -0.31**(0.163) (0.134) (0.117) (0.128)
YoungFirmf,t−1 × Rt−1 -0.40*** -0.16*** -0.13*** -0.22**(0.118) (0.091) (0.085) (0.097)
Controls Yes Yes Yes Yes Yes Yes Yes Yes
Time FE Yes Yes Yes Yes Yes Yes Yes Yes
Firm FE Yes Yes Yes Yes Yes Yes Yes Yes
Worker FE Yes Yes Yes Yes Yes Yes Yes Yes
N 22,584,310 22,584,310 22,584,310 22,584,310 27,578,607 27,578,607 27,578,607 27,578,607
R2 0.83 0.83 0.83 0.83 0.81 0.81 0.81 0.81Notes: This table shows the persistence of the worker-level wage effects of 1 pp increase in the monetary policy rate, expanding Equation 1 with additionallags. Rt−1 is a lagged value of EONIA rate. SmallFirmf is a dummy variable that takes a value of 1 if the firm has fewer than 50 employees, and 0 otherwise.YoungFirmf,t−1 is a dummy variable that takes a value of 1 if the firm is younger than five years, and 0 otherwise. Controls denote additional variationof small (young) firm and GDP and VIX, as well as the polynomial of worker’s age. Standard errors are two-way clustered at the firm and worker level. ∗p < 0.10, ∗∗ p < 0.05, ∗∗∗ p < 0.01.
52
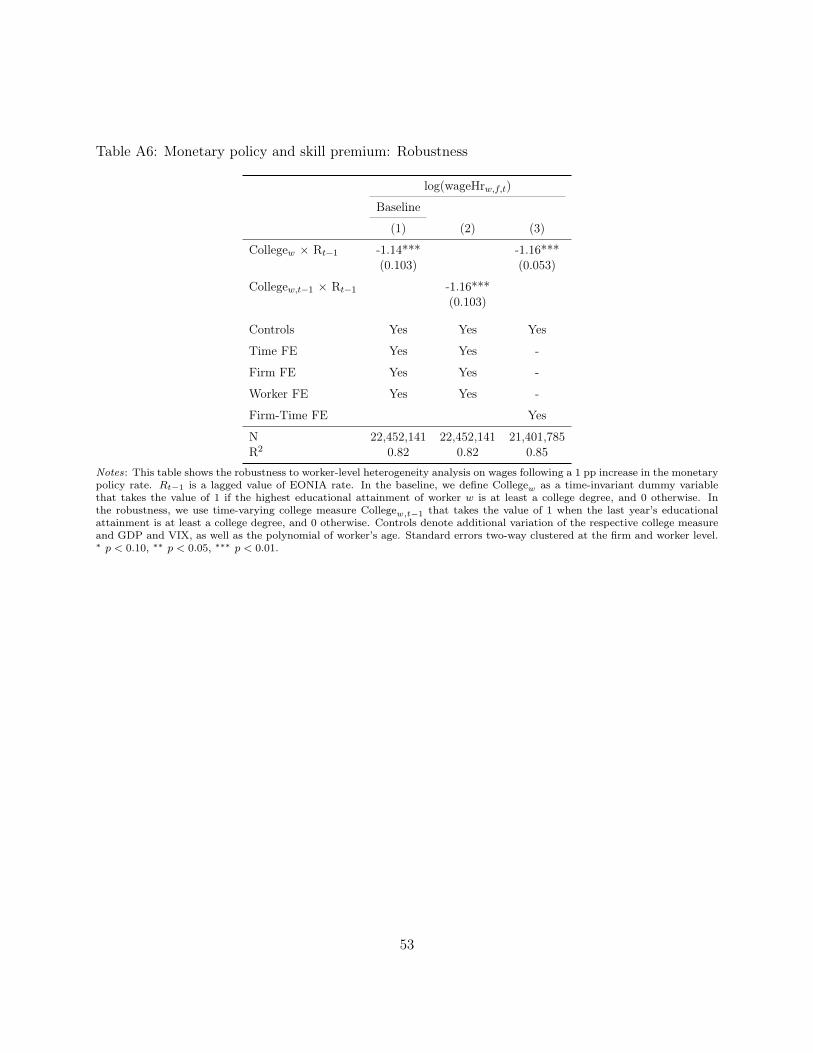
Table A6: Monetary policy and skill premium: Robustness
log(wageHrw,f,t)
Baseline
(1) (2) (3)
Collegew × Rt−1 -1.14*** -1.16***(0.103) (0.053)
Collegew,t−1 × Rt−1 -1.16***(0.103)
Controls Yes Yes Yes
Time FE Yes Yes -
Firm FE Yes Yes -
Worker FE Yes Yes -
Firm-Time FE Yes
N 22,452,141 22,452,141 21,401,785R2 0.82 0.82 0.85
Notes: This table shows the robustness to worker-level heterogeneity analysis on wages following a 1 pp increase in the monetarypolicy rate. Rt−1 is a lagged value of EONIA rate. In the baseline, we define Collegew as a time-invariant dummy variablethat takes the value of 1 if the highest educational attainment of worker w is at least a college degree, and 0 otherwise. Inthe robustness, we use time-varying college measure Collegew,t−1 that takes the value of 1 when the last year’s educationalattainment is at least a college degree, and 0 otherwise. Controls denote additional variation of the respective college measureand GDP and VIX, as well as the polynomial of worker’s age. Standard errors two-way clustered at the firm and worker level.∗ p < 0.10, ∗∗ p < 0.05, ∗∗∗ p < 0.01.
53

B Firm balance sheet channel: Robustness
As a robustness for the firm balance-sheet channel methodology presented in Section 5.1 of thepaper, we consider an alternative specification of Equation 4 that estimates the firm-level creditsensitivity to monetary policy using the following regression that controls for additional firm-timevariation of credit:
log(creditf,b,t) = κb,t + κf,t + βf,bRt−1 + γf,bGDPt−1 + εf,b,t. (B1)
We estimate the sensitivity to monetary policy for each bank-firm pair (βf,b). Next, we computea credit weighted average of these estimates to obtain sensitivity to monetary policy at the firmlevel where
FBCf =∑b
β̂f,b × creditb,f,t−1
creditb,f,t−1. (B2)
Equation B1 allows us to introduce firm-time fixed effects to further control for time-varyingfirm-level variation (that could have potentially remained unaddressed by previously used sector-region-time fixed effects in Equation 4 in the main text). Using firm-time fixed effects, we cannotestimate the credit sensitivity to monetary policy at the firm level. Instead, we identify the creditsensitivity βf,b for each bank-firm pair and then aggregate the sensitivity at the firm level (EquationB2). The implementation of firm-time fixed effects requires the existence of multiple borrowingrelationships for firm f at time t (for details see e.g., Khwaja and Mian 2008). The broad coverageof Portuguese credit registry (reporting threshold of 50 EUR) allows us to introduce firm-time fixedeffects without any significant loss of generality. Note that on average, firms in Portugal have creditrelationship with two banks.
Finally, following the same approach as in the main text, we estimate of the worker-level wageheterogeneity:
log(wagew,f,t) = αt + αw + αf + θ(FBCf ×Rt−1) + ζCw,t−1 + εw,f,t. (B3)
The results are presented in Online Appendix Table B1. With softer monetary policy, wages ofworkers in firms with a stronger credit sensitivity to monetary policy at the bank-firm level increaseby more compared to wages in firms with weaker credit sensitivity. This suggests that even aftercontrolling for time-varying credit demand and supply in the loan regression, the firm balance sheetchannel is important in shaping the responses of wages to monetary policy changes.
54

Table B1: Firm-balance sheet credit channel robustness
log(wageHrw,f,t)
Baseline Robustness
(1) (2)
FBCf ×Rt−1 0.73***(0.166)
FBCf ×Rt−1 0.35***(0.123)
Controls Yes Yes
Time FE Yes Yes
Firm FE Yes Yes
Worker FE Yes Yes
N 18,616,412 12,625,965R2 0.79 0.80
Notes: This table shows the robustness to the firm balance-sheet channel analysis on wages following a 1 pp increase in themonetary policy rate. Column (1) reports the firm-balance sheet channel coefficients from the baseline estimates regression, asdescribed in Equation 5. Column (2) reports estimates using the alternative approach presented in Online Appendix B. Rt−1 isa lagged value of EONIA rate. Controls denote additional variation of the respective FBC measure and GDP and VIX, as wellas the polynomial of worker’s age. Standard errors are two-way clustered at the firm and worker level. ∗ p < 0.10, ∗∗ p < 0.05,∗∗∗ p < 0.01.
55
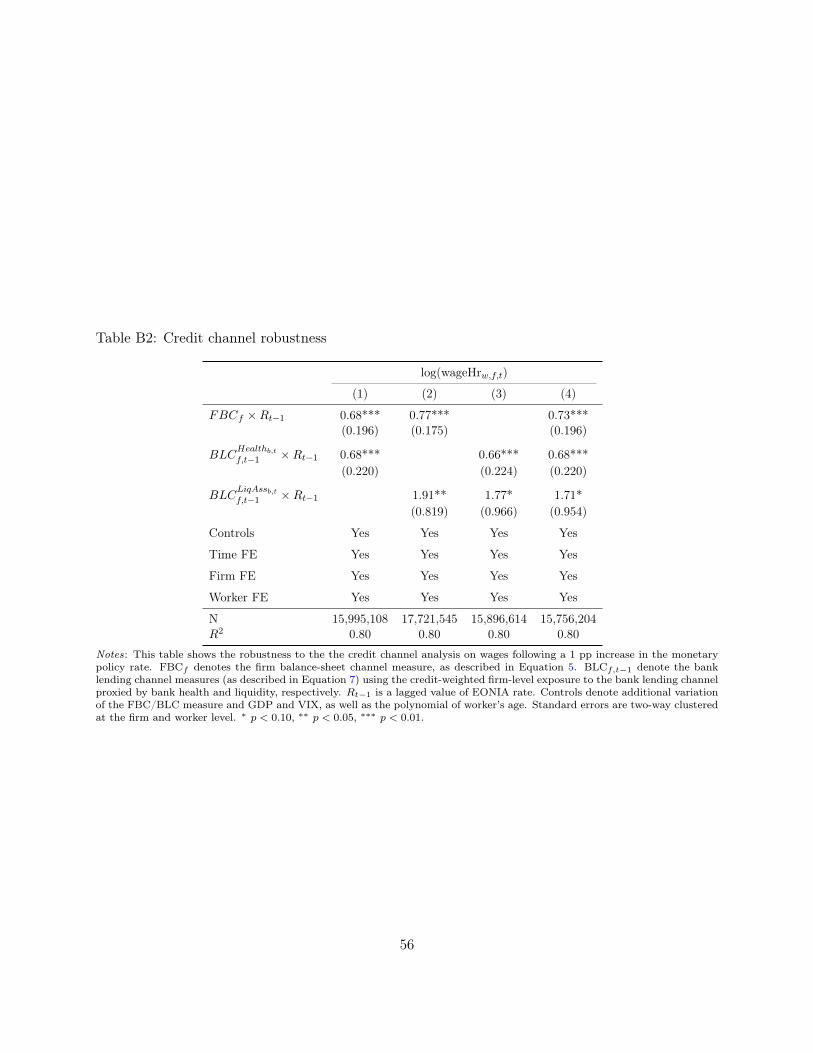
Table B2: Credit channel robustness
log(wageHrw,f,t)
(1) (2) (3) (4)
FBCf ×Rt−1 0.68*** 0.77*** 0.73***(0.196) (0.175) (0.196)
BLCHealthb,tf,t−1 ×Rt−1 0.68*** 0.66*** 0.68***
(0.220) (0.224) (0.220)
BLCLiqAssb,tf,t−1 ×Rt−1 1.91** 1.77* 1.71*
(0.819) (0.966) (0.954)
Controls Yes Yes Yes Yes
Time FE Yes Yes Yes Yes
Firm FE Yes Yes Yes Yes
Worker FE Yes Yes Yes Yes
N 15,995,108 17,721,545 15,896,614 15,756,204R2 0.80 0.80 0.80 0.80
Notes: This table shows the robustness to the the credit channel analysis on wages following a 1 pp increase in the monetarypolicy rate. FBCf denotes the firm balance-sheet channel measure, as described in Equation 5. BLCf,t−1 denote the banklending channel measures (as described in Equation 7) using the credit-weighted firm-level exposure to the bank lending channelproxied by bank health and liquidity, respectively. Rt−1 is a lagged value of EONIA rate. Controls denote additional variationof the FBC/BLC measure and GDP and VIX, as well as the polynomial of worker’s age. Standard errors are two-way clusteredat the firm and worker level. ∗ p < 0.10, ∗∗ p < 0.05, ∗∗∗ p < 0.01.
56

C Robustness to different measures of monetary policy
As detailed in Section 7, this Appendix demonstrates that our results are robust alternative measuresof monetary policy conditions. We re-estimate both the wage and hours worked analyses and reportthe results for small/young firm heterogeneity and credit channel in Tables C1 and C2, respectively.
Table C1: Firm heterogeneity and its robustness to different measures of monetary policy
Panel (a): Wageslog(wageHrw,f,t)
Macro controls Shadow rates MP surprises
(1) (2) (3) (4) (5) (6)
SmallFirmf ×Rt−1 -1.00*** -1.12*** -15.96***(0.153) (0.147) (1.582)
YoungFirmf,t−1 ×Rt−1 -0.37*** -0.42*** -7.09***(0.116) (0.099) (1.358)
Controls Yes‡ Yes‡ Yes Yes Yes Yes
Time FE Yes Yes Yes Yes Yes Yes
Worker FE Yes Yes Yes Yes Yes Yes
Firm FE Yes Yes Yes Yes Yes Yes
N 22,584,310 27,578,607 22,584,310 27,578,607 22,584,310 27,578,607R2 0.83 0.82 0.83 0.82 0.83 0.82
Panel (b): Total hours workedlog(1 + HrsWorkedw,f,t)
Macro controls Shadow rates MP surprises
(1) (2) (3) (4) (5) (6)
SmallFirmf ×Rt−1 -8.47*** -7.63*** -53.66***(0.672) (0.564) (5.831)
YoungFirmf,t−1 ×Rt−1 -4.12*** -4.36*** -47.79***(0.755) (0.662) (9.183)
Controls Yes‡ Yes‡ Yes Yes Yes Yes
Time FE Yes Yes Yes Yes Yes Yes
Worker FE Yes Yes Yes Yes Yes Yes
Firm FE Yes Yes Yes Yes Yes Yes
N 26,919,089 36,078,494 26,919,089 36,078,494 26,919,089 36,078,494R2 0.27 0.25 0.27 0.25 0.27 0.25
Notes: This table shows the robustness to the the worker-level wage analysis of 1 pp increase in the monetary policy rate,as described in Equations 1 and 2 for Panel (a) and (b), respectively. Rt−1 denotes different measures of monetary policy:Columns (1) and (2) use the baseline EONIA rate but in addition to our baseline macro controls (GDP growth in Portugal andthe VIX), we also controls for lagged values of EA GDP growth and inflation (denoted with ‡). Columns (3) and (4) use shadowrate computed by Wu and Xia (2016), and Columns (5) and (6) rely on the index of monetary policy surprises computed byJarocinski and Karadi (2020). SmallFirmf is a dummy that takes a value of 1 if the firm has fewer than 50 employees, and 0otherwise. Young Firmf,t−1 is a dummy that takes a value of 1 if the firm is younger than five years, and 0 otherwise. Controlsdenote additional variation of small (young) firm and GDP and VIX, as well as the polynomial of worker’s age. Standard errorsare two-way clustered at the firm and worker level. ∗ p < 0.10, ∗∗ p < 0.05, ∗∗∗ p < 0.01.
57

Table C2: Credit channel and its robustness to different measures of monetary policy
Panel (a): Wageslog(wageHrw,f,t)
Macro controls Shadow rates MP surprises
(1) (2) (3) (4) (5) (6)
FBCf ×Rt−1 0.70*** 0.68*** 6.79***(0.16) (0.15) (1.85)
BLCHealthf,t−1 ×Rt−1 0.59** 0.56*** 5.43**(0.21) (0.19) (2.55)
Controls Yes‡ Yes‡ Yes Yes Yes Yes
Time FE Yes Yes Yes Yes Yes Yes
Worker FE Yes Yes Yes Yes Yes Yes
Firm FE Yes Yes Yes Yes Yes Yes
N 18,616,412 16,839,851 18,616,412 16,839,851 18,616,412 16,839,851R2 0.79 0.80 0.79 0.80 0.79 0.80
Panel (b): Total hours workedlog(1+ HrsWorkedw,f,t)
Macro controls Shadow rates MP surprises
(1) (2) (3) (4) (5) (6)
FBCf ×Rt−1 2.91*** 2.62*** 19.82***(0.08) (0.66) (7.52)
BLCHealthbf,t−1 ×Rt−1 3.61*** 2.71*** 23.12**(0.16) (0.88) (11.19)
Controls Yes‡ Yes‡ Yes Yes Yes Yes
Time FE Yes Yes Yes Yes Yes Yes
Worker FE Yes Yes Yes Yes Yes Yes
Firm FE Yes Yes Yes Yes Yes Yes
N 22,066,437 19,809,002 22,066,437 19,809,002 22,066,437 19,809,002R2 0.26 0.27 0.26 0.27 0.26 0.27
Notes: This table shows the robustness to the the worker-level wage analysis of 1 pp increase in the monetary policy rate,as described in Equations 1 and 2 for Panel (a) and (b), respectively. Rt−1 denotes different measures of monetary policy:Columns (1) and (2) use the baseline EONIA rate but in addition to our baseline macro controls (GDP growth in Portugal andthe VIX), we also controls for lagged values of EA GDP growth and inflation (denoted with ‡). Columns (3) and (4) use shadowrate computed by Wu and Xia (2016), and Columns (5) and (6) rely on the index of monetary policy surprises computed byJarocinski and Karadi (2020). FBCf denotes the firm balance-sheet channel measure, as described in Equation 5. BLCHealthb
f,t−1
denotes the bank lending channel measure, as described in Equation 7, using the credit-weighted firm-level exposure to thebank lending channel proxied by bank health. Controls denote additional variation of the FBC/BLC measure and GDP andVIX, as well as the polynomial of worker’s age. Standard errors are two-way clustered at the firm and worker level. ∗ p < 0.10,∗∗ p < 0.05, ∗∗∗ p < 0.01.
58