Embed Size (px)
Citation preview

Monday 20 May 2013 – AfternoonGCSE GATEWAY SCIENCEBIOLOGY B
B731/01 Biology modules B1, B2, B3 (Foundation Tier)
F
INSTRUCTIONS TO CANDIDATES
• Write your name, centre number and candidate number in the boxes above. Please write clearly and in capital letters.
• Use black ink. HB pencil may be used for graphs and diagrams only.• Answer all the questions.• Read each question carefully. Make sure you know what you have to do before starting
your answer.• Write your answer to each question in the space provided. Additional paper may be
used if necessary but you must clearly show your candidate number, centre number and question number(s).
• Do not write in the bar codes.
INFORMATION FOR CANDIDATES
• Your quality of written communication is assessed in questions marked with a pencil ( ).• The number of marks is given in brackets [ ] at the end of each question or part
question.• The total number of marks for this paper is 75.• This document consists of 24 pages. Any blank pages are indicated.
* B 7 3 1 0 1 *
OCR is an exempt CharityTurn over
© OCR 2013 [F/601/7586]DC (SJF/CGW) 64200/4
Candidates answer on the Question Paper.A calculator may be used for this paper.
OCR supplied materials:None
Other materials required:• Pencil • Ruler (cm/mm)
THIS IS A NEW SPECIFICATION
*B722290613*
Duration: 1 hour 15 minutes

2
© OCR 2013
Answer all the questions.
SECTION A – Module B1
1 Malaria is a disease caused by a pathogen. The pathogen gets into a person when they are bitten by a mosquito.
(a) Which type of pathogen causes malaria?
Put a ring around the correct answer in this list.
bacteria fungi protozoa viruses [1]
(b) The map shows the areas where mosquitoes that spread malaria live.
It also shows other areas where these mosquitoes may be able to live, if the world’s climate gets warmer.
equator
Key
area where thesemosquitoes live now
other areas where these mosquitoes may alsobe able to live if the world’s climate gets warmer
Describe how the distribution of malaria might change if the world gets warmer.
...................................................................................................................................................
...................................................................................................................................................
.............................................................................................................................................. [2]

3
Turn over© OCR 2013
(c) This headline appeared in a recent newspaper.
‘Scientists have produced an injection that may protect peopleagainst the malaria parasite.‛
Write down the name given to an injection that protects people from a specific pathogen.
.............................................................................................................................................. [1]
[Total: 4]
Question 2 begins on page 4

4
© OCR 2013
2 Conus magus is a large tropical sea snail.
The sea snail feeds on fish.
When the snail detects a fish it fires a hook into it.
(a) What word is used to describe the fish in this action?
Choose your answer from this list.
effector neurone response stimulus
answer .................................................................................................................................. [1]
(b) The hook contains a chemical which slows down the movement of the fish.
Which type of chemical is most likely to have this effect?
Choose your answer from this list.
depressant hallucinogen performance enhancer stimulant
answer .................................................................................................................................. [1]
(c) Scientists are investigating the chemical produced by the snail.
They think that it could be used as a pain killer in humans.
Explain why the drug would have to be tested before it is used on people.
...................................................................................................................................................
...................................................................................................................................................
.............................................................................................................................................. [2]
[Total: 4]

5
© OCR 2013 Turn over for the remainder of question 3
3 Linda has a mass of 60 kg. She wants to find out if she is eating the correct amount of protein. She starts to work out the protein content of all the food she eats in one day.
Food Mass eaten in g
Protein content per 100 g of food
Protein content in Linda’s food
in g
bread 100 7.8 7.8
butter 50 0.6 0.3
egg 50 12.0 6.0
baked potato 200 2.0 ………………
cheese 50 26.0 13.0
chocolate 50 8.0 4.0
chicken 50 21.0 10.5
vegetables 50 0.8 ………………
cake 100 5.0 5.0
total ………………
(a) Is Linda eating the correct amount of protein?
Complete the table and calculate Linda’s estimated average daily requirement of protein (EAR) to help explain your answer.
EAR in g = 0.6 × body mass in kg
...................................................................................................................................................
.............................................................................................................................................. [3]
(b) Linda is twenty years old.
Her cousin Sue is thirteen years old and has the same mass as Linda.
Suggest why Sue needs more protein than Linda needs.
...................................................................................................................................................
.............................................................................................................................................. [1]

6
© OCR 2013
(c) Three of Linda’s friends do not eat meat.
Suggest how these friends can still achieve a balanced diet.
...................................................................................................................................................
.............................................................................................................................................. [2]
[Total: 6]

7
Turn over© OCR 2013
4 Sweat glands in the skin release sweat.
(a) Why does the body release sweat?
.............................................................................................................................................. [1]
(b) Some people sweat too much.
This is called hyperhidrosis.
Scientists have discovered that this is a genetic disorder.
(i) Gemma’s cells contain the gene that causes h yperhidrosis.
Write about where in cells genes are found.
...........................................................................................................................................
...................................................................................................................................... [2]
(ii) Gemma can not pass on hyperhidrosis to her friends.
Explain why.
...........................................................................................................................................
...........................................................................................................................................
...................................................................................................................................... [2]
[Total: 5]

8
© OCR 2013
5 Singapore is a small country.
Everyone living in Singapore was offered a health check to test for three conditions.
They were tested:
• for high blood pressure • for high levels of blood cholesterol • to see if they failed to respond to insulin.
The check found that one million people had at least one of these conditions.
The pie chart shows the results for these one million people.
all threeconditions
3%
only fails torespond to insulin
8%
high bloodpressure only
33%
high bloodcholesterol only
27%
any twoconditions
29%
The government is worried that large numbers of people may develop serious diseases.
Use the data and your biological knowledge to explain why the government is worried. In your answer, include the links between the conditions tested for and the diseases they may
cause. Include calculations to support your answer.
The quality of written communication will be assessed in your answer to this question.
..........................................................................................................................................................
..........................................................................................................................................................
..........................................................................................................................................................
..........................................................................................................................................................
..........................................................................................................................................................
..........................................................................................................................................................
..........................................................................................................................................................
..........................................................................................................................................................
..........................................................................................................................................................
..................................................................................................................................................... [6]
[Total: 6]

9
© OCR 2013 Turn over for the remainder of question 6
SECTION B – Module B2
6 (a) Look at the woodland food web.
wolf spider
dead leaves
beetle larva
woodlousesnail millipedeearwig
ground beetle
(i) The woodlouse and earwig are in the same trophic level.
What is a trophic level?
...................................................................................................................................... [1]
(ii) The woodlouse and earwig live in the same habitat.
Food is one resource they compete for.
Write down one other resource they might compete for.
...................................................................................................................................... [1]
(iii) The ground beetle is a predator of the earwig and millipede.
Explain what would happen to the population of earwigs in this food web if all the millipedes were killed by a disease.
...........................................................................................................................................
...................................................................................................................................... [2]

10
© OCR 2013
(b) Look at one food chain in this web.
dead leaves snail beetle larva wolf spider
A survey was done to find the numbers in this food chain.
The results are shown in the table.
Organism in food chain
Number found in 1 m2
Sample 1 Sample 2 Sample 3 Mean
dead leaves 31 29 36 ……………
snails 9 12 12 11
beetle larvae 6 9 9 8
wolf spiders 5 4 6 5
(i) Calculate the mean number for dead leaves.
Show your working below and write your answer in the table.
[2]
(ii) Use the completed table to help you decide which of the statements are true for this food chain.
Put ticks (✓) in the boxes next to the two correct statements.
A normal shaped pyramid of numbers is produced.
An upside down pyramid of numbers is produced.
Dead leaves do not contain energy from the Sun.
Energy flow from the Sun supports this food chain.
Energy from the Sun will not flow any further than the snail. [2]
11
Turn over© OCR 2013
(c) (i) The plants in this food web are dead.
If they are not eaten by the animals they decay.
Name a type of organism that causes decay?
...................................................................................................................................... [1]
(ii) During decay, nitrogen compounds are broken down.
What is the percentage of nitrogen in the atmosphere?
Put a ring around the correct answer.
0.04% 1% 21% 58% 78% 95% [1]
[Total: 10]
Question 7 begins on page 12
12
© OCR 2013
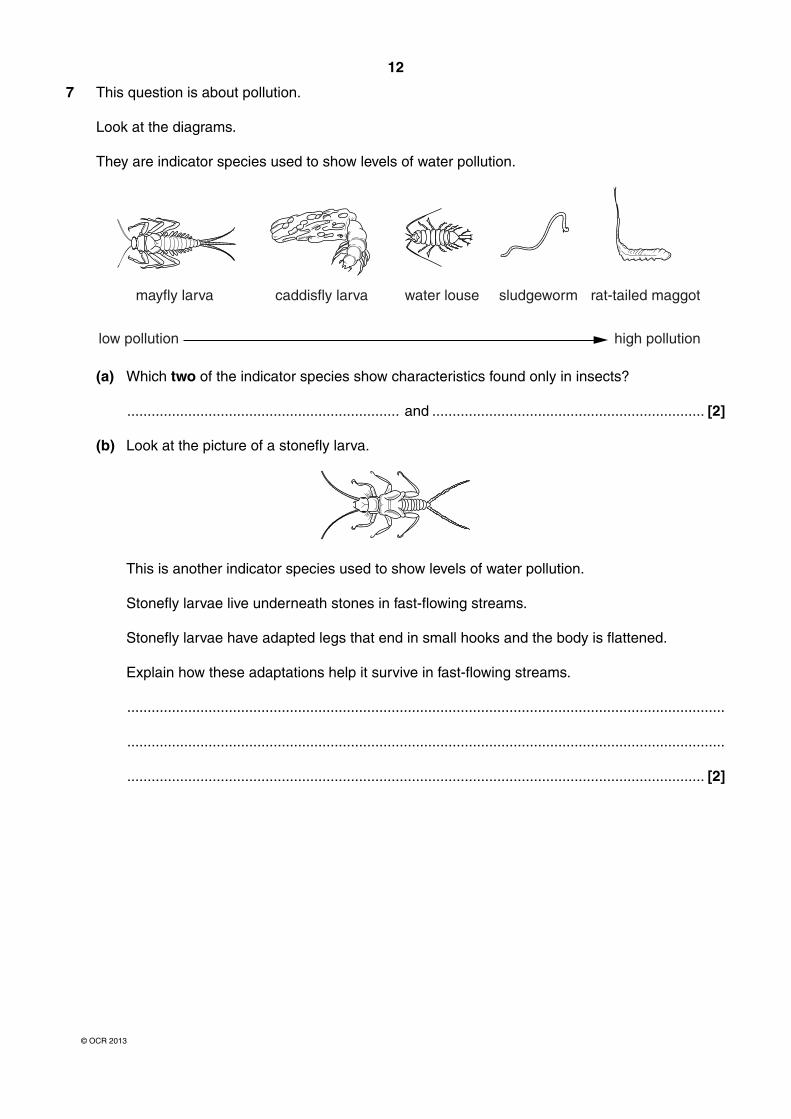
7 This question is about pollution.
Look at the diagrams.
They are indicator species used to show levels of water pollution.
mayfly larva
low pollution high pollution
caddisfly larva water louse sludgeworm rat-tailed maggot
(a) Which two of the indicator species show characteristics found only in insects?
................................................................... and ................................................................... [2]
(b) Look at the picture of a stonefly larva.
This is another indicator species used to show levels of water pollution.
Stonefly larvae live underneath stones in fast-flowing streams.
Stonefly larvae have adapted legs that end in small hooks and the body is flattened.
Explain how these adaptations help it survive in fast-flowing streams.
...................................................................................................................................................
...................................................................................................................................................
.............................................................................................................................................. [2]

13
Turn over© OCR 2013
(c) The County Council want to find out pollution levels in a local stream.
Water samples were taken downstream from three different places:
• a country park • a housing estate • a factory.
The indicator species were measured in each sample.
Results were plotted on a graph.
120
100
80
60biomass
in g
total biomass (in g) downstreamfrom country park
total biomass (in g) downstreamfrom housing estate
total biomass (in g) downstreamfrom factory
40
20
waterlouse
sludge-worm
species
mayflylarva
rat-tailmaggot
0
Should the County Council be concerned about levels of pollution downstream from the factory?
Use evidence from the graph and your knowledge of indicator species in your answer.
The quality of written communication will be assessed in your answer to this question.
...................................................................................................................................................
...................................................................................................................................................
...................................................................................................................................................
...................................................................................................................................................
...................................................................................................................................................
...................................................................................................................................................
...................................................................................................................................................
...................................................................................................................................................
...................................................................................................................................................
.............................................................................................................................................. [6][Total: 10]

14
© OCR 2013
8 The picture shows a right whale.
Biologists have measured the population of right whales in an area of the North Atlantic during five separate months.
They also measured the amount of food available in that area.
Results were plotted on the graph.
June0.0
0.2
0.4
0.6
0.8
1.0
July August
month
relative scale
September October
whale food
whales
(a) (i) Look at the number of whales in September and August.
How many times bigger is the relative number of right whales in September compared to August?
...........................................................................................................................................
...................................................................................................................................... [1]

15
Turn over© OCR 2013
(ii) Look at the patterns in the data.
Explain the change in the numbers of right whales found in the area of the North Atlantic between August and October.
...........................................................................................................................................
...........................................................................................................................................
...........................................................................................................................................
...................................................................................................................................... [2]
(b) Over millions of years right whales evolved to be very slow moving, filter feeders.
They had no predators.
Over the past thousand years, humans have changed their environment.
Suggest reasons why the right whales are in danger of becoming extinct in their current environment.
...................................................................................................................................................
...................................................................................................................................................
.............................................................................................................................................. [2]
[Total: 5]

16
© OCR 2013
SECTION C – Module B3
9 Amy and Sarah are identical twins.
Their development began when an egg cell and sperm cell joined to form a zygote.
The zygote developed into an embryo made of many cells.
After about a week the embryo split into the two twin embryos.
The two embryos grew to become Amy and Sarah.
+
zygote
eggsperm
embryo
twin embryos
(a) What is it called when an egg cell and a sperm cell join?
Choose from
cloning contraction fertilisation mutation
answer ................................................................................................................................. [1]
(b) Put one tick (✓) in each row of the table to show which cells are haploid and which are diploid.
Haploid Diploid
egg cell
sperm cell
zygote
cells in embryo
cells in twin embryos [2]

17
Turn over© OCR 2013
(c) What type of cell division happens to the zygote to form the embryo?
.............................................................................................................................................. [1]
(d) When an embryo grows, one of the first organs to form is the heart.
(i) What is the job of the heart?
...........................................................................................................................................
...................................................................................................................................... [2]
(ii) The heart cells develop from stem cells by a process called cell differentiation.
What is meant by cell differentiation?
...........................................................................................................................................
...................................................................................................................................... [1]
(e) As they are identical twins, Amy and Sarah look more like each other than non-identical twins.
Explain why identical twins look so similar.
...................................................................................................................................................
...................................................................................................................................................
.............................................................................................................................................. [2]
[Total: 9]

18
© OCR 2013
10 The graph shows average height growth curves for girls and boys in the USA.
2 480
90
100
110
120
130
140
150
160
170
180 boys
190
200
heightin cm
6 8 10 12
age in years
14 16 18 20
boys
girlsgirls

19
Turn over© OCR 2013
(a) Read what the students say about the graph.
The graph shows thatgirls grow taller than
boys.
The graph shows thatboys grow taller than
girls.
The graph shows thatthere is no difference inthe height that girls and
boys grow to.
John Abi Ahmed
Who has made the correct statement? .....................................................................................
Explain your answer, using data from the graph.
...................................................................................................................................................
.............................................................................................................................................. [2]
(b) Have the girls and boys stopped growing in height after 20 years?
Use the graph to explain your answer.
...................................................................................................................................................
...................................................................................................................................................
...................................................................................................................................................
.............................................................................................................................................. [2]
(c) During growth, different types of protein are made and used.
Write down two types of protein that do different jobs and describe the job of each protein during growth.
1 ................................................................................................................................................
...................................................................................................................................................
...................................................................................................................................................
2 ................................................................................................................................................
...................................................................................................................................................
...................................................................................................................................................[4]
[Total: 8]

20
© OCR 2013
11 Bulldogs have been produced by selective breeding to have a large head and a flat face.
(a) The ancestors of bulldogs did not have such a large head or flat face.
Describe how selective breeding was used to produce bulldogs.
The quality of written communication will be assessed in your answer to this question.
...................................................................................................................................................
...................................................................................................................................................
...................................................................................................................................................
...................................................................................................................................................
...................................................................................................................................................
...................................................................................................................................................
...................................................................................................................................................
...................................................................................................................................................
...................................................................................................................................................
.............................................................................................................................................. [6]
21
© OCR 2013
(b) The features of the bulldog can cause health problems.
The large head means that many bulldogs have to be born by a Caesarean operation where the mother has to be cut open.
The flat face often causes it to have breathing problems.
Some people think that breeding bulldogs should be banned because of these health problems.
Write about whether breeding bulldogs should be banned or not.
In your answer use information from the question as well as your own knowledge and ideas.
...................................................................................................................................................
...................................................................................................................................................
...................................................................................................................................................
.............................................................................................................................................. [2]
[Total: 8]
END OF QUESTION PAPER

22
© OCR 2013
BLANK PAGE
PLEASE DO NOT WRITE ON THIS PAGE

23
© OCR 2013
BLANK PAGE
PLEASE DO NOT WRITE ON THIS PAGE

24
© OCR 2013
PLEASE DO NOT WRITE ON THIS PAGE
Copyright Information
OCR is committed to seeking permission to reproduce all third-party content that it uses in its assessment materials. OCR has attempted to identify and contact all copyright holders whose work is used in this paper. To avoid the issue of disclosure of answer-related information to candidates, all copyright acknowledgements are reproduced in the OCR Copyright Acknowledgements Booklet. This is produced for each series of examinations and is freely available to download from our public website (www.ocr.org.uk) after the live examination series.
If OCR has unwittingly failed to correctly acknowledge or clear any third-party content in this assessment material, OCR will be happy to correct its mistake at the earliest possible opportunity.
For queries or further information please contact the Copyright Team, First Floor, 9 Hills Road, Cambridge CB2 1GE.
OCR is part of the Cambridge Assessment Group; Cambridge Assessment is the brand name of University of Cambridge Local Examinations Syndicate (UCLES), which is itself a department of the University of Cambridge.