Embed Size (px)
Citation preview

Report No. MERL-2013-63
Moisture Content Requirements for Repair, Part 1: Concrete Repair Testing Science and Technology Project ID: 6629

Mission Statements The mission of the Department of the Interior is to protect and provide access to our Nation’s natural and cultural heritage and honor our trust responsibilities to Indian Tribes and our commitments to island communities. The mission of the Bureau of Reclamation is to manage, develop, and protect water and related resources in an environmentally and economically sound manner in the interest of the American public.

Table of contents
Background .....................................................................................................................1
Objective and Scope of the Project ...............................................................................3
Task 1 Description and Methodology ...........................................................................4
Test results ................................................................................................................... 12
Conclusion .................................................................................................................... 38
Bibliography .................................................................................................................. 39
Reference standards .................................................................................................... 39

Acronyms, Abbreviations, and Definitions ° C degree Celcius ° F degree Fahrenheit % percent ACI American Concrete Institute ASTM American Society for Testing and Materials COV (%) coefficient of variation, percent fc x-d compressive strength at x days’ age h hour in inch kg/m3 kilogram per cubic meter L/m3 liters per cubic meter lb/ft3 pound per cubic foot lb/yd3 pound per cubic yard MERL Bureau of Reclamation’s Materials Engineering and Research Laboratory mm millimeters MPa megapascal oz/yd3 ounces per cubic yard mL/m3 milliliters per cubic meter psi pounds per square inch RH relative humidity

RILEM Réunion Internationale des Laboratoires et Experts des Matériaux, systèmes de construction et ouvrages (International Union of Laboratories and Experts in Construction Materials, Systems and Structures) SSD saturated surface sry Std. Deviation standard deviation w/c water to cement or cementitious materials ratio

Background Repair and strengthening of existing concrete structures is among the biggest challenges the industrial countries will have to face in the years to come. Moreover, the number of aged concrete structures keeps growing and therefore the needs for effective repair, retrofitting and strengthening are increasing. Among different approaches being considered for the rehabilitation needs, concrete surface repairs and bonded overlays are often the most used economical solutions.
Despite extensive use of surface repairs and overlays in rehabilitation of existing concrete structures over the last 25 years, failures are still often observed in practice. Irrespective of the methods selected, a fundamental requirement for successful repair is the achievement of strong and durable bond between the repair and the existing concrete substrate. Monolithic isotropic action of the repaired structure is a prerequisite for withstanding the imposed loads and resisting the various concrete deterioration processes. The strength and integrity of the bond depend upon the properties and characteristics of the repair material, but also to a significant extent upon preparation and conditioning of the surface to be repaired.
Concrete repair and rehabilitation commonly involve removing unsound concrete before the placement of a repair material. Regardless of the quality of repair or overlay material used and application method employed, the care with which the concrete substrate is prepared and conditioned prior to application of repair material will often determine whether a repair project will be a success or a failure. The surface preparation for repair affects the strength and durability of the bond between the “old” and “new”, between the existing concrete and repair material. Surface preparation and moisture conditioning of the concrete substrate are generally considered to be two of the most influential steps in concrete repair works. A poorly prepared substrate will always be the weak link in a composite repair system, no matter how good the existing concrete and the repair material might be. Concrete repair and bonded overlay are composite material systems. In such composites, the bond between the individual components is most critical for overall viability. The durability of the bond in repair or overlay systems can be defined as the lasting interfacial integrity of existing concrete and repair material. Of course, it is realized that high initial bond (short term) strength does not guarantee durability, but low initial bond may be a cause for debonding in service. Therefore, assuming all properties of the substrate and repair material are adequate, any improvement of the bond will result in improved properties and long-term performance of the entire composite system.

Development and magnitude of interface bond strength and durability greatly depend on concrete substrate surface preparation and moisture condition prior to repair / overlay application. For this very critical parameter, quite limited reliable guidance is available for the designer and practitioner. Design specifications and guidelines are commonly very primitive and usually restricted to substrate concrete removal and cleaning methods and mechanical bond strength at 28 days – a short-term property. The moisture condition of the substrate, which is important for bond development, and therefore proves to be a crucial indicator of repair / overlay durability, are not addressed at all, or addressed without any due consideration to the given substrate characteristics. The influence of surface moisture on the bond between old concrete and repair is an issue of significant importance. Saturated surface dry (SSD) conditioning of the substrate prior to application of cementitious repair materials is usually recommended and used, which underlies the “layman’s” instinctive solution to avoid problems rather than achieve the most effective bond. But after all, there is no clear physical meaning defining the SSD condition, neither qualitatively nor quantitatively. There exists no strict definition of what actually is SSD: saturation to what degree, to what depth, how to measure it, etc. The need for reliable practical recommendations regarding surface conditioning of concrete substrate prior to repair and overlay has been recognized by researchers and practitioners (1), (2), (3). It is crucial to understand that the in-situ performance of repairs and overlays is not only dependent on the material components and how the composite system, as a whole, respond to loads and environmental influences, but also to a large degree on the processes involved in the formation of the interface between the existing concrete and the repair material. In particular, the moisture condition of the substrate surface influences mass transport between the two phases forming the repair composite system. Literature survey results allow for the conclusion that each given combination of existing concrete substrate and repair material has specific moisture conditions at the time of placement. Mechanical adhesion in concrete members repaired or overlaid with cement-based materials relies on the hardening of the semi-liquid mixture inside the open cavities and asperities (open pores) of the substrate surface and the physical anchorage resulting from it. Capillary absorption plays an important role in the anchorage effect as it draws the cement paste from the material mixture into the substrate, which is strongly influenced by surface moisture condition. The substrate moisture condition may have a significant influence on bond strength and durability. A very dry “thirsty” concrete surface tends to “suck” water from the repair material, which may have negative and positive effects on bond depending upon the magnitude of “suction” and amount of available moisture in repair material. A surface, which is too wet, may dilute the repair material at the interface. To improve the performance of composite concrete repair systems, and the bond at the interface in particular, it is essential to gain a better understanding of the different transport processes between the semi-liquid repair material and solid concrete substrate.

The moisture transport mechanisms are controlled by two underlying phenomena: absorption and adsorption. Absorption describes processes, such as capillary suction and osmosis, that may draw water into concrete substrate. Adsorption processes, which result from a range of physical surface properties and phenomena at the microstructural level, can affect the prepared concrete substrate moisture condition. Adsorption may in fact prevent (temporarily or permanently) water from moving into the concrete. Another important factor with regards to moisture transport mechanisms is water movement between the substrate and the repair material driven by thermal gradients: water will tend to move from warmer parts of the composite to the colder ones. As a result, this can increase the water to cementitious material (w/c) ratio, which may negatively affect the bond strength and durability.
Objective and Scope of the Project The main objective of the study is to establish the optimum concrete substrate moisture condition prior to repair / overlay application to improve bond in composite repair systems. For concrete repairs and overlays, bond strength is commonly defined as “the tensile strength perpendicular to the interface plane” and is usually evaluated using pull-off tests. However, shear stresses parallel to the interface can be equally important. Consequently, the bond strength in shear is a significant factor in composite repair systems. Hence, in addition to pull off tests, shear bond (torque) tests were performed on the test slabs (9 shear tests per slab) using the pulling device used for pull-off tests, but equipped with a special adapter for torque testing. The specific objectives of the required testing and study are:
• To gain a better understanding of the transport mechanisms between repair materials and concrete substrates and the effects of the moisture state of the substrate on bond development.
• To develop a field method to evaluate quantitatively the actual moisture condition of concrete, which may allow for the determination of optimum conditions for a given concrete substrate
• To evaluate this method in the laboratory and under field conditions to determine its reliability, applicability and performance characteristics.
• To evaluate the effect of repair materials upon moisture conditioning of the substrate to achieve the optimum bond.
• To issue recommendations for the optimum moisture conditioning of concrete substrates and identify the needs for future testing in this area.
The overall study consists of four (4) tasks (making concrete test slabs at 2 locations, performing repairs at different surface moisture conditions, performing bond tests, and compiling results)

which will extend over a three-year period. In this report, experimental results in Task 1 are presented.
Task 1 Description and Methodology The scope of this task reported herein was to perform pull-off and shear tests on precast concrete slabs (48×20×5 in.) overlaid with cement-based repair materials. The variables studied in the test program were the following:
• Substrate concrete strength (3 cement-based concrete mixtures); • Moisture conditioning of the substrate at the time of repair (3 levels of surface
humidity); • Repair material (2 cement-based repair concrete mixtures).
Before undertaking Task 1, twenty-five (25) concrete test slabs were cast on April 6 and April 19, 2012 using three different concrete mixtures:
• 3000-psi concrete (6 test slabs); • 5000-psi concrete with 20 percent (%) fly ash (13 test slabs); • 7000-psi silica fume (8 %) concrete (6 test slabs).
The tests slabs were stored in the 73 °Fahrenheit (F) (23 °Celcius (C)) and 50 % Relative Humidity (RH) conditioning room until May 1st, 2013. After one full year of conditioning, nineteen (19) of the test slabs (6 slabs from the 3000-psi series; 7 slabs from the 5000-psi series; 6 slabs from the 7000-psi series) were overlaid with a 2-in. layer of either one of the following cement-based repair materials:
• 5000-psi concrete mixture with 20 % fly ash (ready-mix concrete delivered on site);
• BASF Zero C extended mortar (proprietary material mixed on site).
The overall test program conducted as part of Task 1 is summarized in Table 1, where each test slab subset is identified using the following key:
MC – X – Y – Repair material
with X, Y and Repair material taking the following values:
X: 3 (3000-psi concrete); 5 (5000-psi concrete); 7 (7000-psi concrete);
Y: 0 (0-h long ponding); 1 (1-h long ponding); 6 (6-h long ponding);

Repair material: CON (5000-psi concrete with 20% fly ash); BASF (BASF Zero C extended mortar).
For example, the MC-3-1-BASF slab is a 3000-psi test slab that was ponded for 1 hour (h) and repaired with the BASF extended mortar. For one combination (MC-5-6-CON), two (2) tests slabs were prepared, the second one being identified by the suffix (1). The same key will be used throughout this data report. Prior to the repair material placement, each of the test slab series were conditioned in such a way to have three slab subsets with different moisture content at the surface. Based upon results generated in a previous study (4), three surface ponding durations were selected:
• 0 hour (no ponding / equilibrium water content at 50 % RH); • 1 hour; • 6 hours.
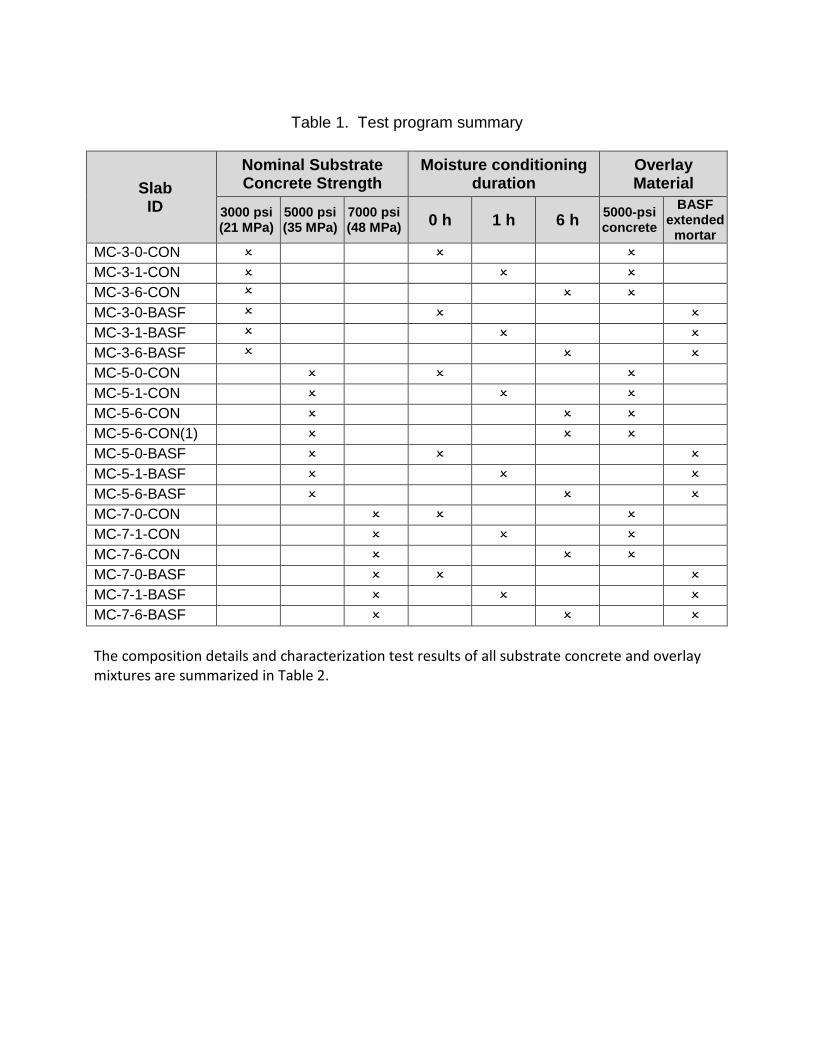
Table 1. Test program summary
Slab ID
Nominal Substrate Concrete Strength
Moisture conditioning duration
Overlay Material
3000 psi (21 MPa)
5000 psi (35 MPa)
7000 psi (48 MPa) 0 h 1 h 6 h 5000-psi
concrete BASF
extended mortar
MC-3-0-CON MC-3-1-CON MC-3-6-CON MC-3-0-BASF MC-3-1-BASF MC-3-6-BASF MC-5-0-CON MC-5-1-CON MC-5-6-CON MC-5-6-CON(1) MC-5-0-BASF MC-5-1-BASF MC-5-6-BASF MC-7-0-CON MC-7-1-CON MC-7-6-CON MC-7-0-BASF MC-7-1-BASF MC-7-6-BASF The composition details and characterization test results of all substrate concrete and overlay mixtures are summarized in Table 2.

Table 2. Substrate and overlay mixtures
Constituent Quantity Standard1 Concrete Mixture 3000 psi 5000 psi 7000 psi
Cement lb/yd3 (kg/m3) ASTM C 150 470 (279) 528 (313) 689 (409)
Fly Ash lb/yd3 (kg/m3) ASTM C 618 0 (0) 132 (78) 122 (72)
Coarse Aggregate lb/yd3 (kg/m3) ASTM C 33 (#57/67 - 3/4") 1788 (1061) 1812 (1075) 1646 (977)
Fine Aggregate lb/yd3 (kg/m3) ASTM C 33 (sand) 1295 (768) 1111 (66) 1192 (707)
AEA oz/yd3 (mL/m3) ASTM C 260 3.2 (126) 3.2 (126) 3.5 (137)
Low-Range WRA oz/yd3 (L/m3) ASTM C 494 (Type A) 0 (0) 0 (0) 48.6 (1.91)
Mid-Range WRA oz/yd3 (L/m3) ASTM C 494 (Type A/F) 18.8 (0.74) 39.6 (1.55) 81 (3.18)
High-Range WRA oz/yd3 (L/m3) ASTM C 494 (Type F) 0 (0) 0 (0) 0 (0)
Water lb/yd3 (kg/m3) Potable Water 273 (162) 257 (152) 243 (144)
Specifications Air Content (%) ASTM C 231 4 - 7 4 - 7 4 - 7 w/cm Ratio - 0.58 0.39 0.30 Slump in (mm) ASTM C 143 4 (100) 4 (100) 4 (100) Unit Weight lb/ft3 (kg/m3) ASTM C 138 141.2 (2262) 141.7 (2270) 143.6 (2301) Fine/coarse Agg. Ratio - 0.42 0.38 0.42
Characterization Compressive strength ASTM C 39
fc 4-d substrate repair psi (MPa)
- 3495
- (24.1)
fc 7-d substrate repair psi (MPa)
4065 3795
(28.0) (26.2)
fc 28-d substrate repair psi (MPa) 4845
- (33.4)
- 5615 5350
(38.7) (37.9)
7425 -
(51.2) -
fc 56-d substrate repair psi (MPa) 5700
- (39.3)
-
Two methods assessed in a previous study (5) were used to evaluate the moisture content on the surface of the concrete substrate at the time of repair overlay placement on all 19 slabs, namely an electrical impedance surface meter and embedded relative humidity probes (RH meters), as shown in Figure 1. Measurements were performed at different key moments. Moisture contents recorded in the various slabs prior to moisture treatment, right after the
1 See Reference standards in Section 7

moisture treatments, at the time of overlay placement and at the time of bond testing are summarized in Table 3.
Figure 1. Devices used to monitor the moisture condition in the surface layer of the
concrete specimens: a) electrical impedance surface moisture meter; b) embedded relative humidity probes
a) b)

Table 3. Moisture conditioning test results
Slab ID
Moisture condition Electrical Impedance
Method (device reading units)
RH Probe
Percent (%) Prior to
moisture treatment
After moisture treatment
At time of overlay
placement
Prior to moisture treatment
After moisture treatment
At time of overlay
placement
At time of bond
testing MC-3-0-CON 1.1 1.0 0.5 50 67 66 79 MC-3-1-CON 2.5 6.9 1.1 50 67 75 80 MC-3-6-CON 2.3 6.9 1.4 50 73 72 80 MC-3-0-BASF 0.5 0.5 n/a 50 64 n/a n/a MC-3-1-BASF 2.0 6.9 0.5 50 n/a n/a n/a MC-3-6-BASF 1.8 6.1 0.5 50 73 n/a n/a MC-5-0-CON 1.9 0.6 0.4 50 61 60 78 MC-5-1-CON 2.0 5.4 0.9 50 63 64 76 MC-5-6-CON 2.1 6.9 0.8 50 69 73 80 MC-5-6-CON(1) 1.7 6.9 0.3 50 68 80 n/a MC-5-0-BASF 1.8 0.5 n/a 50 62 n/a n/a MC-5-1-BASF 1.9 6.9 0.5 50 n/a n/a n/a MC-5-6-BASF 1.8 1.4 0.8 50 n/a n/a n/a MC-7-0-CON 2.5 1.1 0.7 50 62 61 76 MC-7-1-CON 2.4 6.9 0.9 50 57 61 82 MC-7-6-CON 2.2 6.9 1.0 50 67 68 80 MC-7-0-BASF 2.3 0.5 n/a 50 63 n/a n/a MC-7-1-BASF 2.7 6.9 0.9 50 60 n/a n/a MC-7-6-BASF 2.8 6.4 0.8 50 n/a n/a n/a
After overlays (repairs) were placed on test slabs by MERL personnel and cured for a period ranging between 28 and 56 days, pull off bond and shear bond testing were performed on 19 concrete slabs at MERL in Denver. Bond testing of each slab consisted generally of nine (9) pull off tests and nine (9) shear tests, distributed in accordance with the layout shown in Figure 2. Overall, a total of 347 tests (174 pull off bond tests, 173 shear bond tests) were performed. The task was carried out within a two-week period early in May 2013. All work was accomplished with MERL personnel present. Photographs displayed in Figures 2 to 6 show the various operations involved in the bond testing program.

Figure 2. Experimental bond testing preparation (coring template and jig assembly)
Figure 3. Cored test slab prior to bond testing
(single coring: tensile bond; dual coring: shear bond)

Figure 4. Direct tension bond testing (tensile bond) procedure

Figure 5. Torque bond testing (shear bond) procedure
a) b) Figure 6. Bond test specimens after failure : a) direct tension loading; b) torque loading As a third-party collaborator, the U.S. Navy intended to perform similar experiments (complementary program) at their facility using their staff and provide MERL with test results in order to add them to the body of data generated at MERL. However, the test program planned at the Navy could not be performed within the Task 1 schedule.
Test results The test results generated as part of Task 1 are summarized in Tables 4 to 22 and in bar charts of Figures 7 to 12.

Table 4. Bond Test Results: Slab MC-3-0-CON Shear bond strength - Slab MC-3-0-CON
Core # Bond strength Failure mode Observations
(psi) (MPa) 1 Interface debonding while drilling. 3 184.2 1.27 substrate 5 276.3 1.91 substrate/repair 7 Interface debonding while drilling. 9 83.7 0.58 interface
11 200.9 1.39 substrate 13 163.2 1.13 substrate 15 125.5 0.87 substrate/int 17 142.3 0.98 susbtrate
Average 168.0 1.16 Repair (%)* 14.3 Std. Deviation 61.5 0.42 Interface (%) 28.6 COV (%) 36.6 Substrate (%) 57.1 * Percent bond failure in the repair material, at the interface, or in the surbtrate. Pull off bond strength - Slab MC-3-0-CON
Core # Bond strength Failure mode Observations
(psi) (MPa) 2 311.6 2.15 substrate 4 168.5 1.16 interface 6 241.6 1.67 interface 8 219.4 1.51 interface Epoxy failure on 1st attempt (4.7 kN).
10 257.5 1.78 substrate 12 257.5 1.78 interface 14 120.8 0.83 interface 16 206.7 1.43 interface 18 292.5 2.02 interface
Average 230.7 1.59 Repair (%) 0.0 Std. Deviation 59.8 0.41 Interface (%) 77.8 COV (%) 25.9 Substrate (%) 22.2

Table 5. Bond Test Results: Slab MC-3-1-CON Shear bond strength - Slab MC-3-1-CON
Core # Bond strength Failure mode Observations
(psi) (MPa) 1 92.0 0.63 substrate/int 3 133.9 0.92 substrate/repair 5 Interface debonding while drilling. 7 92.0 0.63 interface 9 163.2 1.13 substrate/int
11 Coring not deep enough. 13 180.0 1.24 substrate 15 154.9 1.07 substrate 17 159.0 1.10 substrate
Average 139.3 0.96 Repair (%) 14.3 Std. Deviation 35.0 0.24 Interface (%) 42.9 COV (%) 25.1 Substrate (%) 42.9
Pull off bond strength - Slab MC-3-1-CON
Core # Bond strength Failure mode Observations
(psi) (MPa) 2 235.3 1.62 interface 4 317.9 2.19 repair 6 165.3 1.14 interface 8 289.3 2.00 substrate
10 257.5 1.78 interface 12 267.1 1.84 substrate 14 327.5 2.26 repair 16 286.1 1.97 substrate 18 225.7 1.56 interface
Average 263.5 1.82 Repair (%) 22.2 Std. Deviation 50.2 0.35 Interface (%) 44.4 COV (%) 19.0 Substrate (%) 33.3

Table 6. Bond Test Results: Slab MC-3-6-CON Shear bond strength - Slab MC-3-6-CON
Core # Bond strength Failure mode Observations
(psi) (MPa) 1 163.2 1.13 substrate/repair 3 251.2 1.73 substrate 5 159.0 1.10 substrate 7 146.5 1.01 substrate 9 200.9 1.39 substrate
11 Interface debonding while drilling. 13 Interface debonding while drilling. 15 163.2 1.13 substrate 17 96.2 0.66 substrate
Average 168.6 1.16 Repair (%) 14.3 Std. Deviation 47.8 0.33 Interface (%) 0.0 COV (%) 28.4 Substrate (%) 85.7
Pull off bond strength - Slab MC-3-6-CON
Core # Bond strength Failure mode Observations
(psi) (MPa) 2 317.9 2.19 substrate 4 330.6 2.28 substrate 6 324.3 2.24 substrate 8 337.0 2.32 substrate
10 289.3 2.00 substrate 12 356.1 2.46 substrate 14 298.9 2.06 repair 16 302.0 2.08 substrate 18 362.4 2.50 substrate
Average 324.3 2.24 Repair (%) 11.1 Std. Deviation 25.2 0.17 Interface (%) 0.0 COV (%) 7.8 Substrate (%) 88.9

Table 7. Bond Test Results: Slab MC-3-0-BASF Shear bond strength - Slab MC-3-0-BASF
Core # Bond strength Failure mode Observations (psi) (MPa)
2 184.2 1.27 substrate 4 255.3 1.76 substrate 6 167.4 1.15 substrate 8 209.3 1.44 substrate
10 242.8 1.67 substrate 12 318.2 2.19 substrate/int 14 251.2 1.73 substrate 16 263.7 1.82 substrate 18 293.0 2.02 substrate
Average 242.8 1.67 Repair (%) 0.0 Std. Deviation 48.9 0.34 Interface (%) 22.2 COV (%) 20.1 Substrate (%) 88.9
Pull off bond strength - Slab MC-3-0-BASF
Core # Bond strength Failure mode Observations (psi) (MPa)
1 330.6 2.28 repair 3 302.0 2.08 substrate 5 321.1 2.21 substrate 7 340.2 2.35 substrate 9 257.5 1.78 substrate
11 311.6 2.15 substrate 13 337.0 2.32 substrate 15 270.2 1.86 substrate 17 330.6 2.28 substrate
Average 311.2 2.15 Repair (%) 0.0 Std. Deviation 29.6 0.20 Interface (%) 11.1 COV (%) 9.5 Substrate (%) 88.9
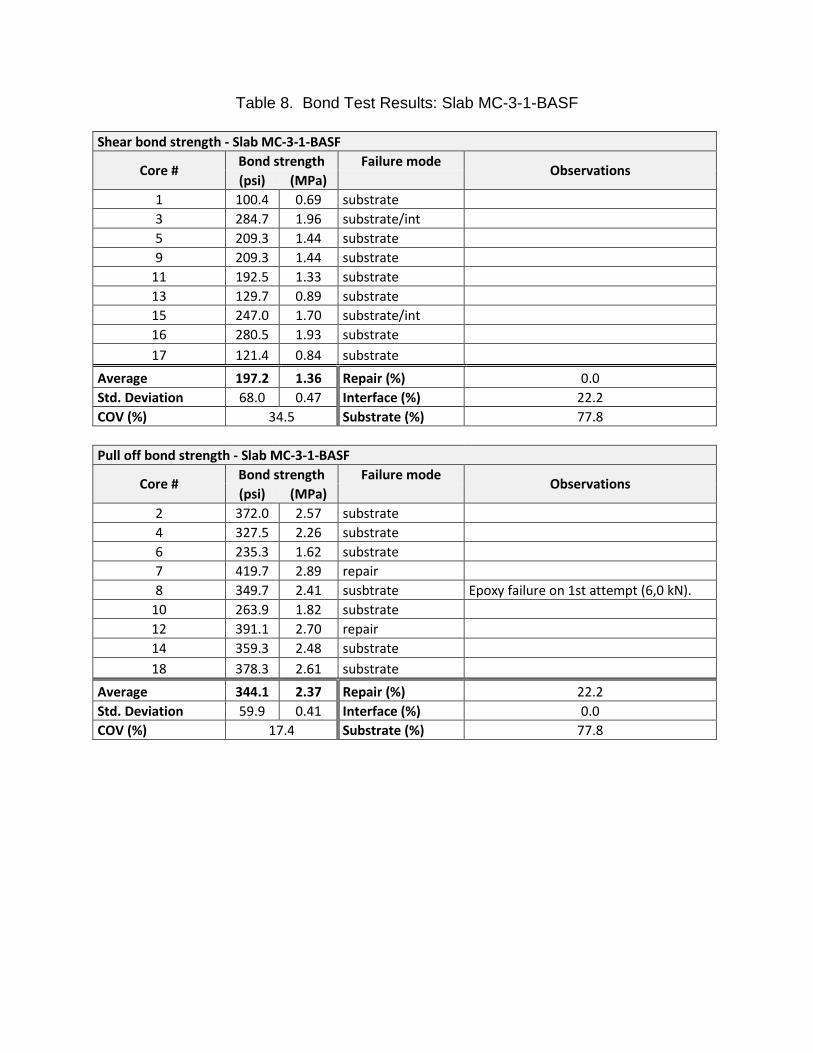
Table 8. Bond Test Results: Slab MC-3-1-BASF Shear bond strength - Slab MC-3-1-BASF
Core # Bond strength Failure mode Observations (psi) (MPa)
1 100.4 0.69 substrate 3 284.7 1.96 substrate/int 5 209.3 1.44 substrate 9 209.3 1.44 substrate
11 192.5 1.33 substrate 13 129.7 0.89 substrate 15 247.0 1.70 substrate/int 16 280.5 1.93 substrate 17 121.4 0.84 substrate
Average 197.2 1.36 Repair (%) 0.0 Std. Deviation 68.0 0.47 Interface (%) 22.2 COV (%) 34.5 Substrate (%) 77.8
Pull off bond strength - Slab MC-3-1-BASF
Core # Bond strength Failure mode Observations (psi) (MPa)
2 372.0 2.57 substrate 4 327.5 2.26 substrate 6 235.3 1.62 substrate 7 419.7 2.89 repair 8 349.7 2.41 susbtrate Epoxy failure on 1st attempt (6,0 kN).
10 263.9 1.82 substrate 12 391.1 2.70 repair 14 359.3 2.48 substrate 18 378.3 2.61 substrate
Average 344.1 2.37 Repair (%) 22.2 Std. Deviation 59.9 0.41 Interface (%) 0.0 COV (%) 17.4 Substrate (%) 77.8

Table 9. Bond Test Results: Slab MC-3-6-BASF Shear bond strength - Slab MC-3-6-BASF
Core # Bond strength Failure mode Observations (psi) (MPa)
1 251.2 1.73 susbtrate 3 217.7 1.50 substrate/int 5 205.1 1.41 substrate 7 247.0 1.70 substrate 9 159.0 1.10 substrate
11 226.0 1.56 substrate 13 234.4 1.62 substrate 15 192.5 1.33 substrate 17 184.2 1.27 substrate
Average 213.0 1.47 Repair (%) 0.0 Std. Deviation 30.6 0.21 Interface (%) 22.2 COV (%) 14.4 Substrate (%) 88.9
Pull off bond strength - Slab MC-3-6-BASF
Core # Bond strength Failure mode Observations (psi) (MPa)
2 251.2 1.73 susbtrate 4 352.9 2.43 substrate 6 362.4 2.50 substrate 8 317.9 2.19 substrate
10 295.7 2.04 substrate 12 378.3 2.61 ½ int / ½ subst 14 352.9 2.43 substrate 16 302.0 2.08 substrate 18 400.6 2.76 substrate
Average 334.9 2.31 Repair (%) 0.0 Std. Deviation 46.8 0.32 Interface (%) 11.1 COV (%) 14.0 Substrate (%) 88.9

Table 10. Bond Test Results: Slab MC-5-0-CON Shear bond strength - Slab MC-5-0-CON
Core # Bond strength Failure mode Observations
(psi) (MPa) 2 58.5 0.40 interface 4 117.2 0.81 susbtrate 6 138.1 0.95 interface 8 163.2 1.13 substrate
10 276.3 1.91 substrate/int 12 188.4 1.30 substrate/repair 14 104.6 0.72 substrate/int 16 205.1 1.41 substrate 18 Interface debonding while drilling.
Average 156.4 1.08 Repair (%) 12.5 Std. Deviation 67.6 0.47 Interface (%) 50.0 COV (%) 43.2 Substrate (%) 37.5
Pull off bond strength - Slab MC-5-0-CON
Core # Bond strength Failure mode Observations
(psi) (MPa) 1 60.4 0.42 interface 3 362.4 2.50 ½ int / ½ subst 5 362.4 2.50 substrate 7 327.5 2.26 interface 9 324.3 2.24 interface
11 368.8 2.54 repair 13 273.4 1.89 repair 15 127.2 0.88 interface 17 206.7 1.43 interface
Average 268.1 1.85 Repair (%) 22.2 Std. Deviation 112.6 0.78 Interface (%) 66.7 COV (%) 42.0 Substrate (%) 11.1

Table 11. Bond Test Results: Slab MC-5-1-CON Shear bond strength - Slab MC-5-1-CON
Core # Bond strength Failure mode Observations
(psi) (MPa) 2 159.0 1.10 substrate 4 12.5 0.09 substrate/int 6 146.5 1.01 substrate/int 8 200.9 1.39 substrate
10 87.9 0.61 interface 12 83.7 0.58 interface 14 200.9 1.39 substrate/repair 16 192.5 1.33 substrate/repair 18 20.9 0.14 substrate/int
Average 122.8 0.85 Repair (%) 22.2 Std. Deviation 74.4 0.51 Interface (%) 55.6 COV (%) 60.6 Substrate (%) 22.2
Pull off bond strength - Slab MC-5-1-CON
Core # Bond strength Failure mode Observations
(psi) (MPa) 1 162.1 1.12 interface 3 263.9 1.82 interface 5 292.5 2.02 substrate 7 190.8 1.32 interface 9 305.2 2.11 interface
11 286.1 1.97 interface 13 292.5 2.02 interface 15 298.9 2.06 substrate 17 435.6 3.00 interface
Average 280.8 1.94 Repair (%) 0.0 Std. Deviation 77.2 0.53 Interface (%) 77.8 COV (%) 27.5 Substrate (%) 22.2

Table 12. Bond Test Results: Slab MC-5-6-CON Shear bond strength - Slab MC-5-6-CON
Core # Bond strength Failure mode Observations
(psi) (MPa) 2 150.7 1.04 substrate 4 159.0 1.10 substrate 6 175.8 1.21 substrate 8 184.2 1.27 substrate/repair
10 247.0 1.70 substrate/int 12 159.0 1.10 interface 14 238.6 1.65 substrate/repair 16 221.8 1.53 substrate 18 217.7 1.50 substrate
Average 194.9 1.34 Repair (%) 22.2 Std. Deviation 36.9 0.25 Interface (%) 22.2 COV (%) 18.9 Substrate (%) 55.6
Pull off bond strength - Slab MC-5-6-CON
Core # Bond strength Failure mode Observations
(psi) (MPa) 1 330.6 2.28 repair 3 292.5 2.02 substrate 5 283.0 1.95 substrate 7 149.4 1.03 interface 9 251.2 1.73 interface
11 378.3 2.61 ½ int / ½ repair 13 340.2 2.35 interface 15 276.6 1.91 interface 17 241.6 1.67 interface
Average 282.6 1.95 Repair (%) 11.1 Std. Deviation 66.5 0.46 Interface (%) 66.7 COV (%) 23.5 Substrate (%) 22.2

Table 13. Bond Test Results: Slab MC-5-0-CON(1) Shear bond strength - Slab MC-5-6-CON (1)
Core # Bond strength Failure mode Observations
(psi) (MPa) 1 255.3 1.76 substrate 3 318.2 2.19 substrate/int 5 221.8 1.53 substrate 7 108.8 0.75 substrate 9 217.7 1.50 substrate/int
11 284.7 1.96 substrate 13 117.2 0.81 substrate 15 276.3 1.91 substrate/int 17 200.9 1.39 substrate/int
Average 222.3 1.53 Repair (%) 0.0 Std. Deviation 72.0 0.50 Interface (%) 44.4 COV (%) 32.4 Substrate (%) 55.6
Shear bond strength - Slab MC-5-6-CON (1)
Core # Bond strength Failure mode Observations
(psi) (MPa) 1 255.3 1.76 substrate 3 318.2 2.19 substrate/int 5 221.8 1.53 substrate 7 108.8 0.75 substrate 9 217.7 1.50 substrate/int
11 284.7 1.96 substrate 13 117.2 0.81 substrate 15 276.3 1.91 substrate/int 17 200.9 1.39 substrate/int
Average 222.3 1.53 Repair (%) 0.0 Std. Deviation 72.0 0.50 Interface (%) 44.4 COV (%) 32.4 Substrate (%) 55.6

Table 14. Bond Test Results: Slab MC-5-0-BASF Shear bond strength - Slab MC-5-0-BASF
Core # Bond strength Failure mode Observations
(psi) (MPa) 1 334.9 2.31 substrate/int 3 314.0 2.17 substrate/int 5 293.0 2.02 substrate 7 238.6 1.65 substrate/int 9 230.2 1.59 substrate/int
11 280.5 1.93 substrate/int 13 163.2 1.13 substrate 15 267.9 1.85 substrate 17 360.0 2.48 substrate/int
Average 275.8 1.90 Repair (%) 0.0 Std. Deviation 59.7 0.41 Interface (%) 66.7 COV (%) 21.7 Substrate (%) 33.3
Pull off bond strength - Slab MC-5-0-BASF
Core # Bond strength Failure mode Observations
(psi) (MPa) 2 429.2 2.96 substrate 4 457.8 3.16 repair 6 368.8 2.54 ½ int / ½ subst 8 419.7 2.89 repair
10 483.3 3.33 ½ int / ½ subst 12 454.6 3.14 substrate 14 375.2 2.59 substrate 16 457.8 3.16 substrate 18 359.3 2.48 substrate
Average 422.8 2.92 Repair (%) 22.2 Std. Deviation 45.3 0.31 Interface (%) 22.2 COV (%) 10.7 Substrate (%) 55.6

Table 15. Bond Test Results: Slab MC-5-1-BASF Shear bond strength - Slab MC-5-1-BASF
Core # Bond strength Failure mode Observations
(psi) (MPa) 1 230.2 1.59 substrate 3 293.0 2.02 substrate 5 200.9 1.39 substrate 7 188.4 1.30 substrate 9 234.4 1.62 substrate
11 213.5 1.47 susbtrate 13 226.0 1.56 substrate/int 15 293.0 2.02 substrate/int 17 108.8 0.75 substrate
Average 220.9 1.52 Repair (%) 0.0 Std. Deviation 55.7 0.38 Interface (%) 22.2 COV (%) 25.2 Substrate (%) 77.8
Pull off bond strength - Slab MC-5-1-BASF
Core # Bond strength Failure mode Observations
(psi) (MPa) 2 384.7 2.65 substrate 4 403.8 2.78 substrate 6 473.7 3.27 substrate 8 346.5 2.39 ½ int / ½ subst
10 461.0 3.18 substrate 12 451.5 3.11 substrate 14 480.1 3.31 repair 16 394.2 2.72 repair 18 391.1 2.70 substrate
Average 420.7 2.90 Repair (%) 22.2 Std. Deviation 46.9 0.32 Interface (%) 11.1 COV (%) 11.1 Substrate (%) 66.7

Table 16. Bond Test Results: Slab MC-5-6-BASF Shear bond strength - Slab MC-5-6-BASF
Core # Bond strength Failure mode Observations
(psi) (MPa) 2 263.7 1.82 substrate/int 4 217.7 1.50 substrate 6 196.7 1.36 substrate 8 159.0 1.10 substrate
10 242.8 1.67 substrate 12 263.7 1.82 substrate 14 192.5 1.33 substrate 16 259.5 1.79 substrate 18 184.2 1.27 substrate
Average 220.0 1.52 Repair (%) 0.0 Std. Deviation 39.1 0.27 Interface (%) 11.1 COV (%) 17.8 Substrate (%) 88.9
Pull off bond strength - Slab MC-5-6-BASF
Core # Bond strength Failure mode Observations
(psi) (MPa) 1 387.9 2.68 substrate 3 327.5 2.26 substrate 5 337.0 2.32 substrate 7 330.6 2.28 substrate 9 330.6 2.28 substrate
11 333.8 2.30 substrate 13 352.9 2.43 substrate 15 387.9 2.68 substrate 17 387.9 2.68 substrate
Average 352.9 2.43 Repair (%) 0.0 Std. Deviation 27.2 0.19 Interface (%) 0.0 COV (%) 7.7 Substrate (%) 100.0

Table 17. Bond Test Results: Slab MC-7-0-CON Shear bond strength - Slab MC-7-0-CON
Core # Bond strength Failure mode Observations
(psi) (MPa) 2 305.6 2.11 substrate/int 4 180.0 1.24 substrate/repair 6 247.0 1.70 substrate/repair 8 226.0 1.56 interface/repair
10 184.2 1.27 substrate/repair 12 226.0 1.56 substrate/int 14 221.8 1.53 substrate 16 163.2 1.13 interface/repair 18 217.7 1.50 substrate
Average 219.1 1.51 Repair (%) 33.3 Std. Deviation 42.2 0.29 Interface (%) 44.4 COV (%) 19.3 Substrate (%) 22.2
Pull off bond strength - Slab MC-7-0-CON
Core # Bond strength Failure mode Observations
(psi) (MPa) 1 35.0 0.24 interface 3 352.9 2.43 repair 5 365.6 2.52 repair 7 54.0 0.37 interface 9 384.7 2.65 repair
11 311.6 2.15 interface 13 302.0 2.08 repair 15 359.3 2.48 repair 17 368.8 2.54 repair
Average 281.5 1.94 Repair (%) 66.7 Std. Deviation 137.1 0.95 Interface (%) 33.3 COV (%) 48.7 Substrate (%) 0.0

Table 18. Bond Test Results: Slab MC-7-1-CON Shear bond strength - Slab MC-7-1-CON
Core # Bond strength Failure mode Observations
(psi) (MPa) 1 Interface debonding while drilling. 3 200.9 1.39 substrate/repair 5 272.1 1.88 substrate 7 Interface debonding while drilling. 9 263.7 1.82 substrate/repair
11 54.4 0.37 interface/repair 13 146.5 1.01 interface/repair 15 117.2 0.81 substrate/int 17 25.1 0.17 interface
Average 154.3 1.06 Repair (%) 28.6 Std. Deviation 96.7 0.67 Interface (%) 57.1 COV (%) 62.7 Substrate (%) 14.3
Pull off bond strength - Slab MC-7-1-CON
Core # Bond strength Failure mode Observations
(psi) (MPa) 2 372.0 2.57 repair 4 89.0 0.61 interface 6 372.0 2.57 repair 8 352.9 2.43 repair
10 187.6 1.29 interface 12 Interface debonding while drilling. 14 349.7 2.41 interface 16 292.5 2.02 interface 18 85.8 0.59 interface
Average 262.7 1.81 Repair (%) 37.5 Std. Deviation 124.0 0.85 Interface (%) 62.5 COV (%) 47.2 Substrate (%) 0.0

Table 19. Bond Test Results: Slab MC-7-6-CON Shear bond strength - Slab MC-7-6-CON
Core # Bond strength Failure mode Observations
(psi) (MPa) 2 Interface debonding while drilling. 4 Interface debonding while drilling. 6 154.9 1.07 substrate/int 8 180.0 1.24 substrate/repair
10 Interface debonding while drilling. 12 Interface debonding while drilling. 14 Interface debonding while drilling. 16 196.7 1.36 substrate/repair 18 Interface debonding while drilling. 19 146.5 1.01 interface/repair 21 125.5 0.87 substrate/int 23 301.4 2.08 substrate/int
Average 184.2 1.27 Repair (%) 33.3 Std. Deviation 62.7 0.43 Interface (%) 66.7 COV (%) 34.0 Substrate (%) 0.0
Pull off bond strength - Slab MC-7-6-CON
Core # Bond strength Failure mode Observations
(psi) (MPa) 1 Interface debonding while drilling. 3 Interface debonding while drilling. 5 352.9 2.43 repair 7 Interface debonding while drilling. 9 302.0 2.08 repair
11 Interface debonding while drilling. 13 359.3 2.48 repair 15 Interface debonding while drilling. 17 Interface debonding while drilling. 20 244.8 1.69 interface 22 76.3 0.53 interface 24 Interface debonding while drilling.
Average 267.1 1.84 Repair (%) 60.0 Std. Deviation 116.2 0.80 Interface (%) 40.0 COV (%) 43.5 Substrate (%) 0.0

Table 20. Bond Test Results: Slab MC-7-0-BASF Shear bond strength - Slab MC-7-0-BASF
Core # Bond strength Failure mode Observations
(psi) (MPa) 1 309.8 2.14 substrate 3 146.5 1.01 substrate 5 263.7 1.82 substrate/int 7 276.3 1.91 substrate/int 9 221.8 1.53 substrate
11 280.5 1.93 substrate 13 251.2 1.73 substrate/repair 15 339.1 2.34 substrate 17 138.1 0.95 substrate
Average 247.4 1.71 Repair (%) 11.1 Std. Deviation 68.3 0.47 Interface (%) 22.2 COV (%) 27.6 Substrate (%) 66.7
Pull off bond strength - Slab MC-7-0-BASF
Core # Bond strength Failure mode Observations
(psi) (MPa) 2 254.3 1.75 repair 4 349.7 2.41 repair 6 232.1 1.60 substrate 8 232.1 1.60 repair
10 410.1 2.83 repair 12 333.8 2.30 repair 14 356.1 2.46 repair 16 356.1 2.46 repair 18 314.7 2.17 repair
Average 315.5 2.18 Repair (%) 88.9 Std. Deviation 62.7 0.43 Interface (%) 0.0 COV (%) 19.9 Substrate (%) 11.1

Table 21. Bond Test Results: Slab MC-7-1-BASF Shear bond strength - Slab MC-7-1-BASF
Core # Bond strength Failure mode Observations
(psi) (MPa) 2 188.4 1.30 substrate 4 142.3 0.98 substrate 6 297.2 2.05 substrate/int 8 247.0 1.70 substrate
10 247.0 1.70 substrate/int 12 263.7 1.82 substrate 14 297.2 2.05 substrate/int 16 209.3 1.44 substrate 18 213.5 1.47 substrate
Average 233.9 1.61 Repair (%) 0.0 Std. Deviation 50.9 0.35 Interface (%) 33.3 COV (%) 21.8 Substrate (%) 66.7
Pull off bond strength - Slab MC-7-1-BASF
Core # Bond strength Failure mode Observations
(psi) (MPa) 1 406.9 2.81 repair 3 511.9 3.53 repair 5 445.1 3.07 substrate 7 438.7 3.03 repair 9 496.0 3.42 repair
11 400.6 2.76 repair 13 432.4 2.98 substrate 15 476.9 3.29 substrate 17 451.5 3.11 substrate
Average 451.1 3.11 Repair (%) 55.6 Std. Deviation 37.8 0.26 Interface (%) 0.0 COV (%) 8.4 Substrate (%) 44.4

Table 22. Bond Test Results: Slab MC-7-6-BASF Shear bond strength - Slab MC-7-6-BASF
Core # Bond strength Failure mode Observations
(psi) (MPa) 1 192.5 1.33 substrate 3 318.2 2.19 substrate/int 5 293.0 2.02 substrate 7 339.1 2.34 substrate 9 330.7 2.28 substrate
11 150.7 1.04 substrate 13 205.1 1.41 substrate 15 334.9 2.31 substrate/repair 17 226.0 1.56 substrate
Average 265.6 1.83 Repair (%) 11.1 Std. Deviation 72.2 0.50 Interface (%) 11.1 COV (%) 27.2 Substrate (%) 77.8
Pull off bond strength - Slab MC-7-6-BASF
Core # Bond strength Failure mode Observations
(psi) (MPa) 2 473.7 3.27 repair 4 397.4 2.74 repair 6 435.6 3.00 repair 8 451.5 3.11 repair
10 470.5 3.25 repair 12 263.9 1.82 substrate 14 314.7 2.17 repair 16 435.6 3.00 repair 18 372.0 2.57 interface
Average 401.6 2.77 Repair (%) 77.8 Std. Deviation 72.6 0.50 Interface (%) 11.1 COV (%) 18.1 Substrate (%) 11.1
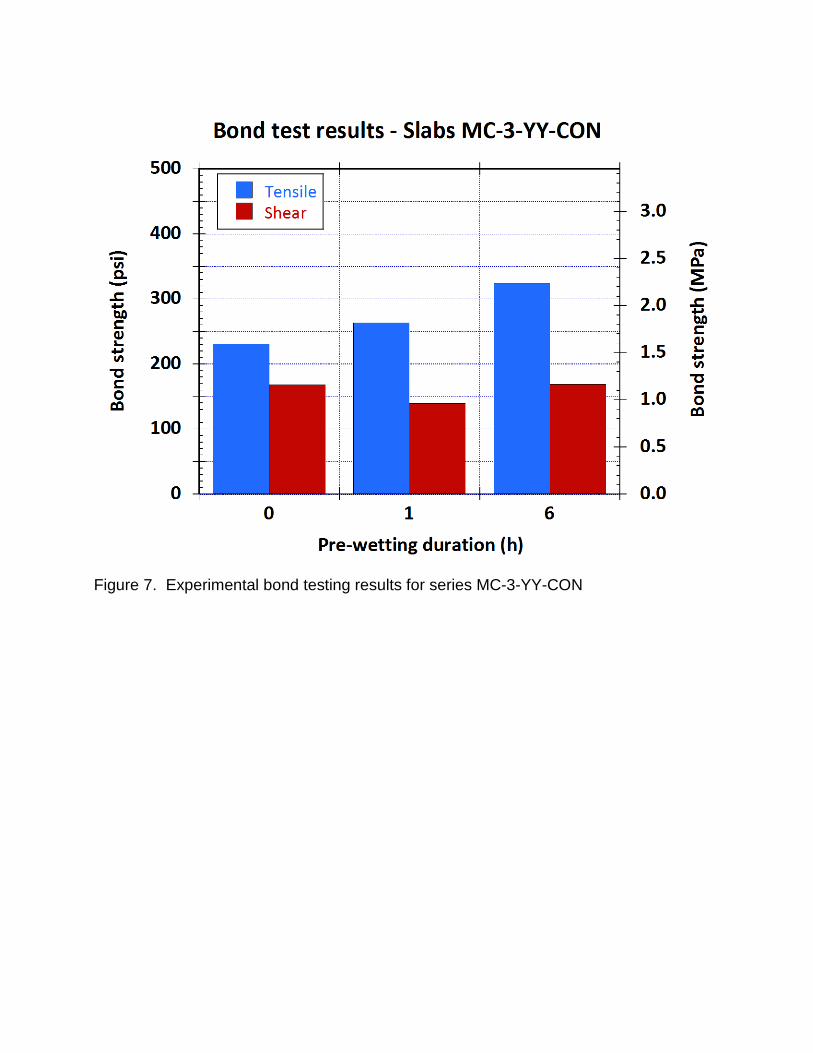
Figure 7. Experimental bond testing results for series MC-3-YY-CON

Figure 8. Experimental bond testing results for series MC-5-YY-CON. The (2) indicates results from the second test slab (Table 13).

Figure 9. Experimental bond testing results for series MC-7-YY-CON

Figure 10. Experimental bond testing results for series MC-3-YY-BASF

Figure 11. Experimental bond testing results for series MC-5-YY-BASF

Figure 12. Experimental bond testing results for series MC-7-YY-BASF

Conclusion The experimental work reported in this document will be followed by a second task involving bond testing of tests slabs conditioned for longer periods of time in a different environment. The data generated in both Task 1 and Task 2 will then be analyzed to determine correlations between moisture content, bond strength, overlay material, and age of repair.

Bibliography 1. Granju, J.L. Bonded Cement-Based Material Overlays for the Repair, the Liningof the Strengthening of Slabs or Pavements, Stat-of-the-Art Report (Draft). France : RILEM 193-RLS TC, 2004. 2. Vaysburd, A.M., et al., et al. Concrete Repair Technology - A Revised Approach Is Needed. Concrete International. 2004, No 1, pp. 59-65. 3. Vaysburd, A.M., et al., et al. Interfacial Bond and Surface Preparation in Concrete Repair. Indian Concrete Journal. 1, Jan 2001, Vol. 75, pp. 27-33. 4. Bissonnette, Benoît, Vaysburd, Alexander M. and von Fay, Kurt F. Best Practices for Preparing Concrete Surfaces Prior to Repairs and Overlays, MERL 12-17. Denver : Bureau of Reclamation, 2012. 5. Vaysburd, Alexander M. and Bissonnette, Benoit. Methods to Measure Near Surface Moisture Content of Concrete and Mortar, MERL 2009-37. Denver : Bureau of Reclamation, 2009.
Reference standards ASTM International ASTM C 33 Concrete Aggregates ASTM C 39 Compressive Strength of Cylindrical Concrete Specimens ASTM C 138 Standard Test Method for Density (Unit Weight), Yield, and Air
Content (Gravimetric) of Concrete ASTM C 143 Slump of Hydraulic-Cement Concrete ASTM C 150 Portland Cement ASTM C 231 Air Content of Freshly Mixed Concrete by the Pressure Method ASTM C 260 Air-Entraining Admixtures for Concrete ASTM C 618 Coal Fly Ash and Raw or Calcined Natural Pozzolan for Use in
Concrete