Embed Size (px)
Citation preview

HAL Id: tel-00910178https://tel.archives-ouvertes.fr/tel-00910178
Submitted on 27 Nov 2013
HAL is a multi-disciplinary open accessarchive for the deposit and dissemination of sci-entific research documents, whether they are pub-lished or not. The documents may come fromteaching and research institutions in France orabroad, or from public or private research centers.
L’archive ouverte pluridisciplinaire HAL, estdestinée au dépôt et à la diffusion de documentsscientifiques de niveau recherche, publiés ou non,émanant des établissements d’enseignement et derecherche français ou étrangers, des laboratoirespublics ou privés.
Modélisation cognitive computationnelle de la recherched’information utilisant des données oculomotrices
Francisco Lopez Orozco
To cite this version:Francisco Lopez Orozco. Modélisation cognitive computationnelle de la recherche d’information util-isant des données oculomotrices. Médecine humaine et pathologie. Université de Grenoble, 2013.Français. �NNT : 2013GRENS013�. �tel-00910178�

THÈSEPour obtenir le grade de
DOCTEUR DE L’UNIVERSITÉ DE GRENOBLESpécialité : Ingénierie de la Cognition, de l’interaction, del’Apprentissage et de la création
Arrêté ministériel : 7 août 2006
Présentée par
Francisco LÓPEZ OROZCO
Thèse dirigée par Anne GUÉRIN-DUGUÉet codirigée par Benoît LEMAIRE
préparée au sein Laboratoire de Psychologie et NeuroCognition(LPNC), CNRS UMR 5105et de École Doctorale Ingénierie pour la Santé, la Cognition etl’Environnement (EDISCE).
Computational Cognitive Modelingof Information Search using EyeMovement Data
Thèse soutenue publiquement le 16 juillet 2013,devant le jury composé de :
Monsieur, Éric RaufasteProfesseur, Université Toulouse 2-Le Mirail, PrésidentMonsieur, Jean-Michel BoucheixProfessuer, U. Bourgogne, Dijon, RapporteurMonsieur, Mathieu RocheMaître de Conférences (HDR), U. Montpellier 2, Rapporteur
Monsieur, Éric RaufasteProfesseur, Université Toulouse 2-Le Mirail, ExaminateurMadame, Anne Guérin-DuguéProfesseur, Gipsa-lab, Grenoble, Directeur de thèseMonsieur, Benoît LemaireMaître de conférences, LPNC Grenoble, Co-Directeur de thèse

i
Acknowledgments
Completing my PhD degree is probably the most challenging activity of my first 33years of my life. The best and worst moments of my doctoral journey have been sharedwith many people. It has been a great privilege to spend my first year of my PhD inthe laboratory TIMC–IMAG and the last 2.5 years in the Laboratory of Psychologyand NeuroCognition (LPNC) at University Pierre Mendès France (UPMF), Grenoble,France.
I am deeply indebted to my supervisors Prof. Anne Guérin-Dugué and Dr. BenoîtLemaire. They patiently provided the vision, encouragement and advice necessary forme to proceed through the doctoral program and complete my dissertation. Both madeof my stay in France a great experience. Not only their scientific criticism was importantbut also their everyday support. “Un grand merci” Anne et Benoît. I will have you inmy mind for all the rest of my life.
Special thanks to the members of the jury: Prof. Éric Raufaste, Prof. Jean–MichelBoucheix and Dr. Mathieu Roche. I got an invaluable feedback from all of you. Yourcomments are helpful for the improvement of my future work.
I am also very grateful with all the members of the project ANR Gaze & EEG. WithThierry Baccino, his comments were always useful. Aurélie Campagne and NathalieGuyader for the opportunity to run some of my experiments at the hospital undertheir guidance. Gelu Ionescu for the discussions about Matlab programming and datastructure. Alain Chauvin, he shared with me his programs of his eyetracker experiments.These were the beginning of my eyetracking challenge. Aline Frey, all the experimentsyou carried out in Paris were actually part of my thesis, merci encore !!!
With regard to my family. I would like also to express all my gratitude to Sofía andEfraín who are my two best examples of hardworking people. All my love for them. Ofcourse, to my parents who gave me the life and due their support and guidance, I amwho I am. Their love provided me inspiration and they are my driving force.
Thomas and Fanny, thank you very much for your advices and help. You werethere all the time ready to give me your hand. Of course, Adrián was also part of thisadventure. I love all of you my dear friends and brothers. By the way, “Arriba Juchitán,señores” !!! Ociel, it is impossible to forget our bike adventures. Thanks again. Marlénand Olivier, your friendship was also a source of motivation. Merci.
Azucena, sí, usté, usté. You are also very important in my life, and especiallyyou were a valuable source of motivation during the last 6 months of my PhD. MissShihuahua caray. Te quiero Azu !!!
There are many people that also played a role during this adventure but it is noteasy to list all of them here.
Sincerely,Francisco LOPEZ


Contents
1 Introduction 11.1 Introduction . . . . . . . . . . . . . . . . . . . . . . . . . . . . . . . . . . 11.2 Context of the thesis . . . . . . . . . . . . . . . . . . . . . . . . . . . . . 41.3 Thesis organization . . . . . . . . . . . . . . . . . . . . . . . . . . . . . . 5
2 State of the Art 72.1 Reading as text processing . . . . . . . . . . . . . . . . . . . . . . . . . . 7
2.1.1 Reading . . . . . . . . . . . . . . . . . . . . . . . . . . . . . . . . 92.1.2 Models of Reading . . . . . . . . . . . . . . . . . . . . . . . . . . 16
2.2 Searching on texts . . . . . . . . . . . . . . . . . . . . . . . . . . . . . . 212.2.1 Searching . . . . . . . . . . . . . . . . . . . . . . . . . . . . . . . 212.2.2 Models for searching . . . . . . . . . . . . . . . . . . . . . . . . . 21
2.3 Decision making and information search . . . . . . . . . . . . . . . . . . 292.3.1 Decisions . . . . . . . . . . . . . . . . . . . . . . . . . . . . . . . 292.3.2 Models for decision making . . . . . . . . . . . . . . . . . . . . . 33
2.4 Statement of the problem . . . . . . . . . . . . . . . . . . . . . . . . . . 37
3 Method 393.1 Experiments . . . . . . . . . . . . . . . . . . . . . . . . . . . . . . . . . . 393.2 Latent Semantic Analysis (LSA) . . . . . . . . . . . . . . . . . . . . . . 41
3.2.1 How the LSA model is used? . . . . . . . . . . . . . . . . . . . . 433.3 Material . . . . . . . . . . . . . . . . . . . . . . . . . . . . . . . . . . . . 473.4 Apparatus . . . . . . . . . . . . . . . . . . . . . . . . . . . . . . . . . . . 483.5 Pre-processing data . . . . . . . . . . . . . . . . . . . . . . . . . . . . . . 483.6 Model . . . . . . . . . . . . . . . . . . . . . . . . . . . . . . . . . . . . . 52
3.6.1 Statistical approach . . . . . . . . . . . . . . . . . . . . . . . . . 523.6.2 Bayesian inference . . . . . . . . . . . . . . . . . . . . . . . . . . 533.6.3 Model Learning . . . . . . . . . . . . . . . . . . . . . . . . . . . . 553.6.4 Model Performance . . . . . . . . . . . . . . . . . . . . . . . . . . 55
4 Computational Cognitive Modeling: a simple environment. 574.1 Experiment I: one-paragraph experiment . . . . . . . . . . . . . . . . . . 57
4.1.1 Participants . . . . . . . . . . . . . . . . . . . . . . . . . . . . . . 574.1.2 Material . . . . . . . . . . . . . . . . . . . . . . . . . . . . . . . . 584.1.3 Apparatus . . . . . . . . . . . . . . . . . . . . . . . . . . . . . . . 584.1.4 Procedure . . . . . . . . . . . . . . . . . . . . . . . . . . . . . . . 58
iv Contents
4.2 Pre-processing data . . . . . . . . . . . . . . . . . . . . . . . . . . . . . . 594.3 Basic statistics . . . . . . . . . . . . . . . . . . . . . . . . . . . . . . . . 604.4 Modeling . . . . . . . . . . . . . . . . . . . . . . . . . . . . . . . . . . . 61
4.4.1 Modeling the decision . . . . . . . . . . . . . . . . . . . . . . . . 634.4.2 Model Learning . . . . . . . . . . . . . . . . . . . . . . . . . . . . 684.4.3 Model Performance . . . . . . . . . . . . . . . . . . . . . . . . . . 70
4.5 Conclusion . . . . . . . . . . . . . . . . . . . . . . . . . . . . . . . . . . . 734.6 Improvement . . . . . . . . . . . . . . . . . . . . . . . . . . . . . . . . . 73
4.6.1 Participant’s delays learned by using the step word, target wordand the ramp word as references . . . . . . . . . . . . . . . . . . 74
4.6.2 Learning participant’s delays by using the Kullback-Leibler (KL)divergence . . . . . . . . . . . . . . . . . . . . . . . . . . . . . . . 84
4.7 Conclusions . . . . . . . . . . . . . . . . . . . . . . . . . . . . . . . . . . 91
5 Computational Cognitive Modeling: a second environment 935.1 Experiment II: two-paragraph experiment . . . . . . . . . . . . . . . . . 93
5.1.1 Participants . . . . . . . . . . . . . . . . . . . . . . . . . . . . . . 935.1.2 Material . . . . . . . . . . . . . . . . . . . . . . . . . . . . . . . . 945.1.3 Apparatus . . . . . . . . . . . . . . . . . . . . . . . . . . . . . . . 945.1.4 Procedure . . . . . . . . . . . . . . . . . . . . . . . . . . . . . . . 94
5.2 Pre-processing data . . . . . . . . . . . . . . . . . . . . . . . . . . . . . . 955.3 Basic statistics . . . . . . . . . . . . . . . . . . . . . . . . . . . . . . . . 955.4 Modeling . . . . . . . . . . . . . . . . . . . . . . . . . . . . . . . . . . . 102
5.4.1 Modeling the Decision . . . . . . . . . . . . . . . . . . . . . . . . 1035.4.2 Model Learning . . . . . . . . . . . . . . . . . . . . . . . . . . . . 1085.4.3 Model Performance . . . . . . . . . . . . . . . . . . . . . . . . . . 111
5.5 Conclusion . . . . . . . . . . . . . . . . . . . . . . . . . . . . . . . . . . . 112
6 General Discussion 1136.1 Discussion . . . . . . . . . . . . . . . . . . . . . . . . . . . . . . . . . . . 1136.2 Benefits, limits and drawbacks of our modeling work. . . . . . . . . . . . 1176.3 Practical applications. . . . . . . . . . . . . . . . . . . . . . . . . . . . . 119
A Appendixes 123A.1 Experiment 1 . . . . . . . . . . . . . . . . . . . . . . . . . . . . . . . . . 123A.2 Experiment 2 . . . . . . . . . . . . . . . . . . . . . . . . . . . . . . . . . 123A.3 Text of the stimuli pages . . . . . . . . . . . . . . . . . . . . . . . . . . . 123
Bibliography 145
Chapter 1
Introduction
1.1 Introduction
This computer science thesis is placed into the cognitive science research field andmore specifically into the computational cognitive modeling or simply computationalpsychology.
A cognitive model is a simplified representation of cognitive and psychological pro-cesses that allows to explain the human behavior. Models are necessary because it isnot possible to get a reasonable understanding of human mind only from observationsof human behavior, maybe except for small and limited task domains. The problem isthat the tests used to understand such mechanisms and processes could only explainsuperficial features of human behavior that varies along individual or groups. They arealso affected by contextual factors. In simple words, it would be extremely hard tounderstand the human mind in this way, just like it would be extremely hard to under-stand a complex electronic device only by observing and testing its behavior, withoutany a priori ideas about the nature, the inner working, and the theoretical fundamentalsof that system. Due to the complexity of the human mind and its behavioral flexibility,models are necessary to explain the details of the human mind. Without such mod-els, experimentation may lead to the accumulation of a vast amount data without anyapparent purpose.
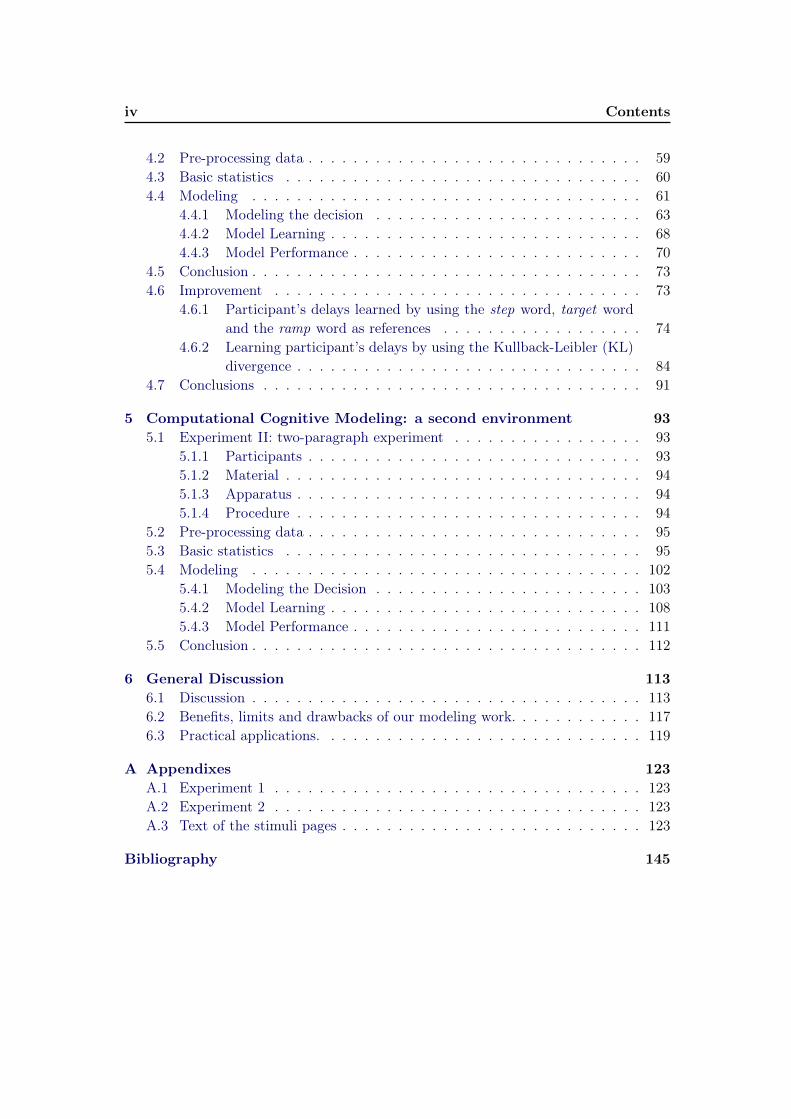
In general, models in cognitive science may be classified into mathematical, theo-retical and computational models (Sun, 2008). All of them are typically tested andvalidated with the cycle Model→Hypothesis→Experiments as is shown in Fig. 1.1. Hy-pothesis are formulated and they are tested and validated or not by the experiments. Inthe same way, from experimental observation, some working hypotheses are formulatedleading to a modeling stage and ending up with new hypotheses, etc. The differenceis how they are formulated. Mathematical models present relationships between vari-ables with mathematical equations. Theoretical models describe entities, relations, andprocesses in rather informal natural languages. In the case of computational modelsthe details of the involved processes are presented by using algorithmic descriptionsand programs, based on computer science. Computational models provide algorithmicspecificity: detailed, exactly specified, and carefully thought-out steps, arranged in pre-cise and yet flexible sequences. Therefore, they provide both conceptual clarity andprecision. The computational modeling can bring out the fine details necessary to get

2 Chapter 1. Introduction
Figure 1.1: Modeling cycle for theoretical models.
an understanding of cognitive processes (Newell, 1990; Sun et al., 2005). Computa-tional models can be run on the same stimuli people are exposed to. In other words,computational models pass the experiments.
In the current thesis, we are interested into a computational cognitive model tosimulate people’s behavior when they are faced to an information search task. In otherwords, we are interested in the category of computational models because computationalmodeling appears to be a powerful approach. Computational models also support prac-tical applications of cognitive theories (Sun, 2008). With a computer simulation ofcognitive processes, we would have the possibility of having a better understanding ofsuch processes and making predictions about people’s behavior faced to new situations,of information search in our case. It is important to mention that the computationalmodels are mostly directed at answering the question of how human performance comesabout, by what psychological mechanisms, processes, and knowledge structures and inwhat ways exactly.
We can see a model as a simulator or a generator of phenomena and data. It is atheory-building tool and not a theory itself. In particular, one may use simulations forexploring various possibilities regarding details of a cognitive process.
Very often, progresses in science are done from understanding a phenomena andmaking predictions of it. Then a prescription or control of such phenomena couldbe achieved. Computational cognitive modeling may contribute to this, because thecomputational model may reveal dynamic aspects of cognition giving a detailed look attheir elements and their interactions during a model simulation. Such understandingmay lead to uncover hypotheses or unknown aspects of cognition that may lead topredictions. Finally, prescriptions may be done if the predictions are made in reasonablyaccurate way.
A computational cognitive model can be integrated into a cognitive architecture. Acognitive architecture is a domain-generic computational cognitive model that capturethe essential structures, mechanisms, and processes of cognition and it is used for abroad, multiple-level, multiple-domain analysis of cognition and behavior (Sun, 2008;Sun et al., 2005). They are useful and important because they provides a compre-

1.1. Introduction 3
hensive initial framework for further exploration of many different domains and manydifferent cognitive functionalities. To sum up, cognitive architectures are broad theoriesof cognition. In such architectures, the human cognition is represented as a structureof different components connected together. A few examples of such architectures areACT-R (Anderson et al., 2004), EPIC (Kieras and Meyer, 1997) and SOAR (Newell,1990). They give a baseline for studying cognitive processes for particular tasks. Oneof the advantage of such architectures is that all their modules have been tested andvalidated by different studies but typically they have a high number of parameters.
In the case of the current thesis, our models are not based on such architecturesbecause the idea was to have a high liberty for our modeling purposes. That way,it is possible to easily separate the processes that are involved. One disadvantage offollowing this approach is that the models are not validated and tested by previousresearch works and they are more sensitive to the redundancy of parameters.
Our interest is in information search as a cognitive activity. People are used to seekinformation on a newspaper or a web page, composed of several blocks of text, whichrequires to make rapid decisions about whether to stop or not reading the current blockand switch to another one. Quite often, time is a strong constraint and paragraphs arenot entirely processed. People are able to judge from a couple of words whether theyfound a relevant text. People are concerned with this activity in everyday life and inthis thesis we study such kind of information search task. More specifically, we try tosimulate the eye movements during such cognitive activity at the level of fixations andsaccades.1
One of the objectives for the conception of our model is to build the model as simpleas possible by limiting the number of parameters. The idea is to have an equilibriumbetween the simplicity of the model and its capacity to reproduce people’s behavior.Having a model with a high number of parameters allows to reproduce the experimentaldata with a high accuracy. The problem here is that there is a risk of having a model ah-doc to this particular task and not robust enough to reproduce the data for a differenttask or stimuli. This model would capture noisy information in the data. In general,beyond some threshold, the closer is the model to data, the less is the prediction capacityof the model (Rissanen, 1978). For example, Fig. 1.2b shows an example of a perfectmodel fitting (curve) to experimental data (small spots) by using a high number ofparameters. Here, it is likely that this model will not make good predictions on newdata because it captures noisy information in the data. In a reverse way, a too simplemodel is not capable to reproduce the experimental data and it does not allow us tounderstand the behavior of the phenomenon studied. For this case, Fig. 1.2c shows anexample of a bad model fitting the data. Then in our modeling work, we try to build amodel able to reasonably replicate people’s behavior with a low number of parameters
1A saccade is the eye movement itself which is needed to place the sight in a different place and afixation is the period of time when the eye is practically maintained on a single location.

4 Chapter 1. Introduction
as is shown in the example of the Fig. 1.2a. We will discuss this simplicity/data fittingtrade-off in the next chapters.
(a) Model fits the data well (in average) with a few parameters.
(b) Fitting with a very high number of param-eters.
(c) Fitting with a very low number of parame-ters.
Figure 1.2: Fitting to experimental data using models with different number of param-eters.
During the thesis, an experimental-based approach was followed. Psychophysicalexperiments with an eye-tracker2 device were carried out in order to gather data on eyemovements, create and validate the models.
1.2 Context of the thesis
This thesis is part of the research project ANR Gaze-EEG “Joint synchronous EEGsignal and eye tracking processing for spatio-temporal analysis and modeling of neu-ral activities”. The aim of the project is to study the cognitive mechanisms involvedduring a decision-making task in an information search context. The whole projectinvolved different research laboratories, two from Grenoble: Grenoble-Image-sPeech-Signal-Automatics Laboratory (GIPSA-Lab) & Laboratory of Psychology and Neu-roCognition (LPNC) and one from Paris: Laboratory of Utilization of Technology indigital Information (LUTIN Userlab).
2An eye-tracker is a device that allows a real-time recording of the eye movements while people isperforming a task.

1.3. Thesis organization 5
1.3 Thesis organization
This thesis is organized into six chapters. Chapter 2 presents a literature review of theresearch done in the direction of reading and searching activity in texts. Firstly, theresearch works discuss both the behavioral aspects and models of reading. Secondly,research on searching on text is also presented. The chapter ends with a literaturestudy of how decision-making processes are involved in information search tasks. Somemodeling works of information search are also discussed. Chapter 3 presents the generalmethodology followed for the conception of our experiments, the construction, valida-tion and improvement of the models proposed along the thesis. In Chapter 4, the firsteye-tracking experiment carried out is presented. During the experiment, a very simpleenvironment is considered when people are faced to a task of information search. Thecorresponding modeling work is also presented. In Chapter 5, the second eye-trackingexperiment carried out is discussed. The experiment also consists of a task of infor-mation search but in a more complex environment. The corresponding modeling workis also presented. Finally, Chapter 6 synthesizes the modeling results presented alongthe thesis and it presents a general discussion about the limitations, drawbacks of thecomputational cognitive models and gives some ideas for a future work. All the textualmaterial used during the experiments is included in the Annex 1.

Chapter 2
State of the Art
2.1 Reading as text processing
Processing a text could be done in different ways. When text processing is done as avisual comprehension of language, we can call it reading (Sereno and Rayner, 2003).This process can be also seen as a way of language acquisition, of communication and ofsharing information and ideas. On last decades, many research works have been doneto explain the different phenomena implied during the reading process. For example,several researchers have shown that the reading process is mainly affected by the typeof task that people are performing (Carver, 1990). Among others, this effect would bepresent in the reading rate (number of words processed in a period of time), the sequenceof words processed (if words are read serially or not), or if the words are processed morethan once, etc. For example and more particularly, Carver (1990) makes a distinctionbetween five possible kinds of processes followed by people during reading based ontheir reading rate. The processes are:
• Scanning. This process is presented when readers are looking for a particularword (600 words per minute or wpm). This is for instance what you are doing ifyou search for the word phenomena in the previous paragraph.
• Skimming is used when readers need to get a quick overview of the content of thetext (450 wpm). This is the process you would use if you have to quickly decidewhether the next paragraph is about eye-tracking technologies or not.
• Rauding is normal reading (300 wpm). This is what you do when you are readingthis page.
• Learning is used when readers try to acquire knowledge from the text (200 wpm).This is what you would do if there were comprehension questions at the end ofthis chapter.
• Memorizing is used when readers want to memorize the text, therefore constantlyverifying that information has been memorized (138 wpm).
Most of the time the reading process performed by people is rauding but is possiblethat they change their reading rate either up or down by moving between scanning (the

8 Chapter 2. State of the Art
fastest one) and memorizing (the slowest one). However, Carver (1990) also argued thatthe reading rate is not the only difference between strategies. There is also a differencebetween the goals, the subprocesses involved and the expected outputs according tothe task that people are performing (Simola et al., 2008; Lemaire et al., 2011). Wecan illustrate this situation with an example. Suppose that we ask people to find thedifferent occurrences of a particular word in a given text (e.g. find the word market).As we can expect, participants will more likely perform a scanning process. This canbe seen as a word recognition process that require a lexical access. Now, in a secondexample, participants are asked to find two words in a text that have been transposed,such as a sentence that starts with Market the after sweeping.... Here, not only all thewords should be lexically accessed (word recognition) but also the meaning of the wordsas they are used in the sentence should be recognised (semantic encoding). Then, thewhole process is called skimming and the extra stage needed is known as culminatingcomponent. As expected, the resulting reading rate is slower (450 wpm) comparedto the scanning (600 wpm). However, if people are faced with a passage where eachsentence should be comprehended, things are still different because not only the samestages needed for the skimming (word recognition and semantic encoding) should benecessary but also each word should be integrated into the complete thought of thesentence. This stage is called sentential integration and the whole process is knownas rauding. Rauding is normal reading. Similarly, the existence of a new componentdiminishes the reading rate (300 wpm) of the whole process. Now, we can imagine thatpeople are asked to read carefully a text in order to be able to correctly answer itemsin a multiple-choice test about the text. Here some of the words will be read morethan once with the idea to make sure that the text is being comprehended. The extracomponent and the whole process are called idea remembering and learning processrespectively. As previously, the reading rate (200 wpm) is affected by the inclusion ofthe new component. Lastly, the memorizing process appears when people are asked toread a text with the idea to be able to recall it later. Here people will have to retellseveral times the sentences and this process is known as fact rehearsal and its latencyis also observed in the reading rate (138 wpm) of the whole process.
After the explanation given so far, now it is time to recall that in the current thesis,we are interested in studying people’s behavior during tasks of information search.During these kind of tasks, people are encouraged to perform a rauding (or reading)stage, in another moment they would feel more likely to follow a skimming strategyand seldom to perform a scanning step. We would argue that changing states could beobserved due to different factors among others: the nature of the task and the difficultyof the text. However, before trying to get an understanding of such processes and dueto the high complexity of the rauding process itself (also called normal reading or justreading along the current thesis), we believe in the importance of reviewing the relevantaspects of the reading activity and how they could be used as a baseline to understand

2.1. Reading as text processing 9
more complex processes.
2.1.1 Reading
Reading a text is a complex task which has been widely studied in cognitive science anddue to the high importance of such activity, many effort has been done to investigate theeye movement behavior during fluent reading (Rayner, 1998, 2009). Another importantaspect that has favored the investigation of reading behavior is the facility of access toeyetracker. Eyetracker is a device that allows a real-time recording of the eye movementswhile people is performing a task. The use of the eye movement technique offers severaladvantages over other more traditional behavioral techniques. A central advantage isthat eye movements are already a part of reading itself and people do not need todo a secondary task while reading. Most of the existing studies agree in that theyhave identified the oculomotor, perceptual and cognitive factors that guide the reader’sdecisions of where (space) and when (time) to move the eyes while processing text.They have started by making a distinction between the two basic components of eyemovements: saccades and fixations.
A saccade is the eye movement itself which is needed to place the sight in a differ-ent place. It is a rapid movement during which practically no information is acquiredbecause vision is suppressed (Matin, 1974). Saccades take time to plan (latency) andexecute (duration). The codification of the target location in the visual field and ini-tiation of the movement is made during the saccade latency and typically lasts about175-200 ms (Rayner et al., 1983). Once a saccade is initiated, the amount of time thatis takes to actually move the eyes is a function of the distance to the target. Typically,a 2-deg saccade takes about 30 ms, while a 5-deg saccade, takes around 40 to 50 ms(Rayner, 1978).
A fixation is the period of time when the eye is practically maintained on a singlelocation (which last about 100-250 ms) and it is here that information is acquired.
Fig. 2.1 shows two experimental scanpaths (sequence of saccades and fixations of asingle eye) of two different users looking at the same text. Fixations are indicated bythe black spots whereas the saccades are represented by the lines connecting pairs offixations. The scanpath pattern on the left is characterised by forward saccades movingfrom left to the right according to the words on each line of text, a long saccade goingfrom the end of the current line to the first word of next line and so on until the lastline of the paragraph is read. It also worth nothing that some of the words are notfixated (they are skipped). This does not mean that the words were not processed.In fact, as we will discuss later these words are actually processed. We can observethat the skipped words are short and not as meaningful (eg. de, et, etc.) as fixatedwords (eg. science, technique, etc.) which renforces the idea that short words do notneed to be explicitly fixated to be processed as we will discus later. The scanpath

10 Chapter 2. State of the Art
(a) (b)
Figure 2.1: Example of a typical scanpath a) in reading. b) in scanning.
on the left is typical of reading or rauding process. However, a different situation isobserved with the scanpath to the right where there are less fixations on the text andit is clear that most of the words were not fixated. We can also notice that it seemsthat at the beginning (while processing the first line of the text) the participant wasperforming a reading stage (most of the words were fixated serially), but he switchedto a different strategy by fixating only one word on the second line, by skipping thethird line and by doing some fixations on the line number 4. The scanpath is typicalof a scanning process. From this example, we can notice that participants can followdifferent strategies for reading a paragraph and that a same participant can switch toa different way of processing the paragraph that he is looking at.
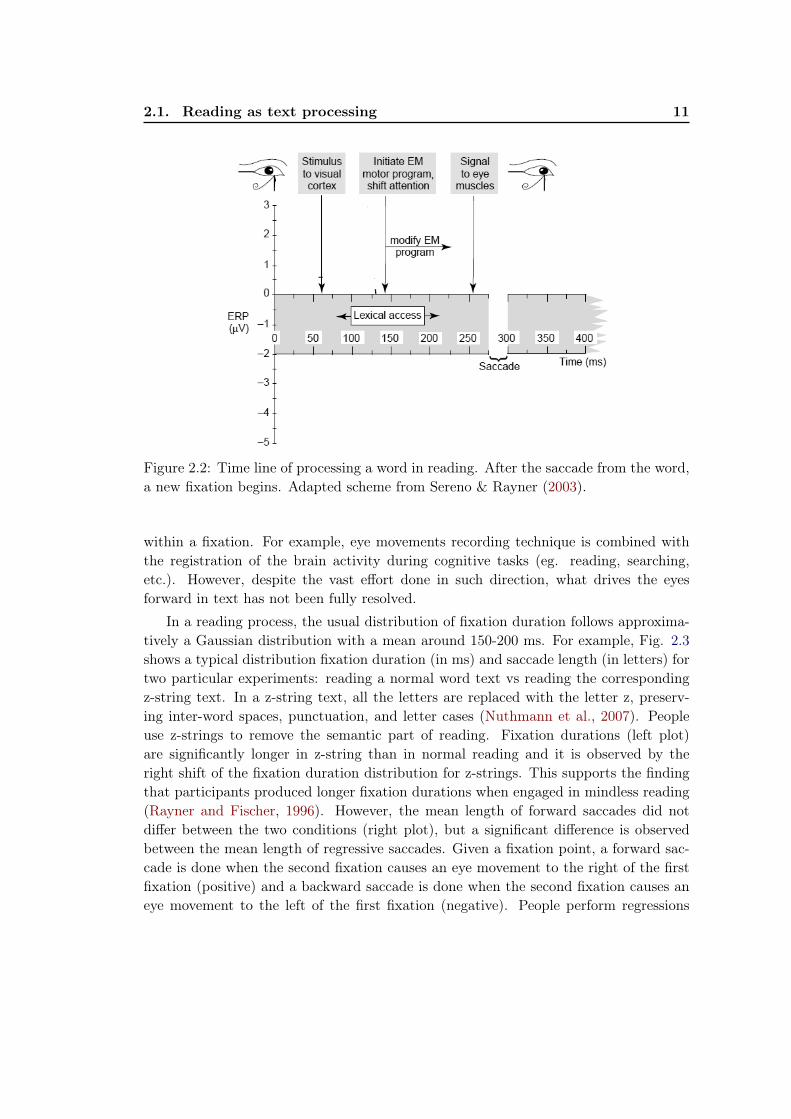
According to Sereno & Rayner (2003) the reading process is more than only identifyindividual words of a text. Several cognitive processes are involved during the course ofreading. Figure 2.2 illustrates (see Sereno & Rayner (2003) for further details) the timecourse of events occurring during a single fixation in reading. Once a word is fixated, theinformation acquired from such a fixation spent about 60 ms to be available in the visualcortex where the lexical processing begins. Then the fixation duration varies accordingto the lexical difficulty of the word (Rayner and Pollatsek, 1989; Rayner, 1998). Forexample, frequent and predictable words from context are fixated for less time thanthose that are not, but in general the word is processed within the first 100-200 msof the fixation because the next eye movement should be also programmed. Then asignal is sent to eye muscles to start the saccade. The time when the word recognitionis done does not correspond exactly with the fixation time on this particular word.Several combined approaches have tried to explain the different stages of processing
2.1. Reading as text processing 11
Figure 2.2: Time line of processing a word in reading. After the saccade from the word,a new fixation begins. Adapted scheme from Sereno & Rayner (2003).
within a fixation. For example, eye movements recording technique is combined withthe registration of the brain activity during cognitive tasks (eg. reading, searching,etc.). However, despite the vast effort done in such direction, what drives the eyesforward in text has not been fully resolved.
In a reading process, the usual distribution of fixation duration follows approxima-tively a Gaussian distribution with a mean around 150-200 ms. For example, Fig. 2.3shows a typical distribution fixation duration (in ms) and saccade length (in letters) fortwo particular experiments: reading a normal word text vs reading the correspondingz-string text. In a z-string text, all the letters are replaced with the letter z, preserv-ing inter-word spaces, punctuation, and letter cases (Nuthmann et al., 2007). Peopleuse z-strings to remove the semantic part of reading. Fixation durations (left plot)are significantly longer in z-string than in normal reading and it is observed by theright shift of the fixation duration distribution for z-strings. This supports the findingthat participants produced longer fixation durations when engaged in mindless reading(Rayner and Fischer, 1996). However, the mean length of forward saccades did notdiffer between the two conditions (right plot), but a significant difference is observedbetween the mean length of regressive saccades. Given a fixation point, a forward sac-cade is done when the second fixation causes an eye movement to the right of the firstfixation (positive) and a backward saccade is done when the second fixation causes aneye movement to the left of the first fixation (negative). People perform regressions

12 Chapter 2. State of the Art
Figure 2.3: (a) Distribution of all observed fixation durations during z-string reading(full squares) vs. normal reading (open squares). (b) Distribution of all observedsaccade lengths. Distributions taken from experiments described in Nuthmann et al.(2007).
(negative saccade lengths) less frequently during reading of z-strings than during nor-mal reading. Regressive saccades are much less useful (all the letters are the same)during the z-string reading than in normal reading. The idea behind this example wasto claim again the fact that there is a task effect over the way people process a text.For example, if people were also asked to read the normal text aloud, this would resultin a fixation duration still longer because in that case participant will be performingtwo different tasks at the same time. However, with respect to the length of saccade, asignificant difference would not be expected.
We have roughly explained how and when the two basic phase of eye movements(fixations and saccades) are generated and also how they are modified by factors likethe task type that people are performing. Now, we will discuss about one of the mostimportant physical characteristic of our vision system to understand its effect in theway people process a text during reading.
The retina is the place where the visual stimuli that come from the real world areformed. Then, they are transmitted to the visual cortex. The anatomy of the retinais characterized by a layered structure where the cell density of each layer decreaseswhen the eccentricity increases. The center of the retina aligned with the optical axisis called fovea. Here the density of the photoreceptors is maximum, and thus also thevisual acuity. Farther from the optical axis is located the parafoveal area and thereafterthe peripheral area, with an increasing of the eccentricity and the distance from thefoveal area. There the density of the photoreceptors decreases and also the visual acuity.
2.1. Reading as text processing 13
To sum up, acuity is very good in the fovea, it is not so good in the parafovea, and it iseven poorer in the periphery. The distinction about the three areas is observed duringthe reading process.
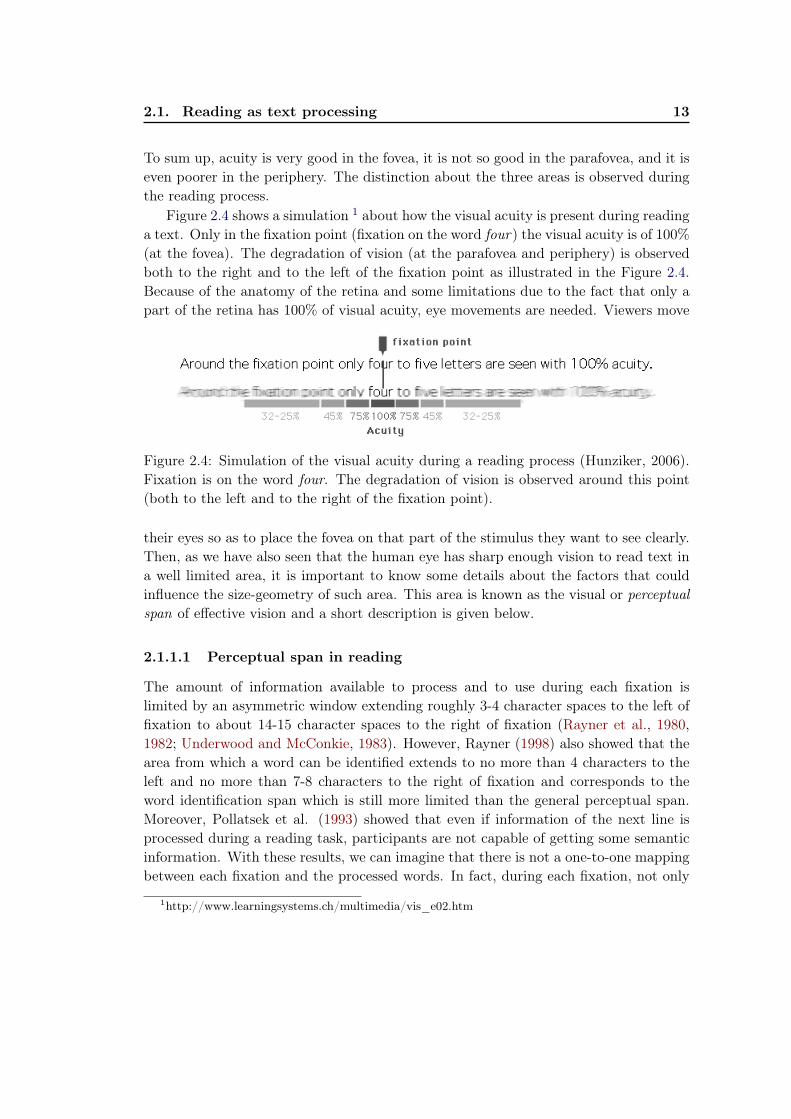
Figure 2.4 shows a simulation 1 about how the visual acuity is present during readinga text. Only in the fixation point (fixation on the word four) the visual acuity is of 100%(at the fovea). The degradation of vision (at the parafovea and periphery) is observedboth to the right and to the left of the fixation point as illustrated in the Figure 2.4.Because of the anatomy of the retina and some limitations due to the fact that only apart of the retina has 100% of visual acuity, eye movements are needed. Viewers move
Figure 2.4: Simulation of the visual acuity during a reading process (Hunziker, 2006).Fixation is on the word four. The degradation of vision is observed around this point(both to the left and to the right of the fixation point).
their eyes so as to place the fovea on that part of the stimulus they want to see clearly.Then, as we have also seen that the human eye has sharp enough vision to read text ina well limited area, it is important to know some details about the factors that couldinfluence the size-geometry of such area. This area is known as the visual or perceptualspan of effective vision and a short description is given below.
2.1.1.1 Perceptual span in reading
The amount of information available to process and to use during each fixation islimited by an asymmetric window extending roughly 3-4 character spaces to the left offixation to about 14-15 character spaces to the right of fixation (Rayner et al., 1980,1982; Underwood and McConkie, 1983). However, Rayner (1998) also showed that thearea from which a word can be identified extends to no more than 4 characters to theleft and no more than 7-8 characters to the right of fixation and corresponds to theword identification span which is still more limited than the general perceptual span.Moreover, Pollatsek et al. (1993) showed that even if information of the next line isprocessed during a reading task, participants are not capable of getting some semanticinformation. With these results, we can imagine that there is not a one-to-one mappingbetween each fixation and the processed words. In fact, during each fixation, not only
1http://www.learningsystems.ch/multimedia/vis_e02.htm

14 Chapter 2. State of the Art
the fixated word is processed but it also possible to get a preview of the word locatedto the right of the current fixation. When another word or a nonword initially occupiesthe target location, this preview is not valid. Some research works have revealed thatwhen readers have a valid preview of the word to the right of fixation, they spend lesstime fixating that word than when they do not have a valid preview. The effect is calledpreview benefit in reading and its description is given now.
2.1.1.2 Preview benefit in reading
The preview benefit effect in reading was found by using a boundary paradigm (Rayner,1975). In the boundary paradigm, an invisible boundary is defined just to the left of atarget word. Before a reader crosses the boundary, there is typically a preview differentfrom the target word but when the eyes cross the boundary, the information of thetarget word is in the preview. The size of this preview benefit is typically of the orderof 30-50 ms. The exact amount of preview benefit is modulated by the difficulty of thecurrent fixated word: the more difficulty to process the fixated word, the less is thepreview benefit obtained and viceversa. Another interesting result is that the previewbenefit is larger within words than across words.
An investigation about the characteristics of the word to the right of fixation thancan influence the duration of the current fixation has been motivated by the previewbenefit effect. This is largely known in the literature as the parafoveal-on-foveal effect.It is still in a controversial discussion and given the possibility of mislocalized fixationsand the fact that most of the positive evidence for these effects is based on corpus-basedanalyses, it seems reasonable to view such effects with caution according to Rayner etal. (2006).
After having presented some of the limitations but also positive aspects of the visionsystem that have a direct influence over the reading process, it is time to look at themechanisms that govern eye movements.
2.1.1.3 Control of eye movements in reading
The two interesting questions concerning eye movements are: what determines when tomove the eyes, and what determines where to move them? It has generally been consid-ered that these two decisions are made somewhat independently. Rayner & Pollatsek(1981) showed in a experiment with some manipulations that saccade length and fixa-tion duration are affected independently, reinforcing the view that the decisions aboutwhere and when to move are made somewhat independently.
At least in languages like English and other alphabetic languages, the decision ofwhere to move the eyes next is influenced by two main factors: length of words and spaceinformation. The length of the fixated word and the corresponding length of the word tothe right determines the length of the next saccade (Rayner, 1979), because if the word
2.1. Reading as text processing 15
to the right of the current fixation is either very long or very short, the saccade will tendto be longer than when a medium-size word is to the right of fixation. A second factorthat have some influence in where to land the next saccade is the space between wordsbecause some experiments have shown that when spaces are removed, reading slowsdown by as much as 30-50%. Contrarely, other experiments have demonstrated thatwhen space information was provided for readers of Thai (who are not used to readingwith spaces between words), they read more effectively than normal (Kohsom andGobet, 1997). Surprisingly or not, semantic preprocessing of words does not influencewhere readers move their eyes (Rayner, 2009).
Another factor that has some influence in where to move the eyes is the landingposition effect. Rayner (1979) demonstrated that readers’ eyes tend to land betweenthe beginning and the middle of the word. This position is known as the preferredviewing location (PVL). When readers’ eyes land at a nonoptimal position in a word,they are more likely to refixate that word with a very short saccade (Rayner et al.,1996). At the end, the final landing position also depends on the prior launch site.There is other factor which influences the landing position and it is related to thefixation location on a word. Recognition time is minimized when the fixation is at thecentre of the word. This is called the optimal viewing position (OVP). Moreover, whenreaders make only one fixation on a word, if that fixation is at the centre of the word,then the fixation is longer than when a single fixation is at the end of the word. Thisis called the inverted optimal viewing position (IOVP) effect. Naturally, during thereading process some words are not fixated. This is called the skipping effect. A wordskipped does not mean that the word was not processed. In fact, the word is processedin parafoveal vision before or after of skipping the word because the context helps toidentify that word. The most important factor that influences the skipping effect isthe word length (Rayner, 1998) because in general short words are much more likelyto be skipped than long words. Skipping words are also regulated by the contextualconstraints. Words that are highly predictable by the context are much more likely tobe skipped than those that are not predictable.
Concerning the second question about when to move the eyes it has been clearthat ease or difficulty of the word processed has a strong influence. Basically, all thevariables that influence when to move the eyes can be grouped in lexical and linguisticvariables. Some of them are word frequency, word predictability, number of meanings,phonological properties of words, semantic relations between fixated words and priorwords, word familiarity among others (Rayner, 2009). It has also been demonstratedthat morphological properties of the words present some influence over the fixation timeson target words. For example, in longer compound words, a high frequency beginningor ending lexeme is fixated shorter than low-frequency lexemes. To sum up, the wordfrequency, age of acquisition and the word predictability are the variables with a strongand immediate effect on how long readers look at word and the other variables has an

16 Chapter 2. State of the Art
influence on how soon readers move on in the text.In any case, there is no doubt that cognitive processing activities have a strong
influence on when the eyes move.Finally and as it was already mentioned before, the main objective of the current
thesis is to develop a computational cognitive model of people looking for information.We have started by reviewing some aspects of the behavior during the reading process,we should now take a look into models of reading before to present the cognitive taskin which we are interested the most: searching for information.
2.1.2 Models of Reading
Two of the most representative computational models for reading will be presentedin this section: E-Z reader and SWIFT. E-Z reader corresponds to the category ofmodels where words are serially treated: only one word is processed at a time, becausethe next word could be processed even if the eye is still in the current word. This isbecause attention and eye movement do not progress together in E-Z reader. In thecase of SWIFT model, the words are treated in parallel: more than one word could beprocessed at a time.
2.1.2.1 E-Z Reader
The E-Z reader model (Reichle et al., 1998, 2003, 2006) describes a theoretical frame-work to understand how word identification, visual processing, attention, and oculo-motor control determine when and where the eyes move during reading. The modeloperation is based on two important assumptions: the attention that is necessary toprocess and identify printed words during reading is done serially (one word at a time)even if this is opposed to what is assumed in most alternative models of eye-movementcontrol in reading, which assume that attention is done in parallel to support the simul-taneous processing of multiple words (Engbert et al., 2005; Reilly and Radach, 2006) orthat attention has little or nothing to do with eye-movement control. A second impor-tant assumption of the model refers to a decoupling of two signals: the signal to shiftcovert attention to the next word and the signal to make an eye movement to the nextword. The recognition phase of a wordn is composed of three different stages:
• V: A visual processing in a preattentive manner. Low-spatial frequency informa-tion about word boundaries is used to select the upcoming saccade target andhigh-spatial frequency information about letter and/or word features is used toidentify the individual letters and words.
• L1: Familiarity check (in an attentive manner) causes the eyes to prepare tomove forward to the word during reading. This is attenuated by visual acuity, as

2.1. Reading as text processing 17
Figure 2.5: Schematic diagram of the E-Z reader model of eye-movement control inreading (Reichle et al., 1998, 2003, 2006). The block components are: preattentivevisual processing (V), familiarity check (L1), lexical access (L2), attention shift (A),postlexical integration (I), labile saccadic programming (M1) and nonlabile saccadicprogramming (M2).
a function of foveal eccentricity, or the mean absolute distance in character spacesbetween each of the letters of wordn and the current fixation location.
• L2: Lexical access (in an attentive manner) is the trigger to shift attention to thenext word. This reflects whatever minimal amount of time is necessary to activatethe word’s meaning.
Then, two processes are simultaneously executed. First, attention shifts (A) fromwordn to wordn+1. Second, the meaning of the word is subjected to some minimalamount of higher level language processing called postlexical language processing in-tegration (I). The saccadic programming in E-Z reader is completed in two stages: apreliminary labile stage (M1) that can be canceled by the initiation of subsequent sac-cadic programs, followed by a nonlabile stage (M2) that is not subject to cancellation.Fig. 2.5 shows a schematic diagram of the E-Z reader model with its block components.In E-Z reader, a saccade is posited to be directed toward the optimal viewing position(the center of the word), but saccades usually land at a location other than the intendedtarget because of both systematic and random error.
The lengths of the executed saccades (in character spaces) are therefore the sumof three components: the intended saccade length, systematic error, and random error.The systematic error (on average) causes short saccades to overshoot their intendedtargets and long saccades to undershoot their targets. This error is modulated by thestarting fixation duration: the longer the fixation duration, the higher the accuracy of

18 Chapter 2. State of the Art
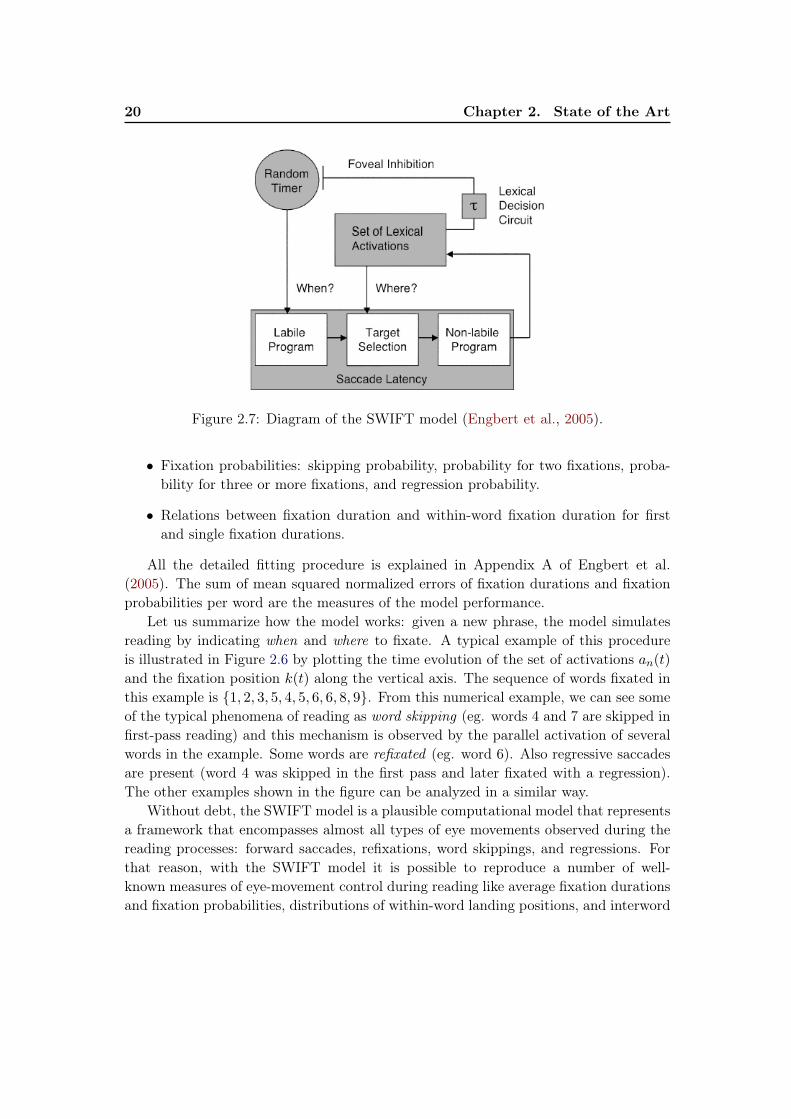
Figure 2.6: Example of the numerical simulation of the SWIFT model (Engbert et al.,2005). Fixation position k(t) is indicated by the dark black line (in units of letters),activations an(t) by the gray areas and saccades by the lighter horizontal lines.
the saccade. The random error increases with the amplitude of the saccade.The new location of the eye is propagated from the retina to the brain so that it can
be used to the lexical processing, which continues using information from the previousviewing location during the saccade and for the duration of the eye-mind lag. Thisstage is assumed to be preattentive, with low-spatial frequency information about wordboundaries being used by the oculomotor system to select the upcoming saccade targetand high-spatial frequency information about letter and/or word features being used toidentify the individual letters and words.
So far, a quick review about the E-Z reader model was given. The model is still validand on last years has been used to explain also many phenomena related to non-readingtasks (Reichle et al., 2012).
2.1.2.2 SWIFT
Engbert et al. (2005) presents SWIFT-II (an advanced version of SWIFT-I, (Engbertet al., 2002)) that is a model with a strong mathematical background which contributesto the understanding of the control of eye movements during reading. The main differ-ence between SWIFT and the EZ-reader model is that in the first one more than oneword can be seen/processed in parallel way. SWIFT is based on the following principles:

2.1. Reading as text processing 19
• Principle 1: The processing of an activation field is spatially distributed: thetarget word to be fixated is selected from a competition between words accordingto their activation. Activation can be seen as a saliency map of words as isindicated (in gray) in Fig. 2.6. Due to the fact that activations are done in aparallel way over several words, the processing is also distributed among severalwords at a time.
• Principle 2: Pathways for saccade timing and saccade target selection aretreated separately: problems of when to start the next saccade program andwhere to go next, are not coupled.
• Principle 3: Autonomous generation of the saccade and foveal inhibition: fixa-tion duration depends on the programming time for saccade and it is modulatedby a foveal inhibition process that increases with difficult words.
• Principle 4: A saccade programming is done in two stages: a saccade is pro-grammed during the labile stage, but a new saccade could be programmed withthe cancellation of the first saccade. In the nonlabile stage, the target is selectedand the saccade cannot be cancelled.
• Principle 5: Inherently, there are systematic and random errors in the lengthof saccades.
• Principle 6: Mislocated fixations are corrected: when a saccade land on unin-tended words, a new saccade program starts immediately.
• Principle 7: Saccade latency is modulated by the amplitude of the intendedsaccade: the time needed to start the saccade depends on the amplitude of thesaccade to execute.
Fig. 2.7 illustrates a general diagram of the SWIFT model. By using Princi-ple 1, word recognition is implemented as the spatially distributed process mentionedpreviously. According to Principle 2, the two separate pathways used by the foveal in-hibition determine the saccade target selection (where) and the saccade timing (when).The lexical decision circuit can influence saccade timing by foveal inhibition only witha time delay τ (Principle 3). As it was also explained before, saccade programmingis splitted in two different states (Principle 4). The nonlabile stage (a point of noreturn) is preceded by a labile stage (a point of return) and target selection occurs atthe transition from labile to nonlabile stage.
The estimation of the model parameters is based on word measures. The measureswere:
• Fixation durations: first fixation duration, second fixation duration, single fixationduration, and total reading time and their corresponding distributions.
20 Chapter 2. State of the Art
Figure 2.7: Diagram of the SWIFT model (Engbert et al., 2005).
• Fixation probabilities: skipping probability, probability for two fixations, proba-bility for three or more fixations, and regression probability.
• Relations between fixation duration and within-word fixation duration for firstand single fixation durations.
All the detailed fitting procedure is explained in Appendix A of Engbert et al.(2005). The sum of mean squared normalized errors of fixation durations and fixationprobabilities per word are the measures of the model performance.
Let us summarize how the model works: given a new phrase, the model simulatesreading by indicating when and where to fixate. A typical example of this procedureis illustrated in Figure 2.6 by plotting the time evolution of the set of activations an(t)
and the fixation position k(t) along the vertical axis. The sequence of words fixated inthis example is {1, 2, 3, 5, 4, 5, 6, 6, 8, 9}. From this numerical example, we can see someof the typical phenomena of reading as word skipping (eg. words 4 and 7 are skipped infirst-pass reading) and this mechanism is observed by the parallel activation of severalwords in the example. Some words are refixated (eg. word 6). Also regressive saccadesare present (word 4 was skipped in the first pass and later fixated with a regression).The other examples shown in the figure can be analyzed in a similar way.
Without debt, the SWIFT model is a plausible computational model that representsa framework that encompasses almost all types of eye movements observed during thereading processes: forward saccades, refixations, word skippings, and regressions. Forthat reason, with the SWIFT model it is possible to reproduce a number of well-known measures of eye-movement control during reading like average fixation durationsand fixation probabilities, distributions of within-word landing positions, and interword
2.2. Searching on texts 21
regressions.Now that we have reviewed in a very simplified way the reading process and two of
the most representative models of reading, we are going to look at the type of cognitivetask we are interested in the current thesis: information search on textual material.
2.2 Searching on texts
In this section, we would like to make the distinction between reading and non-readingtasks on textual material. More particularly, we will focus on one of the well-knownnon-reading tasks: searching on text.
2.2.1 Searching
A searching task on texts could be as simple as looking-up for a particular word (asit is done in a dictionary), looking for the most relevant article related to a givensubject, looking for specific information to answer a particular data question, etc. Allthese activities are different from pure reading, because all of them imply to manageat the same time the text processed so far but also the search goal in mind. Veryoften, information search activity implies making decisions because information searchis a process in which a person seeks data or knowledge about a problem, situation, orartifact. Thus, people need to make semantic judgments in such tasks.
Since that our ultimate goal in the current research is to build a model to makepredictions about how people look for information on textual material, some of themost representative works already done in information search area are now presented.
2.2.2 Models for searching
In this section, we will concentrate on the description of some representative modelingworks done for non-reading tasks and more specifically for searching tasks. E-Z readermodel for non-reading tasks is presented, and a hidden Markov model learned from eyemovements for information search tasks is also described. Next, a very simple modelbased on different visual strategies of information search is presented. At the end, acomputational cognitive model of information search is also detailed.
On last decades there has been considerable progress in understanding such tasksbut the progress has been slower at least because the demands of these tasks are muchless constrained than those of reading (Reichle et al., 2012). For example, in a sceneviewing task, eye movements reflect both the variability of the physical layout of scenesand the goals of the viewer. There are a very limited number of computational models ofeye-movement control in non-reading tasks due to its complexity among other reasons.Moreover, most of them account for only limited aspects of the tasks being simulated.For example, they simulate when or where the eyes move during scene viewing but

22 Chapter 2. State of the Art
not both. They have also been developed and evaluated only within each of theirrespective task, with any consideration of whether the theoretical assumptions of themodels generalize to other tasks. A well-known exception for this is the modified versionof the E-Z reader model (Reichle et al., 2012) since as it was presented earlier, theoriginal conception of such model was for reading purposes but a modified version ofthe model for non-reading tasks is presented now.
2.2.2.1 E-Z Reader for non-reading tasks
Reichle et al. (2012) present the E-Z reader model to simulate eye movements in non-reading tasks as a unified framework for understanding the eye-mind link, as opposedto most of the research done using that model.
They use variants of the E-Z reader model of eye-movement control in reading tosimulate eye-movement behavior in several of non-reading tasks. Their strategy in thesimulations was to first examine whether the basic framework of the E-Z reader modelcould be used to simulate eye movements in three non-reading tasks: (a) visual searchfor a specific target word, (b) z-string “reading” and (c) visual search for an O in clustersof Landolt Cs (rings with a small segment missing, making them look like Cs).
With the simulations, they demonstrated which of the assumptions are sufficientto account for the similarities/differences in eye movement patterns in both, readingand non-reading tasks. In the target-word search, subjects are instructed to scan sen-tences for a particular target word (e.g. looking-up the word book) and to indicate alloccurrences of the target word with button presses. In the z-string “reading”, subjectsare instructed to “pretend” that they are reading sentences in which all of the lettersin each of the sentences have been replaced by the letter z, but with capitalization,spaces, and punctuation preserved (e.g., the sentence “During the year, many questionswere made” would thus be converted to “Zzzzzz zzz zzzz, zzzz zzzzzzzzz zzzz zzzz”). Inthe Landolt-C task, subjects are instructed to search through an array of Landolt C sand to indicate whether there was also a letter O in the display with a button press.The “gap” size (measured in terms of number of pixels) in the Landolt Cs was varied,making the task of discriminating them from the target Os more or less difficult. Allthese non-reading tasks are similar because they logically require little or no languageprocessing (e.g., practically everyone without any particular level of knowledge can scanthrough sentences and decide whether word engine is present or not, by performing apattern matching process).
They assumed that attention is also allocated serially (as in E-Z reader model forreading task) and simplified the modeling work as a basis for generating interestinghypothesis. Due to the fact that the non-reading tasks involved very little of highlevel language cognitive processing, the E-Z reader model’s assumptions about howhigher level processing influences progressive eye movements was disabled to analyze

2.2. Searching on texts 23
how object processing and identification affect the patterns of the eye movements forthe first-pass when there is no any assumption about higher level processing.
Those assumptions related to the programming saccadic and its execution can begeneralized to a wide variety of visual-cognitive tasks, because in fact they were derivedfrom reading and non-reading tasks for the E-Z reader model. However, for exampleit is expected to observe a variability for the precise metrics of the saccades becausethe optimal saccade length depends on the nature of the task. Lastly and concerningthe assumptions referring to the visual processing, they also have considered that thedegree to which limitations in visual acuity influence the identification of different visualstimuli may vary in function of the nature of the task.
An interesting result is that, although most of the basic principles of the E-Z readermodel are applicable to other visual cognitive tasks, the assumption that the familiaritycheck (L1) (See Fig. 2.5) to initiate a saccadic programming is a preliminary stage ofword identification is may be limited to reading or reading-like tasks. A second one refersto the fact that the overall time that is required to trigger the saccade can vary andcan be modulated by cognitive variables (eg. word frequency). However, the authorsacknowledged that these results should be seen as working hypotheses more than trueconjectures because they do not provide definitive proof that they are true.
All the simulations also demonstrated that a single computational framework issufficient to simulate eye movements in both reading and non-reading tasks but alsosuggest that there are task-specific differences in both saccadic targeting (where tomove the eyes?) and the coupling between saccadic programming and the movementof attention (when to move the eyes?). The architecture of the E-Z reader model thatguides eye movements in tasks such as reading is flexible enough to accommodate tasksother than reading. These results suggest that some aspects of the eye-mind link areflexible and can be configured in a manner that supports efficient task performance.
Now a hidden Markov model learned from eye movements for information searchtasks is presented.
2.2.2.2 Markov model for processing cognitive states from eye movementsin information search
Simola, et al. (2008) present a modeling work using a discriminative hidden Markovmodel (dHMM) whose parameters were learned from experimental eye movement data.With the proposed model, they are able to make predictions about how processingstates alternate (they assumed variations of the eye movements pattern within a task)when people is performing an information search task. For example, at the beginningof a information search task people could perform a scanning strategy characterised byrather longer saccades without any preference on direction and fewer backward saccades.Eventually they could switch to a reading strategy with frequent short forward saccades

24 Chapter 2. State of the Art
with an average fixation duration about 200ms, etc. This is the same problem that wehave discussed around Fig. 2.1a and 2.1b (p. 10), where we showed how participantscan follow different strategies for reading an item of information and how they canswitch to a different way of processing the item that they are looking at.
Simola, et al. (2008) followed a reverse inference approach by trying to infer thehidden cognitive states from an observable eye movement behavior. The informationsearch tasks were: a) looking-up a word (W), b) answering a question (A) and c) findingsubjectively the most interesting topic from among various ones (I). The associationbetween eye movements and language processing is made by modeling the sequencesof fixations and saccades and by assuming the existence of states as indicators of thecognitive system that alternates between different states of processing. The sequenceof fixations and sacaddes were treated as time series and modeled by the dHMM. Tolearn the model, four features were extracted from each fixation-saccade data:
1. Logarithm of fixation duration (in ms).
2. Logarithm of outgoing saccade length (in pixels).
3. Outgoing saccade direction (four different directions) + a fifth state to indicatethe trial end.
4. A flag variable to indicate if the currently fixated word was previously fixated.
Three states were uncovered and designated by comparing the parameter values to liter-ature on cognitive tasks (eg. on reading) to describe the processing behavior reflected inthe eye movement data. This was possible due to the consistency observed into the pa-rameter values of the dHMM in the three states for the three different tasks (see Simola,et al. (2008) for details). For example, at the beginning of the task and with a proba-bility of 67% (32+20+15) participants performed a behavior termed scanning. Fixationduration were short (135 ms) which agrees with the fact that shorter fixations are as-sociated with easier task (Rayner, 1998). With a probability of 43% (16+20+7), thesecond state observed is labeled as reading. Here the percentage of regressive saccadescorrespond to the previous findings suggesting that in normal reading about 10-15% ofsaccades are regressions (Rayner, 1998). Also, the average saccade length was 10.3-10.7letters, which corresponds to the average length of a word (9.9 characters), plus a spacebetween words. Finally, participants turned into a stated termed as decision becausethe features indicated a lot of rereading of the previously seen lines. This states is char-acterised by the high frequency of forward and backward (20-30%) saccades. Saccadelengths (10.7 letters) also correspond to the length of a word, and occurred within thesame line (with 75% probability). With a high probability of 78-86%, new fixationswere in a previously fixated words and were shorter (175 ms) than in the reading state.
A schematic diagram of the dHMM that best fitted the data is shown in Fig. 2.8.The diagram indicates the probability transitions between the states for each of the

2.2. Searching on texts 25
Figure 2.8: Transition probabilities and topology of the dHMM (Simola et al., 2008).Symbols used are circles (hidden states), arrows (transitions) and their probabilityvalues. Tasks: W (looking-up a word), A (answering a question), I (finding the mostinteresting topic), s(scanning), r(reading) and d(decision).

26 Chapter 2. State of the Art
experimental condition (W,A,I ). The beginning of a sequence is indicated by π andthe arrows are the state transitions. For example, we can notice that in the W andA conditions, participants switched more often from scanning to decision (with 80%probability) than to reading (20% probability). This can be seen from Fig. 2.8 bycomparing the associated transition probabilities (8% vs. 2%). This is because bothtask are relatively easier than in the I condition where the transition probabilities toswitch from scanning to decision/reading were the same (3% probability). We canalso observe that in W condition, transitions from decision state occurs in rare cases(1% probability) whereas in the A condition, these transitions occur more often (5%probability) and in the I condition they are still more frequent (14% probability). Aspreviously, we can explain this by the different grade of difficulty among the tasks.A possible explanation is that participants could have adjusted their processing statesaccording to the current task demands as is proposed by Carver (1990).
We can imagine several implications from the proposed model. Interactive infor-mation search applications could benefit from it, because they could learn and adaptthemselves to the goals and intentions of the users. On the other hand new experimentsmight provide valuable information about the link between the processing states ob-served and the eye movement patterns by combining eyetracking and other tecnologiesused in cognitive science research (eg. electroencephalography, fMRI, etc.). Lastly andas the authors also mentioned, it will be also interesting to study how the processingstates would be generalizable to other cognitive tasks (those different from search tasks)and if people differ in the way they switch between processing states.
2.2.2.3 An information search model based on visual strategies
Lemaire et al. (2011) investigate visual strategies of eye movements in processing textualmaterial and proposed a 5-parameter cognitive computational model which simulatesthe people’s oculomotor behavior considering the differences in such visual strategies.As in Simola et al. (2008) and Cole et al. (2011), they also showed that there is taskeffect on the processing patterns (visual strategies) during information search. Then,their idea was to build a model that would account for these various visual strategies.The different processing patterns they followed are described by Carver (1990). Theprocessing patterns differ in reading rates, the length of saccades, fixation duration andnumber of regressions.
The aim of the modeling work was to build a general model by adjusting the param-eters according to a one of three possible tasks: a) searching a target word, b) searchingthe most relevant paragraph according to a goal and c) memorizing a paragraph. Basi-cally, the model selects which word to fixate next among all words in a paragraph, bycomputing it with the 5-parameter mathematical expression of the model. The overallprocess is an iteration of two steps: weighting all words and selecting the best weighted

2.2. Searching on texts 27
Figure 2.9: A participant scanpath (top). Two artificial scanpaths (middle and bottom),Lemaire, et al. (2011).
one. The five variables of the model are: 1) word length, 2) distance to the currentfixation, 3) saccade horizontality, 4) shape similarity with the target and 5) newnessof the word. Then, given a task (eg. looking up a target word, memorizing a para-graph, etc.) the model assigns predefined weights to variables. Then each word is givena weight by simply combining the values given by all variables. The variables wereweighed differently according to the task involved (they play a different level of roleamong the tasks). These weight were learned from the data. For example, the length ofwords plays an important role in the task b), a reduced role in the task a) and no role atall in the task c). However minimizing the distance to the current fixation is crucial inb), not so important in scanning a) and slightly necessary in c). Also the horizontalityof saccades is very important in c) and b) but not much in a). Finally visual similarityof word shape is only necessary in a). The simulation results of the model are closeto those observed in the participant’s data and they are achieved with a simple linearcombination of the five parameters of the model. For example, Fig. 2.9 shows an ex-perimental participant’s scanpath (top) and artificial scanpaths generated by the modelwith different parameter values (at middle and bottom). The middle scanpath is closeto the participant’s scanpath and it is more likely that both are following a scanningstrategy instead of a reading as is observed in the artificial scanpath at the bottom.The idea of the example is to show how it is possible to generate different scanpaths byusing the same model but setting its parameter values differently.
The fastest participant performance (less fixations) was observed in task a) becauseit is likely that users tend to prefer words which match with the target. Task b) isparticularly of our interest for the purposes of current thesis. However, we thought thatthe inclusion of a semantic component may be particularly interesting because by this
28 Chapter 2. State of the Art
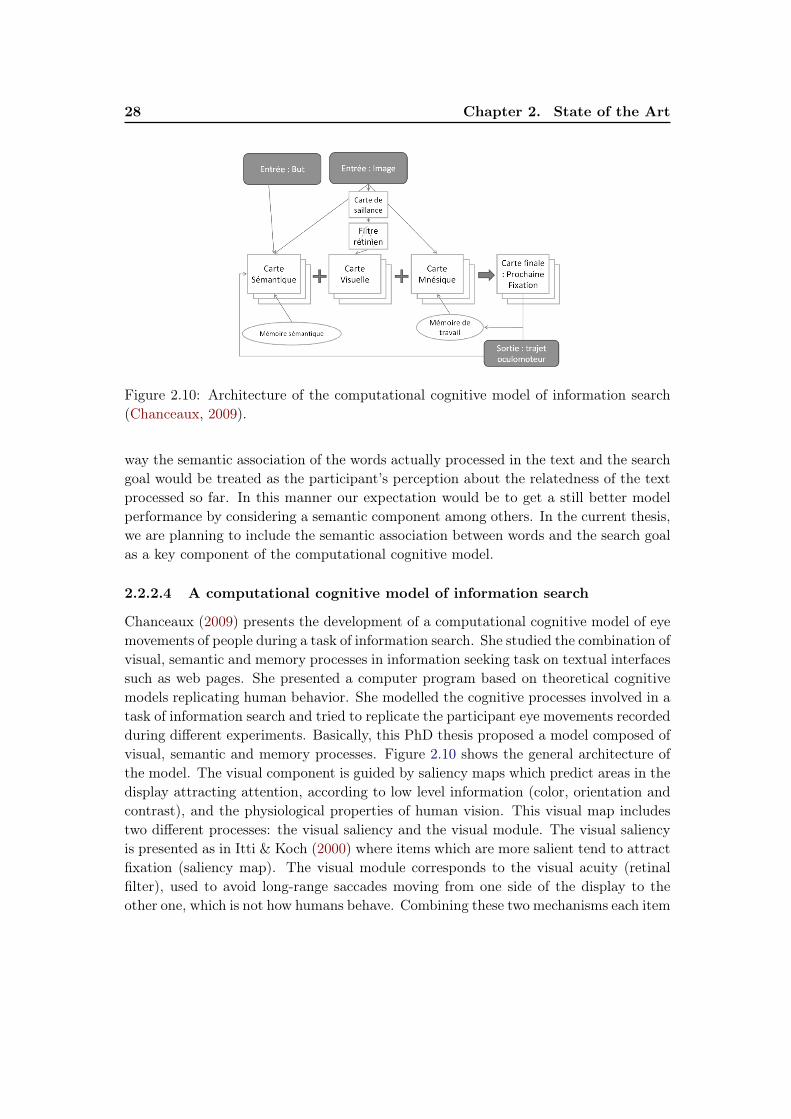
Figure 2.10: Architecture of the computational cognitive model of information search(Chanceaux, 2009).
way the semantic association of the words actually processed in the text and the searchgoal would be treated as the participant’s perception about the relatedness of the textprocessed so far. In this manner our expectation would be to get a still better modelperformance by considering a semantic component among others. In the current thesis,we are planning to include the semantic association between words and the search goalas a key component of the computational cognitive model.
2.2.2.4 A computational cognitive model of information search
Chanceaux (2009) presents the development of a computational cognitive model of eyemovements of people during a task of information search. She studied the combination ofvisual, semantic and memory processes in information seeking task on textual interfacessuch as web pages. She presented a computer program based on theoretical cognitivemodels replicating human behavior. She modelled the cognitive processes involved in atask of information search and tried to replicate the participant eye movements recordedduring different experiments. Basically, this PhD thesis proposed a model composed ofvisual, semantic and memory processes. Figure 2.10 shows the general architecture ofthe model. The visual component is guided by saliency maps which predict areas in thedisplay attracting attention, according to low level information (color, orientation andcontrast), and the physiological properties of human vision. This visual map includestwo different processes: the visual saliency and the visual module. The visual saliencyis presented as in Itti & Koch (2000) where items which are more salient tend to attractfixation (saliency map). The visual module corresponds to the visual acuity (retinalfilter), used to avoid long-range saccades moving from one side of the display to theother one, which is not how humans behave. Combining these two mechanisms each item

2.3. Decision making and information search 29
receives a visual weight. On the semantic component (semantic map), the similarity iscomputed by the model using Latent Semantic Analysis (LSA) (Landauer et al., 2007).LSA is a mathematical tool where words occurring in similar contexts are representedby similar vectors. The semantic similarity between two set of words is computedby using the cosine function between the corresponding LSA vectors. The higher thecosine value, the more similar the words (or sentences) are. Finally and before toexecute the next fixation, the memory processess (memory map) are generated by themechanism of inhibition of return and the variable memory model (Chanceaux, 2009).The whole method is composed of the following steps: designing a theoretical modelof interaction, designing a simulation tool, and developing psychophysical experimentswith eyetracking techniques to validate and to refine the proposed model.
Differently to the work presented so far, our plan is to study in a more detail theway people make decisions to stop reading an item information (a paragraph) whenthey are looking for a specific information. This is one limitation stated by Chanceaux(2009) of the model presented because it does not consider an accuracy mechanism tostop reading a paragraph. Additionally, we have simplified the stimuli pages (to 1 or2 paragraphs per page). This situation will allow us to study the intra-paragraph (e.g.how the words forming a paragraph are processed) strategy of a participant with moreaccuracy than Chanceaux (2009) because we will be able to manage the stimuli pageswith a higher spatial resolution among other advantages.
Finally, after having reviewed most of the important aspects of the searching activityon textual material and some of most representative computational models, we aregoing now to discuss the way in how the information search is interwined with thedecision making. Firstly, behavioral aspects of decision making activity are presentedand secondly, a computational model for making such decisions is also presented.
2.3 Decision making and information search
2.3.1 Decisions
A decision is a commitment to a proposition among multiple options. Often this com-mitment leads to a particular action. It might be said that the life of an organismconsists of a serie of decisions made in time (Sartre, 1984). Decision making involvesaccumulation of evidence about choice alternatives. This process often takes time whenthe quality of information is poor or there are numerous choice options to consider.In everyday life people often make decisions. We can cite some typical examples byimagining that someone is wondering about the following situations:
• Shall I bring the umbrella today? The answer may depends on something un-known, because I do not know if it will rain or not;

30 Chapter 2. State of the Art
• I am looking for a house to buy. Shall I buy this one?. It could be the case thatI have already found one, but perhaps I will find a still better house for the sameprice if I go on searching. When shall I stop the search?
• I am in a bookstore to look for a new book to read during my spare time and Ihave pre-selected two or three of them, but I would like to buy only one. Whichone seems to be the most interesting? or should I buy the cheapest one?
The list of examples would be unending but the three examples show us a wide varietyof making decision situations in which people are often faced in real life. Particularlythe last two can be seen as information search tasks involving mechanisms of decisionmaking. Most of problem solving and decision making behavior relies on informationsearch. In the current thesis, we are interested in this kind of information search tasksthat encourage to adopt decision making mechanisms.
Searching information on the Internet has become a significant activity in the dailylives of individuals in all the world. The expectation is that this activity is going tocontinue increasing in the future. Very little is known about why people stop searchingfor information online despite the increasing importance of online search behavior indecision making and problem solving (Browne et al., 2007). Understanding why peoplestop information search is important to both theory and practice in a wide variety ofdomains as Browne et al. (2007) have stated. Information search has a direct impacton the number and quality of alternatives considered and on the alternative selected.Stopping a search on the World Wide Web is even more critical due to the high numberof existing alternatives. Thus, understanding the mechanisms people use to stop onlinesearch is of particular importance. Web designers will be also benefit from getting abetter understanding of consumer stopping behavior and they will be able to developfeatures that will cause people to stop on their sites. In a problem-solving or decision-making process, the search process is terminated at some point because the personjudges that she has enough information to move to the next stage (Browne et al., 2007).This judgment of sufficiency is made by using a stopping rule or heuristic (Browne et al.,2007). The stopping rules can be either cognitive or motivational in origin. Cognitivestopping rules result from the ways in which people process information and their mentalmodels of tasks or environments. Preferences, desires, or internal/external incentives,such as deadlines, costs, or preferences for closure give as result the motivational rules.Here, we are only interested in the cognitive stopping rules.
Cognitive stopping rules are used during different stages of decision making. In theearly stages dominated by information search and the design of alternatives, they areused to terminate the information acquisition process and to assess the sufficiency ofthe information collected.
In the latter stages of decision making dominated by choice, stopping rules are usedby the decision maker to stop his evaluation of alternatives and to make a choice (Simon,

2.3. Decision making and information search 31
1996). Four cognitive stopping rules investigating sufficiency of information were firstsuggested by Nickles et al. (1995) and a fifth was suggested in exploratory data byBrowne & Pitts (2007) and verified through empirical investigation by Browne et al.(2005). The five rules are described and exemplified in Table 2.1.
In their study, Browne et al. (2007) used as a working hypothesis the fact that thedegree of task structure and the cognitive strategy the decision maker uses to representthe task would be useful in helping to understand the stopping rule use in web-basedsearch. Task structure refers to the degree to which the necessary inputs, operationson those inputs, and outputs are known and recognizable to the decision maker. Thisis the case of the example shown in Table 2.1 (on first row) where people has a mentallist of items that must be satisfied before he will stop collecting information. With thiswell-structured task, decision makers understand the nature of the problem and thesteps necessary to solve it. Here, a descomposition strategy could be used by peoplebecause the information available is at least in part discrete and various task elements,criteria, or attributes can be separately identified.
However, people sometimes search for information until their mental representationstops shifting and stabilizes as in the case of the example in Table 2.1 (second row), whenthe task is poorly structured and it is represented as a whole. Here, the informationavailable may or may not be discrete but the mental representation is integrative. Peopleact based on their sense or image of the situation rather than on individual elements.This kind of strategy is also called holistic.
Rule Description ExampleMental list Person has a mental list
of items that must besatisfied before he willstop collecting informa-tion.
In searching for information concerning thepurchase of a car, a person continues untilhe satisfies all the elements on his mentallist (e.g., model, price, and color).
RepresentationalStability
Person searches forinformation until hismental representationstops shifting andstabilizes.
To diagnose a patient’s illness, a physicianasks the patient to describe his symptoms.When the physician reasons that his men-tal model of the patient’s condition is nolonger changing, he stops asking the patientfurther questions.
Difference Thresh-old
When person stopslearning new infor-mation, he stops hisinformation search(there is a priori differ-ence level to establishthat nothing new islearning).
In gathering requirements for a new in-formation system, a systems analyst inter-views users until he determines that he is nolonger learning new information. At thatpoint, he terminates the requirements elici-tation process.

32 Chapter 2. State of the Art
Magnitude Thresh-old
Person has a cumula-tive amount of informa-tion that he needs be-fore he will stop search-ing. The focus is onhaving “enough” infor-mation.
When perusing a newspaper article, areader may skim the article until he hasenough information to develop an idea ofwhat it is about.
Single Criterion Person decides tosearch for informationrelated to a single crite-rion and stops when hehas enough informationabout that criterion.
To choose a university to attend, a highschool student searches only for informationconcerning the quality of the universities’overseas programs.
Table 2.1: Cognitive stopping rules adapted from Browne et al. (2007).
The strategy a person will follow depends on several factors such as the task com-plexity and experience with the task. Browne et al. (2007) operationalize the complexityof the task by using a typology proposed by Campbell (1988). They have also consid-ered two extra hypotheses: tasks with lower complexity in which the decision makerhas experience will tend to be approached using a decomposition strategy and taskswith higher complexity in which the decision maker has less experience will tend to beapproached using a holistic strategy.
For their study purposes, three different experiments of information search onlinewere carried out. In the first experiment, they asked participants to search for a par-ticular product at BestBuy.com. The task was well-structured, since the inputs, oper-ations, and outputs of the problem should have been recognized and easily understoodby participants. There were various alternatives to be evaluated according to a set ofdecomposable criteria such as price and product features. This was a low complexitytask according to Campbell’s typology (1988).
In a second experiment, participants were asked to search for a job with Ama-zon.com. The task was also well-structured because participants should clearly under-stand the nature of the problem and what is required of them. Participants should alsohave experience with this type of task. The task was of medium complexity accordingto Campbell’s typology (1988), since there are multiple paths to a desired outcome. Thetask also contained decomposable elements such as location, salary, job responsibilities,etc.
For these two experiments, their expectation was to have more participants usingthe mental list and single criterion stopping rules than others because they are well-structured and decomposable tasks.

2.3. Decision making and information search 33
In the last experiment, they chose a search problem that was poorly structured and,due to its complexity and participants’ lack of experience with such tasks, not easilydecomposable. They asked participants to search online for the map of a battlefield.They referred to a relatively small battle area, with scarce maps online and varied.Participants were also told that they would need to draw the battlefield from memoryafter performing their search. The expectation for the experiment was to have moreparticipants using the magnitude threshold and representational stability stopping rulesthan others because it was a poorly structured and a holistic task.
The experimental results confirmed their hypotheses and suggested that the di-mensions of task structure and nature of the person’s representation has an importantinfluence on the stopping rules used by people to gauge the sufficiency of informationin such tasks.
However, they have studied only two types of search tasks using only two com-binations of the important dimensions for determining the stopping rule used: well-structured/decomposable and poorly structured/holistic. As the same authors recog-nise, further studies with other possible combinations are needed.
They also investigated only the task characteristics of structuredness and represen-tation strategy. Maybe other task characteristics may also has an impact over stoppingrules. Another important thing is that the task structure and representation strat-egy were treated as discrete categories but they are actually continua. Last but notleast, new exploratory studies with different stimuli might reveal the use of additionalcognitive stopping rules.
2.3.2 Models for decision making
Typically, people need to perform a fast “on-line” text document classification for largenumbers of documents. For example, we can suppose that we need to do a first classifica-tion of the most representative research works done in operating systems area publishedon the last two years. Clearly, it is an interesting problem for cognitive science, becauseit involves real world human decision making with complicated stimuli. In only twoyears the number of research work reported could be huge. This is also an importantproblem in machine learning and related areas which involves deciding whether or nota document is about a given topic. There are automatic classifiers but most of themtakes time to process large text corpora (e.g. on documents with a large number ofwords) because they consider every word in the treated document. In this section, acomputational modeling work about the text classification problem is presented with apotential application in an automatic system of text classification.
Lee & Corlett (2003) present an interesting work which involves the central problemof text classification: deciding whether or not a document is about a given topic. Theydeveloped two cognitive models of human decision making, and also used them to test

34 Chapter 2. State of the Art
automated text classification systems. The following observations are considered:
• People often make non-compensatory decisions because they do not consider allof the words in a document to decide whether or not the text is about a topic.
• The relationship between the decisions “the document is about the topic” and “thedocument is not about the topic” is a choice between two competing models. Thecontent of the document is used as evidence in favor of either decision.
• People generate more information than just a binary choice when deciding whetheror not a text document is about a topic because there is a complete decision-making. They take a period of time for answering and can express a level ofconfidence in such decision. These measures may be useful for the process ofmodel development, evaluation and comparison.
Lee & Corlett (2003) used as evidence measure, how often a word occurs in docu-ments about a topic relative to how often it occurs in documents not about that topic.For example, the presence of a word like “vatican” in a document provides strong evi-dence that the document is about the the ecclesiastical or sacerdotal-monarchical state,because it occurs in documents about the topic, and rarely in documents that are notabout the topic. In an opposite way, a word like “saccade” provides strong evidenceagainst a document being about the sacerdotal-monarchical state, because it seldomoccurs in documents about the topic, but does appear in documents about other topics.Very short words like “of” or “the” provides little evidence in favor of either decision,because they occur at the same rate in documents both about and not about the topic.Authors used the standard Reuters-21578 text corpus (Lewis, 1997) as source of realworld text documents.
The models are based on random walk and accumulator sequential sampling pro-cesses. In the first one, the total evidence is calculated as the difference between theevidence for the two competing alternatives. A decision is made once it reaches anupper or lower threshold. In this model a measure of confidence in the decision is de-termined by the number of words examined. The higher the number of words requiredto classify a document, the lower the confidence and viceversa. The overall modelingprocess is interpreted in Bayesian terms and the final formulation considers both priorprobabilities of “yes” and “no” decisions that determine the initial point of the randomwalk, followed by the summation of the evidence provided by each successive word inthe document. Figure 2.11 summarizes an example of the operation of the random walkmodel on a document that is about the topic being examined. The state of the randomwalk is shown as the evidence provided by successive words in the document. A thresh-old value of 50 is shown by the dotted lines above and below. Particularly, the exampleshows very well the use of non-compensatory decision making because if only the first100-260 words of the document have been treated, a correct “yes” decision would be

2.3. Decision making and information search 35
Figure 2.11: Example of the operation for the random walk model when the documentis about the topic (Lee and Corlett, 2003).
made because the evidence value is upper than the threshold but the final state of therandom walk when the entire document (∼ 450 words) has been considered, favors a“no” decision being made because the evidence value is lower than the threshold.
Differently, in the accumulator model both separate evidence totals for the “yes” and“no” decisions are computed. As with the random walk model, these totals may beginat non-zero values to reflect decision bias, and then accumulate evidence by readingthe words in the document. When the ith word is read, the two evidence totals areupdated. More specifically, the evidence provided by each successive word is added tothe “yes” accumulator if it is positive or the “no” accumulator if it is negative. Onceeither the “yes” accumulator or the “no” accumulator reaches certain threshold value,the corresponding decision is made. Confidence may be also determined by the numberof words read. However, a good alternative of confidence measure may be assessedusing a “balance of evidence” approach (Zandt et al., 2000), where it is measured as thedifference between the evidence totals as a proportion of the total evidence accumulated.Documents classified at the same point could be given different confidence measuresdepending on the level of evidence in the “no” accumulator: if the “no” accumulatorcontains no evidence, confidence will be high, whereas, if it contains almost as muchevidence as the “yes” accumulator, confidence will be low.
Fig. 2.12 shows the operation of the accumulator model on the same text documentconsidered in Fig. 2.11. Both accumulator totals are shown (by the two curves) assuccessive words in the document are read, and thresholds of 50 are once again indicatedby dotted lines. As with the random walk model, the accumulator model makes a non-compensatory “yes” decision, because the “yes” accumulator is the first to reach itsthreshold (at word 90th). After all of the words in the document have been read (∼450

36 Chapter 2. State of the Art
Figure 2.12: Example of the operation for the accumulator model on the same documentshown in Fig. 2.11 (Lee and Corlett, 2003).
words), however, a “no” decision is favored, because the “no” accumulator has greaterabsolute value of evidence (∼350).
The two models were created and validated with experimental data recorded in asimple experiment. In the experiment, a limited form of human text classification isconsidered, where words are presented serially (word by word) at a constant rate (oneword per second) until a decision is made regarding whether or not the document isabout a given topic. Two different instructions were given to the participant to makethe decision, either as quickly as possible or with the best possible accuracy. After eachdecision, participants were required to express their confidence in such decision.
Experimental results showed what they expected which is that people’s text clas-sification decisions are non-compensatory because their decision making is not doneby reading all the document words. Saying differently, their decision making is notnecessarily subject to a speed-accuracy tradeoff.
The random walk and accumulator model parameters were fitted to the empiricaldata: the evidence thresholds for the “yes” and “no” decisions. Fitting work is donefor both models for the speed and accuracy conditions. For the accumulator model,a large number of parameters matched all of the participants’ decisions for both thespeed and accuracy conditions. However, for none of the parameterizations examineddid the random walk model correctly predict the participants’ decisions for either thespeed or accuracy data.
They explain this by focusing on an important difference between the two models.The accumulator could make a “yes” decision, because the corresponding accumulatoris the first to reach the threshold, whereas the random walk model never reaches thepositive threshold, and eventually makes a forced “no” decision when all of the words in

2.4. Statement of the problem 37
the document have been read. The situation is because random walks treat evidence infavor of alternative decisions as being more commensurable than accumulators, in thesense that the presence of evidence in favor of one decision can be directly negated byequal strength evidence in favor of its alternative. For that, the evidence computationprocess used by the accumulator seems better suited than the random walk to modelingthe decisions made by humans in classifying text documents. It is possible, of course,that more sophisticated sequential sampling models based on random walks could fitbetter the decision data.
The performance of the accumulator model presented is promising. However, theevidence value used is a very simple model of human semantic representation. Whenpeople read text documents, meaning can be learned from parts of words, or sequencesof words, in a way that is mediated by the earlier content of the document. Providingsequential sampling models with evidence values that captured some of this richnessin meaning seems likely to improve their performance and this is not exactly the caseof the evidence value described in this work. Some examples of such models are La-tent Semantic Analysis (Landauer et al., 2007) and Hyperspace Analogue to Language(Lund and Burgess, 1996) approaches, as well as the probabilistic method developedby Griffiths & Steyvers (2002), all of which measure, in various ways, the patterns withwhich words appear in the same and different contexts.
Moreover, both the random walk and accumulator models presented here do not in-volve any form of memory, nor do they adapt to their environment in any self-regulatingway and, clearly real world human text classification involves a limited memory and apotential to learn and adapt. The extension of the models to incorporate these charac-teristics is theoretically important.
An important difference with respect to the aim of the current thesis is that we areinterested in studying people when they are engaged in task of information search andby presenting the whole stimuli at a time (a full article or paragraph). Let us sayingthat the cognitive behavior of people should be observed in a more ecological mannerand not by presenting one word at a time as it was done by Lee & Corlett (2003).
2.4 Statement of the problem
Our research problem is placed into the computational cognitive modeling of people’sbehavior faced to an information search task. The aim is to get a better understanding ofthe cognitive processes involved during a task of information search on textual materialby using a cognitive computational model-based approach. With such a model we willbe able to make predictions about how a textual document would be processed whenpeople are looking for information. There are also some practical benefits from such acognitive model because knowing where and why a user is likely to gaze at during aninformation search task is important for the design and evaluation of complex documents

38 Chapter 2. State of the Art
and especially web pages. Many works have already been done in this area, in particularin the context of web usability, but they usually consider that the user is processing thepage without any specific goal or by presenting the stimuli in a very artificial manner,among others restrictions, as we have presented in this chapter.
In the current thesis, we are interested in a modeling work for a very specific in-formation search task which always involves a goal (eg. a theme, a word, etc.) andconcerned with deciding whether an item of information read (eg. a paragraph, a news-paper article, etc.) is related or not to that search goal or whether the current item ismore interesting or not than another item that has been processed previously. Since theidea is to observe people’s behavior in the most possible ecological way like they werefaced to a real task, psychophysical experiments with minimum restrictions (eg. a self-paced manner reading) are designed in order to study, create and validate the model.Two important tools currently used in cognitive science research were considered in thedesign of our experiments: eye-tracking and EEG techniques. But the development ofour computational cognitive models is only based on eye-tracking data.
Chapter 3
Method
In the earlier chapter, we have stated the main goal of the current thesis: the develop-ment of two computational cognitive models to simulate people’s behavior when theyare faced to two different information search tasks. More specifically, in both cases weare interested in modeling the particular decision making to stop reading an item ofinformation. Information search can be made on any kind of documents, but here theinterest is mainly on textual documents or paragraphs. As we have already pointed outpreviously, information search is different from pure reading because people have a goalin mind while processing a document. They have to constantly keep in memory thisadditional information.
Since we followed an experimental-based approach, we carried out psychophysicalexperiments in order to acquire data on eye movements, create and validate the models.The idea of the current chapter is therefore to explain in a general way the method-ology that we followed to achieve our goals. We start by discussing the conception ofthe experiments and then present the construction and validation of the models. Acomprehensible explanation of the tools that were used along the overall process is alsogiven. Now, we start with a general explanation of the designed experiments.
3.1 Experiments
We designed two different experiments, each one for a different situation of informationsearch.
Situation 1 (one goal, one paragraph): People are concerned with this situation ineveryday life. For instance, you are looking in a cookbook for a Mexican recipe.Here the recipe you are currently reading and the goal (a Mexican recipe) are thepieces of information involved and both have to be together managed in orderto make a correct decision about if the recipe match well your search criteria.During our experimental work, paragraphs were the items or blocks of informationconsidered. Then participants were asked to read a paragraph with the task ofquickly deciding if it is related or not to a given goal. Figure 3.1 illustrates thesituation we aim at modeling.
Situation 2 (one goal, two paragraphs): People are also typically concerned with thissituation. For example, you are looking in a cookbook for a nice French recipe and

40 Chapter 3. Method
Figure 3.1: Illustration of the two input data of the model for Situation 1: the goal(Planet observation) and the paragraph. The paragraph is abandoned before its endbecause enough information has been gathered and maybe due to a) a high-relatednessto the goal b) a low-relatedness to the goal.
Figure 3.2: Illustration of the three input data of the model for Situation 2: the priorparagraph, the goal and the current paragraph. The current paragraph is abandonedbefore its end because enough information has been gathered and maybe due to a)a high-relatedness to the goal and enough information about the difference betweencurrent and previous paragraphs. b) a low-relatedness to the goal.
you already found one but you want to find a better one. Here things are differentbecause at least three pieces of information have to be together managed in orderto make a correct decision: the current recipe, the goal (a nice French recipe) anda previous recipe (already found). During our experimental work, paragraphswere also the items of information considered. Then, participants were asked toread a paragraph with the task of quickly deciding whether it is better related toa given goal than another paragraph processed previously. Figure 3.2 illustratesthe situation we aim at modeling.
In both situations we aim at focusing on a behavior that is specific to information search,which is stopping processing a paragraph before it is completely read. We suspect thatpeople should decide to stop reading a paragraph in a different manner. For example,in Situation 1, they may decide to stop reading a paragraph when they consider thatthey have collected enough information about the paragraph. This can be either due to

3.2. Latent Semantic Analysis (LSA) 41
a high-relatedness or a low-relatedness to the goal as is shown in Fig. 3.1. In Situation2, things are different because people are involved in a comparative task and they maydecide to stop reading a paragraph when their perception about the difference betweenboth paragraphs (the previous and the current) is large enough to decide which oneis more related to the goal. In a similar way, the decision to stop reading the currentparagraph might be also motivated because of its high-relatedness or its low-relatednessto the goal as is shown in Fig. 3.2
One experiment was carried out for each of the situations. The Experiment 1 in-volved both eye movement and brain signal (EEG) recording because it is a part ofthe research project ANR Gaze-EEG “Joint synchronous EEG signal and eye trackingprocessing for spatio-temporal analysis and modeling of neural activities”. However,and for our modeling purposes only the eye movement data were analysed. In thisexperiment, our interest was to study how people make a binary decision to keep orreject a paragraph according to its relatedness or not with a search goal. We madethe consideration of having an experiment with a very low variability (eg. with allparticipants exposed to the same stimuli pages, using simple stimuli pages, etc.) as adesirable requirement because of the joint analysis of eye-tracking and EEG data. Forthat reason, in the experiment, the sequence of stimuli pages presented is independentof the participant’s answer and it was only managed by a random generator.
The Experiment 2 only involved the eye-tracking technique. The idea behind theExperiment 2 was only to study people’s behavior when they are faced to a comparativetask of deciding if the current paragraph is more interesting than another paragraphprocessed previously. Here, the complete sequence of stimuli pages presented on thescreen depended of the participant’s answer and of a random choice during trials. Inother words, participants traced their own route along the experiment.
For the construction of the material used for the experiments a model of humansemantic judgements was required. The relatedness of a paragraph to the goal wascontrolled by using Latent Semantic Analysis (Landauer et al., 2007) or simply LSA.We would like to start by explaining this model before giving a description of theexperimental material.
3.2 Latent Semantic Analysis (LSA)
LSA is a fully automatic mathematical/statistical technique for extracting and inferringrelations of expected contextual usage of words in passages of discourse. It is nota traditional natural language processing or artificial intelligence program (Landaueret al., 2007).
In a first stage LSA takes a large corpus of text as input (eg. all articles publishedin a newspaper during one year) and generates an occurrence matrix F of m words xn documents. Each nonzero element fij , of the matrix F is the occurrence frequency

42 Chapter 3. Method
Label DocumentM1 Rock and Roll Music in the 1960’sM2 Different Drum Rolls, a Demonstration of TechniquesM3 Drum and Bass CompositionM4 A Perspective of Rock Music in the 90’sM5 Music and Composition of Popular BandsC1 How to Make Bread and Rolls, a DemonstrationC2 Ingredients for Crescent RollsC3 A Recipe for Sourdough BreadC4 A Quick Recipe for Pizza Dough using Organic Ingredients
Table 3.1: Example of documents about music (M) and cooking (C).
Word/Document M1 M2 M3 M4 M5 C1 C2 C3 C4Bread 0 0 0 0 0 1 0 1 0
Composition 0 0 1 0 1 0 0 0 0Demonstration 0 1 0 0 0 1 0 0 0
Dough 0 0 0 0 0 0 0 1 1Drum 0 1 1 0 0 0 0 0 0
Ingredients 0 0 0 0 0 0 1 0 1Music 1 0 0 1 1 0 0 0 0Recipe 0 0 0 0 0 0 0 1 1Rock 1 0 0 1 0 0 0 0 0Roll 1 1 0 0 0 1 1 0 0
Table 3.2: Occurrence matrix corresponding to the example of the Table 3.1
of ith word in the j th document. Table 3.1 shows a simplified example (Martin andBerry, 2007) of documents and its occurrence matrix is shown in Table 3.2. Then, thematrix is normalized in order to make emerge the most meaningful words by applyinglocal and global weighting functions:
f ′ij = localij × globali
A typical transformation used for this purpose is the log-entropy function which repre-sents a log transformation at local level and a entropy transformation at global level.Then the local and global functions are defined as:
localij = log(fij + 1)

3.2. Latent Semantic Analysis (LSA) 43
globali = 1 +
∑j pijlog(pij)
log(n)
with
pij =fij∑j fij
In these equations fij corresponds to the number of occurrences of the i word in thedocument j, and n is the total number of documents.
Once the matrix was normalized, the last stage in the transformation of the matrixis the key point in the method. Here, the matrix is reduced in order to make emergethe relationships between words although they are not co-occurring. One of the mostclassical approach used is the Singular Value Decomposition (SVD) of matrix A. Bythis way, the matrix is decomposed into a product of three matrices:
A = UΣV T
with U and V are the orthogonal matrices and Σ is a diagonal matrix. Fig. 3.3 showsa schematic representation of a SVD transformation. The matrix U corresponds to thewords and the matrix V to the documents. The matrix Σ contains the singular values,sorted in descending order. The resulting matrices of our example are showed in Tables3.3, 3.4 and 3.5. In order to remove noise, the matrix is reduced to a fewer number ofdimensions. This is done by canceling the coefficients of the diagonal matrix, startingwith the smallest one. In our example and in order to have a two-dimensional represen-tation, only the two first singular values (the biggest ones) are kept (they are bold-facedin Table 3.4) and give us the graphical representation showed in Fig. 3.4. However, itis worth noting that the two-dimensional representation is only for illustrative purposesince that it would not work with a real French or English corpus. In the figure 3.4,words that are semantically close are also spatially close to each other, even if they donot co-occur in the same document as Rock and Demonstration. In the same way, it ispossible to observe the similarity in between documents.
The number of dimensions (in general k ≈ 300 for English or French) was determinedin a empirical way by different tests. A very small number of dimensions results in aninformation loss and a very high number of dimensions does not allow to make emergethe semantic relationships between the words. With the resulting matrices, we are ableto use LSA and this procedure is now explained.
3.2.1 How the LSA model is used?
The semantic similarities between two set of words can be easily computed by usingthe matrices already described since we have a two-dimensional vector representationfor each word. For instance, vector representation of word Roll in our tiny example is

44 Chapter 3. Method
Figure 3.3: Schematic representation of a SVD transformation.
Bread .42 -.09 -.20 .33 -.48 -.33 .46 -.21 -.28Composition .04 -.34 .09 -.67 -.28 -.43 .02 -.06 .40
Demonstration .21 -.44 -.42 .29 .09 -.02 -.60 -.29 .21Dough .55 .22 .10 -.11 -.12 .23 -.15 .15 .11Drum .10 -.46 -.29 -.41 .11 .55 .26 -.02 -.37
Ingredients .35 .12 .13 -.17 .72 -.35 .10 -.37 -.17Music .04 -.35 .54 .03 -.12 -.16 -.41 .18 -.58Recipe .55 .22 .10 -.11 -.12 .23 -.15 .15 .11Rock .05 -.33 .60 .29 .02 .33 .28 -.35 .37Roll .17 -.35 -.05 .24 .33 -.19 .25 .73 .22
Table 3.3: Matrix U : Word vectors
1.1 0 0 0 0 0 0 0 00 .96 0 0 0 0 0 00 0 .86 0 0 0 0 0 00 0 0 .76 0 0 0 0 00 0 0 0 .66 0 0 0 00 0 0 0 0 .47 0 0 00 0 0 0 0 0 .27 0 00 0 0 0 0 0 0 .17 00 0 0 0 0 0 0 0 .070 0 0 0 0 0 0 0 0
Table 3.4: Matrix∑
: Singular values

3.2. Latent Semantic Analysis (LSA) 45
M1 .07 -.38 .53 .27 .08 .12 .20 .50 .42M2 .17 -.54 -.41 .00 .28 .43 -.34 .22 -.28M3 .06 -.40 -.11 -.67 -.12 .12 .49 -.23 .23M4 .03 -.29 .55 .19 -.05 .22 -.04 -.62 -.37M5 .03 -.29 .27 -.40 -.27 -.55 -.48 .21 -.17K1 .31 -.36 -.36 .46 -.15 -.45 .00 -.32 .31K2 .19 -.04 .06 -.02 .65 -.45 .41 .07 -.40K3 .66 .17 .00 .06 -.51 .12 .76 .25 -.35K4 .63 .27 .18 -.24 .35 .10 -.35 -.20 .37
Table 3.5: Matrix V : Document vectors
Figure 3.4: 2-dimensional spatial representation of data after the SVD transformation.

46 Chapter 3. Method
(.17,−.35). Moreover, such a vector formalism is very convenient to give a representa-tion to sentences that are not in the corpus: the meaning of a new sentence is representedas a linear combination of its word vectors. For example the vector representation of thesentence “Recipe Composition” will be: (.55, .22) + (.04,−.34) = (0.59,−0.12). There-fore, any sequence of words can be given a representation. The semantic similaritybetween two sequences of words can be computed using the cosine function of theirangle:
similarity = cos(θ) =Words1 ·Words2
||Words1||||Words2||
with Words1 and Words2 are the LSA word vectors corresponding to the two set ofwords. The higher the cosine value, the more semantically similar the two sequences ofwords. A cosine value of 1 indicates a maximum similarity whereas a value of 0 (or avery small negative number) indicates a null similarity.
We can make some similarities computation by using our example. We have thefollowing word vectors in the 2D space: Music= (.04,−.35), Roll= (.17,−.35), Drum=
(.10,−.46), Demonstration= (.21,−.44), Recipe= (.55, .22) and Bread= (.42,−.09).Now, by computing the cosine between the LSA vectors corresponding to Music andRoll, we got a value of 0.94. By doing the same for the words Recipe and Bread, we gota value of 0.83. The semantic similarity between Music and Roll is higher than the cor-responding cosine between Recipe and Bread. These values are expected because fromFig. 3.4 the words Music and Roll are spatially closer than the words Recipe and Bread.In a second example, we can compute the semantic similarity between two set of words:{Music,Roll}, {Recipe,Bread} and {Drum,Demonstration} by adding the word vectorscorresponding to each word as follows: A = {Music,Roll}= (.04,−.35) + (.17,−.35) =
(0.21,−0.70), B = {Recipe,Bread}= (.55, .22) + (.42,−.09) = (0.97, 0.13) and C={Drum,Demonstration}= (.10,−.46) + (.21,−.44) = (0.31,−0.90). Then, the seman-tic similarity between Music-Roll and Recipe-Bread is 0.16 and in between Music-Rolland Drum-Demonstration is 0.99. Values are also consistent because Music-Roll andDrum-Demonstration are spatially much closer in between (all of them are semanticallyrelated to the Music) than Music-Roll and Recipe-Bread.
We have explained here the way LSA method works by using a very simplified exam-ple and considering only two dimensional LSA vectors. However, for our experimentaland modeling purposes LSA was trained on a 24 million word French corpus composedof all articles published in the newspaper “Le Monde” in 1999 and we used 300 dimensionLSA vectors as usual.
Once explained how the LSA model works, the description of material used duringthe experiments is presented.

3.3. Material 47
3.3 Material
We kept the material as it was used in an older experiment carried out in our researchteam. They were created a set of 30 goals (topics). Each one was expressed by a fewwords (e.g. mountain tourism, planet observation, etc.). For each goal, 7 paragraphswere created (with mean=30.1 words, σ=2.9) with all the text in French. Since thatthe idea was to study the way in that people judge the relatedness or not of a para-graph with a given goal, we ended up with two paragraphs highly related (HR), twoparagraphs moderately related (MR) and three paragraphs unrelated (UR) to the goal.LSA (Landauer et al., 2007) was used to control the relatedness of a paragraph to thegoal. For the HR texts, cosine with the goal was above 0.40, for MR texts, cosine wasbetween 0.15 and 0.30, and for UR texts, cosine was below 0.10. The three paragraphsUR were used during our Experiment 2 (the first experiment carried out) but only twoof them were used for our Experiment 1. Paragraphs HR and UR represent the extremecases. Participants should easily decide that a paragraph HR is related to the goal andthat a paragraph UR is not related to the goal. Paragraphs MR are in between, andthey were considered because of their role of neutrality and difficulty to discern abouttheir relatedness with the corresponding search goal. People behavior in these caseswould be unpredictable. The stimuli pages were generated with a software that storedthe precise coordinates of each word on the screen.
Figure 3.5 shows the English translation of three texts (HR, MR, and UR) for thegoal “observation des planètes” (planet observation).
(a) A highly related text (HR).
(b) A moderately related text (MR). (c) An unrelated text (UR).
Figure 3.5: Examples of the textual material used for the experiments (translated intoEnglish). The goal is “planet observation”.
For our measurement purposes, the description of the apparatus used during theexperiments is now presented.

48 Chapter 3. Method
3.4 Apparatus
As mentioned previously, during our Experiment 1, a synchronized recording of both eyemovement and EEG signals was done but in our modeling work we are only concernedwith the eye movement data. Eye movements were recorded by using a remote binocularinfrared eyetracker EyeLink 1000 (SR Research). The EyeLink system was used in thePupil-Corneal Reflection tracking mode sampling at 1000Hz. In Experiment 2, onlythe eye movements were recorded by using a head mounted eye tracker EyeLink II (SRResearch), sampling pupil position at 500 Hz. We wrote our experiments in Matlab,using the Psychophysics Toolbox extensions (Brainard, 1997; Pelli, 1997; Kleiner et al.,2007). Due to the fact that the eye-tracker generates a platform-portable binary recordof eye-position and synchronization events, namely a EDF file (Eyelink Data File),we had to perform a pre-processing stage in order to adequate this output to a moreaccessible format for our further analysis. This pre-processing stage is now explained.
3.5 Pre-processing data
From eye-tracker data to a fixation file. The EDF file may be translated by theEDF2ASC utility (EDF to ASCII converter) into a text-format ASC file. This file listsmost of the important data in the EDF file in a more easily accessible format, but at theexpense of much larger file size. Below, an excerpt of an ASC file is shown. Numbersat left margin are only for explanation purposes and they are not part of the EDF file.
1 ∗∗ CONVERTED FROM C:\ ExperimentParagraph\Data\ s1 . ed f using ed f ap i 3 . 1Win32 Mar 2 2011 on Sat Jan 07 14 : 08 : 15 2012
2 ∗∗ DATE: Fr i Jan 6 19 : 56 : 28 20123 ∗∗ TYPE: EDF_FILE BINARY EVENT SAMPLE TAGGED4 ∗∗ VERSION: EYELINK I I 15 ∗∗ SOURCE: EYELINK CL6 ∗∗ EYELINK I I CL v4 .56 Aug 18 20107 ∗∗ CAMERA: EyeLink CL Board=0.3 Sensor=BJE8 ∗∗ SERIAL NUMBER: CL1−6CA139 ∗∗ CAMERA_CONFIG: 6CA13140 . scd
10 ∗∗ Recorded by Eyel inkToolbox demo−experiment11 ∗∗1213 MSG 5900361 MATBUILDER VERSION : 2011−08−0114 INPUT 5900366 015 MSG 5900383 DISPLAY_COORDS 0 0 1023 76716 MSG 5900387 FRAMERATE 60 Hz .17 MSG 5900387 SUBJECT NAME : s118 MSG 5900387 SUBJECT SESSION : 119 MSG 5900387 SCREEN WIDTH : 102420 MSG 5900388 SCREEN HEIGHT : 76821 MSG 5900388 SCREEN PHYS DIMX MM : 520

3.5. Pre-processing data 49
22 MSG 5900388 SCREEN PHYS DIMY MM : 32023 MSG 5900388 SCREEN DISTANCE MM : 68024 MSG 5900389 GUIDING EYE : RIGHT25 MSG 5900389 CROSS LENGTH : 1526 MSG 5900389 KEEP BUTTON : L27 MSG 5900389 STARTING28 MSG 5900389 DISPLAY_ON29 . . .30 MSG 6138726 START IMAGE : chasse_oiseaux−f 1 . png31 MSG 6138726 VALID FIXATIONS32 6138726 240 .7 263 .0 994 .033 6138727 240 .8 262 .9 996 .034 . . .35 6138880 243 .7 264 .4 991 .036 6138881 243 .7 263 .8 990 .037 EFIX R 6138612 6138881 270 241 .8 263 .0 99338 SSACC R 613888239 6138882 243 .7 263 .3 990 .040 6138883 243 .8 263 .5 990 .041 . . .42 6138918 337 .6 267 .3 1008 .043 6138919 337 .8 267 .6 1009 .044 ESACC R 6138882 6138919 38 243 .7 263 .3 337 .8 267 .6 3 .92 24345 SFIX R 613892046 6138920 337 .6 267 .8 1010 .047 6138921 337 .4 268 .3 1011 .048 . . .49 6139039 337 .7 273 .7 998 .050 6139040 337 .6 273 .9 999 .051 EFIX R 6138920 6139040 121 336 .5 271 .8 101152 SSACC R 613904153 6139041 337 .6 274 .2 1000 .054 6139042 337 .5 274 .2 1001 .055 . . .56 6139063 394 .7 275 .4 997 .057 6139064 394 .3 275 .8 996 .058 ESACC R 6139041 6139064 24 337 .6 274 .2 394 .3 275 .8 2 .40 20359 SFIX R 613906560 6139065 393 .1 276 .0 996 .061 6139066 392 .1 276 .0 995 .062 . . .63 6139267 396 .1 275 .2 848 .064 6139268 396 .0 275 .0 848 .065 EFIX R 6139065 6139268 204 395 .2 276 .2 91366 . . .67 MSG 8410891 DISPLAY_OFF68 MSG 8410892 ENDING

50 Chapter 3. Method
The ASC file contains general information about the eye-tracker parameters as is shownon line numbers 1-10. From lines 13 to 28, the general information about the subjectname, screen dimension, screen resolution and some extra information is also stored. Inthe experiment where this ASC was recorded, a stimuli image called chasse_oiseaux-f1.png was displayed on the screen as indicated by line number 30. The informationstored from line number 32 is what we really need. Basically we have the location of theeyes (or a single eye as in the example) every millisecond (if the eye-tracker frequencyis 1000 Hz) or two milliseconds (if the eye-tracker frequency is 500 Hz). These locationsare split into saccades and fixations. From line number 32, lines of the file contain thetime stamp, the XY location of the eye and the pupil diameter. The line beginningwith EFIX (End of Fixation) is an indication that the system has recognized the endof a fixation. For example, the line 37 (EFIX R) indicates the end of a fixation of theright eye. This is followed by the time of the first (beginning time) and last (endingtime) sample in the fixation, the fixation duration, the gaze position data (XY) and theaverage pupil size. The next line is therefore an indication that there is a beginningof a saccade of the right eye (SSACC R: Start of Saccade of the right eye). On line44, the end of this saccade is indicated (ESACC R). Then, a new fixation is started online number 45 (SFIX R) whose end is indicated on line 51 (EFIX R). The beginningand ending of a new saccade is indicated on lines 52 (SSACC R) and 58 (ESACC R)respectively. A new fixation started on line 59 (SFIX R) and ended on line 65 (EFIX R).The data file its terminated at line number 67-68 with the messages DISPLAY_OFFand ENDING respectively.
Since we are only interested in fixations, we have built a program which only extractsfixations from this huge file and generates a text file which looks like this:
1 . . .2 s1 chasse_oiseaux−f 1 6138612 6138881 270 241 .8 263 .0 9933 s1 chasse_oiseaux−f 1 6138920 6139040 121 336 .5 271 .8 10114 s1 chasse_oiseaux−f 1 6139065 6139268 204 395 .2 276 .2 9135 . . .
The three fixations showed above were extracted from the ASC segment presentedearly. Each line corresponds to a fixation. Fields are <subject name>, <image name>,<beginning time>, <ending time>, <duration>, <X>, <Y >, <pupil diameter>. Wehave another program that takes as input the fixation file, reads the correspondingimage file and visualize the experimental scanpath as showed in Fig. 3.6. Fixationsare indicated by the small spots whereas the saccades are represented by the linesconnecting pairs of fixations.
There is another program which adds to this fixation file the words processed duringeach fixation. It also adds extra information needed for the further analysis. It takesas input the fixation file plus a file containing the location (XY) of each word in thestimuli-image. The program works with a special mechanism which is now explained.

3.5. Pre-processing data 51
Figure 3.6: Example of a scanpath generated during one of our eye-tracker experiments.
Prediction of words processed during each fixation. In order to predict thewords processed during each fixation, we used a window-based approach according tothe word identification span (Rayner, 1998) explained in the previous chapter. The sizeof our window was of 4 characters to the left plus 8 characters to the right of the fixationpoint. Another important result that we took into account to determine the area fromwhich information is acquired in each fixation is the fact that initial fixations in thebeginning part of a word facilitate its recognition more than initial fixations toward theend of the word (Farid and Grainger, 1996). Then, during a fixation, the words catchedby the window are candidates to be considered as processed but an extra criteria isapplied to decide it: a word is actually processed if at least the first third of it or thelast two-thirds are inside the window. Figure 3.7 shows an example of our window basedapproach to determine which words are processed during a single fixation. The fixationis indicated by the gray circle on the word des. This particular example shows thatthe words traitement, des and données are candidates to be considered as processed.However, using our extra criteria, only the words des and données would be consideredas actually processed. Our program implements this window mechanism by analysingline-by-line the fixation file and by adding the words likely to have been processed byparticipants during each fixation. Additionally, it also adds more information for aconvenience of our modeling purposes. This is the only file used during the modelingwork.
Figure 3.7: Words processed during a single fixation using our window-based approach.The word identification span is limited by the gray rectangle and the fixation point ison the word des.
52 Chapter 3. Method
After having presented the way the acquired data are pre-processed in order toadequate them to the modeling work, we would like to explain the approach we followedto build the computational cognitive models considered in the current thesis.
3.6 Model
Two models are developed along the current thesis, one for each of the experiments.However, the approach followed for the construction of both is common and its descrip-tion is now given.
3.6.1 Statistical approach
In both models the idea was to simulate people’s behavior when they are faced withan information search task. We were interested in predicting the moment at whichparticipant would decide to stop reading a paragraph before it is completely read.This may be because they have collected enough information to make a correct decisionabout the relatedness or unrelatedness of the paragraph with the search goal. Firstly, westarted by imagining which variables could play a role in such decision. We believed thatthe semantic similarity between the words actually processed in a paragraph and thegoal must be involved because this variable would be able to mimic human judgmentsof semantic associations. For that purpose, we used LSA (Landauer and Dutnais, 1997;Landauer et al., 2007) as a model of semantic memory. We also thought that the roleof this variable should be different along the two experiments, but here for our generalexplanation we will refer to it simply as semantic association or Sim. Naturally, wethought that a high/low value of this variable may induce a decision to stop readinga paragraph because in these cases the perception about the relatedness/unrelatednessof the current paragraph would be clear, but what about if this high/low value appearstoo early or too late in scanpath? Obviously, the perception would be not the same.We assumed therefore that the decision also depends on the number of fixations madeon a paragraph. Even if there is not a one-to-one mapping between fixations and thenumber of words processed, the number of fixations can be used as a general indicatorof the number of words processed in a paragraph. To sum up, the more words processed(more fixations), the higher the confidence in the perception of the relatedness betweenthe paragraph and the goal. Therefore, we assumed that there should be a relationshipbetween Sim and a second variable called rank of fixation or simply Rank.
Once we had determined the two variables that could played a role in the decisionto stop reading a paragraph, two empirical fixation distributions were computed: theabandon and the no-abandon distributions. These distributions were computed in theSim × Rank space of participant data in order to study how the decision depends onthese two variables. To compute the distributions, each participant fixation was associ-

3.6. Model 53
ated to a point in the Sim×Rank space. The abandon distribution is increasing alongthe Rank axis because the probability of abandoning is higher and higher. However,it is the opposite for the no-abandon distribution. A detailed explanation about thecomputation of both distributions is given in Chapters 4 and 5 for the Experiments 1and 2 respectively.
The goal was to learn the frontier between both cases in order to be able to predictif a sequence of words already processed is likely to lead to the abandon (stop reading)or the pursuance of the reading task. Depending on the location of any observation(sim,rank) above or under the curve (frontier), the reader’s behavior can be predicted.However, the frontier cannot be just the intersection of the raw data, because of thenoise due to the experimental way of gathering data and the obvious drawbacks of theLatent Semantic Analysis method of computing similarities. To find this frontier, amethodology based on a Bayesian inference is therefore used and is presented now.
3.6.2 Bayesian inference
Many aspects of cognition can be formulated as solutions to problems of induction.Given some observation about the real world, we can make conclusions about the processor structure that generated such data and use this knowledge to make predictionsfor future cases. Bayesian inference is an engine for solving such problems within aprobabilistic framework, and consequently is the heart of most probabilistic models ofcognition (Griffiths et al., 2008).
The Bayesian inference is based on Bayes’ rule. Bayes’ rule is no more than anelementary result of probability theory. We can assume the existence of two randomvariables, A and B. Thankful to the chain rule we can write the joint probability ofthese two variables taking on particular values a and b, P (a, b), as the product of theconditional probability that A will take on value a given B takes on value b, P (a|b), andthe marginal probability that B takes on value b, P (b). Thus, we have:
P (a, b) = P (a|b)P (b) .
or we can also writeP (b, a) = P (b|a)P (a) .
From the two equations we can re-write:
P (b|a) = P (a|b)P (b)
P (a). (3.1)
This expression is Bayes’ rule, which indicates how we can compute the conditionalprobability of b given a from the conditional probability of a given b.

54 Chapter 3. Method
Now, in our particular case, let us consider a classification problem with two classes:Abandon (Ab) and No-abandon (Ab) a paragraph. What is the class pSR(s, r) of a two-dimensional observation (s,r) in the Sim×Rank space when the posterior probabilitiesP (Ab|s, r) and P (Ab|s, r) are given? The decision rule is:
P (Ab|s, r)Ab≷Ab
P (Ab|s, r), (3.2)
and by using the form of Equation 3.1, we can express both cases as follows:
P (Ab|s, r) = P (Ab)× pSR(s, r|Ab)
pSR(s, r)(3.3)
and
P (Ab|s, r) = P (Ab)× pSR(s, r|Ab)
pSR(s, r). (3.4)
Then data were regularized by following a statistical parametric approach since theywere obviously affected by the noise inherent to acquisition and pre-processing. Thestatistical model to estimate both density functions for the no-abandon and the abandoncases and the prior probabilities are explained in Chapter 4 and 5 in order to use theBayesian classifier:
P (Ab)× pSR(s, r|Ab)Ab≷Ab
P (Ab)× pSR(s, r|Ab) . (3.5)
The class-conditional probabilities density function can be written as product of condi-tional and marginal distributions as follows :
pSR(s, r|Ab) = pS|R(s|R = r,Ab)× pR(r|Ab) (3.6)
andpSR(s, r|Ab) = pS|R(s|R = r,Ab)× pR(r|Ab) (3.7)
Once the two class-conditional probabilities are modeled for each (s,r) value, the prob-lem was to decide if there was enough information to stop reading (“abandon” class), orto continue reading (“no abandon” class). Then, we had to estimate the prior probabili-ties such as: P (Ab)+P (Ab) = 1 in order to find the decision rule. Finally, substitutingEqs. 3.6 and 3.7 in 3.5, the decision rule is then:
P (Ab)× pS|R(s|R = r,Ab)× pR(r|Ab)Ab≷Ab
P (Ab)× pS|R(s|R = r,Ab)× pR(r|Ab) (3.8)
3.6. Model 55
3.6.3 Model Learning
Our method was to design a model and to learn its parameters from two-thirds ofthe data, then test it on the remaining one third of the data. After learning we got afrontier equation. That equation was included in the computational model. That modelconstantly computes the Sim value while it is moving forward in the text, increasing theRank value. As soon as the current Sim value observed in the participant’s scanpathis greater than the value computed by the model Sim0 (value in the frontier), thedecision is to stop reading the paragraph. Once the model parameters have been set,the evaluation of the model was performed and now it is explained.
3.6.4 Model Performance
In order to test the model, we ran it on the remaining one third of the data. Foreach fixation in this testing set, the model decides either to leave or not to leave theparagraph. If the model did not leave at the time the participant stopped reading,simulation is pursued with the next Rank and with the same value of the Sim, and soon until the decision is made. In this particular case, our model is less reactive thanparticipant and because there are no more fixations on the participant scapanth, we usedthe same value of the Sim. However, we thought that if the participant would makemore fixations, the Sim value after consider these extra fixations will be different butfor our modeling work, we are not able to predict which words would be fixated. Then,we made a distinction between these two cases: 1) model stops reading either before orat the same time as participant and 2) model stops reading after the participant.
The average difference between the ranks at which model and participant stoppedreading was only computed for the case when model stops reading either before or atthe same time of participant. For example Fig. 3.8 shows an experimental scanpathwith its corresponding model evaluation. In the paragraph, the participant made only16 fixations and the model made 17 fixations. Then, in such example, the differencebetween the rank at which model and participant stopped reading was -1 fixation.Clearly here the model seems to be less reactive than participant because it made onemore fixation. So, this case is not considered to compute the average difference betweenthe ranks at which model and participant stopped reading because participant decidedto stop reading before the model and there are no more fixations to be treated by themodel.
To assess the significance of that value, we built a random model which stops readingafter each fixation in the testing set with probability p . If it did not abandon, itconsiders the next fixation and again decides to leave with probability p, etc. Wesearched for the best p that minimized the average difference with participant ranks.In a similar way, Fig. 3.8 illustrates the comparison between the random model (13fixations) and participant’s data (16 fixations) and it is of 3 fixations. In this case, the

56 Chapter 3. Method
Figure 3.8: Comparison of performance (difference in number of fixations) betweenparticipant’s data, model and a random model.
random model seems to be more reactive than participant.After having presented the general methodology that we followed for the develop-
ment of the two models discussed in the current thesis, we are going to move to thedetailed description of our modeling work for each of the experiments on the next twochapters.

Chapter 4
Computational Cognitive Modeling:a simple environment.
In this chapter, the experiment carried out in order to collect data of people searchingfor information in a simple environment is presented. The experiment corresponds tothe Situation 1 (p. 40, Fig. 3.1) that we aim at modeling: deciding as quick aspossible if a paragraph presented is related or not to a search goal given beforehand.Our goal was therefore to build a model that would describe the cognitive processesinvolved in this decision-making situation but also predict when an average user is likelyto stop reading the paragraph when a goal is given. As we have also largely discussedin Chapter 2, this particular problem has been studied by Lee & Corlett (2003) whereparticipants were provided with a topic and a text, presented one word every second,and were asked to decide as quickly as possible if the text is about the given topic.However, we aim at studying a normal reading situation instead of presenting one wordat a time and because the idea is to model the cognitive processes involved in suchan information search task by replicating the human eye movements recorded duringa behavioral experiment, we relied on an eye-tracker experiment to be able to identifythe words processed.
Along the chapter, we started by giving the description of the experiment carriedout. Then model learning and model performance are also discussed. Finally, and forimprovement purposes of the model, some of the additional analyses done by followingdifferent approaches are also presented.
4.1 Experiment I: one-paragraph experiment
This experiment was intended to emphasize the decision to stop reading a paragraphwhen participants had to decide as fast as possible whether it was related or not to asemantic goal given at a prior stage.
4.1.1 Participants
A total of 19 French native speakers participated in the experiment (age range 19-43years, mean age 27 years, sd = 8 years). All participants had normal or corrected-to-

58 Chapter 4. Computational Cognitive Modeling: a simple environment.
normal visual acuity, and had no known neurological disorders. They were naive withrespect to the purpose of the study, and all gave written consent.
4.1.2 Material
The material described in Chapter 3 (pag. 47) was used in the experiment: thirty goalswith two highly related (HR), two moderately related (MR) and two unrelated (UR)paragraphs.
4.1.3 Apparatus
The description of the eye-tracker device is given in Chapter 3 (pag. 48). The EyeLinksystem was used in the Pupil-Corneal Reflection tracking mode sampling at 1000Hz.
4.1.4 Procedure
The experiment is composed of 180 trials, each one corresponding to a goal (30) withits corresponding 6 paragraphs, in random order. The procedure began with a learningtrial using one new goal and six paragraphs. At the beginning of each trial, the goalis displayed. Then a fixation cross is shown and located at the same place where thefirst character of the first word will appear. The fixation cross is shown, waiting for theparticipant’s gaze to be inside a box of 120 pixels wide and 180 pixels high and centeredon the fixation cross. Once the participant’s gaze is detected inside the box, the gazeposition was controlled to remain inside during more than a random value normallydistributed (mean=800 ms, σ=40) and truncated between 700 ms and 900 ms. Afterthis gaze stabilization period, a paragraph is displayed. Participants were asked todecide as quick as possible if the current paragraph is related or not to the goal shownat the beginning. For example, suppose that the paragraph of the Fig. 4.1 is displayed,and we should decide if it is related or not to the goal “art contemporain”. What will bethe answer? Making a decision in this case is not easy because the relatedness betweenthe paragraph and the goal is not clear. During the experiment, the participants hadto click on the mouse only to indicate that the decision had been taken. Immediately, anew screen is displayed in order to collect the participant’s decision: to keep or to rejectthe paragraph. Participant should keep it if according his judgment the paragraph isrelated to the goal and he should reject it in other case.
The participant knew that between each goal, a pause could be managed if necessaryand he/she knew the number of remaining goals until the end. A screen indicated thata new goal would be presented as well as the count of the remaining goals. Figure 4.2shows the different screens presented to the participant during a complete trial.
A 9-point calibration routine was automatically done if the timeout on the initialfixation cross elapsed or if the experimenter decided to run it. The idea behind of the

4.2. Pre-processing data 59
Figure 4.1: Example of paragraph for the goal “art contemporain”.
use of a random time at detecting the gaze inside the box was for avoiding participant’santicipation of the reading. A drift procedure is done before each trial to ensure therecording accuracy of eye movement. Running a re-calibration step of the eye trackerwas also possible if the experimenter found it necessary. During the experiment, par-ticipant’s head position was stabilized with a chin rest and their forehead supported ona fixed bar. Participants were seated 68 cm in front of a 24-inch monitor (42◦ x 21◦
of visual field) with a screen resolution of 1024 by 768 pixels. The text was displayedat the centre of the screen (21◦ x 11◦ of visual field). In average, the text is displayedwith 40 characters per line, corresponding about 4 characters in fovea. We wrote ourexperiments in Matlab, using the Psychophysics Toolbox extensions (Brainard, 1997;Pelli, 1997; Kleiner et al., 2007).
4.2 Pre-processing data
All the procedure described in Chapter 3 (pag. 48) was followed in order to adequateeye-tracker data to a more accessible format for our analysis. The pre-processing stageincluded the following steps:
• Converting a EDF file to an ASC file by using the EDF2ASC converter.
• Generating a fixation file from an ASC file.
• Adding the words actually processed during each fixation to the fixation file byusing our window-mechanism.
Once data were adequate, and before to do a deeply analysis, some basic statistics werecomputed according to the type of paragraphs: HR (Highly Related), MR (ModeratelyRelated) and UR (Unrelated). The description of these statistics are given now.
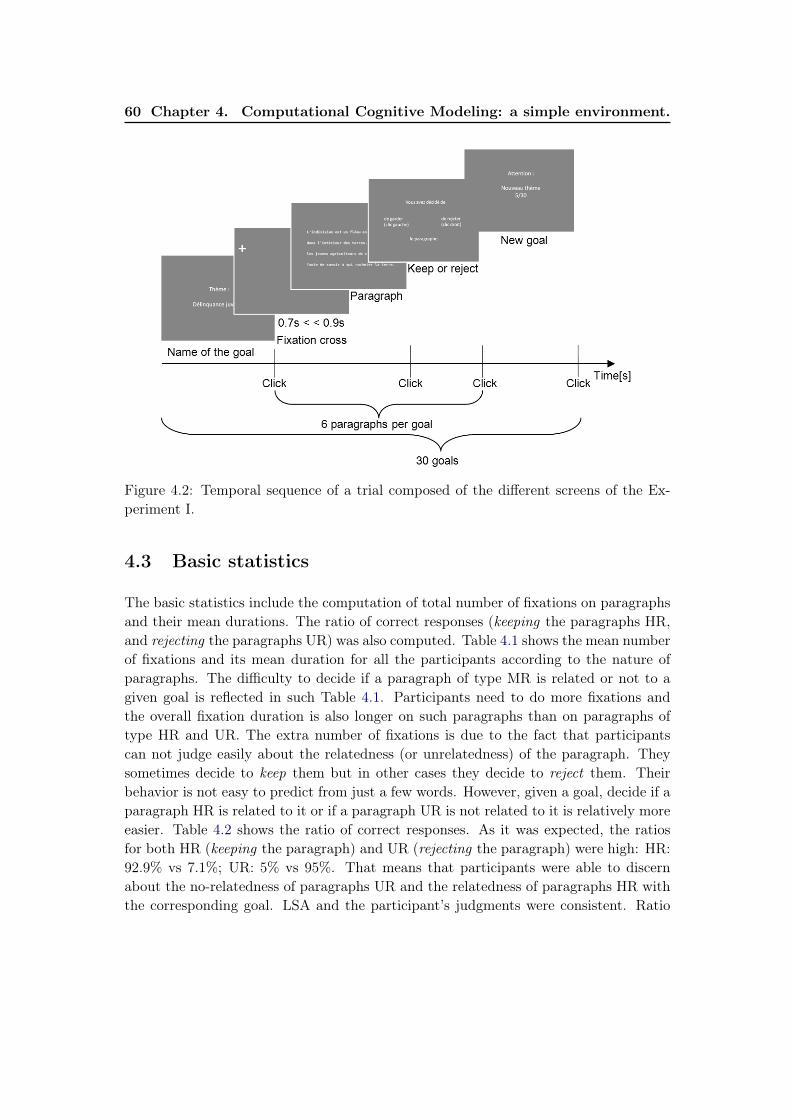
60 Chapter 4. Computational Cognitive Modeling: a simple environment.
Figure 4.2: Temporal sequence of a trial composed of the different screens of the Ex-periment I.
4.3 Basic statistics
The basic statistics include the computation of total number of fixations on paragraphsand their mean durations. The ratio of correct responses (keeping the paragraphs HR,and rejecting the paragraphs UR) was also computed. Table 4.1 shows the mean numberof fixations and its mean duration for all the participants according to the nature ofparagraphs. The difficulty to decide if a paragraph of type MR is related or not to agiven goal is reflected in such Table 4.1. Participants need to do more fixations andthe overall fixation duration is also longer on such paragraphs than on paragraphs oftype HR and UR. The extra number of fixations is due to the fact that participantscan not judge easily about the relatedness (or unrelatedness) of the paragraph. Theysometimes decide to keep them but in other cases they decide to reject them. Theirbehavior is not easy to predict from just a few words. However, given a goal, decide if aparagraph HR is related to it or if a paragraph UR is not related to it is relatively moreeasier. Table 4.2 shows the ratio of correct responses. As it was expected, the ratiosfor both HR (keeping the paragraph) and UR (rejecting the paragraph) were high: HR:92.9% vs 7.1%; UR: 5% vs 95%. That means that participants were able to discernabout the no-relatedness of paragraphs UR and the relatedness of paragraphs HR withthe corresponding goal. LSA and the participant’s judgments were consistent. Ratio

4.4. Modeling 61
Type of Paragraph Number of fixations (SD) Total duration in s (SD)HR 17.3 (8.8) 3.2 (1.7)MR 22.1 (9.7) 4.0 (1.9)UR 16.7 (8.7) 3.0 (1.7)
Table 4.1: Mean number of fixations and its mean duration for all the participantsaccording to the types of paragraphs.
Type of Paragraph Keep (%) Reject (%)HR 92.9% 7,1%MR 47.2% 52.8%UR 5% 95%
Table 4.2: Ratio of the correct responses for all the participants according to the typesof paragraphs.
of correct responses for MR paragraphs are much more balanced (47.2% vs 52.8%),a situation that confirms their role of neutrality and difficulty to discern about theirrelatedness with the corresponding search goal.
So far, the experiment, the preprocessing stage and the computation of some basicstatistics have been explained. Now, we turn into the modeling section.
4.4 Modeling
Making predictions in processing a paragraph. The model should be able to pre-dict the way a paragraph is processed given a goal. For example, given the paragraphand goal of Fig. 4.3, the model should be able to predict the way an average user wouldprocess the paragraph. The paragraph might be processed partially and abandonedafter about a dozen words have been fixated as illustrated in such example.
Modeling Semantic Judgments. Such a decision making model on paragraphsneeds to be based on a model of semantic memory that would be able to mimic humanjudgments of semantic associations. The robustness of LSA (Landauer and Dutnais,1997; Landauer et al., 2007) to capture the semantic association between words has beenlargely demonstrated during the years and at least empirically we can observe roughlythat on the computation of the ratio of correct responses in our experiment, LSA andthe participant’s judgments were consistent. As it was described in Chapter 3 (pag.47), LSA was used to control globally the relatedness of the paragraphs (material) withthe corresponding goals, but here LSA is used at the level of words fixated. Then, weused LSA to dynamically compute the semantic similarities between the goal and each
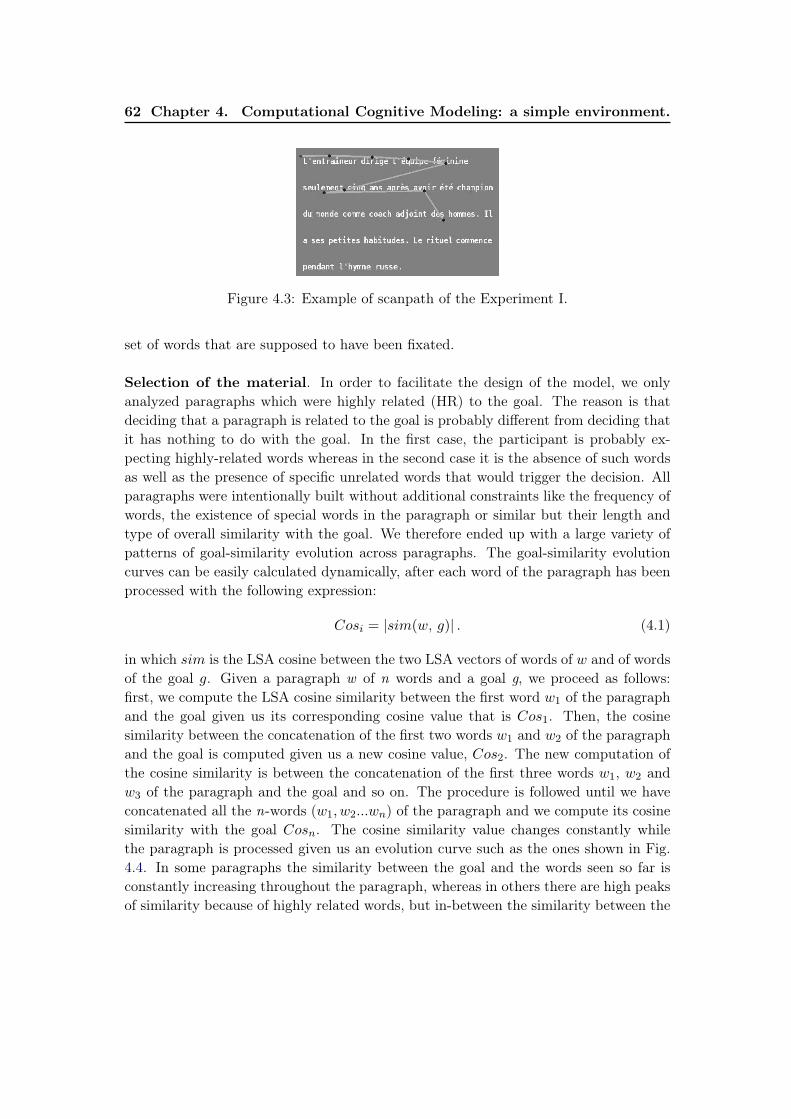
62 Chapter 4. Computational Cognitive Modeling: a simple environment.
Figure 4.3: Example of scanpath of the Experiment I.
set of words that are supposed to have been fixated.
Selection of the material. In order to facilitate the design of the model, we onlyanalyzed paragraphs which were highly related (HR) to the goal. The reason is thatdeciding that a paragraph is related to the goal is probably different from deciding thatit has nothing to do with the goal. In the first case, the participant is probably ex-pecting highly-related words whereas in the second case it is the absence of such wordsas well as the presence of specific unrelated words that would trigger the decision. Allparagraphs were intentionally built without additional constraints like the frequency ofwords, the existence of special words in the paragraph or similar but their length andtype of overall similarity with the goal. We therefore ended up with a large variety ofpatterns of goal-similarity evolution across paragraphs. The goal-similarity evolutioncurves can be easily calculated dynamically, after each word of the paragraph has beenprocessed with the following expression:
Cosi = |sim(w, g)| . (4.1)
in which sim is the LSA cosine between the two LSA vectors of words of w and of wordsof the goal g. Given a paragraph w of n words and a goal g, we proceed as follows:first, we compute the LSA cosine similarity between the first word w1 of the paragraphand the goal given us its corresponding cosine value that is Cos1. Then, the cosinesimilarity between the concatenation of the first two words w1 and w2 of the paragraphand the goal is computed given us a new cosine value, Cos2. The new computation ofthe cosine similarity is between the concatenation of the first three words w1, w2 andw3 of the paragraph and the goal and so on. The procedure is followed until we haveconcatenated all the n-words (w1, w2...wn) of the paragraph and we compute its cosinesimilarity with the goal Cosn. The cosine similarity value changes constantly whilethe paragraph is processed given us an evolution curve such as the ones shown in Fig.4.4. In some paragraphs the similarity between the goal and the words seen so far isconstantly increasing throughout the paragraph, whereas in others there are high peaksof similarity because of highly related words, but in-between the similarity between the

4.4. Modeling 63
(a) Step (b) Ramp (c) Saw
Figure 4.4: Example of the material-based cosine evolution for HR paragraphs afterclustering.
goal and the words seen so far is lower because of general or polysemous words. Inorder to reduce that variability and simplify the design of the model, we conducted ahierarchical cluster analysis (HCA) of those goal-similarity evolution curves. We foundthree main kinds of patterns: Step, Ramp and Saw.
The cosine evolution of Step paragraphs is characterised by a constant low valueduring some fixations followed by an abrupt jump to a higher value which is maintaineduntil the end. In the case of Ramp paragraphs, a low cosine value is maintained duringsome fixations but here it is followed by a progressive increasing of the cosine to a highervalue which is kept until the end. The cosine evolution in Saw paragraphs is still morecomplicated. Here, the evolution of the cosine value follows a increasing/decreasingpattern along the duration of the signal. We called them Saw because of its resemblancewith the tool. Figure 4.4 shows an example of a prototype for each cluster.
Of the total number of HR paragraphs (60), some of them were not clustered (23)in any of these classes due the high complexity of the shape of their cosine evolution.For our modeling purposes, only Ramp paragraphs (6) were chosen because they havea higher cosine variability than Step paragraphs (13) but their variability is more pre-dictable (a nice relationship between its cosine and the word rank as is shown in Fig.4.4) than the case of Saw paragraphs (18). We thought that these particular featuresmay facilitate the modeling work.
4.4.1 Modeling the decision
Two variables involved. As it was discussed before in Chapter 3 (pag. 52), weinvestigated which variables could play a role in the decision to stop reading a paragraphp , when people were asked to quickly decide if it is related or not to a given goal.We mentioned that the semantic similarity Sim between the words processed in suchparagraph and the goal must be involved in such decision. Only the words actuallyprocessed at each fixation made by the participant are taken into account. This is notthe case of the computation of the material-based evolution curves where all the words

64 Chapter 4. Computational Cognitive Modeling: a simple environment.
(a) (b)
Figure 4.5: a) Example of scanpath for the goal “faiblesse du dollar”. b) Its correspond-ing participant-based Cos evolution.
contained in a paragraph are considered (in Eq. 4.1). We refer here to such variableSim as Cos and is defined as follows:
Cos = |sim(words actually processed of p, g)| (4.2)
in which sim is the LSA cosine between the two LSA vectors of words actually processedof p and of words of the goal g. Cos changes constantly while processing a paragraph.When the words seen are highly related to the goal, Cos has a high value (∼1) andit has a low value (∼0) when the words are unrelated with the goal. It can also beeasily calculated dynamically, after each word of the paragraph has been processed. Wecould call to the resulting curve as the participant-based cosine evolution. Considerfor example Fig. 4.5a. The goal is “faiblesse du dollar” (“weakness of the dollar”). Inthe first fixation on the paragraph, only the words “L’Euro” are supposed to have beenprocessed according to our window-based prediction (Ch. 3, pag. 47). These words arehighly related with the goal. Therefore Cos = |sim(“L’Euro”,“faiblesse du dollar”)| =0.731 . During fixation 2, two words are processed, the word “L’Euro” and a newword “poursuivait” leading to a new value of Cos = |sim(“L’Euro poursuivait”,“faiblessedu dollar”)| = 0.747 . During fixation 3, only the word “poursuivait” is processed,leading to the same value of Cos = 0.747 . In fixation number 4, Cos = |sim(“L’Europoursuivait sa remontée”,“faiblesse du dollar”)| = 0.769 . In fixation 5, the Cos valuegoes up to 0.812 because of the word “face” which makes the LSA vector much moresimilar to the goal vector. This value is maintained for the fixation 6. In fixation 7 and8 the Cos value goes up to 0.865 because of the word “dollar” which makes the LSAvector much more similar to the goal vector. During fixation number 10, the words“les premiers” makes the LSA vector less similar to the goal vector and this effect is

4.4. Modeling 65
(a) (b)
Figure 4.6: a) Empirical “no-abandon” distribution p̂CR(c, r|Ab) and b) “abandon” dis-tribution p̂CR(c, r|Ab) in the Cos×Rank space.
showed by the decreasing value of Cos = 0.850 . This value is maintained until the 12th
fixation after which the participant decided to stop reading the paragraph and indicatethe decision. Figure 4.5b shows the participant-based evolution of the Cos value alongthe fixations in the scanpath.
This example illustrates that a high value of Cos may not directly induce the de-cision, in particular if it appears too early in the scanpath. As it was also discussedon the previous chapter, we assumed therefore that the decision also depends of a sec-ond variable: the Rank of fixation which give us an idea about the number of wordsprocessed so far in the paragraph.
Once we have determined the two variables that could played the role in the deci-sion to stop reading a paragraph, two empirical fixation distributions were computedin order to study how these variables could trigger the decision. Their descriptions aregiven now.
Abandon and no-abandon distributions. The two distributions of fixations forthe no-abandon and the abandon cases were computed in the Cos × Rank space ofparticipant data in order to learn the frontier between both cases. To compute thedistributions, each participant fixation was associated to a point in the Cos × Rank
space. Rank is a discrete measure between 1 and the maximum number of fixationsin the data (60 in our case). Cos has been computed according to the formula 4.2,taking into account the words already processed in each paragraph as well as the goaland discretized into one of 100 bins, from 0 to 1. The no-abandon distribution wascomputed by simply counting the number of fixations that did not lead to an abandonfor each cell of the Cos × Rank grid. It concerns all fixations except the last one ofeach scanpath. The abandon distribution was built from all very last fixations of allscanpaths, including also subsequent ranks. These fixations can be called virtual fixa-
66 Chapter 4. Computational Cognitive Modeling: a simple environment.
tions. For example, if a given participant on a given text made 13 fixations, the first12 were counted in the no-abandon distribution and the 13th was counted in the aban-don distribution. All virtual fixations from 14 to 60, with the same Cos value as the13th were also counted in the abandon distribution, because if the participant stoppedreading at fixation 13, he would have also stopped at fixation 14, 15, etc. The frontierbetween these two behaviors (continue or stop reading) is a curve in the Cos × Rank
space. Ideally, that curve would be the intersection between the increasing abandondistribution (it is increasing along the Rank axis because the chances of abandoningis higher and higher while the paragraph is processed) and the decreasing no-abandondistribution.
According to the location of a given a observation (c,r) above or under the curve,the reader’s behavior can be predicted. For instance, suppose our model makes its 5th
fixation on a word and the similarity between all words processed so far and the goalis 0.412 . According to the location of the (5, 0.412) point with respect to the frontiercurve, our model is able to decide whether to abandon or not.
As it was already mentioned in Chapter 3, a methodology based on a Bayesianclassifier was followed and outlined by Equations 3.3, 3.4, 3.5, 3.6, 3.7 and 3.8 (Ch. 3,p. 54). Now by replacing Sim with the corresponding variable Cos presented in the Eq.4.2 in the Equations 3.5, 3.6, 3.7 and 3.8, we have the Bayesian classifier (Eq. 4.3), thetwo class-conditional probabilities density functions (Eqs. 4.4 and 4.5) and the decisionrule (Eq. 4.6) as follows:
P (Ab)× pCR(c, r|Ab)Ab≷Ab
P (Ab)× pCR(c, r|Ab) . (4.3)
pCR(c, r|Ab) = pC|R(c|R = r,Ab)× pR(r|Ab) (4.4)
andpCR(c, r|Ab) = pC|R(c|R = r,Ab)× pR(r|Ab) (4.5)
P (Ab)× pC|R(c|R = r,Ab)× pR(r|Ab)Ab≷Ab
P (Ab)× pC|R(c|R = r,Ab)× pR(r|Ab) (4.6)
Now the statistical model to estimate the density functions and the prior probabilitiesare explained in order to use the classifier.
Parametric model for the “no-abandon” distribution. Figure 4.7 (top, left)shows the empirical marginal distribution p̂R(r|Ab). As the Rank increases, the prob-ability of not abandoning the paragraph decreases. This evolution was modeled with asigmoid function:
φ(r) =PRMax × (1 + e−αr0)
1 + eα(r−r0). (4.7)

4.4. Modeling 67
Figure 4.7: Data and fitting of marginal distributions, shape and scale for the “no-abandon” and “abandon” distributions.
(a) (b)
Figure 4.8: Example of empirical conditional pdf and fit with a gamma model for Rank
value at 10 for the a) “no-abandon” and b) “abandon” class.

68 Chapter 4. Computational Cognitive Modeling: a simple environment.
There were actually only two parameters r0 and α to fit because the integral is 1.Concerning the probability density function pC|R(.), the natural model (Fig. 4.6a) is aGamma one whose parameters depend on the Rank value. Figure 4.8a illustrates for aparticular Rank=10 the reason why the Gamma is a good function to model these data.The shape k(r) increases and the scale θ(r) decreases linearly (Fig. 4.7, left column).Both are modeled by simple linear equations: k(r) = Mr+N and θ(r) = Or+P . Thelinear regressions are only performed up to the Rank = 30 since that p̂R(r > 30|Ab) isclose to zero and there is no more enough data. Then we have:
pC|R(c|R = r,Ab) =A(r)ck(r)−1
(k(r)− 1)!θ(r)k(r)e− c
θ(r) , pR(r,Ab) = φ(r) . (4.8)
As the Cos value is between 0 and 1, A(r) is a normalization function to ensure thatpC|R(c|R = r,Ab) is a probability density function whose integral equals 1. We getA(r) = Fk,θ(1) − Fk,θ(0), with Fk,θ(.) being the repartition function of a Gamma dis-tribution with a shape k and a scale θ. We then obtained six independent parametersto model the complete “no-abandon” joint distribution: offset r0 and slope α for φ(r),the coefficients M ,N for k(r) and O,P for θ(r).
Parametric model for the “abandon” distribution. Following a similar approachthe marginal pdf p̂R(r|Ab) was modeled with another sigmoid function φ′(r) (Fig. 4.7,top right). But here, it is an increasing function. At rank 0, there is no abandon andat the maximal Rank value, all scanpaths have shown an abandon. The conditionaldistribution p̂C|R(c|R = r,Ab) is a Gamma distribution with a shape k′(r) and a scaleθ′(r). As in the previous case, Fig. 4.8b illustrates how these data are modeled by aGamma function. The shape k′(r) exponentially decreases while the scale θ′(r) expo-nentially increases (Fig. 4.7, right column). Both are modeled by exponential equations:k′(r) = (s2 − s1)e
−r/p0 + s2 and θ′(r) = (t2 − t1)e−r/q0 + t2. Then, the different set of
functions {φ′(r),k′(r),θ′(r)} gives us eight parameters: r′0 and α′ for the φ′(r); p0, s1and s2 for k′(r); q0, t1 and t2 for θ′(r). The resulting equation for the pdf is:
pC|R(c|R = r,Ab) =A′(r)ck
′(r)−1
(k′(r)− 1)!θ′(r)k′(r)
e− c
θ′(r) , pR(r,Ab) = φ′(r) . (4.9)
Table 4.3 summarizes the total number of parameters and their values for bothmodeled distributions: the no-abandon and the abandon.
4.4.2 Model Learning
Once the model was designed, its parameters were learned from two-thirds of the data.The two prior probabilities P (Ab) and P (Ab) were also learned by considering how

4.4. Modeling 69
Distribution ParametersNo-abandon r0=11.97, α=0.17, M=0.21, N=1.0, O=-0.0018, P=0.13
Abandon r′0=12.0, α′=0.33, p0 = 2.94, s1=5.76, s2=23.70, q0=3.85, t1=0.083t2=-0.001
Table 4.3: Model parameters for both the no-abandon and the abandon distributions.
Figure 4.9: The posterior prob. P (Ab|c, r) and P (Ab|c, r) in the Cos×Rank space.
much data were of both distributions. The number of occurrences of the abandondistribution was divided by the total number of occurrences of both the abandon andthe no-abandon distributions, given us P (Ab) = 0.64 and P (Ab) = 0.36 . Then, thetotal number of learned parameters was 15 (6+8+1).
Figure 4.9 shows the two posterior probabilities P (Ab|c, r) and P (Ab|c, r) afterlearning in order to represent the decision frontier between the two classes. As Fig. 4.9shows, the intersection is oblique which is what was expected, from a cognitive pointof view. Rank and Cos are dependent on each other: at the beginning of processingthe paragraph (low values of the Rank), there should be a high relatedness (a highCos) between the paragraph and the goal to make the decision. However, after morefixations have been made, that relatedness could be lower to decide to abandon theparagraph. For instance, at rank 10, a Cos of 0.7 is necessary to stop reading, whereasat rank 15, a value of 0.3 is enough. The Bayesian frontier is shown in Fig. 4.10.The frontier does not seem to be represented easily by a basic equation. For thatreason, two considerations were made to decide which function should be used to fit thefrontier. Firstly, and as we have already mentioned in Chapter 1 (p. 3), we tried to havethe minimum number of parameters for the model and to use a simple mathematicalequation as possible. The idea was not to fit the frontier perfectly in order to avoid the

70 Chapter 4. Computational Cognitive Modeling: a simple environment.
Figure 4.10: The Bayesian frontier between both the abandon and the no-abandoncases. Experimental data and its linear approximation are shown.
noisy data. By this way, our model should be robust enough to make predictions onnew data. Secondly, we observed that most of the data are concentrated for Cos valuesbelow 0.7. This situation can be noticed with the superposition of the densities of bothposterior probabilities for the no-abandon and abandon cases as is shown in Fig. 4.11aand 4.11b respectively. Due to that for Cos values below 0.7 the frontier seems to belinear, it is approximated by a simple linear equation in the Cos×Rank space:
Cos0 = −0.047×Rank + 1.05 .
This equation was included in the computational model. That model computes theCos0 value while it is moving forward in the text, increasing the Rank value. When thecurrent Cos value is greater than Cos0, the decision is to stop reading the paragraph.For example, Fig. 4.12 shows the cosine evolution of an experimental scanpath (dottedline) and the model frontier (straight line). The scanpath is composed of 21 fixationsbut the model decides to abandon the paragraph at fixation number 17 when the Cos
value is greater than Cos0 value computed by the model. However, we can observe thatparticipant made 4 more fixations than model before to stop reading the paragraph.
Once the model parameters have been set, the evaluation of the model is discussednow.
4.4.3 Model Performance
The evaluation of the model performance was done as it was explained on the previouschapter. The model is ran it on the remaining one third of the data. For each fixationin this testing set, the model decides either to leave or not to leave the paragraph. Wemade a distinction between the two cases: 1) model stops reading either before or at

4.4. Modeling 71
(a) No-Abandon (b) Abandon
Figure 4.11: Densities of posterior probabilities for the no-abandon and the abandondistributions.
Figure 4.12: Cosine evolution of an experimental scanpath and the model frontier.

72 Chapter 4. Computational Cognitive Modeling: a simple environment.
Figure 4.13: Distribution of the differences between the number of fixations (ranks)made by the participant and the model.
the same time of participant and 2) model stops reading after the participant. The case1 was observed in 81.25% of the trials and in 18.75% of the trials the model stoppedreading after the participant.
The average difference between the ranks at which model and participant stoppedreading was computed only for the case number 1 where the model is more reactivethan participant. We got a value of 4.7 (SE=0.72). It means that, in the average, themodel stopped reading 4.7 fixations earlier than participants. The distribution of thedifferences between the number of fixations made by the participant and the model isshowed in Figure 4.13. The difference between the rank at which model and participantstopped reading is indicated on the horizontal axis and the number of occurrences onthe vertical axis. A negative value for the difference of ranks (to the left) means thatour model is more reactive than participant and viceversa (to the rigth). Zero meansthat the model is resulting as reactive as participant. A total of 32 cases (scanpaths)were considered in the testing set.
For comparison purposes with the random model built (Ch. 3, pag. 55), the bestp value found such as the random model had the smallest average difference with par-ticipant ranks was for p = 0.1. That smallest average difference was of 11.09 (SE=1.2).So, the results presented in the current section indicates that our model is nearly threetimes (in average) better than the best random model (4.7 fix. vs 11.09 fix.).

4.5. Conclusion 73
4.5 Conclusion
So far, we have presented a computational cognitive model that is able to replicate theaverage people’s behavior, when they are faced to a task of information search and morespecifically when they are asked to decide as soon as possible if a paragraph presentedis related or not to a given search goal. The model predicts the sequence of words thatare likely to be fixated before the paragraph is abandoned. Two variables seem to playa role: the Rank of the fixation and the semantic similarity Cos between the wordsprocessed so far and the search goal. We proposed a simple linear threshold to accountfor that decision. The results are promising but still too far of a ideal model, whichis not the aim in the current thesis, but we believed in the possibility to improve theresults by following different approaches and in the next sections, the description ofsuch approaches is given.
4.6 Improvement
Rank and Cos are the variables that play a role in the computational cognitive modelpresented so far, and here we tried to investigate which other variables or factors wouldtrigger the decision to stop reading a paragraph. There is no doubt that participantsmake a different number of fixations on paragraphs before to stop reading it and ourhypothesis is that participant’s idiosyncracy also plays a role. For example some par-ticipants are more conservatives than others. The more conservatives might need todo more fixations than the less conservatives even if they had been realized about therelatedness or unrelatedness of a paragraph with the goal. These extra fixations madefor each participant can be seen as a necessity of a confirmation stage which is vari-able across participants. Then the idea was to characterise each participant with such avalue (eg. number of extra fixations) and we called it participant’s delay or participant’ssignature.
Then the problem addressed was how to compute the participant’s delay. We havefollowed two different approaches. In our first approach, we suspected that fixations onspecial words would play a role in triggering the decision to stop reading a paragraph.Saying differently, our hypothesis here was that when a special word is fixated, thenumber of fixations needed to stop reading the paragraph is modulated by the natureof such special word. Several special words were considered and their description willbe given later. In this approach, the participant’s delays were learned as independentvalues from all the other participants. In the second approach the participant’s delayswere learned by comparing each participant’s distribution with the distribution of aparticipant as reference and by computing the Kullback-Leibler (KL) divergence. Hereeach participant’s delay depends of the participant reference. This approach is alsoexplained later.

74 Chapter 4. Computational Cognitive Modeling: a simple environment.
The ultimate goal is to use the participant’s delays to improve the model perfor-mance by using these values for the modeling work as follows: given a participant with adelay d and a valid scanpath of n fixations, only the first n-d fixations will be consideredfor that particular scanpath because the remaining d fixations are considered that weremade during the confirmation stage of the participant and the decision was taken notafter the fixation (n−d). When the delay value d is either equal or greater to the num-ber of fixations n of a participant’s scanpath, the scanpath is totally excluded for themodeling work. When d = 0, all the n fixations of the scanpath would be considered.The procedure is done for all the scapanths of the corresponding participant.
Now, we will start by explaining how the participant’s delays were learned by usingour first approach and then their application to our modeling work is also discussed.
4.6.1 Participant’s delays learned by using the step word, target wordand the ramp word as references
As in the previous sections, only the paragraphs with a strong semantic associationwith the search goal (HR) were considered. Additionally, paragraphs for which theevolution of their semantic similarity with the goal follows a step or a ramp shapewere only studied. Therefore, the analysis only concerns paragraphs HR which followstep or ramp shapes called “HR-step” and “HR-ramp” respectively. The first two wordsconsidered as candidates to be special were the step and the target words. Additionally,a ramp word was also considered. Their descriptions are now given.
Given a set of fixations on a paragraph “HR-step”, the step word represents the wordwhich makes that the semantic similarity between the words seen so far and the goalincreases from a very low value to a higher value and this value is maintained till theend of the fixations for this particular scanpath. For example, on Figure 4.4a the 15th
fixation is made on the step word because it is there where the signal shows an abruptjump to a higher value which is maintained until the end of the scanpath.
A target word is in any verbal form of one of the words of the search goal (theme).For example, if the search goal is “croissance de l’économie”, target words could be:“croissance”,“économie”, “économique”, “economistes”, “croissante”, etc. Of course, thetarget words are always highly related with the search goal and in general they can befound only in paragraphs of type HR.
In the case of paragraphs “HR-ramp”, we also tried to use a special word as reference,but here things are different because there are two parameters defining the ramp: thebeginning word (initial index) and the ending word (final index) of the ramp respectively.For example, on Figure 4.4b the 5th and 13th fixations are made on the beginning wordand ending word of the ramp. We have considered the ending word of the ramp as thespecial word and we will refer it only as ramp word.
Then, we have predicted the delay value for each participant. This value is their

4.6. Improvement 75
Participant Min Max Med Mean Modes1 2 21 7.0 8.9 5.0s2 2 19 11.0 9.4 11.0s3 1 22 9.0 8.6 11.0s4 7 39 29.0 25.3 7.0s5 1 30 15.0 15.6 1.0s6 0 28 11.0 11.2 11.0s7 1 16 7.0 7.2 7.0s8 2 28 8.0 11.0 8.0s9 9 39 24.0 21.6 27.0s10 4 22 10.0 10.2 4.0s11 0 4 2.0 1.7 1.0s13 2 24 10.0 12.3 19.0s14 1 33 7.0 10.1 5.0s17 2 39 16.0 17.7 5.0s18 0 21 8.0 8.8 8.0s19 0 17 8.0 8.6 11.0s20 2 21 5.0 8.6 2.0s21 0 21 10.0 10.1 8.0
Table 4.4: Participant’s delays learned by using the step word as reference.
idiosyncratic tendency to wait after a decision has been made in their mind. To dothat, we relied on the special words that are likely to trigger the decision: step, targetand ramp. We computed the number of additional fixations made after one of thesespecial words were fixated.
For the case of the step word, we ended up with the results showed in Table 4.4. Thetable shows for each participant the minimum (Min), maximum (Max), median (Med),mean (Mean) and mode (Mode) of the number of fixations made after the fixation onthe step word up to the end of reading. For example, participant “s1” abandoned theparagraph in average 8.9 fixations after that the step word was fixated, but there wasat least one case where he abandoned the paragraph after 2 fixations (Min) and after 21fixations (Max). More often, the participant abandoned the paragraph after 5 fixationsafter the fixation on the step word. The median indicates that he abandoned theparagraph 7 fixations after the step word. In a similar way for the case of the target wordas reference, Table 4.5 shows the participant’s delays learned. Here, participant “s7”abandoned the paragraph in average 4.6 fixations after that the target word was fixated,but there was at least one case where he abandoned the paragraph after 2 fixations (Min)and after 7 fixations (Max). Mode and median indicate that the participant abandoned

76 Chapter 4. Computational Cognitive Modeling: a simple environment.
Participant Min Max Med Mean Modes1 1 13 7.0 6.6 7s2 1 21 9.0 9.8 2s3 2 17 5.7 7.4 3s4 1 24 5 9.2 1s5 3 22 4.0 9.0 4s6 1 15 6.0 7.0 1s7 2 7 5.0 4.6 5s8 2 17 5.0 7.2 2s9 4 25 12 12.6 5s10 3 27 6.0 9.0 5s11 0 13 5 4.0 1s13 2 13 5.0 6.0 5s14 5 21 12.5 12.7 5s17 1 22 8.0 9.5 2s18 1 9 4.0 4.3 1s19 1 14 2.5 4.8 1s20 1 24 4.0 7.1 1s21 1 11 3.0 4.27 1
Table 4.5: Participant’s delays learned by using the target word as reference.

4.6. Improvement 77
Participant Min Max Med Mean Modes1 0 9 2.0 3.6 2.0s2 0 9 3.0 3.8 3.0s3 0 5 2.5 2.6 2.0s4 4 30 13.5 16.0 4.0s5 1 7 4.0 4.0 2.0s6 0 8 3.0 3.5 0.0s7 0 7 3.0 2.8 0.0s8 1 7 4.5 4.5 4.0s9 0 8 7.0 5.6 7.0s10 0 15 1.5 4.0 1.0s11 0 6 1.0 2.0 1.0s13 0 10 4.5 4.3 5.0s14 0 3 1.0 1.2 0.0s17 0 6 2.0 2.8 2.0s18 1 7 4.5 4.3 3.0s19 1 17 2.5 4.8 2.0s20 0 8 4.0 4.0 4.0s21 0 6 1.5 2.1 1.0
Table 4.6: Participant’s delays learned by using the ramp word as reference.
the paragraph 5 fixations after the fixation on the target word.Finally, Table 4.6 shows the participant’s delays learned by using the ramp word as
reference. Here, participant “s21” abandoned the paragraph in average 2.1 fixations afterthat the ramp word was fixated, but there was at least one case where he abandonedthe paragraph after any fixation (Min) and after 6 fixations (Max). Mode and medianindicate that the participant abandoned the paragraph 1 and 1.5 fixations after thefixation on the ramp word.
Fig. 4.14 plots the participant’s delays curves learned for all the participants byusing the step, ramp and target words as references. The mode value was chosen asparticipant’s delay. In average, the participant’s delays learned by using the step wordare higher (mean=8.3, SE=1.5) than those learned by using the ramp (mean=2.3,SE=0.4) and the target word (mean=2.8, SE=0.4) and are significantly different. Inthe case of the values learned by using the ramp (mean=2.3, SE=0.4) and the target(mean=2.8, SE=0.4) words, there is not a significant difference (t-test, p>0.4) and duetheir low variability, we suspected that they should be good candidates to be used asparticipant’s delay in our modeling work.
Once the participant’s delays were learned and by following the same approach

78 Chapter 4. Computational Cognitive Modeling: a simple environment.
Figure 4.14: Participant’s delays learned for all the participants by using the step, rampand target words as references.
described in Section 4.4.1 (p. 63) to build the model, the two empirical fixation distri-butions were also computed in the Cos×Rank space: the no-abandon and the abandondistributions. The idea was to find the frontier between both, but before trying to fitthe data, we did a previsualisation of the frontier with a very simple smoothed versionof both experimental distributions. In the case of the step word the frontier does notseem to be a simple function between Rank and Cos as Fig. 4.15 shown. In the case ofthe target word the frontier does not seem to be a function with a dependency betweenRank and Cos as is shown in Fig. 4.16. Having a simple function with a dependencybetween Rank and Cos would be nicely from a cognitive point of view. To sum up, byusing the participant’s delays learned either from the step or target words, the modeldid not run.
However, for the case when participant’s delays were learned from ramp words thingswere different. Once these delays were applied, the frontier between both experimen-tal distributions (smoothed versions) showed a dependency between Rank and Cos aswe can see in Fig. 4.17. Then, we proceeded with our modeling work as before. Wecomputed both empirical fixation distributions: the no-abandon and the abandon dis-tributions in the Cos× Rank space. Both empirical distributions are shown in Figure4.18. Following a similar approach as in the development of our first version of themodel, the Bayesian classifier and a parametric approach to fit both distributions werealso used. Equations were the same for the Bayesian classifier (Eq. 4.3, pag. 66), thetwo class-conditional probabilities density functions (Eqs. 4.4 and 4.5, p. 66) and the
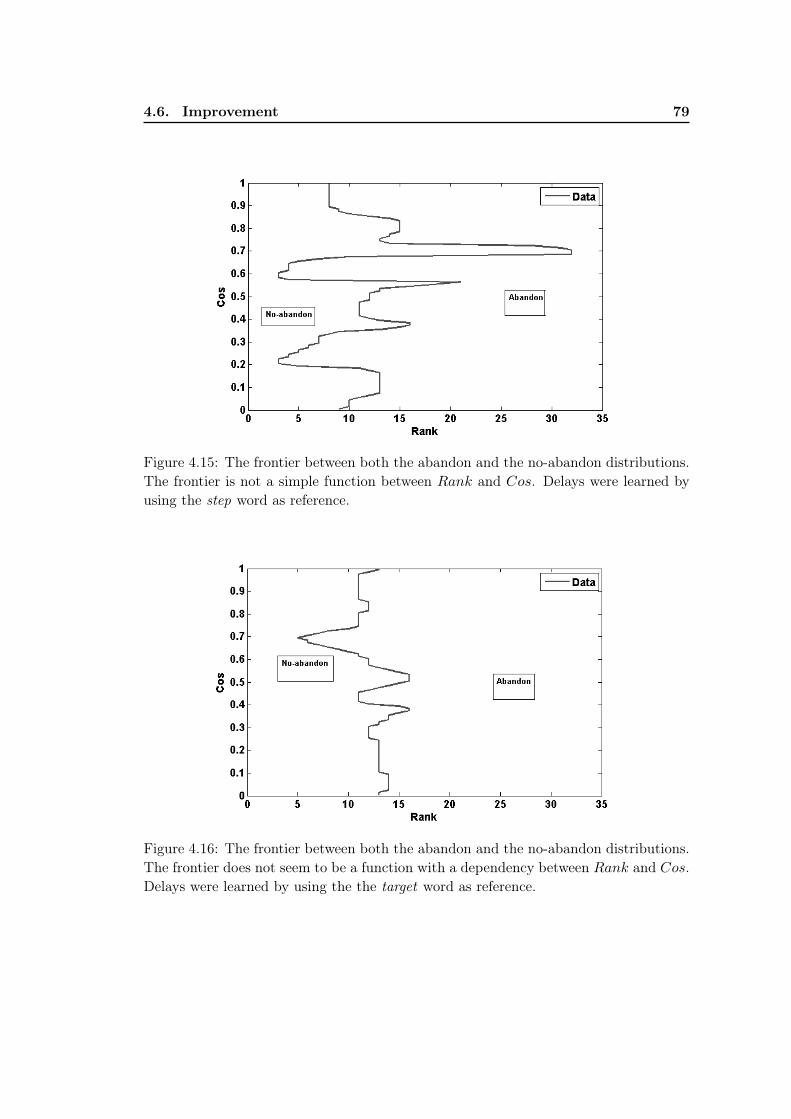
4.6. Improvement 79
Figure 4.15: The frontier between both the abandon and the no-abandon distributions.The frontier is not a simple function between Rank and Cos. Delays were learned byusing the step word as reference.
Figure 4.16: The frontier between both the abandon and the no-abandon distributions.The frontier does not seem to be a function with a dependency between Rank and Cos.Delays were learned by using the the target word as reference.

80 Chapter 4. Computational Cognitive Modeling: a simple environment.
Figure 4.17: The frontier between both the abandon and the no-abandon distributions.The frontier seems to be a function with a dependency between Rank and Cos. Delayswere learned by using the ramp word as reference.
decision rule (Eq. 4.6, p. 66). In the case of the no-abandon distribution, Fig. 4.19(top, left) shows the empirical marginal distribution p̂R(r|Ab). As the Rank increases,the probability of not abandoning the paragraph decreases. This evolution was alsomodeled with a sigmoid function (Eq. 4.7, p. 66). Concerning the probability densityfunction pC|R(.), the natural model (Fig. 4.18a) is also a Gamma one whose parametersdepend on the Rank value. Then we have:
pC|R(c|R = r,Ab) =A(r)ck(r)−1
(k(r)− 1)!θ(r)k(r)e− c
θ(r) , pR(r,Ab) = φ(r) .
The shape k(r) increases and the scale θ(r) decreases squarely (Fig. 4.19, left column).Both are modeled by squared equations: k(r) = Tr2+Ur+V and θ(r) = Wr2+Xr+Z.We then obtained eight independent parameters to model the complete “no-abandon”joint distribution: offset r0 and slope α for the sigmoid φ(r), the coefficients T ,U ,V fork(r) and W ,X,Z for θ(r).
In the case of the abandon distribution, the marginal pdf p̂R(r|Ab) was modeledwith another sigmoid function φ′(r) (Fig. 4.19, top right). But here, it is an increasingfunction. The conditional distribution p̂C|R(c|R = r,Ab) is a Gamma distribution witha shape k′(r) and a scale θ′(r).
The shape k′(r) decreases while the scale θ′(r) increases (Fig. 4.19, right column).Both are modeled by two 3-order polynomials: k′(r) = Gr3+Hr2+ Ir+J and θ′(r) =
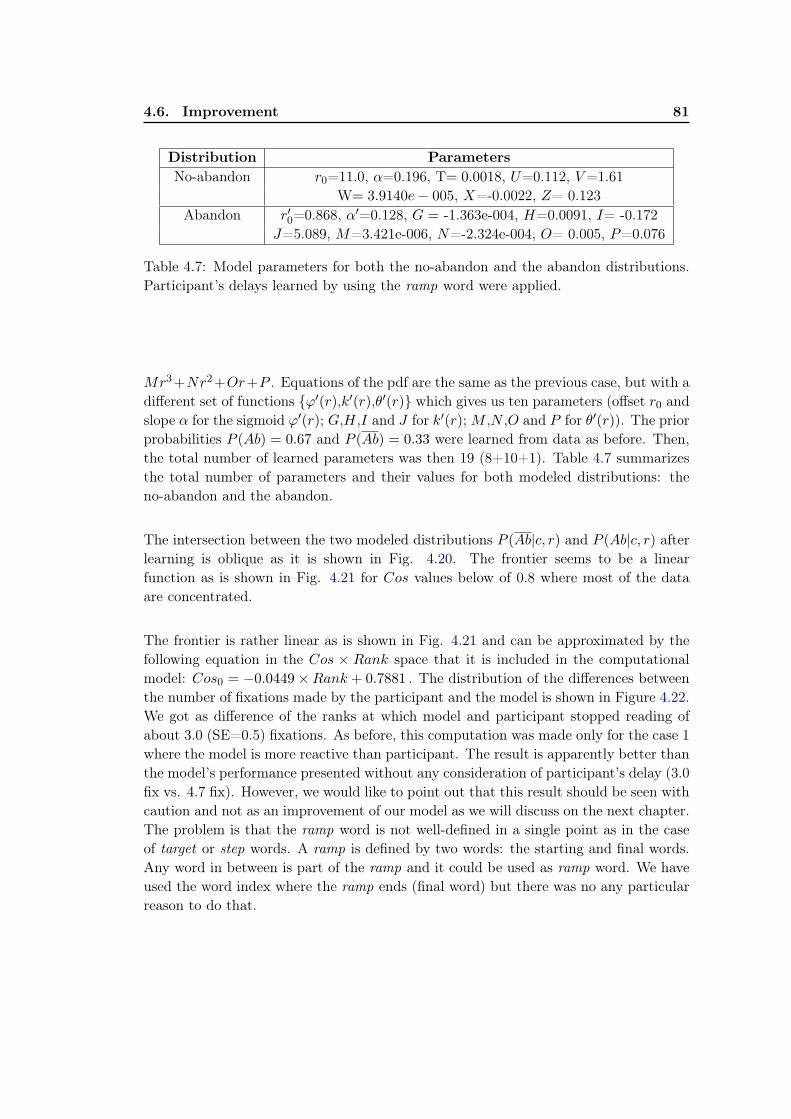
4.6. Improvement 81
Distribution ParametersNo-abandon r0=11.0, α=0.196, T= 0.0018, U=0.112, V =1.61
W= 3.9140e− 005, X=-0.0022, Z= 0.123Abandon r′0=0.868, α′=0.128, G = -1.363e-004, H=0.0091, I= -0.172
J=5.089, M=3.421e-006, N=-2.324e-004, O= 0.005, P=0.076
Table 4.7: Model parameters for both the no-abandon and the abandon distributions.Participant’s delays learned by using the ramp word were applied.
Mr3+Nr2+Or+P . Equations of the pdf are the same as the previous case, but with adifferent set of functions {φ′(r),k′(r),θ′(r)} which gives us ten parameters (offset r0 andslope α for the sigmoid φ′(r); G,H,I and J for k′(r); M ,N ,O and P for θ′(r)). The priorprobabilities P (Ab) = 0.67 and P (Ab) = 0.33 were learned from data as before. Then,the total number of learned parameters was then 19 (8+10+1). Table 4.7 summarizesthe total number of parameters and their values for both modeled distributions: theno-abandon and the abandon.
The intersection between the two modeled distributions P (Ab|c, r) and P (Ab|c, r) afterlearning is oblique as it is shown in Fig. 4.20. The frontier seems to be a linearfunction as is shown in Fig. 4.21 for Cos values below of 0.8 where most of the dataare concentrated.
The frontier is rather linear as is shown in Fig. 4.21 and can be approximated by thefollowing equation in the Cos × Rank space that it is included in the computationalmodel: Cos0 = −0.0449×Rank + 0.7881 . The distribution of the differences betweenthe number of fixations made by the participant and the model is shown in Figure 4.22.We got as difference of the ranks at which model and participant stopped reading ofabout 3.0 (SE=0.5) fixations. As before, this computation was made only for the case 1where the model is more reactive than participant. The result is apparently better thanthe model’s performance presented without any consideration of participant’s delay (3.0fix vs. 4.7 fix). However, we would like to point out that this result should be seen withcaution and not as an improvement of our model as we will discuss on the next chapter.The problem is that the ramp word is not well-defined in a single point as in the caseof target or step words. A ramp is defined by two words: the starting and final words.Any word in between is part of the ramp and it could be used as ramp word. We haveused the word index where the ramp ends (final word) but there was no any particularreason to do that.

82 Chapter 4. Computational Cognitive Modeling: a simple environment.
(a) (b)
Figure 4.18: a) Empirical “no-abandon” distribution p̂CR(c, r|Ab) and b) “abandon”distribution p̂CR(c, r|Ab) in the Cos × Rank space. Participant’s delays learned byusing the ramp word were applied.
Figure 4.19: Data and fitting of marginal distributions, shape and scale for the “no-abandon” and “abandon” distributions. Participant’s delays learned by using the rampword were applied.

4.6. Improvement 83
Figure 4.20: The posterior prob. P (Ab|c, r) and P (Ab|c, r) in the Cos × Rank space.Participant’s delays learned by using the ramp word were applied.
Figure 4.21: The Bayesian frontier between both the abandon and the no-abandoncases. Delays were learned by using the ramp word as reference. Experimental dataand its linear approximation are shown.
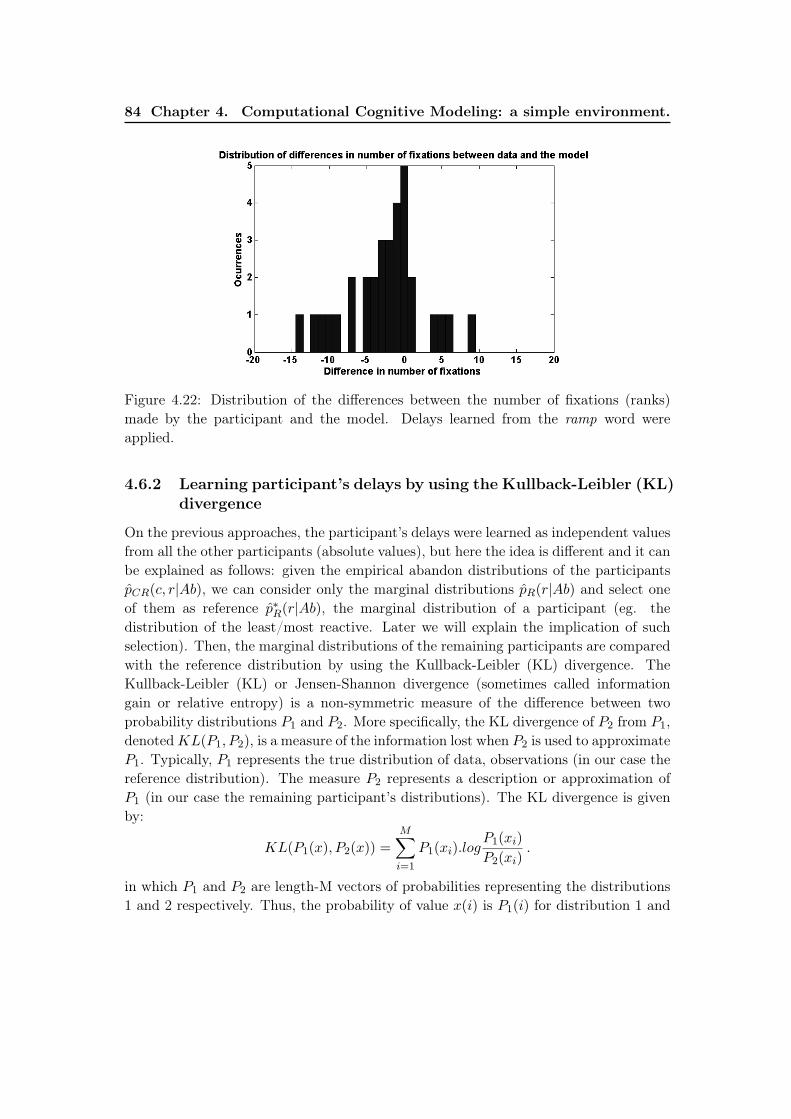
84 Chapter 4. Computational Cognitive Modeling: a simple environment.
Figure 4.22: Distribution of the differences between the number of fixations (ranks)made by the participant and the model. Delays learned from the ramp word wereapplied.
4.6.2 Learning participant’s delays by using the Kullback-Leibler (KL)divergence
On the previous approaches, the participant’s delays were learned as independent valuesfrom all the other participants (absolute values), but here the idea is different and it canbe explained as follows: given the empirical abandon distributions of the participantsp̂CR(c, r|Ab), we can consider only the marginal distributions p̂R(r|Ab) and select oneof them as reference p̂∗R(r|Ab), the marginal distribution of a participant (eg. thedistribution of the least/most reactive. Later we will explain the implication of suchselection). Then, the marginal distributions of the remaining participants are comparedwith the reference distribution by using the Kullback-Leibler (KL) divergence. TheKullback-Leibler (KL) or Jensen-Shannon divergence (sometimes called informationgain or relative entropy) is a non-symmetric measure of the difference between twoprobability distributions P1 and P2. More specifically, the KL divergence of P2 from P1,denoted KL(P1, P2), is a measure of the information lost when P2 is used to approximateP1. Typically, P1 represents the true distribution of data, observations (in our case thereference distribution). The measure P2 represents a description or approximation ofP1 (in our case the remaining participant’s distributions). The KL divergence is givenby:
KL(P1(x), P2(x)) =M∑i=1
P1(xi).logP1(xi)
P2(xi).
in which P1 and P2 are length-M vectors of probabilities representing the distributions1 and 2 respectively. Thus, the probability of value x(i) is P1(i) for distribution 1 and
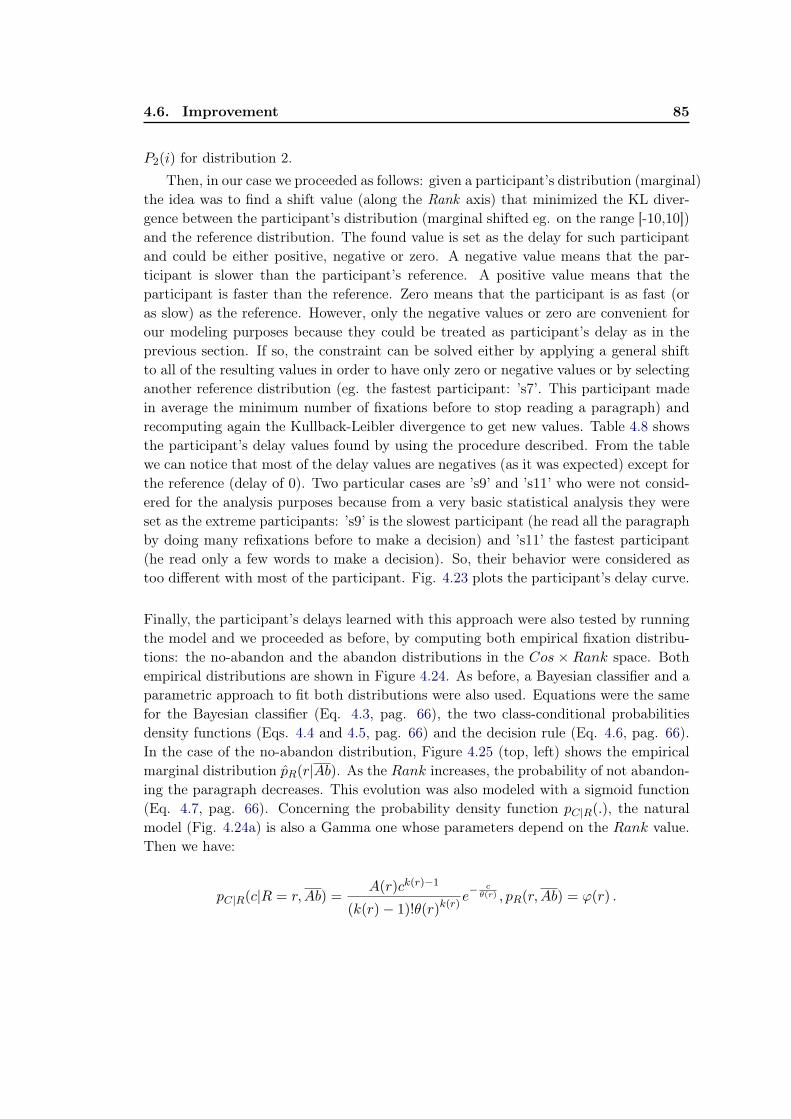
4.6. Improvement 85
P2(i) for distribution 2.Then, in our case we proceeded as follows: given a participant’s distribution (marginal)
the idea was to find a shift value (along the Rank axis) that minimized the KL diver-gence between the participant’s distribution (marginal shifted eg. on the range [-10,10])and the reference distribution. The found value is set as the delay for such participantand could be either positive, negative or zero. A negative value means that the par-ticipant is slower than the participant’s reference. A positive value means that theparticipant is faster than the reference. Zero means that the participant is as fast (oras slow) as the reference. However, only the negative values or zero are convenient forour modeling purposes because they could be treated as participant’s delay as in theprevious section. If so, the constraint can be solved either by applying a general shiftto all of the resulting values in order to have only zero or negative values or by selectinganother reference distribution (eg. the fastest participant: ’s7’. This participant madein average the minimum number of fixations before to stop reading a paragraph) andrecomputing again the Kullback-Leibler divergence to get new values. Table 4.8 showsthe participant’s delay values found by using the procedure described. From the tablewe can notice that most of the delay values are negatives (as it was expected) except forthe reference (delay of 0). Two particular cases are ’s9’ and ’s11’ who were not consid-ered for the analysis purposes because from a very basic statistical analysis they wereset as the extreme participants: ’s9’ is the slowest participant (he read all the paragraphby doing many refixations before to make a decision) and ’s11’ the fastest participant(he read only a few words to make a decision). So, their behavior were considered astoo different with most of the participant. Fig. 4.23 plots the participant’s delay curve.
Finally, the participant’s delays learned with this approach were also tested by runningthe model and we proceeded as before, by computing both empirical fixation distribu-tions: the no-abandon and the abandon distributions in the Cos × Rank space. Bothempirical distributions are shown in Figure 4.24. As before, a Bayesian classifier and aparametric approach to fit both distributions were also used. Equations were the samefor the Bayesian classifier (Eq. 4.3, pag. 66), the two class-conditional probabilitiesdensity functions (Eqs. 4.4 and 4.5, pag. 66) and the decision rule (Eq. 4.6, pag. 66).In the case of the no-abandon distribution, Figure 4.25 (top, left) shows the empiricalmarginal distribution p̂R(r|Ab). As the Rank increases, the probability of not abandon-ing the paragraph decreases. This evolution was also modeled with a sigmoid function(Eq. 4.7, pag. 66). Concerning the probability density function pC|R(.), the naturalmodel (Fig. 4.24a) is also a Gamma one whose parameters depend on the Rank value.Then we have:
pC|R(c|R = r,Ab) =A(r)ck(r)−1
(k(r)− 1)!θ(r)k(r)e− c
θ(r) , pR(r,Ab) = φ(r) .
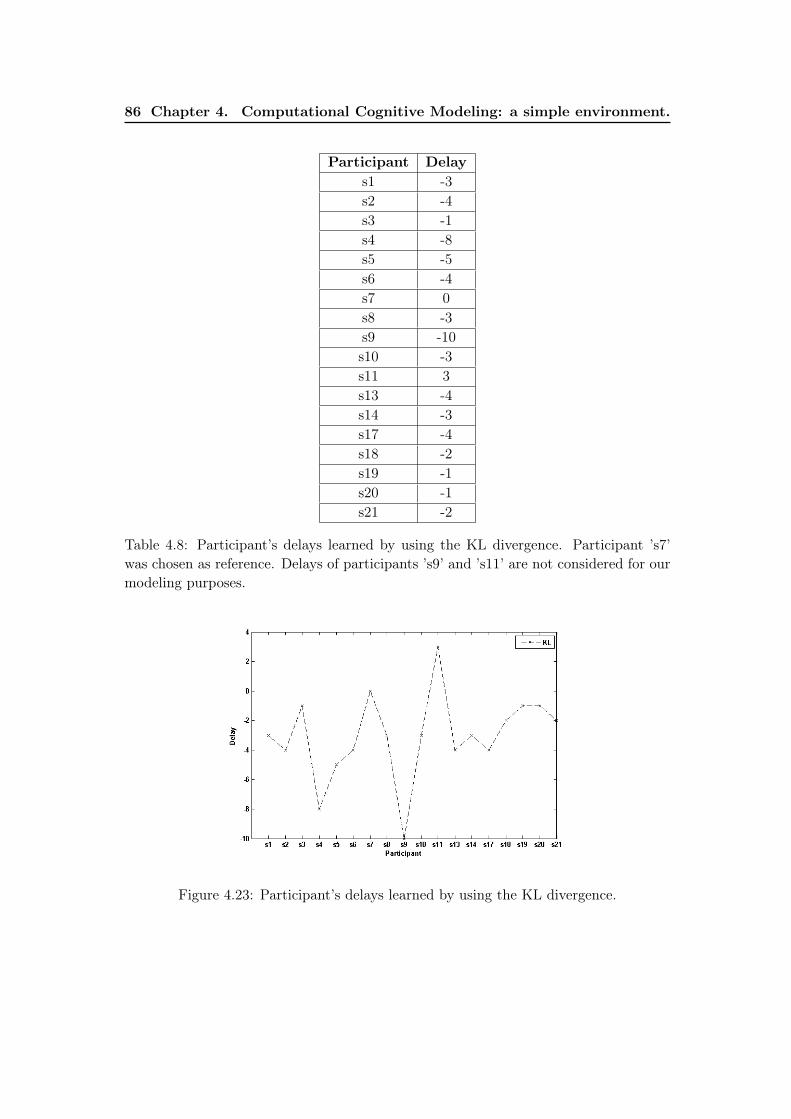
86 Chapter 4. Computational Cognitive Modeling: a simple environment.
Participant Delays1 -3s2 -4s3 -1s4 -8s5 -5s6 -4s7 0s8 -3s9 -10s10 -3s11 3s13 -4s14 -3s17 -4s18 -2s19 -1s20 -1s21 -2
Table 4.8: Participant’s delays learned by using the KL divergence. Participant ’s7’was chosen as reference. Delays of participants ’s9’ and ’s11’ are not considered for ourmodeling purposes.
Figure 4.23: Participant’s delays learned by using the KL divergence.

4.6. Improvement 87
(a) (b)
Figure 4.24: a) Empirical “no-abandon” distribution p̂CR(c, r|Ab) and b) “abandon”distribution p̂CR(c, r|Ab) in the Cos × Rank space. Participant’s delays learned byusing the KL divergence were applied.
The shape k(r) increases and the scale θ(r) decreases squarely (Fig. 4.25, left column).Both are modeled by squared equations: k(r) = Tr2+Ur+V and θ(r) = Wr2+Xr+Z.We then obtained eight independent parameters to model the complete “no-abandon”joint distribution: offset r0 and slope α for the sigmoid φ(r), the coefficients T ,U ,V fork(r) and W ,X,Z for θ(r).
In the case of the abandon distribution, the marginal pdf p̂R(r|Ab) was modeledwith another sigmoid function φ′(r) (Fig. 4.25, top right). But here, it is an increasingfunction. The conditional distribution p̂C|R(c|R = r,Ab) is a Gamma distribution witha shape k′(r) and a scale θ′(r). The shape k′(r) exponentially decreases while thescale θ′(r) exponentially increases (Fig. 4.25, right column). Both are modeled byexponential equations: k′(r) = (s2 − s1)e
−r/p0 + s2 and θ′(r) = (t2 − t1)e−r/q0 + t2.
Equations of the pdf are the same as the previous case, but with a different set offunctions {φ′(r),k′(r),θ′(r)} which gives us eight parameters (offset r0 and slope α forthe sigmoid φ′(r); p0,s1 and s2 for k′(r); q0, t1 and t2 for θ′(r)).
The prior probabilities P (Ab) = 0.69 and P (Ab) = 0.31 were learned from data asbefore. Then, the total number of learned parameters was then 17 (8+8+1). Table4.9 summarizes the total number of parameters and their values for both modeleddistributions: the no-abandon and the abandon.
The intersection between the two modeled distributions P (Ab|c, r) and P (Ab|c, r)after learning is oblique as it is shown in Fig. 4.26. As before, the frontier does not seemto be a linear function as is shown in Fig. 4.27. The frontier was approximated by anexponential function in the Cos×Rank space: Cos0 = 99× 1
Rank2−0.2. However, most
of the data are concentrated for Cos values below of 0.8. This situation can be seen withthe superposition of densities of both posterior probabilities of Fig. 4.28a and 4.28b. ForCos values below of 0.8 the frontier seems to be linear as is shown in Fig. 4.27. Then,the frontier was also approximated by a linear function: Cos0 = −0.101×Rank+1.727 .

88 Chapter 4. Computational Cognitive Modeling: a simple environment.
Figure 4.25: Data and fitting of marginal distributions, shape and scale for the “no-abandon” and “abandon” distributions. Participant’s delays learned by using the KLdivergence were applied.
Distribution ParametersNo-abandon r0=15.0, α=0.292, T= 0.007, U=0.027, V =1.777
W= −2.089e− 004, X= 0.002, Z= 0.124Abandon r′0=10.0, α′= 0.299, p0 = 1.759,s1= 8.076, s2=4.352, q0= 3.359
t1= 0.032, t2=0.105
Table 4.9: Model parameters for both the no-abandon and the abandon distributions.Participant’s delays learned by using the KL divergence were applied.
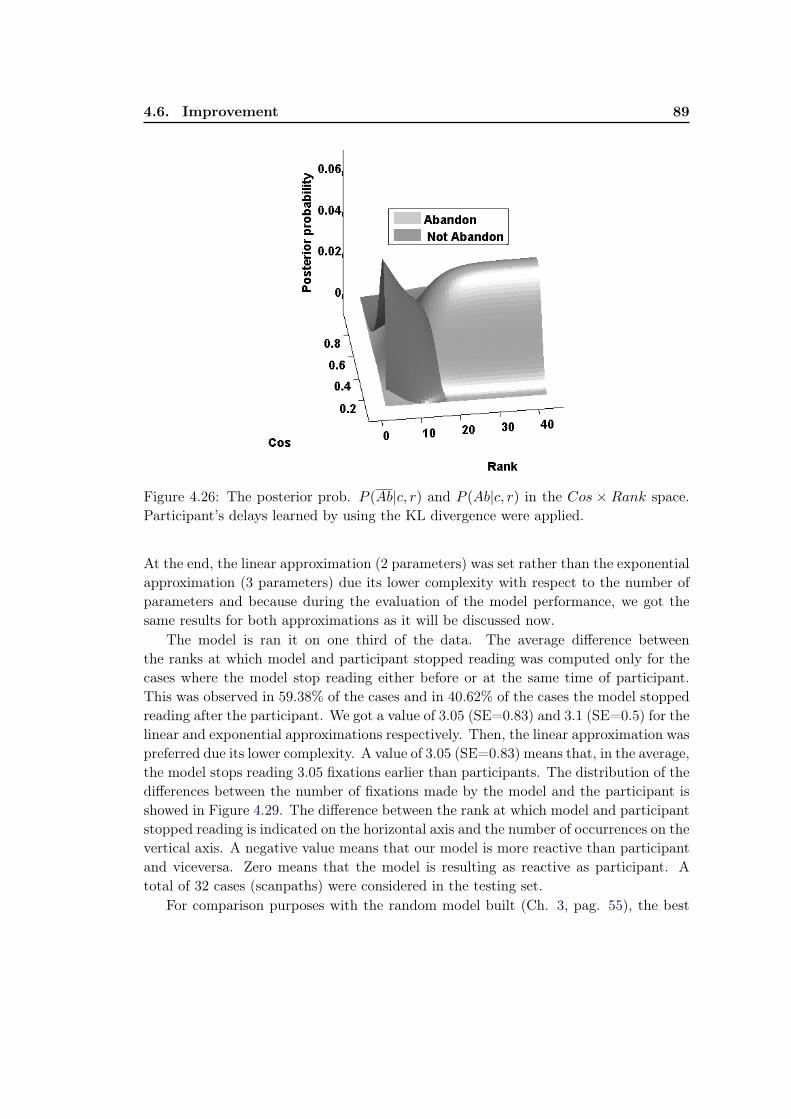
4.6. Improvement 89
Figure 4.26: The posterior prob. P (Ab|c, r) and P (Ab|c, r) in the Cos × Rank space.Participant’s delays learned by using the KL divergence were applied.
At the end, the linear approximation (2 parameters) was set rather than the exponentialapproximation (3 parameters) due its lower complexity with respect to the number ofparameters and because during the evaluation of the model performance, we got thesame results for both approximations as it will be discussed now.
The model is ran it on one third of the data. The average difference betweenthe ranks at which model and participant stopped reading was computed only for thecases where the model stop reading either before or at the same time of participant.This was observed in 59.38% of the cases and in 40.62% of the cases the model stoppedreading after the participant. We got a value of 3.05 (SE=0.83) and 3.1 (SE=0.5) for thelinear and exponential approximations respectively. Then, the linear approximation waspreferred due its lower complexity. A value of 3.05 (SE=0.83) means that, in the average,the model stops reading 3.05 fixations earlier than participants. The distribution of thedifferences between the number of fixations made by the model and the participant isshowed in Figure 4.29. The difference between the rank at which model and participantstopped reading is indicated on the horizontal axis and the number of occurrences on thevertical axis. A negative value means that our model is more reactive than participantand viceversa. Zero means that the model is resulting as reactive as participant. Atotal of 32 cases (scanpaths) were considered in the testing set.
For comparison purposes with the random model built (Ch. 3, pag. 55), the best

90 Chapter 4. Computational Cognitive Modeling: a simple environment.
Figure 4.27: The Bayesian frontier between both the abandon and the no-abandon cases.Participant’s delays learned by using the KL divergence were applied. Experimentaldata, their linear and exponential fitting are shown.
(a) No-Abandon (b) Abandon
Figure 4.28: Densities of posterior probabilities for the no-abandon and the abandondistributions. Participant’s delays learned by using the KL divergence were applied.

4.7. Conclusions 91
Figure 4.29: Distribution of the differences between the number of fixations (ranks)made by the participant and the model when. Delays learned by using the KL divergencewere applied.
p value found such as the random model had the smallest average difference with par-ticipant ranks was for p = 0.18. That smallest average difference was of 9.43 (SE=1.2).Our model therefore appears to be much better than the best random model. Morestill important is that the model performance is better than the first model presentedin about 1.7 fixations (3.05 fix., SE=0.83 vs 4.7 fix, SE=0.72) in this chapter when anyconsideration of a participant’s delay was considered.
4.7 Conclusions
So far in the current chapter, we have presented a first version of our computationalcognitive model to simulate people’s behavior during a task of information search. Morespecifically, our model makes predictions at the level of words that are likely to be fixatedby people before to stop reading a paragraph. Then, we have followed several approachesby trying to improve the performance of this first model. In all the approaches, theidea was to get a signature d for each participant. Our hypothesis was that participantsdo not make their decisions until the last fixation of a scanpath but they make it as isindicated by the delay value at fixation (n− d).
The first approaches were based on special words: step, ramp and target. However,only in the case of the ramp word, we got a result but as we have argued before, thisshould be taken with caution.
In our last approach, finally we ended up with a second version of the model. Here,each participant was characterised with a delay value learned by using the KL diver-gence. And as we have noticed earlier, the model performance is better than the first
92 Chapter 4. Computational Cognitive Modeling: a simple environment.
version of our model. However, we thought that the idea to get a participant’s signature(as a delay value) has not been exploited completely and there is at least one reasonto think about that. For example, we have tried to characterise to participants with asimple value. Once this value is learned, the value is set and it is used for all the scan-paths of such participant. Maybe we should consider that the value is also modulatedby another factor like the semantic association between the processed words so far andthe search goal. Saying differently, a participant might not need to do the same numberof fixations to confirm his decision if the semantic association between the words seenand the goal is of 0.4 than if the semantic association is 0.8 or higher. By this way, theparticipant’s delay should be modulated by the semantic association between the wordsactually processed in the paragraph and the search goal during the reading process.
The evaluation of the model performance was done by following the experimentalscanpaths. A new Cos0 value is computed in each fixation while it is moving forwardin a paragraph. However, if we had a new paragraph, our model will assume a linearexploration of words, although we know that this is not exactly the case in informationsearch (Chanceaux et al., 2009).

Chapter 5
Computational Cognitive Modeling:a second environment
In the previous chapter, we have presented a computational cognitive model to simulatepeople’s behavior when they are faced to a simple information search task. In this chap-ter we present a new computational cognitive model for another common task performedby people during information search: reading a paragraph with the task of quickly de-ciding whether it is better related to a given goal than another paragraph processedpreviously. Saying differently, we are interested in studying people’s behavior whenthey are concerned with deciding whether the current paragraph is more interesting ornot than another paragraph that has been processed before. The model corresponds tothe Situation 2 (p. 40, Fig. 3.2) that we aim at modeling.
The goal was therefore to build a model that would describe the cognitive processesinvolved in this decision-making situation but also predict when an average user islikely to stop reading the current paragraph for a given goal and a paragraph processedpreviously. For the conception of the model, we have followed the same eye-trackingexperimental approach to gather some data as it was done in last chapter. On nextsection, the new experiment is presented. Then, the learning phase of the model andthe model performance are also discussed.
5.1 Experiment II: two-paragraph experiment
The experiment was intended to emphasize the decision to stop reading a paragraphwith the task to decide if it is better related to a search goal than another paragraphprocessed previously.
5.1.1 Participants
A total of 22 French native speakers participated in the experiment (age range 22-56years, mean age=29.3 years, sd=8.3 years). All participants had normal or corrected-to-normal visual acuity. They were naive with respect to the purpose of the study, andall gave written consent.

94 Chapter 5. Computational Cognitive Modeling: a second environment
5.1.2 Material
The material described in Chapter 3 (p. 47) was used in the experiment: twenty goalswith seven paragraphs each: two highly related (HR), two moderately related (MR)and three unrelated (UR) paragraphs.
5.1.3 Apparatus
The description of the eye-tracker device is given in Chapter 3 (p. 48). The EyeLinksystem was used in tracking mode sampling at 500Hz. Eye position data were collectedonly for the guiding eye.
5.1.4 Procedure
The experiment is composed of 20 trials, each one corresponding to a goal, in randomorder. During each trial participants were exposed to six stimuli pages composed oftwo paragraphs of the corresponding goal. At the very beginning of the experiment,an initial 9-point calibration was done. Drift corrections were done before each trial toensure the recording accuracy of eye movements. The procedure began with a learningtrial using one new goal and its corresponding seven paragraphs, excluded from theanalyses. In each trial, a fixation cross is displayed at the top (horizontally centered)waiting for the participant’s gaze to be inside a box of 120 pixels wide and 180 pixelshigh centered on the fixation cross. Once the participant’s gaze is detected inside thebox, the gaze position was controlled to remain inside during more than a fixed valueof 500 ms. A re-calibration routine was automatically done if the timeout on the initialfixation cross elapsed or if the experimenter decided to run it. Then two paragraphswere presented together to the participant, as well as the goal as is shown in Fig. 5.1.Afterwards, the participant should select which paragraph is best related to the goal,by typing one key. The chosen paragraph is kept and the other is replaced by a newone. The participant should again select the most related to the goal. Then anotherparagraph replaces the one that was not selected and so on. This procedure is repeateduntil all seven paragraphs of the current goal were displayed. Participants rated theirconfidence in their selection. The participant knew that between each goal, a pausecould be managed if necessary and he/she knew the number of remaining goals untilthe end. Figure 5.2 shows the different screens presented to the participant during acomplete trial. In order to get a more rich process of competition along the trial acombination of paragraphs of the same type is avoided only for the first stimuli page.
During the experiment, participant’s head position was stabilized with a chin restand their forehead supported on a fixed bar. Participants were seated 57 cm in frontof a 22-inch monitor (39◦x 29◦ of visual field) with a screen resolution of 1024 by 768pixels. The text was displayed at the centre of the screen (27◦x 18◦ of visual field).

5.2. Pre-processing data 95
Figure 5.1: Example of material and scanpath.
In average, the text is displayed with 64 characters per line, corresponding about 5characters in fovea. We wrote our experiments in Matlab, using the PsychophysicsToolbox extensions (Brainard, 1997; Pelli, 1997; Kleiner et al., 2007).
5.2 Pre-processing data
All the procedure followed is detailed in Chapter 3 (p. 48). Basically it includes theconversion from eye-tracker data to a file containing the words actually processed ineach fixation by using our window-based approach.
Once data were adequate, and before to do a deeply analysis, some considerationsand the computation of some basic statistics were done. Their descriptions are nowgiven.
5.3 Basic statistics
Due to the nature of our experiment that has the aim to emphasize the participant’sdecision to selecting one of two paragraphs presented according to its relatedness tothe goal, we thought that it was interesting to only consider and to study the followingcases or participant’s behaviors:
(a) Participant has only to collect information. Participant is only collecting infor-mation when he/she is discovering a new paragraph and he/she does not knowanything about other paragraph. This is the case when the first stimuli page isdisplayed and participant is reading the first paragraph.
(b) Participant has to read a paragraph to compare it to the other one. When partic-ipant decides to leave the first paragraph visited and goes to the other one, he isperforming two activities at the same time: collecting information and comparingthe current paragraph with the previous in order to choose the best one.

96 Chapter 5. Computational Cognitive Modeling: a second environment
Figure 5.2: Temporal sequence of a trial composed of the different screens of ExperimentII.

5.3. Basic statistics 97
In order to study these two behaviors, different categories of visiting a paragraph wereconsidered. A visit to a paragraph of type HR or MR is referred to simply as HM.When people are visiting a paragraph HM, we make a distinction between three cases:
• People does not know anything about the other paragraph. This case is notatedas HM/0 and can be read as visiting a paragraph HM without knowing anythingabout the other one. This case corresponds to the first behavior (a) of our interest.
• People knows the other paragraph and this paragraph is also of type HM. Thiscase is notated as HM/HM and can be read as visiting a paragraph HM knowingthe previous paragraph of type HM. This case corresponds to the behavior (b)mentioned above.
• People knows the other paragraph and this paragraph is of type UR. This caseis notated as HM/UR and can be read as visiting a paragraph HM knowing theprevious paragraph of type UR. This case also corresponds to the second behavior(b) already mentioned.
To sum up, we analyzed the three categories of visiting a paragraph: HM/0, HM/HMand HM/UR. Although, paragraphs HR and MR have different association with thegoal, both are considered into the same category of visiting a paragraph (HM) in orderto reduce the number of categories treated but paragraphs of type UR must be consid-ered in a separated category since they are unrelated to the goal. In such categories,we have analyzed the number of fixations per word, fixation duration and the shape ofthe scanpath or “strategy” that people follow when they are visiting the paragraphs.
Number of fixations per word. This indicator can be seen as a reading rate. Thenumber of fixations in a paragraph is divided by the total number of words in the para-graph. Figure 5.3 shows the results for the visits HM/0, HM/UR and HM/HM. Thereis not a significant difference of number of fixations between visits of type HM/0 andHM/UR (t-test, p>0.96), but there is a significant difference in between HM/0 andHM/HM (t-test, p<0.05) and HM/UR and HM/HM (t-test, p<0.05). It means thatreading the first paragraph or reading one when the previous one is unrelated to thegoal is about the same with respect to the number of fixations per word. Thus, visits oftype HM/0 and HM/UR can be considered together and called: HM/0-HM/UR. Withthis consideration, results show that the number of fixations in visits of type HM/HM(mean=0.68, SD=0.10) is greater than in visits of type HM/0-HM/UR (mean=0.36,SD=0.06) and significantly different (t-test, p<0.05). One of the reasons may be dueto the fact that when participant is visiting a paragraph of type HM knowing the otherparagraph of type HM, it is not easy to decide which one is the best because both para-graphs have an association with the goal, so participant might revisit the paragraphs inorder to confirm their knowledge about them and being able to choose one. Contrarily,
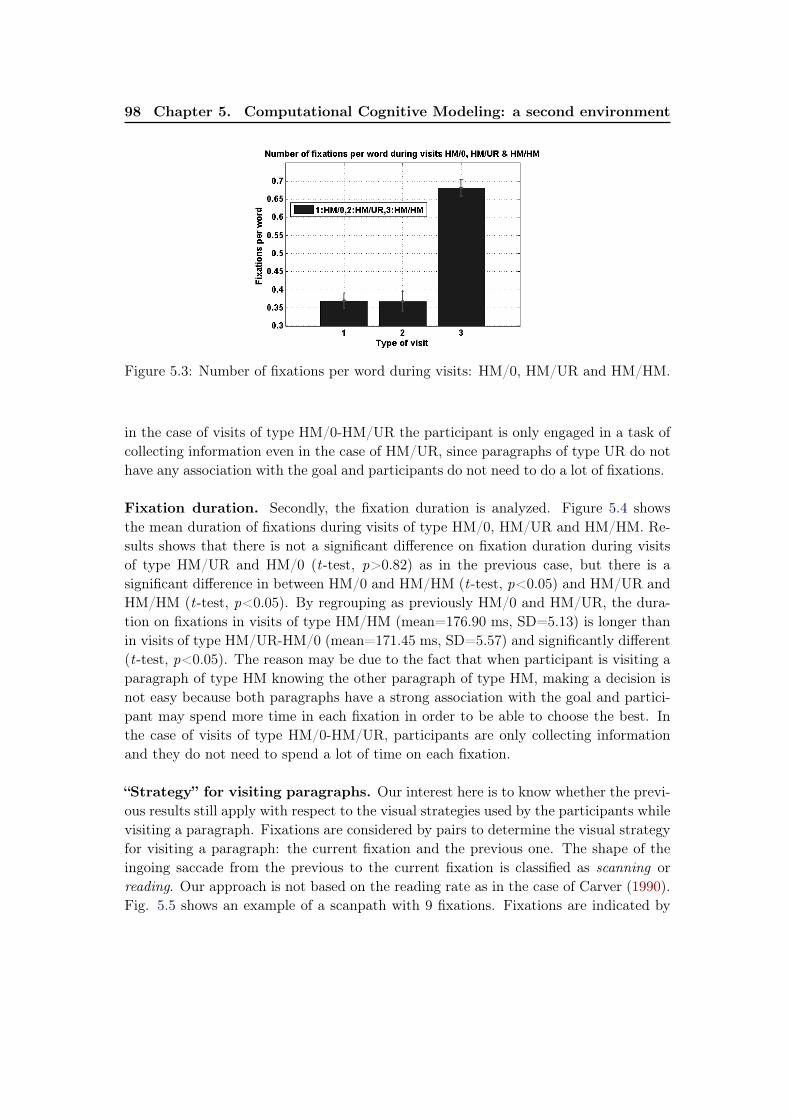
98 Chapter 5. Computational Cognitive Modeling: a second environment
Figure 5.3: Number of fixations per word during visits: HM/0, HM/UR and HM/HM.
in the case of visits of type HM/0-HM/UR the participant is only engaged in a task ofcollecting information even in the case of HM/UR, since paragraphs of type UR do nothave any association with the goal and participants do not need to do a lot of fixations.
Fixation duration. Secondly, the fixation duration is analyzed. Figure 5.4 showsthe mean duration of fixations during visits of type HM/0, HM/UR and HM/HM. Re-sults shows that there is not a significant difference on fixation duration during visitsof type HM/UR and HM/0 (t-test, p>0.82) as in the previous case, but there is asignificant difference in between HM/0 and HM/HM (t-test, p<0.05) and HM/UR andHM/HM (t-test, p<0.05). By regrouping as previously HM/0 and HM/UR, the dura-tion on fixations in visits of type HM/HM (mean=176.90 ms, SD=5.13) is longer thanin visits of type HM/UR-HM/0 (mean=171.45 ms, SD=5.57) and significantly different(t-test, p<0.05). The reason may be due to the fact that when participant is visiting aparagraph of type HM knowing the other paragraph of type HM, making a decision isnot easy because both paragraphs have a strong association with the goal and partici-pant may spend more time in each fixation in order to be able to choose the best. Inthe case of visits of type HM/0-HM/UR, participants are only collecting informationand they do not need to spend a lot of time on each fixation.
“Strategy” for visiting paragraphs. Our interest here is to know whether the previ-ous results still apply with respect to the visual strategies used by the participants whilevisiting a paragraph. Fixations are considered by pairs to determine the visual strategyfor visiting a paragraph: the current fixation and the previous one. The shape of theingoing saccade from the previous to the current fixation is classified as scanning orreading. Our approach is not based on the reading rate as in the case of Carver (1990).Fig. 5.5 shows an example of a scanpath with 9 fixations. Fixations are indicated by

5.3. Basic statistics 99
Figure 5.4: Mean fixation duration during visits: HM/0, HM/UR and HM/HM.
the gray spots whereas the saccades by the lines connecting pairs of fixations. Fixationsare labeled as “R” (reading) or “S” (scanning) according to the shape of the saccadethat connect them. For the case of reading, basically we consider either a short or longforward saccade (a maximum of three words length) on the same line of text, a shortbackward saccade (a maximum of one word length) or a long forward saccade goingfrom the last word of the current line to the first word of the next line of the paragraph.In any other case, the scanpath is classified as scanning. The first fixation of a scanpathis always labeled as scanning (“S”). In the example of the Fig. 5.5, fixation 1 is labeledas “S”. Then there is a long forward saccade to the fixation 2 (“R”), a short backwardsaccade to the fixation 3 (“R”). Then there are two long forward saccades to the fixation4 (“R”) and 5 (“R”). Fixation 6 is labeled as “R” because there is long forward saccadegoing from the fixation 5 to the fixation 6. Ingoing saccades from fixations 7 and 8 areclassified as scanning (“S”). At the end, there is short forward saccade to the fixation 9(“R”).
Once the saccades were classified, we set a value of 0 for a reading saccade and 1 fora scanning saccade. Then, we computed the average of all these values to have an ideaif participant’s trend is more likely to perform a reading or a scanning strategy. A valueclose to 0 means a linear reading and a value close to 1 means a scanning strategy ornon-linear reading. Figure 5.6 shows the strategy for visiting a paragraph during visitsof type HM/0, HM/UR and HM/HM. Contrarily to the number of fixations per wordand fixation duration, there is a significant difference between visits of type HM/0 andHM/UR (t-test, p<0.05). Also, there is a significant difference between HM/HM andHM/UR (t-test: p<0.05) but there is not a significant difference between HM/HM andHM/0 (t-test: p>0.20).
As expected, in no case participants performed either a pure scanning or a purereading strategy. However, during visits of type HM/UR (mean=0.42, SD=0.06),

100 Chapter 5. Computational Cognitive Modeling: a second environment
Figure 5.5: Strategy for visiting a paragraph for HM/0, HM/UR and HM/HM visits.
Figure 5.6: Strategy for visiting a paragraph for HM/0, HM/UR and HM/HM visits.

5.3. Basic statistics 101
participant’s trend is to scan more than read as opposed in the case of visits HM/0(mean=0.37, SD=0.05) and HM/HM (mean=0.39, SD=0.02). This situation may bedue to the fact that when people are looking at the current paragraph HM but theyhave realized that the other paragraph is irrelevant to the goal (paragraph UR), theyare encouraged to find quickly if the current paragraph is related or not to the goal.Therefore, many words are not fixated. In the case of visits HM/HM, making a decisionis not easy because both paragraphs are related to the goal, so participant should readcarefully their contents before being able to choose the best
Preference over first or second paragraph seen. As we have described before, ineach trial participants were exposed to two paragraphs HR (here namely hra and hrb),two paragraphs MR and three paragraphs UR. Due to the fact that hra and hrb havestrong association with the goal, they are much more likely to be chosen as the bestone at the end of the trial. However, one of them is displayed before the other one, andhere, we investigated how people make a decision in between them: is there a preferenceto choose the first paragraph versus the second paragraph seen? In other words, ourquestion is, do people tend to maintain their initial choice or not? We studied such peo-ple’s behavior by computing the probability of choosing one of the two paragraphs. Theprobability that participants choose the first paragraph hr1 over the second paragraphhr2 seen P (Hr∗ = hr1) is computed as:
P (Hr1 = hra)× P (Hr∗ = hr1/hr1 = hra) + P (Hr1 = hrb)× P (Hr∗ = hr1/hr1 = hrb)
(5.1)in which Hr∗ is the paragraph chosen and P (Hr∗ = hr2) = 1− P (Hr∗ = hr1).
Results showed that there is not an important participant’s preference to choosethe first paragraph seen over the second one: P (Hr∗ = hr1), mean=0.53, SD=0.18;P (Hr∗ = hr1), mean=0.46, SD=0.18 (t-test: p>0.36).
Preference over left or right side. In a similar way, the preference over the para-graph displayed on the left or on the right side was investigated. The probability thatparticipants choose the left paragraph (namely here hrleft) over the right one (hrright)is computed using the Eq. 5.1 by replacing hr1 for hrleft and hr2 for hrright.
Our results show that there is not an important effect (t-test: p>0.14) on partic-ipant’s decision of whether a paragraph is displayed on left (mean=0.55, SD=0.14) orright (mean=0.45, SD=0.14) side.
Finally, the last aspect reviewed before to move to the modeling work is detailed now.
Gaze cascade effect. Shimojo et al. (2003) tested how subjects orient their atten-tion in both preference and non-preference tasks. Their main result is that, in choicesbetween two alternative forced-choice tasks, subjects exhibit a statistically significanttendency to gaze increasingly towards the chosen object. It supports the hypothesis
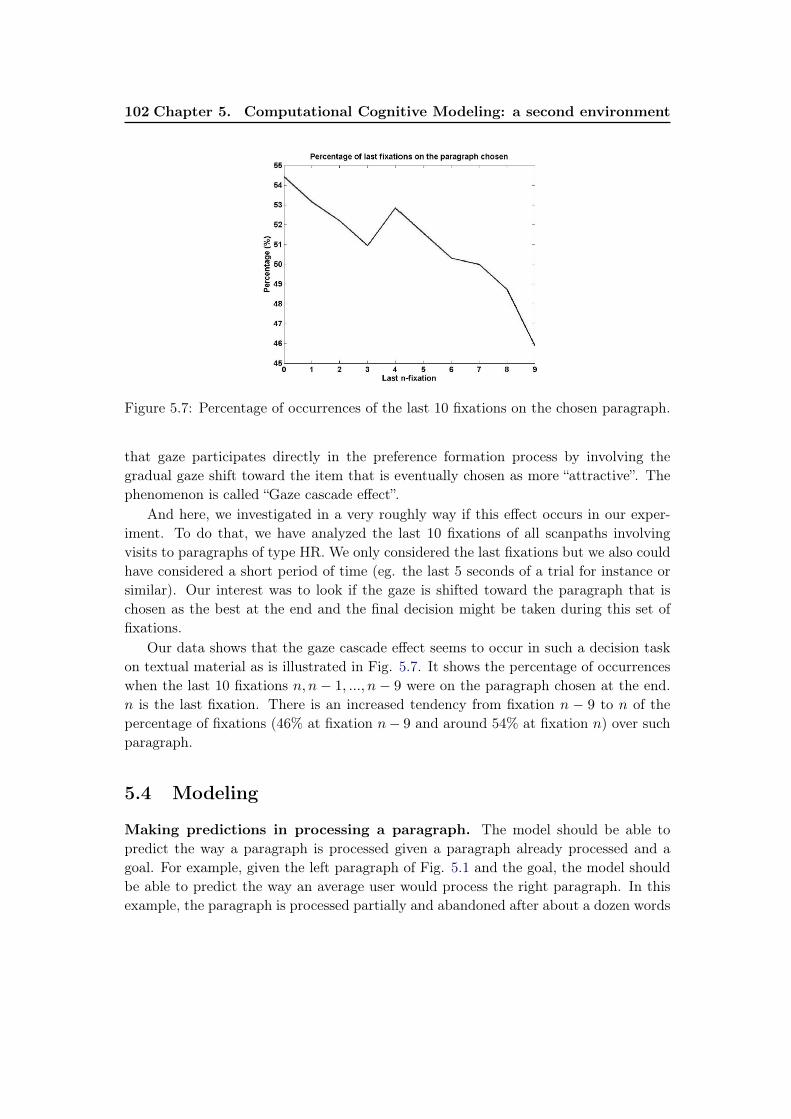
102 Chapter 5. Computational Cognitive Modeling: a second environment
Figure 5.7: Percentage of occurrences of the last 10 fixations on the chosen paragraph.
that gaze participates directly in the preference formation process by involving thegradual gaze shift toward the item that is eventually chosen as more “attractive”. Thephenomenon is called “Gaze cascade effect”.
And here, we investigated in a very roughly way if this effect occurs in our exper-iment. To do that, we have analyzed the last 10 fixations of all scanpaths involvingvisits to paragraphs of type HR. We only considered the last fixations but we also couldhave considered a short period of time (eg. the last 5 seconds of a trial for instance orsimilar). Our interest was to look if the gaze is shifted toward the paragraph that ischosen as the best at the end and the final decision might be taken during this set offixations.
Our data shows that the gaze cascade effect seems to occur in such a decision taskon textual material as is illustrated in Fig. 5.7. It shows the percentage of occurrenceswhen the last 10 fixations n, n − 1, ..., n − 9 were on the paragraph chosen at the end.n is the last fixation. There is an increased tendency from fixation n − 9 to n of thepercentage of fixations (46% at fixation n− 9 and around 54% at fixation n) over suchparagraph.
5.4 Modeling
Making predictions in processing a paragraph. The model should be able topredict the way a paragraph is processed given a paragraph already processed and agoal. For example, given the left paragraph of Fig. 5.1 and the goal, the model shouldbe able to predict the way an average user would process the right paragraph. In thisexample, the paragraph is processed partially and abandoned after about a dozen words

5.4. Modeling 103
have been fixated. Paragraphs can be examined several times by participants during atrial, but we restricted our analysis to first visits of the current paragraph. It is alsoworth noting that the previous paragraph is not necessary on the same stimuli page asthe current paragraph. It could have been seen on the previous stimuli page. That isfor instance the case of the left paragraph of Fig. 5.1 which has been processed withanother paragraph in mind, seen on the previous stimuli page.
Modeling Semantic Judgments. As in the previous modeling work, LSA (Lan-dauer and Dutnais, 1997; Landauer et al., 2007) is also used to dynamically computethe semantic similarities between the goal and each set of words that are supposed tohas been fixated.
Effect of the Prior Paragraph. We suspect that the relatedness of the prior para-graph to the goal may play a role in the way the current paragraph is processed aswe have shown with the basic statistics of the previous section. In order to simplifythe design of the model, we therefore analyzed two extreme cases: the words actuallyprocessed in the prior paragraph are strongly related to the goal (HR) or they are notrelated at all to the goal (UR). We used two thresholds of cosine similarity for that,which were set to 0.05 and 0.25. Paragraphs whose semantic similarity with the goalfalls in between were not considered. The first case is called C|HR (read the Currentknowing that the previous one is Highly Related) and the second one is called C|UR(Current | Previous=Unrelated). We also analyzed cases when no prior paragraph ex-ists, called C|0 (Current | Nothing). The basic statistics already presented show thatin terms of number of fixations, and fixation duration, C|UR=C|0 and both are signif-icantly different from C|HR. It means that reading a paragraph while the other one isnot related to the goal is similar to reading the very first paragraph, without informa-tion about a prior paragraph. Therefore we will only consider the case C|HR in thismodeling work: reading a paragraph with another one in mind which is highly relatedto the goal.
5.4.1 Modeling the Decision
Two variables involved. We investigated which variables could played a role in thedecision to stop reading a paragraph with the task of quickly deciding whether it isbetter related to a given goal than another paragraph processed previously. As it wasmentioned in Chapter 3 (p. 52), the semantic similarity between the words processedin such paragraphs and the goal must be involved in such decision. Then, we suspectedthat the decision is made when the difference between the current (cp) and the previousparagraph (pp) is large enough to know for sure which one is the best. If they are tooclose to each other, no decision can be made and reading is pursued. The association

104 Chapter 5. Computational Cognitive Modeling: a second environment
(a) (b)
Figure 5.8: a) Example of scanpath in the C|HR condition. b) Its Gap evolution.
to the goal g is obviously involved in that perception of a difference between the twoparagraphs. In the Experiment 1, the relatedness with the goal played a role, but herethere are two cosine similarities and it is likely that their difference is important. Forthat reason, we defined a variable called Gap as follows:
Gap = |sim(words processed of pp, g)− sim(words processed of cp, g)| . (5.2)
in which sim is the LSA cosine between the two vectors of words actually processedin paragraphs pp and cp with the goal g. Gap changes constantly while a paragraphis processed. When the two paragraphs are equally similar to the goal, that variableis zero. When one paragraph is much more associated to the goal than the otherone, that variable has a high value. Gap can be easily calculated dynamically, af-ter each word of the current paragraph has been processed. Consider for exampleFig. 5.8a. Suppose that a prior paragraph has already been visited (paragraph andgoal are not shown) and the sequence of words processed so far has led to a sim-ilarity sim1 with the goal “associations humanitaires” of 0.62. In the first two fix-ations on the current paragraph, only the word “collectivités” is supposed to havebeen processed according to our window-based prediction. Therefore in both casesGap = |sim1 − sim(“collectivités”,“associations humanitaires”)| = 0.62 - 0.26 = 0.36.During fixation 3, two extra words were processed leading to a new value of Gap =
|sim1−sim(“collectivités locales sont”,“associations humanitaires”)| = 0.44. In fixation4, Gap = |sim1−sim(“collectivités locales sont encouragées à”, “associations humanitai-res”)| = 0.43. In fixation number 5, Gap = |sim1−sim(“collectivités locales sont encour-agées à coordonner leur ”, “associations humanitaires”)| = 0.40. In fixation 8, the Gap
value dropped to 0.14 because of the word “réfugiés” which makes the LSA vector muchmore similar to the goal vector. Figure 5.8b shows the evolution of the Gap value along

5.4. Modeling 105
(a) (b)
Figure 5.9: a) Empirical “no-abandon” distribution p̂GR(g, r|Ab) and b) “abandon” dis-tribution p̂GR(g, r|Ab) in the Gap×Rank space.
the fixations in the scanpath. This example illustrates that a high value of Gap maynot directly induce the decision, in particular if it appears too early in the scanpath.We assume that the decision also depends on the number of words processed so far inthe current paragraph exactly like in the Experiment 1. The more words processed, thehigher the confidence in the perception of the difference between paragraphs. If onlytwo or three words have been processed, it is less likely that Gap is accurate. Therefore,we assume that there should be a relationship between Gap and the number of wordsprocessed. As in our model for the Experiment I, the variable Rank of fixation was usedas indicator of the number of words processed so far in the paragraph.
Once we have determined the two variables that could played the role in the decisionto stop reading a paragraph, we followed the same approach used on the first modelingwork in order to study how the decision depends on these variables. Two empiricalfixation distributions were computed. Their descriptions are given now.
Abandon and no-abandon distributions. The distribution of the no-abandon casesand the distribution of the abandon cases were computed in order to learn the frontierbetween both cases, but now in the Gap×Rank space of participant data. Each partici-pant fixation was associated to a point in the Gap×Rank space. Rank is also a discretemeasure between 1 and the maximum number of fixations in the data. Gap has beencomputed according to Formula 5.2, taking into account the words already processed ineach paragraph as well as the goal and discretized into one of 100 bins, from 0 to 1. Theno-abandon distribution was computed by simply counting the number of fixations thatdid not lead to an abandon for each cell of the Gap×Rank grid. It concerns all fixationsexcept the last one of each scanpath. The abandon distribution was built from allvery last fixations of all scanpaths, including also the virtual fixations as it was done on

106 Chapter 5. Computational Cognitive Modeling: a second environment
Figure 5.10: Data and fitting of marginal distribution, mean and standard deviationfor the “no-abandon” and “abandon” distributions.
(a) (b)
Figure 5.11: Example of empirical conditional pdf and fit with a gaussian model forRank value at 10 for the a) “no-abandon” and b) “abandon” class.

5.4. Modeling 107
Chapter 4 (p. 63), but here the Gap is considered instead of a Cos value. By using thefrontier curve between these two behaviors (continue or stop reading) it is possible topredict the reader’s behavior depending of the location of any observation (g,r) aboveor under the curve. To find the frontier, the methodology based on a Bayesian classifieris also used and outlined by Equations 3.3, 3.4, 3.5, 3.6, 3.7 and 3.8 (Ch. 3, p. 54).Now by replacing Sim with the corresponding variable Gap of Eq. 5.2 in the Equations3.5, 3.6, 3.7 and 3.8, we have the Bayesian classifier (Eq. 5.3), the two class-conditionalprobabilities density functions (Eqs. 5.4 and 5.5) and the decision rule (Eq. 5.6) asfollows:
P (Ab)× pGR(g, r|Ab)Ab≷Ab
P (Ab)× pGR(g, r|Ab) . (5.3)
pGR(g, r|Ab) = pG|R(g|R = r,Ab)× pR(r|Ab) (5.4)
andpGR(g, r|Ab) = pG|R(g|R = r,Ab)× pR(r|Ab) (5.5)
P (Ab)× pG|R(g|R = r,Ab)× pR(r|Ab)Ab≷Ab
P (Ab)× pG|R(g|R = r,Ab)× pR(r|Ab) (5.6)
Now the statistical parametric approach is explained in order to estimate the densityfunctions and the prior probabilities.
Parametric model for the “no-abandon” distribution. Figure 5.10 (top, left)shows the empirical marginal distribution p̂R(r|Ab). As the Rank increases, the prob-ability of not abandoning the paragraph decreases. This evolution was modeled with asigmoid function:
φ(r) =PRMax × (1 + e−αr0)
1 + eα(r−r0).
As before, there are only two parameters r0 and α to fit because the integral is 1. Withrespect to the probability density function pG|R(.), the natural model (Fig. 5.9a) is aGaussian one whose parameters depend on the Rank value. Figure 5.11a illustrateson a particular Rank the reason why the Gaussian is a good function to model thesedata. The mean µ(r) and the standard deviation σ(r) linearly decrease (Fig. 5.10,left column). Both are modeled by simple linear equations: µ(r) = Mr + N andσ(r) = Or + P . The linear regressions are only performed up to the Rank=40 sincethat p̂R(r > 40|Ab) is close to zero and there is no more enough data. Then we have:
pG|R(g|R = r,Ab) =A(r)√2πσ(r)
e− (g−µ(r))2
2σ(r)2 , pR(r,Ab) = φ(r) .
Due to the Gap value is between 0 and 1, A(r) is a normalization function to ensurethat pG|R(g|R = r,Ab) is a probability density function: A(r) = Fµ,σ(1)−Fµ,σ(0), with

108 Chapter 5. Computational Cognitive Modeling: a second environment
Distribution ParametersNo-abandon r0=12.0, α=0.16, M=-0.007, N=0.46, O=-0.0020, P=0.2479
Abandon r′0=14.0, α′=0.2, p0 = 16.38, s1=0.42, s2=0.59, tmax=0.24, q0=1.91
Table 5.1: Model parameters for both the no-abandon and the abandon distributions.
Fµ,σ(.) being the repartition function of a Gaussian distribution with a mean µ anda standard deviation σ. We then obtained six independent parameters to model thecomplete “no-abandon” joint distribution: offset r0 and slope α for φ(r), the coefficientsM ,N for µ(r) and O,P for σ(r).
Parametric model for the “abandon” distribution. The marginal pdf p̂R(r|Ab)
was modeled with another sigmoid function φ′(r) (Fig. 5.10, top right). But here, it isan increasing function. At Rank 0, there is no abandon and at the maximal Rank value,all scanpaths have shown an abandon. The conditional distribution p̂G|R(g|R = r,Ab) isa Gaussian distribution with a mean µ′(r) and a standard deviation σ′(r). As in the pre-vious case, Fig. 5.11b illustrates how these data are modeling by a Gaussian function.The mean µ′(r) exponentially decreases while the standard deviation σ′(r) exponen-tially increases (Fig. 5.10, right column). Both are modeled by exponential equations:µ′(r) = (s2 − s1)e
−r/p0 + s2 and σ′(r) = tmax(1 − e−r/q0). Equations of the pdf arethe same as the previous case, but with a different set of functions {φ′(r),µ′(r),σ′(r)}which gives us seven parameters (r′0 and α′ for φ′(r); p0, s1 and s2 for µ′(r); tmax andq0 for σ′(r)). The resulting equation for the pdf is:
pG|R(g|R = r,Ab) =A′(r)√2πσ′(r)
e− (g−µ′(r))2
2σ′(r)2 , pR(r,Ab) = φ′(r) .
Table 5.1 summarizes the total number of parameters and their values for bothmodeled distributions: the no-abandon and the abandon.
5.4.2 Model Learning
Once the model was designed, its parameters were learned from two-thirds of the data.The two prior probabilities P (Ab) and P (Ab) were also learned by considering howmuch data were of both distributions as in the Chapter 4. The number of occurrencesof the abandon distribution was divided by the total number of occurrences of both theabandon and the no-abandon distributions, given us P (Ab) = 0.84 and P (Ab) = 0.16 .Then, the total number of learned parameters was 14 (6+7+1). Figure 5.12 shows thetwo posterior probabilities P (Ab|g, r) and P (Ab|g, r) after learning in order to representthe decision frontier between the two classes. As Fig. 5.12 shows, the intersection isoblique. There is dependency between Rank and Gap: at the beginning of processing
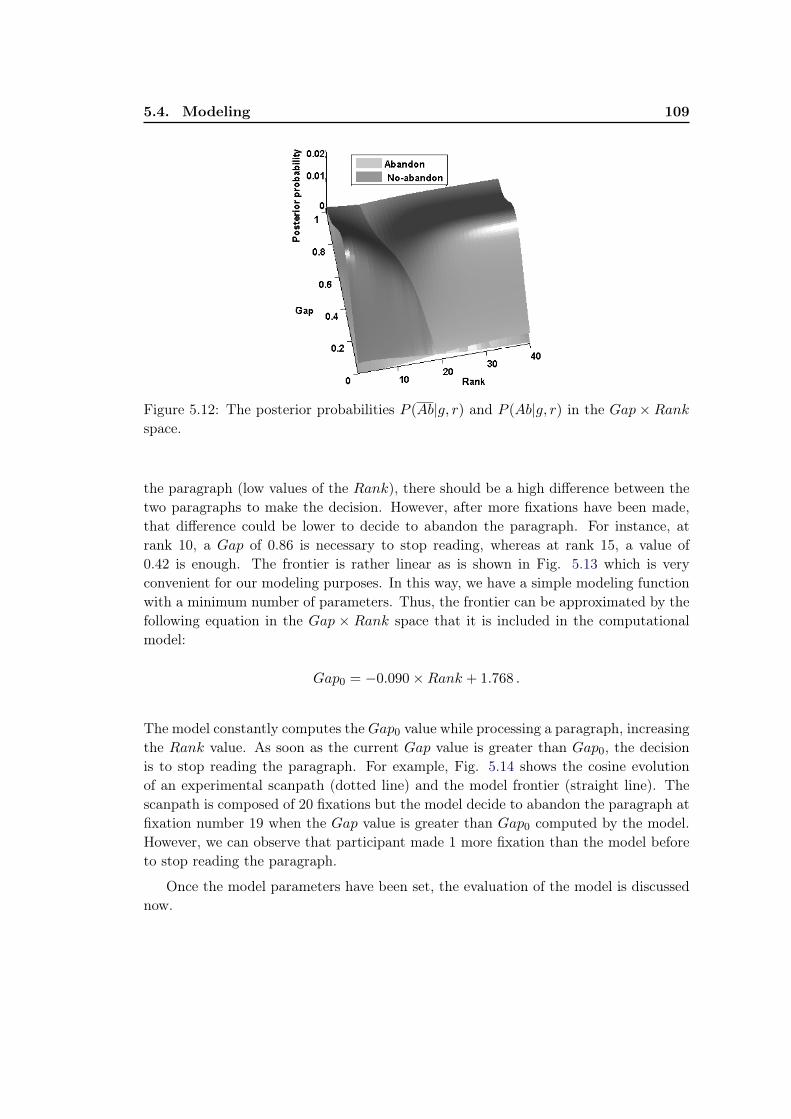
5.4. Modeling 109
Figure 5.12: The posterior probabilities P (Ab|g, r) and P (Ab|g, r) in the Gap × Rank
space.
the paragraph (low values of the Rank), there should be a high difference between thetwo paragraphs to make the decision. However, after more fixations have been made,that difference could be lower to decide to abandon the paragraph. For instance, atrank 10, a Gap of 0.86 is necessary to stop reading, whereas at rank 15, a value of0.42 is enough. The frontier is rather linear as is shown in Fig. 5.13 which is veryconvenient for our modeling purposes. In this way, we have a simple modeling functionwith a minimum number of parameters. Thus, the frontier can be approximated by thefollowing equation in the Gap × Rank space that it is included in the computationalmodel:
Gap0 = −0.090×Rank + 1.768 .
The model constantly computes the Gap0 value while processing a paragraph, increasingthe Rank value. As soon as the current Gap value is greater than Gap0, the decisionis to stop reading the paragraph. For example, Fig. 5.14 shows the cosine evolutionof an experimental scanpath (dotted line) and the model frontier (straight line). Thescanpath is composed of 20 fixations but the model decide to abandon the paragraph atfixation number 19 when the Gap value is greater than Gap0 computed by the model.However, we can observe that participant made 1 more fixation than the model beforeto stop reading the paragraph.
Once the model parameters have been set, the evaluation of the model is discussednow.

110 Chapter 5. Computational Cognitive Modeling: a second environment
Figure 5.13: The Bayesian frontier between both the abandon and the no-abandoncases. Experimental data and its linear approximation are shown.
Figure 5.14: Cosine evolution of an experimental scanpath and the model frontier.

5.4. Modeling 111
Figure 5.15: Distribution of the differences between the number of fixations (ranks)made by the participant and the model.
5.4.3 Model Performance
The model is tested it on the remaining one third of the data. The two cases consideredwere: 1) model stops reading either before or at the same time of participant and 2)model stops reading after the participant.
The average difference between the ranks at which model and participant stoppedreading was computed only for the case number 1 where the model is more reactive thanparticipant. We got a value of 5.17 (SE=0.22). It means that, in the average, the modelstopped reading 5.17 fixations earlier than participants. This was observed in 59% ofthe cases and in 41% of the cases the model stopped reading after the participant. Thissituation can be observed on the distribution of the differences between the number offixations made by the participant and the model as is showed in Fig. 5.15. The plotshows a slightly tendency of the model to stop reading a paragraph either before orat the same time of participant (left side of the plot). A total of 427 scanpaths wereconsidered in the testing set.
For comparison purposes with the random model, the best p value found such asthe random model had the smallest average difference with participant ranks was forp = 0.2. That smallest average difference was of 11.84 (SE=0.73). So, the resultspresented in the current section indicates that our model is about twice (in average)better than the best random model (5.17 fix. vs 11.84 fix.).

112 Chapter 5. Computational Cognitive Modeling: a second environment
5.5 Conclusion
So far, we have presented a computational cognitive model that is able to replicatethe average people’s behavior, when they are faced to a task of quickly deciding if aparagraph presented is more related or not to a given goal than another paragraphprocessed previously. Two variables are involved: the rank of the fixation (Rank) andthe difference of semantic similarity between the two paragraphs with the search goal(Gap). We proposed a simple linear threshold to account for that decision. The resultsare promising but we think that there should be a way to improve them. In the nextchapter, some ideas that could help to improve the results are going to be presented.
Chapter 6
General Discussion
6.1 Discussion
We would like to start our discussion by comparing the different models presented sofar in the previous chapters.
Fig. 6.1 shows the superposition of the different model frontiers in the Cos×Rank
space learned from the Experiment 1. This experiment was concerned with Situation1 (one goal, one paragraph) described in Chapter 3 (p. 39) and whose modeling workwas presented in Chapter 4, where participants were asked to read a paragraph with thetask of quickly deciding if it is related or not to a given goal. The three straight-linescorrespond to the original model frontier without any participant’s delay (“Original”),the model frontier by using the participant’s delays learned from ramp words (“Delay-ramp”) and the model frontier by using the participant’s delays learned with the KLdivergence (“Delay-KL”). As we can notice, the position of the model for the “Original”case is shifted to the right along the x-axis (Rank) compared to the others models whenparticipant’s delay are considered. This situation was expected because the idiosyncrasyof each participant is not considered in the “Original” case. All the extra fixations neededby participants to confirm their decision are taken into account for the modeling work,resulting in a curve shifted to the right because the Rank of abandoning a paragraphis higher.
The straight-lines corresponding to the “Delay-ramp” and “Original” models seem tobe parallel. This is not the case for the ‘Delay-KL” and “Original” models. They have adifferent slope. Here, we can notice that for low values of Cos (y-axis) and high valuesof Rank (x-axis), the “Delay-KL” model appears shifted to the left with respect to the“Original”, but for high values of Cos and low values of Rank, the “Delay-KL” modelappears shifted to the right. This situation could be due to the way that delays werecomputed by using the KL divergence. As we have explained in Chapter 4 (p. 84), thedelays are computed by selecting the distribution of one participant as reference. All theparticipant’s delays are dependent of this reference distribution. When we have a lowKL divergence between the distribution of one participant and the reference distribution,the delay value learned for this particular participant is also low because we do not needto apply a big shift in order to minimize its divergence with respect to the referencedistribution. This also applied in the reverse way when we have a high divergencebetween a participant’s distribution and the reference distribution. From Fig. 6.1, we

114 Chapter 6. General Discussion
Figure 6.1: Different models learned from the Experiment 1 in the Cos×Rank space.
can say that the “Delay-KL” model is shifted to the left of the “Original” for low valuesof Cos and high values of Rank, because we suspected that, there, participant’s delaysapplied were higher and they were lower for high values of Cos and low values of Rank.However, a more detailed investigation could be done. One way to do that could be toanalyse all the participant’s distribution in the Cos × Rank space and compare themto the corresponding participant’s delay. However, we were not interested about that inthe current thesis because we considered that other important aspects about our workshould be also discussed here.
Table 6.1 shows the average difference between the ranks at which model and par-ticipant stopped reading a paragraph for the three versions of the model. The totalnumber of parameters used to fit both posterior probabilities corresponding to the no-abandon (Ab) and the abandon (Ab) distributions and the number of parameters usedto fit the model frontier are also shown. The “Original” model is the worst one, with anerror of 4.7 fixations compared to the human data. There is not a significant differenceof performance between both the “Delay-ramp” and “Delay-KL” models (t-test, p>0.3),but as we have argued before, the case of the model learned by considering the rampword should not be considered as a model improvement. In fact, we have mainly twoarguments about that. Firstly, we remind that a ramp is characterized by two indexes,the beginning of the ramp and the end of the ramp. In our approach, we used the endof the ramp but we could had used the beginning of the ramp or any index in between.There was no any particular reason to select this as the ramp reference. As we canremember, the idea was that we suspected that fixations on special words would trigger

6.1. Discussion 115
Model Diff. in ranks Posterior prob. FrontierOriginal 4.7 (SE=0.72) 6(Ab) + 8(Ab) + 1(prior) = 15 2 (linear)
Delay-ramp 3.0 (SE=0.5) 8(Ab) + 10(Ab) + 1(prior) = 19+delays 2 (linear)Delay-KL 3.05 (SE=0.83) 8(Ab) + 8(Ab) + 1(prior) = 17+delays 2 (linear)
Table 6.1: Average difference between the ranks at which model and participant stoppedreading a paragraph for the three versions of the model of the Experiment 1. Numberof parameters used are also indicated.
Model Diff. in ranks Posterior prob. FrontierOriginal 5.17 (SE=0.22) 6(Ab) + 7(Ab) + 1(prior) = 14 2 (linear)
Table 6.2: Average difference between the ranks at which model and participant stoppedreading a paragraph for the Experiment 2. Number of parameters used are also indi-cated.
the decision to stop reading a paragraph and we proposed three candidates to use asspecial words: step, target and ramp word. In the case of the step and target words,both are well-defined by only one word each but unfortunately in our modeling work,any of them allowed us to have a good result. Secondly, the total number of parametersneeded by the “Delay-ramp” model (19+1=20 parameters) is higher than the corre-sponding to the “Delay-KL” model (17+1=18 parameters). Then, the results got fromthe “Delay-KL” model was the only improvement achieved. In average, the “Original”model decides to stop reading a paragraph 4.7 fixations earlier than participants andthe “Delay-KL” model does it in only 3.05 fixations earlier than participants. However,the “Delay-KL” model (19+1=20 parameters) uses more parameters than the “Original”model (17 parameters).
Fig. 6.2 shows the model frontier learned from the Experiment 2 concerned withSituation 2 (one goal, two paragraphs) described in Chapter 3 (p. 39) and whosemodeling work was presented in Chapter 5, where participants were asked to read aparagraph with the task of quickly deciding whether it is better related to a given goalthan another paragraph processed previously. Table 6.2 shows the average differencebetween the ranks at which model and participant stopped reading the paragraph. Thenumber of parameters used as in the previous case is also indicated.
Making a comparison between the models of the Situation 1 and Situation 2is not straightforward, because the first one occurs in the Cos × Rank space and thesecond in the Gap × Rank space. Even if both variables Cos and Gap range from 0to 1, Cos implies a semantic similarity between the words actually processed in oneparagraph and the search goal and Gap implies a difference of semantic similaritiesbetween words actually processed in two paragraphs with the search goal. Moreover,

116 Chapter 6. General Discussion
Figure 6.2: Model learned for the Experiment 2 in the Gap×Rank space.
during the Experiment 1, people are encouraged only to make a decision about therelatedness of a paragraph with the search goal whereas in the Experiment 2 peopleare encouraged not only to make a decision about the relatedness of a paragraph withthe search goal but also a comparison between two paragraphs in order to choose thebest one. However, we made the comparison of two basic statistics between the twoexperiments: the mean number of fixation and its duration while processing paragraphsof type HR. Results are shown in Fig. 6.3a and 6.3b respectively. For the Experiment 1,we got that people made in average about 17.40 fixations (SE=0.94) in each paragraphand they spent about 3139.8 ms (SE=177.9). For the Experiment 2, people made inaverage 15.38 fixations (SE=1.26) and they spent about 2656.7 ms (SE=251.9). Thevery light difference maybe due to the fact that, during the Experiment 2, people knowthat they need to make a comparison between two paragraphs and this situation mightencourage them to try to do it faster than in the case of the Experiment 1 where only oneparagraph is presented at time. However, there is not a significant difference neitheron the average number of fixations (t-test, p>0.25) nor the mean duration (t-test,p>0.15). Thus, we could say that in average people made the same number of fixationson each paragraph and they spend the same time visiting the paragraphs across bothexperiments.
Now, we are going to discuss about the complexity of the models presented in thecurrent thesis. The aim of the thesis was to build computational cognitive models able toreplicate in average people’s behavior while they are looking for information and not toreproduce their behavior perfectly. For that reason, during the conception of our modelsthe idea was to have a low number of parameters in order to avoid the overfitting andthe noisy data. Overfitting generally occurs when a model is excessively complex, suchas having too many parameters relative to the number of observations. A model whichhas been overfitted will generally have poor predictive performance, as it can exaggerate

6.2. Benefits, limits and drawbacks of our modeling work. 117
(a) Number of fixations (b) Fixations duration
Figure 6.3: a)Mean number of fixations and its overall duration while processing aparagraph HR for both experiments.
minor fluctuations in the data. For example, if the number of parameters is the sameas or greater than the number of observations, a simple model or learning process canperfectly predict the training data simply by memorizing the training data in its entirety,but such a model will typically fail drastically when making predictions about new orunseen data, since the simple model has not learned to generalize at all. Our modelswere built as simple as possible. Even there was not a rigourous work at minimizingthe number of parameters or at reducing the complexity of the fitting functions usedalong the modeling work, we tried to use the minimum number of parameters withsimple equations at two levels. In a first level, this consideration was done at theparametrisation stage for both the no-abandon and the abandon distributions as it wasshowed in Chapter 4 and 5. Some parameters of both distributions were fitted withsimple linear, exponential or logistic equations but all the time, we tried to choose thesimplest as possible. In a second level and once that both distributions were modeled,the model frontier was fitted all the time with simple linear equations. However, a morerigourous work should be done in such direction if we want to evaluate the impact overthe model performance of using different complexity equations with different numberof parameters for fitting the data.
Some of the benefits, limits and drawbacks of the computational cognitive modelsare given now.
6.2 Benefits, limits and drawbacks of our modeling work.
We start by focusing on the benefits of our modeling work. Two different situations ofinformation search have been studied along the current thesis and one model is proposed

118 Chapter 6. General Discussion
for each one. With the two models, we are able to make predictions about the momentat which participants would decide to stop reading a paragraph when they are faced toinformation search tasks like those that were presented here.
However, and as it was expected, our models do not replicate exactly people’s be-havior as ideal models would do. Some of their limitations are discussed now. Weshould remember that the evaluation of our model’s performance was done by followingexperimental scanpaths of testing sets. It was done in that way because our modelsonly decide the time at which participants will stop reading a paragraph but they donot have a mechanism to decide where participants will make new fixations. Then, thefirst limitation and the most important is that given a new paragraph, our model willsuppose that the paragraph is processed in a linear way and this is not exactly the casein an information search task. We did not make a lot of effort in this direction becausewe considered that it was more important to have a functional model able to predict thetime at which participants will stop reading a paragraph. However, different non-linearstrategies of exploring texts, such as skimming as is shown in Carver (1990), have beenmodeled in our team (Lemaire et al., 2011) and could be connected to the model in thefuture.
Our models are completely based on LSA (Landauer et al., 2007) as a model ofsemantic memory. Human judgments of semantic associations are mimicked by LSA.As an automatic tool, LSA has inherent drawbacks due to the method of computingsimilarities as it was explained in Chapter 3 (p. 41). First, although the 300 dimensionalspace is large enough to represent different meanings for polysemous words, it couldbe the case that different meanings are mixed if the context is not rich enough todisambiguate them. A goal composed of 2 to 3 words is not a large enough context toensure that the correct meaning is always selected. A second one could be the fact thatLSA assumes that words and documents form a joint Gaussian model while a Poissondistribution has been observed (Hofmann, 1999). We also want to mention that LSA isnot capable to solve the well-known problem of BOW (bag of words) because a sentenceis represented as an unordered collection of words, disregarding grammar and even wordorder. We can imagine that we extract one sentence of one of our paragraphs used in ourexperiments and we compute its cosine similarity with the corresponding goal. Then,we could reorder all the words and remove some words (prepositions, articles) of thisfirst sentence without preserving any grammar rule. Surely, the new sentence will nothave the same meaning but the computation of its cosine similarity with the goal willbe the same as before. In this case, the LSA method treats both sentences as thesame. This could be also the case when a participant make only a few fixations on aparagraph by picking here and there some words and trying to get a perception aboutthe relatedness of the paragraph with the goal.
In spite of the drawbacks of LSA method, we got good model’s performances buta further investigation should be done in order to know in more details the impact of

6.3. Practical applications. 119
these limits in our modeling work.Another limitation is that in general during the conception of the models, our anal-
ysis was only concerned with paragraphs of type HR and not paragraphs of type MRor UR. This consideration was made only for simplifying purposes because we showedthat deciding that a paragraph is related to the goal (HR) is different from decidingthat it has nothing to do with the goal (UR). In the case of paragraphs MR, thingsare still more complicated due to their neutral relatedness to the search goal. More-over, during the construction of the model for the Experiment 1, a clustering processwas also applied in order to select the material according to its cosine evolution andat the end only the paragraphs clustered as ramp paragraphs were considered for ourmodeling work. Future developments of the current work could be to extend the rangeof paragraphs that our models are able to tackle.
Finally, we would like to present some real applications of the proposed models.
6.3 Practical applications.
Knowing where a user is looking at while searching for information is crucial for eval-uating the usability of Web sites and contribute to the design of Web pages (Baccinoet al., 2005). For that, it is important to have powerful simulation tools (models) to ex-plain and to simulate how the visual exploration is made on Web pages containing bothtexts and images and as a consequence to provide fruitful information to any interfacedesigners (Chanceaux et al., 2009). Web designers are asked to build pages as attrac-tive as possible in order to have the visitor’s attention. This attractiveness could beat the level of the layout interface, the visual information (images) or texts presentedamong others. Our model can be used to perform an automatic selection of severaltextual versions of a content to be presented into a homepage (as in a simplified newsweb portal). In this case, such an automatic tool is used as a virtual participant. Ourmodel could give an answer to the following question: given a text and its correspondingheadline (it can see it as a search goal), how the information should be arranged intothe paragraph? Will the effect to participant’s attention be the same by presenting theinformation related to the headline at the very beginning of the paragraph rather thatat the end or at the medium of the paragraph? Suppose, that we have two differentversions of text concerning the theme “Aide aux réfugiés” as below:
Text 1: “Le HCR prévoit des campagnes d’information de masse dans les campspour sensibiliser au danger des mines. L’état de l’unique route ne peut supporter unafflux simultané de tous les réfugiés.”
Text 2: “L’état de l’unique route ne peut supporter un afflux simultané de tous lesréfugiés. Le HCR prévoit des campagnes d’information de masse dans les camps poursensibiliser au danger des mines.”
The texts are composed of two sentences containing the same words. Sentences have
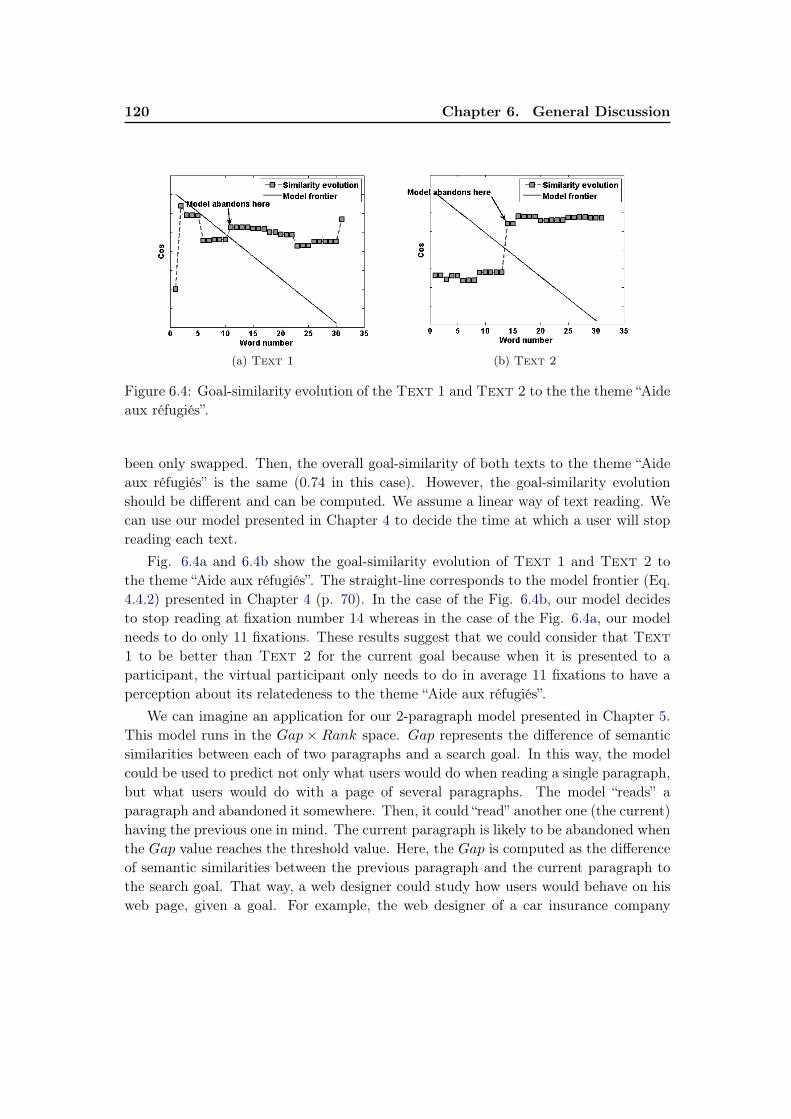
120 Chapter 6. General Discussion
(a) Text 1 (b) Text 2
Figure 6.4: Goal-similarity evolution of the Text 1 and Text 2 to the the theme “Aideaux réfugiés”.
been only swapped. Then, the overall goal-similarity of both texts to the theme “Aideaux réfugiés” is the same (0.74 in this case). However, the goal-similarity evolutionshould be different and can be computed. We assume a linear way of text reading. Wecan use our model presented in Chapter 4 to decide the time at which a user will stopreading each text.
Fig. 6.4a and 6.4b show the goal-similarity evolution of Text 1 and Text 2 tothe theme “Aide aux réfugiés”. The straight-line corresponds to the model frontier (Eq.4.4.2) presented in Chapter 4 (p. 70). In the case of the Fig. 6.4b, our model decidesto stop reading at fixation number 14 whereas in the case of the Fig. 6.4a, our modelneeds to do only 11 fixations. These results suggest that we could consider that Text1 to be better than Text 2 for the current goal because when it is presented to aparticipant, the virtual participant only needs to do in average 11 fixations to have aperception about its relatedeness to the theme “Aide aux réfugiés”.
We can imagine an application for our 2-paragraph model presented in Chapter 5.This model runs in the Gap × Rank space. Gap represents the difference of semanticsimilarities between each of two paragraphs and a search goal. In this way, the modelcould be used to predict not only what users would do when reading a single paragraph,but what users would do with a page of several paragraphs. The model “reads” aparagraph and abandoned it somewhere. Then, it could “read” another one (the current)having the previous one in mind. The current paragraph is likely to be abandoned whenthe Gap value reaches the threshold value. Here, the Gap is computed as the differenceof semantic similarities between the previous paragraph and the current paragraph tothe search goal. That way, a web designer could study how users would behave on hisweb page, given a goal. For example, the web designer of a car insurance company

6.3. Practical applications. 121
home page could test whether it takes a long time or not to users to find a specificinformation, say about baby car seats.


Appendix A
Appendixes
A.1 Experiment 1
A set of 30 themes were created for this experiment. 6 paragraphs (hr1, hr2, mr1,mr2, ur1 and ur2) were considered for the stimuli pages. The description of all theparagraphs is presented later.
A.2 Experiment 2
A subset of 20 themes were considered for this experiment. 7 paragraphs were managedfor the stimuli pages (hr1, hr2, mr1, mr2, ur1, ur2 and ur3). The description of all theparagraphs is also presented below.
A.3 Text of the stimuli pages
Texts of the paragraphs used. For each theme, the 7 paragraphs are listed: the 2paragraphs with strong semantic association to the theme (HR: hr1 and hr2), the 2paragraphs with medium association (MR: mr1 and mr2) and the 3 paragraphs withoutany association to the theme (UR: ur1, ur2 and ur3). The cosine value of the similarityis also indicated (Cos).
Theme Type Cos TextAide aux réfugiés hr1 0.805 "Lorsque la vague des réfugiés déferlait sur le
camp improvisé, les microbus et les tracteurs mo-bilisés par l’organisation macédonienne El Hilalassuraient un mini-pont humanitaire qui permet-tait d’éviter le pire."
Aide aux réfugiés hr2 0.739 "L’état de l’unique route ne peut supporter unafflux simultané de tous les réfugiés. Le HCRprévoit des campagnes d’information de massedans les camps pour sensibiliser au danger desmines."

124 Appendix A. Appendixes
Aide aux réfugiés mr1 0.166 "Le catalogue des principes du retour au calmeà la frontière, établi par les ministres, reprendl’essentiel des cinq conditions posées par lesgouvernements occidentaux pour un arrêt desfrappes."
Aide aux réfugiés mr2 0.176 "Les habitants de Tirana compatissent aux mal-heurs de leurs frères kosovars. Ils se déclar-ent ulcérés par l’enchaînement d’événements qu’ilsressentent comme une profonde injustice et re-prochent à l’UCK d’avoir lancé des opérations ar-mées."
Aide aux réfugiés ur1 -0.011 "Entre le 31 décembre à minuit et jusqu’à la fin dumois de janvier, les clubs de football sont autorisésà renouveler leur effectif."
Aide aux réfugiés ur2 -0.009 "Le chef du gouvernement a estimé que la crois-sance économique de la France était sur la bonnevoie contrairement aux prévisions des experts.La croissance du produit intérieur brut est éton-nante."
Aide aux réfugiés ur3 -0.036 "Les enfants jouent au foot avec des balles de tis-sus noués, nagent dans la rivière, s’entraînent autir à l’arc, loin du regard préoccupé d’un adulte.Ils vont aussi à l’école."
Allocation familiale hr1 .346 "Les familles ayant des jumeaux bénéficient desmêmes prestations familiales que les autres, maisles congés maternité sont plus longs de 18 se-maines."
Allocation familiale hr2 .320 "L’allocation de rentrée scolaire concerne 350 000familles modestes ayant un enfant scolarisé. Cetteprestation pourrait être prochainement étendue."
Allocation familiale mr1 .189 "La moitié des tout-petits sont gardés au foyerpar un parent, la maman dans la quasi-totalitédes cas. Seuls 8
Allocation familiale mr2 .140 "Mme aubry a annoncé que l’objectif nationaldes dépenses d’assurance maladie voté par le par-lement sera dépassé d’environ 2 milliards d’euros."
Allocation familiale ur1 .011 "Le bombardier Spirit que les visiteurs du salondu Bourget ont entraperçu en juin, le temps d’untrès bref passage au-dessus de leurs têtes, est unedrôle de machine volante pour les non initiés."
Allocation familiale ur2 -0.035 "La pianiste américaine Rosalyn Tureck fait sonentrée, à quatre-vingt-quatre ans, dans le réper-toire discographique de Deutsche Grammophon.Son interprétation des variations Goldberg deBach va la faire connaître au grand public."

A.3. Text of the stimuli pages 125
Allocation familiale ur3 -.076 "Banlieue, violence et parfois urgence... Ces motsconstamment accolés réapparaissent en force àchaque fois qu’il est question dans l’actualité dechauffeurs de bus agressés, de véhicules incendiés.
Art contemporain hr1 .507 "On se souvient du fameux symbole du dollar revupar Andy Warhol. Le pop-artiste américain avaitd’un signe simple amalgamé l’art et l’argent pourla plus grande joie de ses collectionneurs."
Art contemporain hr2 .576 "Le musée d’art moderne de la ville de Parisprésente jusqu’au 18 avril soixante-neuf peinturesde Mark Rothko, un des grands classiques dela peinture abstraite de l’après-guerre aux Etats-unis."
Art contemporain mr1 .230 "En raison des travaux entrepris dans l’aile norddu château de Versailles, les salles des croisadeset le circuit du XVIIe siècle, qui font partie dumusée de l’histoire de France, seront fermées."
Art contemporain mr2 .212 "Les galeries d’anatomie comparée et de paléon-tologie du musée national d’histoire naturelle sontde nouveau ouvertes au public depuis le 18 décem-bre, après trois mois de travaux."
Art contemporain ur1 .005 "Un rapport de l’inspection générale des affairessociales a mis le feu aux poudres en dénonçantune série de dysfonctionnements dans la gestiondu comité national contre le tabagisme."
Art contemporain ur2 -.021 "Une information judiciaire pour blessures in-volontaires commises par négligences a été ouverteaprès la chute d’un enfant de six ans, tombé d’unwagon non équipé de fermetures de sécurité dutrain Toulouse-Paris."
Art contemporain ur3 -.015 "Un jeune homme de dix-neuf ans a été mis enexamen pour violence volontaire avec arme pardestination pour avoir lancé son chien sur troisouvriers d’un chantier de Colombes."
Associations humanitaires hr1 0.598 "La détresse et la souffrance des réfugiés large-ment médiatisées, suscitent d’immenses élans degénérosité. Des convois d’aide humanitaire consti-tués par des bénévoles de différentes organisationsconvergent vers les camps de réfugiés."
Associations humanitaires hr2 0.521 "Les collectivités locales sont encouragées à coor-donner leur action en faveur des réfugiés. Elles en-visagent de monter une plate-forme pour assurerla traçabilité de l’acheminement des colis human-itaires."

126 Appendix A. Appendixes
Associations humanitaires mr1 0.185 "Il s’agit de nos citoyens et le devoir de n’importequel gouvernement est de défendre les intérêts deses citoyens. Des mesures sont prises mais égale-ment une coopération avec les organisations inter-nationales."
Associations humanitaires mr2 0.206 "Le problème que devra gérer le gouvernement estde canaliser le retour des sinistrés dans les famillesd’accueil. Le préalable est leur identification carils n’ont plus de pièce d’identité."
Associations humanitaires ur1 -0.028 "La déflagration s’est produite au passage d’unvéhicule militaire sur une route du centre-ville,à une centaine de mètres d’une base de l’arméeturque, selon la police."
Associations humanitaires ur2 -0.001 "La nageuse a décroché sa deuxième médailled’or aux championnats d’Europe de natation enpetit bassin en s’imposant dans son épreuve deprédilection. La Française l’a emporté facilement,reléguant sa grande rivale."
Associations humanitaires ur3 0.087 "Les élections de l’Iowa ont été sans doute les plusdisputées de l’histoire de cet État rural. La partic-ipation à ces assemblées a dépassé tous les espoirsprévus par les politiques."
Chasse aux oiseaux hr1 .425 "Dans le Pas-de-Calais, les chasseurs réclament ledroit de continuer à chasser dans les huttes. LaFrance risque pourtant une lourde amende si ellecontrevient aux directives européennes qui protè-gent les oiseaux migrateurs."
Chasse aux oiseaux hr2 .345 "Plusieurs tribunaux administratifs ont sommé lespréfets de treize départements de prendre des ar-rêtés de fermeture de la chasse aux oiseaux migra-teurs au 31 janvier, réduisant de trois semaines ladurée de la chasse."
Chasse aux oiseaux mr1 .104 "L’ortolan, petit oiseau très prisé par les gourmetsdu Sud-ouest, appartiendra bientôt aux espècesprotégées. Un décret a été signé qui représente lepremier acte d’un compromis global entre écolo-gistes et chasseurs."
Chasse aux oiseaux mr2 .106 "Les petites boules de graisse enrobées de grainesdiverses sont très appréciées des mésanges quiles prennent d’assaut aux premières rigueurs del’hiver."
Chasse aux oiseaux ur1 .023 "Les agences spatiales françaises et japonaises ontdécidé de créer des groupes de travail sur le suivides risques naturels. L’un d’eux sera chargé deréfléchir à une meilleure utilisation des donnéesspatiales."

A.3. Text of the stimuli pages 127
Chasse aux oiseaux ur2 .037 "L’édition d’art offre aux jeunes éditeurs am-bitieux de grandes satisfactions : on peut y avoirle sentiment de faire les livres de A à Z, commeun producteur de Hollywood ses films."
Chasse aux oiseaux ur3 .016 "La place financière parisienne est privée de deuxpiliers majeurs : des fonds de pension qui drain-eraient une épargne investie en actions et des ban-ques importantes ayant un pied aux Etats-unis."
Chef de la Russie hr1 0.730 "A Moscou, les communiqués triomphants se suc-cèdent. Dans le Daghestan, les rebelles sont com-plètement encerclés, leur chef militaire est blessé,les islamistes ont subi de lourdes pertes."
Chef de la Russie hr2 0.464 "Depuis le limogeage surprise du précédent chefdu gouvernement russe après cinq ans de stabil-ité, le président tente sans succès de maîtriser sasuccession. Les prétendants sont nombreux."
Chef de la Russie mr1 0.138 "Ces combats, qui ne remettent pas en cause lasuprématie des talibans sur l’Afghanistan, prou-vent que l’état-major veut et peut maintenir lapression sur ses adversaires."
Chef de la Russie mr2 0.172 "Une bombe de forte puissance a explosé dansle centre de la capitale sur le passage du prési-dent tchétchène. L’attentat n’a pas encore étérevendiqué, indique Moscou."
Chef de la Russie ur1 -0.011 "Il n’est point de bon mercato sans un feuil-leton pour l’animer. Les transferts des deux foot-balleurs n’ont pas électrisé les foules en dehorsdu premier cercle des admirateurs de l’un et del’autre."
Chef de la Russie ur2 0.005 "Le tribunal administratif de Paris a annulé ladécision du Conseil de Paris d’étendre à des com-munes de banlieue le système de vélos en libre-service."
Chef de la Russie ur3 -0.045 "Son arc en bandoulière, le chasseur avancedans la forêt. L’Indien traque un singe ou desoiseaux, proies faciles pour ses flèches couronnéesde plumes rouges et enduites de curare."
Conflit en Irak hr1 0.630 "Les États-Unis ont profité de la commission spé-ciale de l’ONU chargée de désarmer l’Irak pourespionner Bagdad. Les responsables américainsadmettent avoir profité des informations militairespouvant aider à renverser le régime."
Conflit en Irak hr2 0.755 "L’Irak a demandé à l’ONU d’empêcher les sur-vols américains et britanniques et de permettre àses avions civils de transporter des scientifiquesétrangers. L’Irak est soumis à un embargo aériendepuis 1990."

128 Appendix A. Appendixes
Conflit en Irak mr1 0.227 "Comme en écho à cette assurance retrouvéedepuis la fin de la guerre, la commission des af-faires étrangères du Sénat a fixé une date pourle début des auditions et la nomination qui étaitbloquée depuis dix mois."
Conflit en Irak mr2 0.181 "L’arsenal militaire du pays s’est enrichi d’armesà micro-ondes susceptibles de détruire les circuitsinformatiques et les équipements de télécommu-nications. Les militaires veulent les garder pours’en servir contre les infrastructures ennemies."
Conflit en Irak ur1 0.028 "Depuis l’interdiction de fumer, c’est l’affluenced’un dimanche. D’un côté, on fait la queue pouracheter des cigarettes, de l’autre on patiente avecle bordereau des courses hippiques du jour."
Conflit en Irak ur2 -0.026 "L’entraîneur dirige l’équipe féminine seulementcinq ans après avoir été champion du mondecomme coach adjoint des hommes. Il a ses petiteshabitudes. Le rituel commence pendant l’hymnerusse."
Conflit en Irak ur3 -0.053 "Les esquimaux vivent dans les régions polairestrès froides. En été, ils pêchent et ils chassent.Ils habitent dans des tentes faites de peaux dephoque. En hiver, les esquimaux logent dans desmaisons de bois."
Conflit israélo-palestinien hr1 0.044 "L’artillerie israélienne a massivement bombardédes régions supposées être des bastions du Hezbol-lah au Liban. Ces tirs sont une riposte à une séried’attaques meurtrières de la milice intégriste Chi-ite contre Israël."
Conflit israélo-palestinien hr2 0.157 "Proche-orient : le chef du gouvernement a promisde retirer l’armée israélienne du Liban sud dansun délai d’un an. Il envisage de négocier simul-tanément avec la Syrie qui entretient un dispositifmilitaire propice au conflit avec Israël."
Conflit israélo-palestinien mr1 0.058 "Le chef du gouvernement est accusé des rela-tions tendues avec les États-Unis, de l’isolementd’Israël dans le monde, du chômage en montéevertigineuse, et de la détérioration de toutes lesnormes de gouvernement démocratique."
Conflit israélo-palestinien mr2 -0.009 "Pour l’instant, les télécommunications palestini-ennes sous-traitent l’accès à l’international à unecompagnie privée israélienne. Les réseaux sont aupoint et on trouve maintenant des cabines télé-phoniques publiques à carte."

A.3. Text of the stimuli pages 129
Conflit israélo-palestinien ur1 -0.004 "Le juge administratif estime que cette extensiondu système de locations de vélos en libre-serviceconstitue un nouveau marché. Il fournit pour lescommunes un réel service de bicyclettes en libre-service."
Conflit israélo-palestinien ur2 -0.030 "Les laboratoires ont ainsi réalisé qu’au premiercoup dur, leur existence même était menacée. Lesmédicaments nouveaux n’étaient plus assez nom-breux pour compenser la chute de leurs brevetsdans le domaine public."
Conflit israélo-palestinien ur3 0.030 "Ribéry respire la joie de vivre, il ne se pose au-cune question sur sa manière de jouer, il ne peutfaire que du bien. Franck deviendra quelqu’und’important."
Course des voiliers hr1 0.688 "Le monocoque Gartmore du Britannique adémâté dans la troisième étape de l’Around Alone,tour du monde à la voile en solitaire avec escales,entre Auckland et Punta del Este."
Course des voiliers hr2 0.448 "Le navigateur solitaire voulait gagner pourl’honneur. Un choix météo décevant et une grosseavarie dans le Pacifique ont eu raison de seschances. Il a vécu un drôle de tour du monde."
Course des voiliers mr1 0.197 "La formule 1 a réclamé de ses pilotes qu’ils soientles plus rapides à tout moment, la discipline reinedu sport automobile exige parfois de ses conduc-teurs qu’ils rongent leur frein."
Course des voiliers mr2 0.192 "L’équipe cycliste a retrouvé quelques couleurssportives, alors que les noms de ses représentantsfiguraient plus souvent à la rubrique des affaires,au gré des avancées des enquêtes liées au dopage."
Course des voiliers ur1 0.025 "La Chine souhaite généraliser l’usage del’injection mortelle pour les peines capitales audétriment de l’exécution par balle. C’est consid-éré comme plus humain dans toutes les juridic-tions intermédiaires."
Course des voiliers ur2 -0.021 "Le fondateur de la guérilla, en rébellion contreles autorités, ne fait aucune allusion à l’opérationhumanitaire visant à remettre trois otages qui acapoté en début de semaine dernière."
Course des voiliers ur3 0.066 "Le lancement d’Atlantis a été encore reporté enraison de problèmes récurrents de lisibilité du cap-teur. Celui-ci permet de connaître le taux de rem-plissage du réservoir d’hydrogène de la navette."
Croissance de l’économie hr1 0.919 "Le pacte de stabilité et de croissance pose deslimites à l’utilisation du budget pour relancer uneéconomie. Les économistes s’interrogent sur lapérennité de cette croissance qui est étonnante."
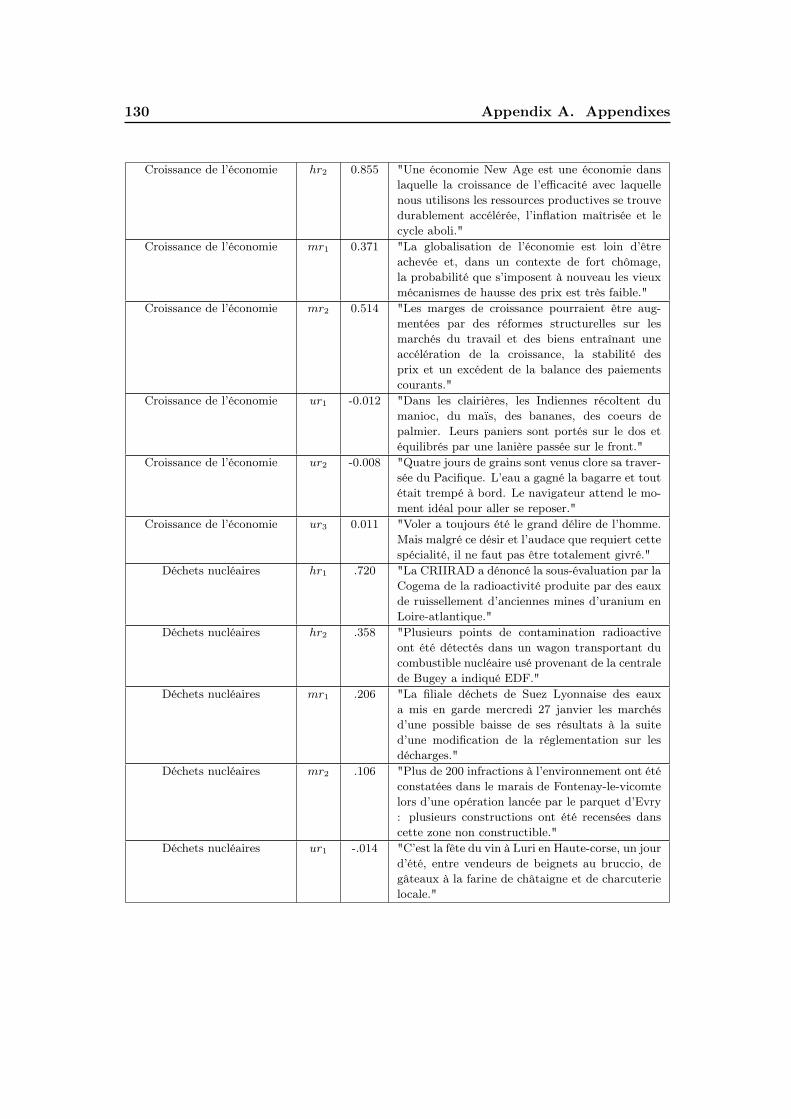
130 Appendix A. Appendixes
Croissance de l’économie hr2 0.855 "Une économie New Age est une économie danslaquelle la croissance de l’efficacité avec laquellenous utilisons les ressources productives se trouvedurablement accélérée, l’inflation maîtrisée et lecycle aboli."
Croissance de l’économie mr1 0.371 "La globalisation de l’économie est loin d’êtreachevée et, dans un contexte de fort chômage,la probabilité que s’imposent à nouveau les vieuxmécanismes de hausse des prix est très faible."
Croissance de l’économie mr2 0.514 "Les marges de croissance pourraient être aug-mentées par des réformes structurelles sur lesmarchés du travail et des biens entraînant uneaccélération de la croissance, la stabilité desprix et un excédent de la balance des paiementscourants."
Croissance de l’économie ur1 -0.012 "Dans les clairières, les Indiennes récoltent dumanioc, du maïs, des bananes, des coeurs depalmier. Leurs paniers sont portés sur le dos etéquilibrés par une lanière passée sur le front."
Croissance de l’économie ur2 -0.008 "Quatre jours de grains sont venus clore sa traver-sée du Pacifique. L’eau a gagné la bagarre et toutétait trempé à bord. Le navigateur attend le mo-ment idéal pour aller se reposer."
Croissance de l’économie ur3 0.011 "Voler a toujours été le grand délire de l’homme.Mais malgré ce désir et l’audace que requiert cettespécialité, il ne faut pas être totalement givré."
Déchets nucléaires hr1 .720 "La CRIIRAD a dénoncé la sous-évaluation par laCogema de la radioactivité produite par des eauxde ruissellement d’anciennes mines d’uranium enLoire-atlantique."
Déchets nucléaires hr2 .358 "Plusieurs points de contamination radioactiveont été détectés dans un wagon transportant ducombustible nucléaire usé provenant de la centralede Bugey a indiqué EDF."
Déchets nucléaires mr1 .206 "La filiale déchets de Suez Lyonnaise des eauxa mis en garde mercredi 27 janvier les marchésd’une possible baisse de ses résultats à la suited’une modification de la réglementation sur lesdécharges."
Déchets nucléaires mr2 .106 "Plus de 200 infractions à l’environnement ont étéconstatées dans le marais de Fontenay-le-vicomtelors d’une opération lancée par le parquet d’Evry: plusieurs constructions ont été recensées danscette zone non constructible."
Déchets nucléaires ur1 -.014 "C’est la fête du vin à Luri en Haute-corse, un jourd’été, entre vendeurs de beignets au bruccio, degâteaux à la farine de châtaigne et de charcuterielocale."

A.3. Text of the stimuli pages 131
Déchets nucléaires ur2 .024 "Ils sont encore six candidats à vouloir ten-ter le tour du monde en ballon sans escale.Cette circumnavigation aérienne réclame autantde courage et d’audace que de moyens et de con-naissances techniques."
Déchets nucléaires ur3 .023 "Le serial killer n’est pas un phénomène récent,mais ce n’est qu’au début des années 80 que la fic-tion policière va largement s’inspirer de ce thème,en littérature et au cinéma."
Décollage de fusée hr1 .342 "Le premier tir de l’année de la fusée Ariane-4depuis le centre spatial guyanais de Kourou a étéun succès : le lanceur européen a mis sur orbiteun satellite de télécommunications."
Décollage de fusée hr2 .300 "La sonde américaine Stardust qui doit ramenersur terre des échantillons de la comète Wild-2 aété lancée de Cap Canaveral en Floride par unefusée Delta-2."
Décollage de fusée mr1 .132 "Un petit bimoteur qui effectuait la liaisonBoston-Chicago a atteri en urgence à Pittsburghhier en raison d’un défaut sur un des moteurs."
Décollage de fusée mr2 .168 "L’espace dans lequel évoluent les satellites autourde notre planète est jonché de milliers de débrisde toutes sortes qui inquiètent les professionnels."
Décollage de fusée ur1 -.008 "Aujourd’hui, les grands noms de la pâtisseriefrançaise sont présents au Japon associés à desnippons. Il y a en outre pléthore d’excellents pe-tits pâtissiers japonais de quartiers."
Décollage de fusée ur2 -.037 "Zinedine Zidane, grand artisan de la victoire dela France, en finale de la coupe du monde contrele Brésil, a été élu champion des champions dumonde."
Décollage de fusée ur3 .021 "La fédération des consommateurs américains ademandé vendredi à Microsoft de rembourser 10milliards de dollars aux consommateurs pour avoirpratiqué des prix trop élevés au cours des troisdernières années."
Délinquance juvénile hr1 .386 "Une quarantaine de véhicules ont été incendiéspar des jeunes mineurs dans les banlieues de Stras-bourg pendant la nuit de la Saint-Sylvestre. Desaffrontements avec les forces de police ont égale-ment eu lieu."
Délinquance juvénile hr2 .318 "Une soixantaine de jeunes de la Courneuve ontincendié des voitures, brisé des vitrines et s’en sontpris aux policiers auxquels ils attribuent la respon-sabilité de la mort d’un des leurs."

132 Appendix A. Appendixes
Délinquance juvénile mr1 .141 "A Odense, au Danemark, chaque policier doitrester au moins un an dans un quartier populairede la ville. Il passe un tiers de son temps à pa-trouiller à pied."
Délinquance juvénile mr2 .147 "La société HLM 3F a organisé une formationde trois jours réservée aux gardiens d’immeubles.L’objectif est de permettre aux personnels de ter-rain de garder la distance nécessaire dans les sit-uations de violence."
Délinquance juvénile ur1 .044 "Après l’Amérique du Sud où il continue de nour-rir les populations, le maïs a conquis le reste dumonde où il est surtout utilisé pour engraisser lestroupeaux."
Délinquance juvénile ur2 .030 "Les grands constructeurs automobiles cherchentà rajeunir leurs effectifs. La moyenne d’âge dessalariés de l’automobile est de trente ans au Japonalors qu’elle atteint quarante-cinq ans chez Re-nault."
Délinquance juvénile ur3 .008 "Chez Vivendi, la direction générale n’impose au-cune norme salariale à ses filiales. Par exemple,dans le pôle Eau, les salaires sont indexés sur lavaleur du point de la fonction publique."
Faiblesse du dollar hr1 0.712 "L’Euro poursuivait sa remontée face au dollar,vendredi dans les premiers échanges entre bourses.Soutenu par les bonnes perspectives de croissanceéconomique et sociale, il atteignait un record his-torique."
Faiblesse du dollar hr2 0.788 "Le Yen faisait toujours preuve de fermeté face aubillet vert. De même, l’Euro a encore gagné duterrain face au billet vert grâce aux perspectivesencourageantes de reprise économique."
Faiblesse du dollar mr1 0.182 "Avec l’aide de leurs rabatteurs déguenillés, ellespesaient l’offre et la demande. Elles savaientprécisément quel jour du mois les entrepriseschercheraient de la monnaie locale pour payerleurs salariés."
Faiblesse du dollar mr2 0.261 "La révision par la Commission des prévisionspour l’année confirme en tout cas qu’il y a bienun problème. Cette année, la croissance de la zoneeuro ne devrait être que légèrement au-dessus de2
Faiblesse du dollar ur1 -0.048 "Le football est un sport collectif qui oppose deuxéquipes de onze joueurs dans un stade, dont lebut est de mettre un ballon sphérique dans le butadverse. Le football est sans doute le sport le plusmédiatisé dans le monde."

A.3. Text of the stimuli pages 133
Faiblesse du dollar ur2 0.007 "Le skippeur rend hommage aux concepteurs. Lepari de la légèreté et de la simplicité était osé. Lesgens qui se sont investis pour que ce projet existepeuvent être fiers."
Faiblesse du dollar ur3 -0.008 "Si la Californie avait appliqué sa politique de ré-duction des émissions de gaz, près de la moitié desvéhicules vendus aux États-Unis auraient pu êtreconcernés à moyen terme."
Formation en informatique hr1 0.719 "La plupart des animateurs-modérateurs ont uneformation de journaliste. Il n’existe pas de for-mation spécifique, mais des écoles de journalismeou de communication qui donnent des cours enmultimédia."
Formation en informatique hr2 0.644 "Une bonne connaissance du fonctionnement del’ordinateur et d’Internet est importante. Des sys-tèmes de formation à distance et de la pédagogiepour adultes en formation continue vont être misen place."
Formation en informatique mr1 0.095 "Bien plus que la connaissance d’une languemorte, l’apprentissage du latin dès le collège estun exercice du raisonnement et d’affirmation ducaractère. Il est un puissant signe de différence etde condition supérieure."
Formation en informatique mr2 0.136 "Le Conseil national des programmes et les obser-vatoires académiques des pratiques pédagogiquesseront chargés de définir les compétences com-munes dispensées au collège. Les enseignantssouhaitent être consultés sur ce programme."
Formation en informatique ur1 -0.056 "Chez les démocrates, les électeurs débattent deleurs choix respectifs et tentent de persuader leursvoisins de se rallier à leur candidat. Côté répub-licain, le scrutin se déroule rapidement aprèsl’ouverture des assemblées."
Formation en informatique ur2 -0.011 "Facile à cultiver, décorative, variée et tellementsavoureuse quand on la cueille à même le pied,la tomate est incontournable au potager. Venued’Amérique centrale, il faut lui fournir un sol richeet une bonne dose de soleil."
Formation en informatique ur3 0.003 "Un domaine de réflexion a été identifié. La réti-cence à commercialiser en ligne est de plus en plusgrande chez certains propriétaires de contenus parcrainte du piratage et du téléchargement illégal."
Grève des cheminots hr1 0.717 "Cette grève et cette manifestation affichaient despositions et des objectifs contradictoires. La di-rection croyait que le mouvement allait pourrir.Elle a eu tort de spéculer sur un recul des salariés."
134 Appendix A. Appendixes
Grève des cheminots hr2 0.539 "Les transports connaissaient toujoursd’importantes perturbations au quatrièmejour d’une grève lancée par les syndicats pourprotester contre le projet de réduction du tempsde travail présenté par la direction. "
Grève des cheminots mr1 0.281 "La direction de l’entreprise confirme l’existencedu document incriminé jugeant que l’initiatived’un collaborateur externe au processus de re-crutement est inadmissible. Elle ne cautionne ab-solument pas cette action."
Grève des cheminots mr2 0.258 "Le malaise des personnels porte également surune réforme de leur statut. Ils ont été avertis parla direction de la teneur de cette réforme justeavant la réunion du comité qui devait procéder àson examen."
Grève des cheminots ur1 0.029 "La Commission européenne annonce qu’elle ferades propositions pour encourager un marché com-mun du secteur de la musique, des films et des jeuxsur internet. La situation doit être maitrisée."
Grève des cheminots ur2 0.015 "Le 3e ligne du XV d’Angleterre aux 85 sélec-tions a annoncé sa retraite internationale dans lescolonnes du tabloïd. Une retraite bien méritéeavec une vie bien menée."
Grève des cheminots ur3 0.010 "Pour cette grande fresque historique, les scénar-istes ont choisi de mêler étroitement l’histoire duchâteau et celle du monarque. Celui-ci avait conçuVersailles comme l’instrument de son pouvoir ab-solu."
Hausse de la bourse hr1 0.878 "La bourse de Tokyo a clôturé la séance de mardien légère hausse, soutenue par les achats des in-vestisseurs étrangers. L’indice Nikkei affichait ungain important à la clôture."
Hausse de la bourse hr2 0.795 "L’indice vedette de la Bourse de Londres a clô-turé mardi, en hausse. Il était encouragé parles diverses annonces de sociétés et nourri par lesspéculations de rapprochements industriels."
Hausse de la bourse mr1 0.141 "Cette annonce, qui avait déjà été pronostiquéepar certains analystes la semaine dernière, a étéfraîchement accueillie. Cette diminution ne faitque poursuivre une tendance à la baisse du titre."
Hausse de la bourse mr2 0.243 "Cette réaction conduit industriels et milieux fi-nanciers à la prudence. D’autant que le championdes OGM a vu son chiffre d’affaire baisser. Lesvaleurs de biotechnologie ont perdu de leur at-trait."
A.3. Text of the stimuli pages 135
Hausse de la bourse ur1 0.065 "Il faut distinguer culture et civilisation. La cul-ture est l’ensemble des croyances, des valeurs pro-pres à une communauté particulière. La civilisa-tion, c’est ce qui est transmis d’une communautéà une autre."
Hausse de la bourse ur2 0.214 "Le football américain est un sport collectif connupour mélanger des stratégies complexes et un jeuphysique intense. Le but du jeu est de marquerdes points en portant un ballon ovale jusqu’à unezone de but nommée end."
Hausse de la bourse ur3 -0.034 "Les moines franciscains, qui ne vivent pas cloîtrésmais partagent un bâtiment moderne, ont décidéde se retrouver sur la place. Ils protestent con-tre les conditions de détention au centre de réten-tion."
Observation des planètes hr1 0.585 "L’étude de la dynamique des anneaux qui en-tourent toutes les planètes géantes en orbite au-tour du Soleil aide les astronomes à comprendrele processus de formation des lunes du systèmesolaire."
Observation des planètes hr2 0.616 "L’étude du système solaire est difficile. Ecar-tons d’emblée les quatre planètes géantes qui con-tiennent de la glace dans leur noyau et de l’eaudans leur atmosphère pour nous concentrer surles planètes dites telluriques."
Observation des planètes mr1 0.138 "Il y a une multitude de variantes qui vont del’impossibilité pour la sonde de pointer son an-tenne vers nous, à un basculement de l’engin quiaurait été déséquilibré par un accident de terrain."
Observation des planètes mr2 0.214 "Une équipe d’un laboratoire japonais a mis aupoint un logiciel de traitement d’images capablede deviner la présence de mines à partir de pho-tographies aériennes et d’un dispositif de filtrage."
Observation des planètes ur1 -0.006 "La plainte avait été déposée par l’entreprise etportait sur le mobilier urbain et le service de loca-tion de vélos en libre service. Le groupe américaina déposé un recours."
Observation des planètes ur2 -0.104 "Laure Manaudou a remporté la médaille d’argentsur 200 m nage libre aux championnats d’Europede natation en petit bassin. Le titre est cependantrevenu à la suédoise."
Observation des planètes ur3 0.068 "Le retour à la vraie vie peut s’avérer douloureuxpour ceux qui n’ont pas économisé les dollars pourgarnir le matelas qui atténuerait leur atterrissage.C’est le cas de ce basketteur célèbre."
136 Appendix A. Appendixes
Plantation des fleurs hr1 .374 "Il aura suffi que le soleil montre le bout de sonnez pour que les jardineries soient prises d’assaut.On dépense de plus en plus pour la plantation defleurs dans son jardin."
Plantation des fleurs hr2 .302 "Pour obtenir de belles roses, le jardinier planteles rosiers dès l’automne de façon à ce que leursracines aient le temps de s’ancrer dans un sol en-core chaud."
Plantation des fleurs mr1 .173 "Il pleut sur la Haute-Saône, il fait froid, les jourssont encore courts. A part quelques forsythiashéroïques, les arbustes sont nus : le printempsrase les murs."
Plantation des fleurs mr2 .190 "C’est aux modistes parisiennes que le printempsfait ses premières confidences. Il leur offre ses pre-miers bouquets, ses pailles, ses rubans, ses petitscanotiers car il ne saurait y avoir de printempssans canotier."
Plantation des fleurs ur1 -.035 "Une inquiétude particulière pointe quant à laresponsabilité pénale des chefs d’établissementmise en jeu lors d’accidents survenus à caused’équipements défectueux, alors que l’entretien enincombe aux collectivités locales."
Plantation des fleurs ur2 -.069 "Trois jours après le tir du missile indien Agni-2, lePakistan a répliqé en tirant une version amélioréede son missile balistique de moyenne portée, leGhauri, depuis le centre d’essai de Jhelum."
Plantation des fleurs ur3 .058 "Le médecin en chef du service de santé des ar-mées est rentré, il y a quelques semaines, de TerreAdélie où il a passé plus d’un an en tant que di-recteur et responsable médical."
Prix du pétrole hr1 0.587 "L’économie algérienne dépend de l’évolution descours du pétrole brut. Après être tombés à desniveaux jamais observés, l’annonce par les paysproducteurs d’une réduction de la production aredressé les prix."
Prix du pétrole hr2 0.598 "Le ministre irakien du pétrole a accusé dimanchel’Arabie saoudite d’avoir inondé le marché du pét-role. Il a réclamé une réduction de la productionsaoudienne pour que les prix remontent."
Prix du pétrole mr1 0.145 "L’idée est de pousser les compagnies pétrolièresà réorienter leurs investissements vers la zone lamoins chère de production. Dans cette région, lecoût d’exploitation des gisements est très oscil-lant."

A.3. Text of the stimuli pages 137
Prix du pétrole mr2 0.194 "Outre la pollution de surface, se pose aussi leproblème des tonnes de pétrole encore contenuesdans les soutes du navire. Les sondages effectuésindiquent que les morceaux du bateau sont stabil-isés."
Prix du pétrole ur1 -0.001 "Comment la France pourra-t-elle se passer dela cigarette ? L’interdiction de fumer dansles lieux publics est largement perçue par lapresse étrangère comme une atteinte à la culturefrançaise."
Prix du pétrole ur2 0.037 "La Californie a officiellement déposé plainte con-tre le gouvernement des États-Unis pour avoir em-pêché l’application de sa loi de réduction des émis-sions de gaz à effet de serre des automobiles."
Prix du pétrole ur3 -0.035 "Le vieux moine est allé lui-même faire de nou-veaux clichés sur place pour les publier quelquesheures plus tard sur le site Internet de la commu-nauté. Ceux-ci ont eu un succès immédiat."
Prix littéraire hr1 .321 "L’écrivain Amélie Nothomb présidera le jury duLivre Inter. Les auditeurs qui souhaitent par-ticiper au jury sont invités à écrire à la stationen exposant leurs goûts littéraires."
Prix littéraire hr2 .593 "Destiné à récompenser une oeuvre de fiction in-édite en prose, écrite par un auteur de moins devingt-cinq ans, le quinzième prix du jeune écrivaina été décerné à Bernard Magnan."
Prix littéraire mr1 .112 "Le jeu favori des biographes de Conrad, le célèbreécrivain anglais, consiste à mesurer l’écart entreles événements de sa vie réelle et les romans qu’ilen a tirés."
Prix littéraire mr2 .109 "Le 6e festival de Gérardmer, consacré au genrefantastique, présente une quinzaine de longs mé-trages inédits. En ouverture, hors compétition,Psycho, de Gus van Sant, revisite le classiqued’Hitchcock."
Prix littéraire ur1 -.009 "Toutes hélices dehors, bigarré comme aucunavion occidental n’oserait plus l’être aujourd’hui,le cargo militaire Antonov est la vedette du salondu Bourget. Il se veut le concurrent de l’HerculesC-130J américain."
Prix littéraire ur2 .009 "La voiture de la présidente de la cour d’assisesde Haute-Corse a été incendiée dans la nuit desamedi à dimanche, à Bastia. Selon les enquê-teurs, il s’agirait d’un acte criminel."
Prix littéraire ur3 .022 "La crue du Gapeau, déclenchée par vingt-quatreheures de fortes pluies, a inondé trois centsmaisons à Hyères et près de deux cents person-nes ont dû être mises en sécurité."
138 Appendix A. Appendixes
Réchauffement climatique hr1 0.579 "L’impact du tourisme sur l’évolution du cli-mat pourrait plus que doubler dans les trenteprochaines années en raison de l’effet de serre pro-duit par les rejets massifs de carbone associés auxactivités touristiques."
Réchauffement climatique hr2 0.830 "Quand nous brûlons des combustibles fossiles,nous émettons des gaz à effet de serre dansl’atmosphère, ce qui a pour conséquence de laréchauffer et de contribuer à la fonte des glaciers."
Réchauffement climatique mr1 0.125 "Les pluies intenses ont duré plusieurs heures,causant l’interruption de la circulation et isolantun certain nombre de régions. Le bureau prévoitune augmentation de ces dérèglements climatiquesau niveau de la planète."
Réchauffement climatique mr2 0.104 "Un groupe d’ingénieurs météorologistes a obtenule prix Nobel pour ses travaux relatifs à la prévi-sion des évènements climatiques à long terme etaux effets de la pollution de l’atmosphère."
Réchauffement climatique ur1 0.013 "Dans le jugement, cité par La Nacion, les jugesmettent en avant plusieurs arguments de forme,arguant que le type de procédure lancé par le jugeCerda serait inapproprié."
Réchauffement climatique ur2 -0.001 "La Russie a menacé de sortir du traité surles forces nucléaires car elle est courroucée parl’attitude des autres pays vis-à-vis de sa politiquede défense nationale."
Réchauffement climatique ur3 -0.039 "Une famille s’approche lentement du juge. Lepère tient sa petite fille dans les bras. La mèrepose son sac sur le bureau et cherche ses justifi-catifs."
Réforme de l’enseignement hr1 0.455 "La critique s’est exprimée plus radicalement surla nature et l’idéologie du projet éducatif. Dansce débat, déclenché en dehors des organisationssyndicales, les enseignants s’en prennent aux ori-entations fondamentales."
Réforme de l’enseignement hr2 0.597 "Malgré un accord de principe sur la nécessitéd’une réforme comprenant une aide individualiséeaux élèves, le syndicat des enseignants affirmaitqu’il fallait abandonner ce projet et retravaillersur d’autres bases."
Réforme de l’enseignement mr1 0.296 "Afin d’apprendre une langue étrangère le min-istère entend embaucher des locuteurs natifs pourfaire pratiquer l’oral aux élèves. Cette politiqueest généralisée pour les enseignements communs,les options obligatoires et facultatives."

A.3. Text of the stimuli pages 139
Réforme de l’enseignement mr2 0.147 "Après avoir rappelé que les gouvernements suc-cessifs et le corps enseignant ont su répondre audéfi démographique, le ministre a rappelé quel’effort devait à présent garantir la qualité pourtous."
Réforme de l’enseignement ur1 -0.023 "Cette saison, Tony Parker n’a plus confiancesur le terrain. Il y a des périodes pendant lesmatches où il comprend qu’il ne peut pas totale-ment dominer."
Réforme de l’enseignement ur2 -0.045 "Les labels alertent le public avec le même refrain: les plates-formes de téléchargement illégalestuent l’industrie musicale. Pendant ce temps, lesmarchands de disques ont le moral en berne."
Réforme de l’enseignement ur3 0.054 "Le volume de fusions-acquisitions dans le mondea atteint un record historique. Ce résultat aété obtenu malgré un fléchissement au secondsemestre, lié aux inquiétudes sur le marché ducrédit."
Réforme de la justice hr1 0.757 "Le président de l’APM a vilipendé la réforme dela ministre de la justice, mais il a surtout mené lacharge contre les élus, accusés de dresser le procèsde la magistrature."
Réforme de la justice hr2 0.402 "Mentir sous serment, c’est une insulte à la lib-erté. Faire obstruction à la justice, c’est bafouer laloi. Il y a des gens en prison pour de tels crimes."
Réforme de la justice mr1 0.106 "Bien que les preuves de la discrimination àl’embauche soient souvent difficiles à établir de-vant les juges, quelques affaires ont pu aboutir àconfondre des employeurs et ont entraîné des con-damnations."
Réforme de la justice mr2 0.133 "Le Code de procédure pénale réaffirme leprincipe de la publicité des débats. Il indique queles débats sont publics, à moins que la publiciténe soit dangereuse pour l’ordre."
Réforme de la justice ur1 -0.079 "La science n’apporte pas seulement des bienfaits,mais a apporté des armes de destruction massiveet des possibilités de manipulation biologique. Latechnique et l’économie concourent à la dégrada-tion de la biosphère."
Réforme de la justice ur2 -0.002 "Le chanteur Yannick Noah, ici en concert, arepris sa place à la tete du classement des person-nalités préférées des Français et devance ZinédineZidane."
Réforme de la justice ur3 -0.019 "L’industrie musicale a enregistré un nouveauplongeon des ventes d’albums. Les ventes totalesont baissé fortement et il a fallu attendre pour voirdécoller la meilleure vente de l’année."
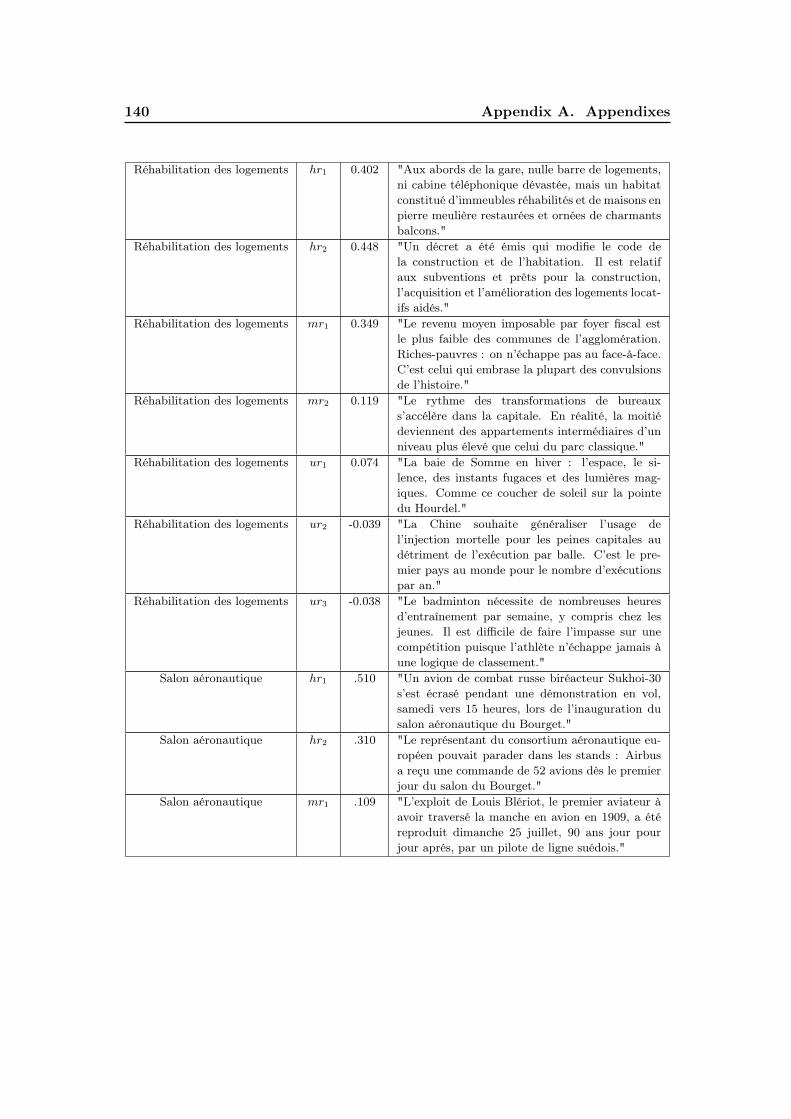
140 Appendix A. Appendixes
Réhabilitation des logements hr1 0.402 "Aux abords de la gare, nulle barre de logements,ni cabine téléphonique dévastée, mais un habitatconstitué d’immeubles réhabilités et de maisons enpierre meulière restaurées et ornées de charmantsbalcons."
Réhabilitation des logements hr2 0.448 "Un décret a été émis qui modifie le code dela construction et de l’habitation. Il est relatifaux subventions et prêts pour la construction,l’acquisition et l’amélioration des logements locat-ifs aidés."
Réhabilitation des logements mr1 0.349 "Le revenu moyen imposable par foyer fiscal estle plus faible des communes de l’agglomération.Riches-pauvres : on n’échappe pas au face-à-face.C’est celui qui embrase la plupart des convulsionsde l’histoire."
Réhabilitation des logements mr2 0.119 "Le rythme des transformations de bureauxs’accélère dans la capitale. En réalité, la moitiédeviennent des appartements intermédiaires d’unniveau plus élevé que celui du parc classique."
Réhabilitation des logements ur1 0.074 "La baie de Somme en hiver : l’espace, le si-lence, des instants fugaces et des lumières mag-iques. Comme ce coucher de soleil sur la pointedu Hourdel."
Réhabilitation des logements ur2 -0.039 "La Chine souhaite généraliser l’usage del’injection mortelle pour les peines capitales audétriment de l’exécution par balle. C’est le pre-mier pays au monde pour le nombre d’exécutionspar an."
Réhabilitation des logements ur3 -0.038 "Le badminton nécessite de nombreuses heuresd’entraînement par semaine, y compris chez lesjeunes. Il est difficile de faire l’impasse sur unecompétition puisque l’athlète n’échappe jamais àune logique de classement."
Salon aéronautique hr1 .510 "Un avion de combat russe biréacteur Sukhoi-30s’est écrasé pendant une démonstration en vol,samedi vers 15 heures, lors de l’inauguration dusalon aéronautique du Bourget."
Salon aéronautique hr2 .310 "Le représentant du consortium aéronautique eu-ropéen pouvait parader dans les stands : Airbusa reçu une commande de 52 avions dès le premierjour du salon du Bourget."
Salon aéronautique mr1 .109 "L’exploit de Louis Blériot, le premier aviateur àavoir traversé la manche en avion en 1909, a étéreproduit dimanche 25 juillet, 90 ans jour pourjour aprés, par un pilote de ligne suédois."

A.3. Text of the stimuli pages 141
Salon aéronautique mr2 .178 "Un miraculé de l’aviation : un jeune passagerclandestin a fait le trajet Dakar-Lyon, mardidernier, dans le train d’atterrissage d’un AirbusA300.
Salon aéronautique ur1 .012 "Qui sont ces étudiants qui n’ont pas les moyensde s’offrir un repas à 3 euros ? Principalementdes étudiants étrangers qui n’ont pas de boursesd’études, résume l’assistante sociale du Crous.
Salon aéronautique ur2 -.002 "La neige fait défaut dans les Hautes-Alpes. Cinqcents travailleurs saisonniers privés d’emploi ontmanifesté dans les rues de Gap pour exiger desexploitants de remontées mécaniques des indem-nisations."
Salon aéronautique ur3 -.046 "Une gardienne de prison a été condamnée à sixmois de prison avec sursis par la cour d’appel deLyon. Il lui était reproché d’avoir offert un télé-phone portable à une détenue."
Syndicat agricole hr1 .723 "Un millier d’agriculteurs ont paralysé le centred’Auch pour exprimer leur inquiétude sur la ré-forme de la politique agricole commune, à l’appelde la Fédération Départementale des Syndicatsd’Exploitants Agricoles."
Syndicat agricole hr2 .564 "Les producteurs de fruits et légumes, surtoutaffiliés à la puissante Fédération Nationale desSyndicats d’Exploitants Agricoles, ont les grandessurfaces dans leur ligne de mire."
Syndicat agricole mr1 .146 "L’indivision est un fléau en Corse, surtout dansl’intérieur des terres. Elle empêche les jeunesagriculteurs de s’installer, faute de savoir à quiracheter la terre."
Syndicat agricole mr2 .223 "Les syndicats qui avaient lancé l’ordre de grèveréclamaient une amélioration de l’aménagementdu temps de travail, ainsi que l’embauche detrente personnes supplémentaires."
Syndicat agricole ur1 .003 "Le moral des boursiers s’est sérieusement dé-gradé : ils doutent désormais que les nouvellesmarges de fluctuation de la devise brésilienne,fixées mercredi par la banque centrale, puissenttenir longtemps."
Syndicat agricole ur2 .027 "En Inde, l’épais brouillard, qui recouvre le norddu pays depuis plusieurs jours et qui s’ajoute à unevague de froid dans l’état du Rajasthan, paralyseles transports aériens."
Syndicat agricole ur3 -.029 "Le gouvernement chypriote a émis l’espoir quesa décision de renoncer à déployer dans le sud del’île des missiles sol-air russes facilitera l’adhésionde Chypre à l’union européenne."

142 Appendix A. Appendixes
Tourisme en montagne hr1 0.422 "Les via ferrata et les sports d’eau vive connais-sent un succès constant. Les candidats au vertigese comptent par milliers sur la cinquantaine deparcours de via ferrata ancrés en pleine falaise."
Tourisme en montagne hr2 0.382 "Toute la magie des hauts plateaux basaltiquesavec la neige en plus. Au programme : randonnéeen raquettes avec guide, ski de fond et relaxationdans les eaux chaudes thermales de la montagne."
Tourisme en montagne mr1 0.226 "Pour les vacanciers qui souhaitent avant tout sereposer dans un cadre bucolique, les résidencesproposent un hébergement adapté leur permet-tant de partir avec des amis sportifs sans pourautant rester inactifs."
Tourisme en montagne mr2 0.212 "Une semaine à Santorin, l’une des plus belles et,assurément, en raison de son caractère volcanique,la plus spectaculaire des îles grecques est proposéepar l’agence de voyage."
Tourisme en montagne ur1 0.031 "Des trafiquants de cocaïne colombiens ont étésabordés par un sous-marin au large de la côtePacifique. C’est la deuxième fois que les forcescolombiennes arrêtent un engin afin d’en détruirela cargaison illicite."
Tourisme en montagne ur2 -0.027 "Il faut profiter de la crise générale que traverse legouvernement et de la fatigue de certaines unitésmilitaires. Le guérillero juge nécessaire de menerdes actions armées sur les routes."
Tourisme en montagne ur3 0.012 "Le chef des Forces armées révolutionnaires deColombie demande à ses troupes de commencerà préparer les conditions d’une offensive généralecontre le Président Uribe."
Tribunal international hr1 0.798 "Les États-Unis et de nombreuses ONG prépar-ent juridiquement une mise en accusation, pourcrimes contre l’humanité devant le Tribunal pé-nal international, des dirigeants civils, militaireset paramilitaires de Belgrade."
Tribunal international hr2 0.797 "Nos gouvernements coopéreront avec le Tri-bunal pénal international pour l’ex-Yougoslavie enl’aidant à enquêter sur les responsables, jusqu’auxplus hauts niveaux, de crimes de guerre et decrimes contre l’humanité."
Tribunal international mr1 0.136 "Principal accusé du volet corruption et escro-querie, un ancien cadre d’une grande entrepriseest poursuivi pour avoir perçu des millions d’eurosen commissions occultes auprès d’une dizained’entrepreneurs."

A.3. Text of the stimuli pages 143
Tribunal international mr2 0.183 "Un couple de quinquagénaires mosellans serajugé mardi en correctionnel pour détention et us-age personnel de stupéfiants. Ils arrosaient leurspots de cannabis sur le rebord de leur fenêtre."
Tribunal international ur1 0.038 "Aucune preuve scientifique ne permet au-jourd’hui de démontrer que l’utilisation des télé-phones mobiles présente un risque notable pourla santé. Le communiqué du ministère ne laisseplace à aucun doute."
Tribunal international ur2 0.053 "La Patagonie chilienne est mal connue. Coincéeentre la cordillère des Andes et l’océan Pacifique,elle séduit les amateurs de grands espaces, de soli-tude et de paysages grandioses."
Tribunal international ur3 -5.337 "Partir pour la gagne et se retrouver en panne en-tre deux éléphants de mer, ça laisse des souvenirs.Un tour du monde à la voile reste une sacrée aven-ture."
Victoire des footballeurs hr1 0.512 "Dans ce contexte relevé, les joueurs marseillaisvoulaient surtout satisfaire leur public. Avec cettefinale gagnée, l’équipe phocéenne a particulière-ment réussi son retour parmi l’élite du footballprofessionnel."
Victoire des footballeurs hr2 0.490 "L’équipe de France de football a vaincul’Australie en finale de la Coupe du Monde.L’entraineur est très satisfait de son équipe et en-visage les rencontres futures avec enthousiasme etsérénité."
Victoire des footballeurs mr1 0.228 "Il a inventé une forme de tennis qui lui con-vient parfaitement et le rend toujours dangereux.Avec cette façon d’engager des revers, sa raquetteréalise des coups souvent surprenants."
Victoire des footballeurs mr2 0.259 "Il semble que, à l’instar des Anglais, les Galloissoient parvenus à assimiler les éléments qui ontpermis à l’hémisphère Sud de dominer le rugbymondial depuis quelques années."
Victoire des footballeurs ur1 0.032 "Des livres de mémoires d’anciens déportés, ilen paraît régulièrement. De qualité inégale etd’intérêt inégal mais ce n’est jamais la même his-toire car le ressenti est à chaque fois unique."
Victoire des footballeurs ur2 0.093 "Le candidat conservateur a bénéficié du sou-tien du fort contingent d’évangélistes et de re-ligieux conservateurs qui habitent cet État sou-vent critiqué pour son manque de représentativitéà l’échelon national."
Victoire des footballeurs ur3 -0.057 "Les rebelles ivoiriens toujours maîtres de lamoitié nord du pays même s’ils participent au gou-vernement ont reconnu que des troubles avaient eulieu à Bouaké."

144 Appendix A. Appendixes

Bibliography
Anderson, J. R., Bothell, D., Byrne, M. D., Douglass, S., Lebiere, C., and Qin, Y.(2004). An integrated theory of the mind. Psychol Rev, 111(4):1036–1060. (Cited onpage 3.)
Baccino, T., Bellino, C., and Colombi, T. (2005). Mesure de l’utilisabilité des interfaces.Hermès Science Publisher: Paris. (Cited on page 119.)
Brainard, D. H. (1997). The psychophysics toolbox. Spatial Vision, 10:433–436. (Citedon pages 48, 59 and 95.)
Browne, G. J., Pitts, M. G., and Wetherbe, J. C. (2005). Stopping rule use during web-based search. In 38th Hawaii International Conference on System Sciences (HICSS-382005), CD-ROM / Abstracts Proceedings, 3-6 January 2005, Big Island, HI, USA.IEEE Computer Society. (Cited on page 31.)
Browne, G. J., Pitts, M. G., and Wetherbe, J. C. (2007). Cognitive stopping rules forterminating information search in online tasks. MIS Q., 31(1):89–104. (Cited onpages 30, 31 and 32.)
Campbell, D. J. (1988). Task complexity: A review and analysis. The Academy ofManagement Review, 13(1):40–52. (Cited on page 32.)
Carver, R. (1990). Reading rate: a review of research and theory. Academic Press.(Cited on pages 7, 8, 26, 98 and 118.)
Chanceaux, M. (2009). Modélisation cognitive computationnelle de trajets oculomoteurslors d’une tâche de recherche d’information. PhD thesis, Laboratoire TIMC-IMAG,équipe AMA. Université de Grenoble. (Cited on pages 28 and 29.)
Chanceaux, M., Guérin-Dugué, A., Lemaire, B., and Baccino, T. (2009). A model tosimulate web users’ eye movements. In Gross, T., Gulliksen, J., Kotzé, P., Oestreicher,L., Palanque, P., Prates, R., and Winckler, M., editors, Proceedings of the 12th IN-TERACT Conference, volume 5726 of LNCS, pages 288–300. Springer Verlag. (Citedon pages 92 and 119.)
Cole, M. J., Gwizdka, J., Liu, C., Bierig, R., Belkin, N. J., and Zhang, X. (2011). Taskand user effects on reading patterns in information search. Interacting with Comput-ers. Cognitive Ergonomics for Situated Human-Automation Collaboration, 23(4):346–362. (Cited on page 26.)

146 Bibliography
Engbert, R., Longtin, A., and Kliegl, R. (2002). A dynamical model of saccade gen-eration in reading based on spatially distributed lexical processing. Vision research,42(5):621–636. (Cited on page 18.)
Engbert, R., Nuthmann, A., Richter, E., and Kliegl, R. (2005). Swift: A dynamicalmodel of saccade generation during reading. Psychological Review, 112(4):777–813.(Cited on pages 16, 18 and 20.)
Farid, M. and Grainger, J. (1996). How initial fixation position influences word recog-nition: A comparison of french and arabic. Brain & Language, 53(3):351–368. (Citedon page 51.)
Griffiths, T. L., Kemp, C., and Tenenbaum, J. B. (2008). Bayesian models of cognition.In Sun, R., editor, Cambridge handbook of computational cognitive modeling, pages59–100. Cambridge University Press, Cambridge. (Cited on page 53.)
Griffiths, T. L. and Steyvers, M. (2002). A probabilistic approach to semantic repre-sentation. (Cited on page 37.)
Hofmann, T. (1999). Probabilistic Latent Semantic Analysis. In Proceedings of Uncer-tainty in Artificial Intelligence, UAI, Stockholm. (Cited on page 118.)
Itti, L. and Koch, C. (2000). A saliency-based search mechanism for overt and covertshifts of visual attention. Vision Research, 40:1489–1506. (Cited on page 28.)
Kieras, D. and Meyer, D. (1997). An overview of the epic architecture for cognition andperformance with application to human-computer interaction. (Cited on page 3.)
Kleiner, M., Brainard, D., and Pelli, D. (2007). What’s new in psychtoolbox-3? In Per-ception 36 ECVP Abstract Supplement. Perception 36 ECVP Abstract Supplement.(Cited on pages 48, 59 and 95.)
Kohsom, C. and Gobet, F. (1997). Adding spaces to thai and english: Effects on reading.In Proceedings of the Cognitive Science Society, volume 19, pages 388–393. CognitiveScience Society. (Cited on page 15.)
Landauer, T., McNamara, D., Dennis, S., and Kintsch, W. (2007). Handbook of LatentSemantic Analysis. Lawrence Erlbaum Associates. (Cited on pages 29, 37, 41, 47,52, 61, 103, 118, 151 and 152.)
Landauer, T. K. and Dutnais, S. T. (1997). A solution to plato‘s problem: The latentsemantic analysis theory of acquisition, induction, and representation of knowledge.Psychological review, 104:211–240. (Cited on pages 52, 61 and 103.)
Bibliography 147
Lee, M. D. and Corlett, E. Y. (2003). Sequential sampling models of human textclassification. Cognitive Science, 27(2):159 – 193. (Cited on pages 33, 34, 35, 36, 37and 57.)
Lemaire, B., Guérin-Dugué, A., Baccino, T., Chanceaux, M., and Pasqualotti, L. (2011).A cognitive computational model of eye movements investigating visual strategies ontextual material. In Carlson, L., Hölscher, C., and Shipley, T., editors, Proceedingsof the Annual Meeting of the Cognitive Science Society, pages 1146–1151. CognitiveScience Society. (Cited on pages 8, 26, 27 and 118.)
Lewis, D. D. (1997). Reuters-21578 text categorization test collection. (Cited onpage 34.)
Lund, K. and Burgess, C. (1996). Producing high-dimensional semantic spaces fromlexical co-occurrence. Behavior Research Methods, Instruments, and Computers,28(2):203–208. (Cited on page 37.)
Martin, D. I. and Berry, M. W. (2007). Mathematical Foundations Behind LatentSemantic Analysis. In Landauer, T. K., McNamara, D. S., Dennis, S., and Kintsch,W., editors, Handbook of Latent Semantic Analysis, chapter 2. Lawrence ErlbaumAssociates. (Cited on page 42.)
Matin, E. (1974). Saccadic suppression: a review and an analysis. Psychol Bull,81(12):899–917. (Cited on page 9.)
Newell, A. (1990). Unified theories of cognition. Harvard University Press, Cambridge,MA, USA. (Cited on pages 2 and 3.)
Nickles, K. (1995). Judgment-based and Reasoning-based Stopping Rules in DecisionMaking Under Uncertainty. University of Minnesota. (Cited on page 31.)
Nuthmann, A., Engbert, R., and Kliegl, R. (2007). The IOVP effect in mindless reading:experiment and modeling. Vision Res, 47(7):990–1002. (Cited on pages 11 and 12.)
Pelli, D. G. (1997). The videotoolbox software for visual psychophysics: Transformingnumbers into movies. Spatial Vision, 10:437–442. (Cited on pages 48, 59 and 95.)
Pollatsek, A., Raney, G. E., LaGasse, L., and Rayner, K. (1993). The use of informationbelow fixation in reading and in visual search. Canadian Journal of ExperimentalPsychology, 47:179–200. (Cited on page 13.)
Rayner, K. (1975). The perceptual span and peripheral cues in reading. CognitivePsychology, 7(1):65–81. (Cited on page 14.)

148 Bibliography
Rayner, K. (1978). Eye movement latencies for parafoveally presented words. Bulletin ofthe Psychonomic Society, 11(1eye movement latencies, parafoveally presented words;right handed adults):13–16+. (Cited on page 9.)
Rayner, K. (1979). Eye guidance in reading: Fixation locations in words. Perception,8:21–30. (Cited on pages 14 and 15.)
Rayner, K. (1998). Eye movements in reading and information processing: 20 years ofresearch. Psychological Bulletin, 124(3):372–422. (Cited on pages 9, 10, 13, 15, 24and 51.)
Rayner, K. (2009). Eye movements and attention in reading, scene perception, andvisual search. The Quarterly Journal of Experimental Psychology, 62(8):1457–1506.(Cited on pages 9 and 15.)
Rayner, K. and Fischer, M. H. (1996). Mindless reading revisited: eye movements duringreading and scanning are different. Perception and Psychophysics, 58(5global/localeye movements; task, word frequency; reading/scanning/visual search tasks):734–747+. (Cited on page 11.)
Rayner, K. and Pollatsek, A. (1981). Eye movement control during reading: Evidencefor direct control. Quarterly Journal of Experimental Psychology, 33A:351–373. (Citedon page 14.)
Rayner, K. and Pollatsek, A. (1989). The psychology of reading. Englewood Cliffs NJ:Prentice-Hall. (Cited on page 10.)
Rayner, K., Pollatsek, A., Drieghe, D., Slattery, T. J., and Reichle, E. D. (2006). Track-ing the mind during reading via eye movements: Comments on kliegl, nuthmann, andengbert (2006). Journal of Experimental Psychology: General, 136:520–529. (Citedon page 14.)
Rayner, K., Sereno, S. C., and Raney, G. E. (1996). Eye movement control in reading:comparison of two types of models. Journal of Experimental Psychology: HumanPerception and Performance, 22:1188–1200. (Cited on page 15.)
Rayner, K., Slowiaczek, M. L., Clifton, C., and Bertera, J. H. (1983). Latency ofsequential eye movements: implications for reading. Journal of Experimental Psy-chology: Human Perception and Performance, 9(6latency of saccadic eye movements,reading):912–922+. (Cited on page 9.)
Rayner, K., Well, A. D., and Pollatsek, A. (1980). Asymmetry of the effective visualfield in reading. Perception and Psychophysics, 27:537–544+. (Cited on page 13.)
Bibliography 149
Rayner, K., Well, A. D., Pollatsek, A., and Bertera, J. H. (1982). The availability ofuseful information to the right of fixation in reading. Perception and Psychophysics,31(6):537–550+. (Cited on page 13.)
Reichle, E., Pollatsek, A., Fisher, D., and Rayner, K. (1998). Toward a model ofeye movement control in reading. Psychological Review, 105(1):125–157. (Cited onpages 16 and 17.)
Reichle, E. D., Pollatsek, A., and Rayner, K. (2006). E-z reader: A cognitive-control,serial-attention model of eye-movement behavior during reading. Cognitive SystemsResearch, 7(1):4–22. (Cited on pages 16 and 17.)
Reichle, E. D., Rayner, K., and Pollatsek, A. (2003). The e-z reader model of eyemovement control in reading: Comparisons to other models. Behavioral and BrainSciences, 26(4):445–526. (Cited on pages 16 and 17.)
Reichle, E. D., Rayner, K., and Pollatsek, A. (2012). Eye movements in reading versusnonreading tasks: Using e-z reader to understand the role of word/stimulus familiar-ity. Visual Cognition, 20(4-5):360–390. (Cited on pages 18, 21 and 22.)
Reilly, R. G. and Radach, R. (2006). Some empirical tests of an interactive activationmodel of eye movement control in reading. Cognitive Systems Research, 7(1):34–55.(Cited on page 16.)
Rissanen, J. (1978). Modeling by shortest data description. Automatica, 14(5):465–471.(Cited on page 3.)
Sartre, J. (1984). Existentialism and Human Emotions. New York: Carol PublishingGroup. (Cited on page 29.)
Sereno, S. and Rayner, K. (2003). Measuring word recognition in reading: Eye move-ments and event-related potentials. Trends in Cogntive Sciences, 7(11):489–493.(Cited on pages 7, 10 and 11.)
Shimojo, S., Simion, C., Shimojo, E., and Scheier, C. (2003). Gaze bias both reflectsand influences preference. Nat Neurosci, 6(12):1317–1322. (Cited on page 101.)
Simola, J., Salojärvi, J., and Kojoc, I. (2008). Using hidden markov model to uncoverprocessing states from eye movements in information search tasks. Cognitive SystemsResearch, 9(4):237–251. (Cited on pages 8, 23, 24, 25 and 26.)
Simon, H. A. (1996). The sciences of the artificial (3rd ed.). MIT Press, Cambridge,MA, USA. (Cited on page 30.)
150 Bibliography
Sun, R. (2008). Introduction to computational cognitive modeling., chapter 1, pages3–19. New York : Cambridge University Press. (Cited on pages 1 and 2.)
Sun, R., Coward, L. A., and Zenzen, M. J. (2005). On levels of cognitive modeling.Philosophical Psychology, 18:613–637. (Cited on page 2.)
Underwood, N. and McConkie, G. (1983). Perceptual Span for Letter Distinctions Dur-ing Reading. Technical report (University of Illinois at Urbana-Champaign. Centerfor the Study of Reading). University of Illinois at Urbana-Champaign. (Cited onpage 13.)
Zandt, T., Colonius, H., and Proctor, R. (2000). A comparison of two response timemodels applied to perceptual matching. Psychonomic Bulletin & Review, 7:208–256.(Cited on page 35.)

Résumé: Cette thèse en informatique présente un travail de modélisation cognitivecomputationnelle, à partir de données de mouvements oculaires lors de tâches de recherched’information dans des textes. Nous nous intéressons à cette situation quotidienne derecherche d’informations dans un journal ou une page web, dans laquelle il faut juger siun texte est sémantiquement relié ou non à un but, exprimé par quelques mots. Parceque le temps est souvent une contrainte, les textes ne sont souvent pas entièrement lusavant qu’intervienne la décision. Plus précisément, nous avons analysé les mouvementsdes yeux dans deux tâches de recherche d’information consistant à lire un paragrapheet à décider rapidement i) s’il est associé à un but donné et ii) s’il est plus associé àun but donné qu’un autre paragraphe traité auparavant. Un modèle est proposé pourchacune de ces situations. Nos simulations sont réalisées au niveau des fixations et dessaccades oculaires.
En particulier, nous prédisons le moment auquel les participants décident d’abandonnerla lecture du paragraphe parce qu’ils ont suffisamment d’information pour prendre leurdécision. Les modèles font ces prédictions par rapport aux mots qui sont susceptiblesd’être traités avant que le paragraphe soit abandonné. Les jugements d’association sé-mantiques humains sont reproduits par le calcul des similarités sémantiques entre motsproduits par l’analyse de la sémantique latente (LSA) (Landauer et al., 2007). Nousavons suivi une approche statistique paramétrique dans la construction de nos modèles.Ils sont basés sur un classifieur bayésien.
Nous proposons un seuil linéaire bi-dimensionnel pour rendre compte de la décisiond’arrêter de lire un paragraphe, utilisant le Rang de la fixation et i) la similarité sé-mantique (Cos) entre le paragraphe et le but ainsi que ii) la différence de similaritésémantique (Gap) entre chaque paragraphe et le but. Pour chacun des modèles, lesperformances montrent que nous sommes capables de reproduire en moyenne le com-portement des participants face aux tâches de recherche d’information étudiées durantcette thèse.
Cette thèse comprend deux parties principales : 1) la conception et la passationd’expériences psychophysiques pour acquérir des données de mouvements oculaires et2) le développement et le test de modèles cognitifs computationnels.
Mots clés: modélisation cognitive computationnelle, recherche d’information, mou-vements des yeux.
Abstract: This computer science thesis presents a computational cognitive model-ing work using eye movements of people faced to different information search tasks ontextual material. We studied situations of everyday life when people are seeking infor-mation on a newspaper or a web page. People should judge whether a piece of text issemantically related or not to a goal expressed by a few words. Because quite often timeis a constraint, texts may not be entirely processed before the decision occurs. Morespecifically, we analyzed eye movements during two information search tasks: readinga paragraph with the task of quickly deciding i) if it is related or not to a given goaland ii) whether it is better related to a given goal than another paragraph processedpreviously. One model is proposed for each of these situations. Our simulations aredone at the level of eye fixations and saccades.
In particular, we predicted the time at which participants would decide to stopreading a paragraph because they have enough information to make their decision. Themodels make predictions at the level of words that are likely to be fixated before aparagraph is abandoned. Human semantic judgments are mimicked by computing thesemantic similarities between sets of words using Latent Semantic Analysis (LSA) (Lan-dauer et al., 2007). We followed a statistical parametric approach in the constructionof our models. The models are based on a Bayesian classifier.
We proposed a two-variable linear threshold to account for the decision to stopreading a paragraph, based on the Rank of the fixation and i) the semantic similarity(Cos) between the paragraph and the goal and ii) the difference of semantic similar-ities (Gap) between each paragraph and the goal. For both models, the performanceresults showed that we are able to replicate in average people’s behavior faced to theinformation search tasks studied along the thesis.
The thesis includes two main parts: 1) designing and carrying out psychophysicalexperiments in order to acquire eye movement data and 2) developing and testing thecomputational cognitive models.
Keywords: computational cognitive modeling, information search, eye movements.