Embed Size (px)
Citation preview
Atmos. Chem. Phys., 9, 685–706, 2009www.atmos-chem-phys.net/9/685/2009/© Author(s) 2009. This work is distributed underthe Creative Commons Attribution 3.0 License.
AtmosphericChemistry
and Physics
Modelling of cirrus clouds – Part 1a: Model descriptionand validation
P. Spichtinger1 and K. M. Gierens2
1Institute for Atmospheric and Climate Science, ETH Zurich, 8092 Zurich, Switzerland2Deutsches Zentrum fur Luft- und Raumfahrt, Institut fur Physik der Atmosphare, Oberpfaffenhofen, Germany
Received: 16 November 2007 – Published in Atmos. Chem. Phys. Discuss.: 11 January 2008Revised: 23 October 2008 – Accepted: 1 December 2008 – Published: 28 January 2009
Abstract. A double-moment bulk microphysics scheme formodelling cirrus clouds including explicit impact of aerosolson different types of nucleation mechanism is described. Pro-cess rates are formulated in terms of generalised moments ofthe underlying a priori size distributions in order to allowsimple switching between various distribution types. Thescheme has been implemented into a simple box model andinto the anelastic non-hydrostatic model EULAG. The newmicrophysics is validated against simulations with detailedmicrophysics for idealised process studies and for a well doc-umented case of arctic cirrostratus. Additionally, the forma-tion of ice crystals with realistic background aerosol concen-tration is modelled and the effect of ambient pressure on ho-mogeneous nucleation is investigated in the box model.
The model stands all tests and is thus suitable for cloud-resolving simulations of cirrus clouds.
1 Introduction
The role of clouds is crucial for our understanding of the cur-rent and the changing climate (IPCC, 2007). Cirrus cloudsmodulate the Earth’s radiation budget significantly. It is as-sumed that (thin) cirrus clouds contribute to a net warmingof the Earth-Atmosphere system (e.g.Chen et al., 2000), butthe magnitude of this warming has not been quantified yet.Recently, the impact of thin cirrus clouds in the mid latitudeswas estimated in idealised framework using vertical profilesfrom radiosondes (Fusina et al., 2007), but the global effect isstill uncertain. The formation and evolution of cirrus cloudsdepends in a complex way on a variety of environmental con-ditions (temperature, relative humidity, wind fields) as wellas on the impact of background aerosol acting as ice nuclei.
Correspondence to:P. Spichtinger([email protected])
The interaction of various processes and their non-linear de-pendence on ambient conditions renders the understandingof cirrus clouds in general a difficult task.
Cirrus clouds (except anvils) are closely related totheir formation regions, so-called ice-supersaturated regions(ISSRs, see e.g.Gierens et al., 1999). These are large, ini-tially cloud free airmasses in the upper troposphere (andsometimes lowermost stratosphere) in the status of supersat-uration with respect to (wrt) ice. These regions are quitefrequent in the tropopause region (see e.g.Spichtinger etal., 2003a,b; Gettelman et al., 2006). From former inves-tigations (Spichtinger et al., 2005a) it turns out that cirrusclouds often are embedded in horizontally extended ISSRs;ISSRs and their embedded clouds form a system. Large-scale dynamical processes like synoptic upward motions,but also mesoscale waves and small scale turbulence playcrucial roles for the formation and evolution of the systemISSR/cirrus (Spichtinger et al., 2005a,b). Local dynamicsand microphysics are acting on the cloud and sub cloud-scale. From this point of view there is need of a cloud resolv-ing model which can be used for idealised studies of cirrusclouds interacting with various scales of dynamics.
While from theory and measurements it is quite under-stood that in cloud free air masses the relative humidity wrtice can reach very high values up to the freezing thresh-olds for homogeneous freezing (i.e. 140–170% RHi, depend-ing on temperature, seeKoop et al., 2000), substantial andpersistent supersaturation inside cirrus clouds is more dif-ficult to understand. Ice crystals act as a strong sink forwater vapour. Thus, one expects that RHi-distributions in-side cirrus are centred around saturation, as some measure-ments indicate (Ovarlez et al., 2002; Spichtinger et al., 2004).However, there are also many measurements from inside cir-rus clouds that indicate considerable degrees of supersatu-ration (seeComstock et al., 2004; Lee et al., 2004; Ovarlezet al., 2002; Kramer et al., 2008; Peter et al., 2008, and M.Kramer, personal communication). These findings seem to
Published by Copernicus Publications on behalf of the European Geosciences Union.

686 P. Spichtinger and K. Gierens: Modelling cirrus clouds – Part 1a
be contrary to our current understanding of microphysics in-side cirrus clouds (Peter et al., 2006) and call for an explana-tion. One possible explanation will be given in the presentpaper. Another pending question is the impact of differ-ent nucleation mechanisms on the formation and evolutionof cirrus clouds. While it is generally assumed that homo-geneous nucleation is the dominant formation process forcold (T<−38◦C) cirrus clouds (e.g.Sassen and Dodd, 1988;Heymsfield and Sabin, 1989; Haag et al., 2003b), there areindications that heterogeneous nucleation can substantiallymodify the conditions for homogeneous nucleation bringingforth large change in resulting cloud properties. Thereforea model for studying the competition of different nucleationprocesses would be useful.
Cirrus clouds have been modelled on all scales: thereare large scale models for climate research and numericalweather prediction (Karcher et al., 2006; Liu et al., 2007;Tompkins et al., 2007) and mesoscale models (Harrington etal, 1995; Reisner et al., 1998; Phillips et al., 2003; Seifert andBeheng, 2005). For detailed process studies, cloud resolv-ing models (Starr and Cox, 1985; Jensen et al., 1994; Lin etal., 2005; Karcher, 2005) and box models (Sassen and Dodd,1989; Lin et al., 2002; Gierens, 2003; Haag and Karcher,2004; Hoyle et al., 2005; Bunz et al., 2008) were used. Manybox models and cloud resolving models have very detailedmicrophysics schemes which require high spatial and tem-poral resolution. Large scale and mesoscale models oftenuse bulk microphysics schemes.
We have developed a new ice microphysics scheme for theuse in box models and cloud resolving models, based on ear-lier work (Gierens, 2003). A novel feature of the model is theuse of arbitrary many classes of ice, discriminated by theirformation mechanism. The corresponding aerosol types thatare involved in the formation of the various ice classes aretreated as well. This new concept allows us to investigate theimpact of different nucleation processes in the same airmass,in particular how air pollution (heterogeneous nucleation) af-fects the cloud evolution. Another novel feature is the formu-lation of the various process rates in terms of moments of theunderlying crystal size distribution. This makes it possible tothe choose between various distribution types.
The structure of this article is as follows: in the next sec-tion we will describe the basic dynamical models, i.e. thebox model and the anelastic, non-hydrostatic model EULAGvery briefly. In Sect.3 the new microphysics scheme is de-scribed in detail. In Sect.4 the validation of the model usingbox model simulations and 1-D simulations is shown, and themodel’s performance is discussed. We end with a summaryand draw conclusions in Sect.5.
2 Model description – dynamics
The new microphysics scheme is implemented into two dif-ferent types of models: First, we implemented the ice micro-
physics into a simple box model for validating the nucleationparameterisation and for fast calculations serving a principalunderstanding of the interaction of different processes. Thebox model can also be coupled to trajectories, e.g. to the out-put of a trajectory model (in our case LAGRANTO,Wernliand Davies, 1997). In a second step we implemented thetested microphysics into the anelastic, non-hydrostatic modelEULAG (Smolarkiewicz and Margolin, 1997). The twofoldapproach was not only for testing the model but also to havetwo different tools which can be used for different applica-tions, which have exactly the same ice microphysics param-eterisations.
In the following we describe first the more complex dy-namics of the EULAG model and the coupling of the dy-namics to the microphysics.
Then, we describe the box model which was developedtogether with the microphysics in the spirit of the EULAGmodel, i.e. using background states (e.g. for potential tem-perature) as well. This choice was made to make the “transi-tion” between the two models as smooth as possible.
2.1 EULAG model – dynamics
As a basic dynamical model we use the anelastic non-hydrostatic model EULAG (see e.g.Smolarkiewicz and Mar-golin, 1997). The anelastic equations for the dry dynam-ics can be written in perturbation form as follows (cf.Smo-larkiewicz et al., 2001; Grabowski and Smolarkiewicz, 2002)
DuDt
= −∇
(p′
ρ
)+ g
(θ ′
θ
)− f × u′
+ M (1)
Dθ ′
Dt= −u · ∇θe (2)
Here,u is the velocity vector;p, ρ andθ denote pressure,density and potential temperature, respectively;g and f de-note gravity and “Coriolis” vectors, respectively;θ and ρare the anelastic reference state profiles for potential tem-perature and density;M denotes additional appropriate met-ric terms, depending on the coordinate system chosen. Thesubscripte refers to the environmental profiles, which mustnot necessarily be equal to the reference states. Primes de-note deviations from the environmental state (e.g.θ ′
=θ−θe).DDt
: =∂/∂t + u · ∇ denotes the total derivative. The per-turbation pressurep′ is calculated using the mass continuityconstraint∇ · ρu=0.
For solving the governing equations we use the uni-fied semi-Lagrangian-Eulerian approach described inSmo-larkiewicz and Margolin(1997); Smolarkiewicz et al.(2001):Let9 andF denote the vectors of variables (θ ′, u, v,w) andtheir forcings, respectively. With9 : =9n + 0.51tFn andthe generalised transport operatorLE the approximation canbe described as
9n+1i = LEi
(9
)+ 0.51tFn+1
i (3)
Atmos. Chem. Phys., 9, 685–706, 2009 www.atmos-chem-phys.net/9/685/2009/
P. Spichtinger and K. Gierens: Modelling cirrus clouds – Part 1a 687
wherebyi and n denote the spatial and temporal location, re-spectively. This results into a trapezoidal rule for the approx-imations. This treatment and the non-oscillatory forward-in-time (NFT) semi-Lagrangian/Eulerian approximations ofthe integrals were carried out as described in detail inSmo-larkiewicz and Margolin(1997) and Smolarkiewicz et al.(2001). The model was used for many applications on dif-ferent scales and several problems in atmospheric dynam-ics (e.g. stratified flow over mountains, convectively inducedgravity waves etc.). One main advantage of this model isthe less diffusive advection scheme MPDATA (Multidimen-sional Positive Definite Advection Transport Algorithm, seee.g.Smolarkiewicz and Margolin, 1998).
For including cloud physics into the model, we have toperform “moist” dynamics and a coupling of dynamics andthermodynamics. This can be done as follows (see alsoGrabowski and Smolarkiewicz, 2002): We define the densitypotential temperature (seeEmanuel, 1994) including specifichumidityqv and the mixing ratio of cloud iceqc as follows:
θd := θ + θ (εp qv − qc) (4)
with εp=(1/ε)−1, whereε=Rg/Rv denotes the ratio of theideal gas constants for dry air and water vapour, respectively.Using the definition of an environmental density potentialtemperatureθde : =θe + θ εp qve for the representation ofthe perturbationθ ′
d=θd−θde the governing equations for themoist dynamics read as follows:
DuDt
= −∇
(p′
ρ
)+ g
(θ ′
d
θ
)− f × u′
+ M ′ (5)
Dθ ′
Dt= −u · ∇θe + Fθ (6)
The coupling of dynamics and thermodynamics manifests it-self in two parts:
1. An additional buoyancy source from the deviations inwater vapour and the cloud ice in Eq. (5) in the densitypotential temperature
2. An additional source termFθ on the right hand side ofEq. (6) due to diabatic processes (phase changes etc.).
2.2 Box model
The (zero-dimensional) box model represents an air par-cel which is moved in the vertical direction with a velocityw=w(t), prescribed for the whole simulation timets . Here,we assume only adiabatic processes, i.e. the vertical velocityproduces an adiabatic cooling (expansion) or warming (com-pression) for the background temperatureTe due to
dTe
dt=dTe
dz·dz
dt= −
g
cp· w(t) (7)
The governing equations for the dynamics reduce to
∂θ ′
∂t= Fθ (8)
i.e. the coupling of dynamics and thermodynamics is re-duced to the additional diabatic forcing term. As indicatedabove, for consistency with the formulation of the dynamicsof EULAG we have formulated the box model using envi-ronmental statesTe, pe, θe, i.e. the model is formulated inperturbation form: All diabatic processes will only changeθ ′
=θ−θe, the adiabatic processes change the environment,i.e. Te, pe while θe remains constant. This concept can alsobe used for the dynamical model EULAG, where we can sim-ulate adiabatic cooling due to upward motion by changingthe background physical temperatureTe.
3 Model description – ice microphysics
In this section the newly developed ice microphysics schemeis described. First, we define the set of variables and de-rive the governing equations. The classes of aerosol and icecrystals will be defined, as well as their properties and mass(or size) distribution types. The moments of these distribu-tions will be used in the microphysical equations. Finally,the currently implemented microphysical processes (nucle-ation, deposition, sedimentation) are described in detail. Forall quantities we use SI units.
Aggregation is not yet implemented in the microphysicsscheme. However, aggregation is of less importance for thecold temperature regime (T<−40◦C) and/or for moderatevertical velocities (Kajikawa and Heymsfield, 1989). The de-velopment of an appropriate parameterisation consistent withthe two-moment scheme is subject to ongoing research.
3.1 General assumptions and equations for ice micro-physics
3.1.1 Prognostic equations
As we are interested in particular in the interplay of variouscompeting nucleation modes acting in a cirrus cloud (in par-ticular homogeneous vs. heterogeneous nucleation), we al-low a non-specified number of aerosol and ice classes. Eachaerosol class corresponds to an ice class that it nucleates andvice versa. Each class has a number and a mass concentra-tion, Nx andqx , respectively, which are the zeroth and firstmoments of a mass distributionf (m). Note thatNx is meantin a mass specific sense, that is, the unit of the number con-centration is kg−1 (per kg of dry air). We use this conventionto be consistent with the formulation of the advection equa-tions in flux form. This formulation will be used for the sed-imentation of ice crystals, see below. However, ice crystalnumber densities and ice water content can be derived usingthe ambient densityρ: nc=Nc · ρ, IWC =qc · ρ. The kindof the distribution is preselected (e.g. log-normal or gammaetc.). The moments off (m) are
µk[m] :=
∫∞
0f (m) mk dm, k ∈ R≥0 (9)
www.atmos-chem-phys.net/9/685/2009/ Atmos. Chem. Phys., 9, 685–706, 2009

688 P. Spichtinger and K. Gierens: Modelling cirrus clouds – Part 1a
with the normalisationµ0=Nx. Prognostic equations forthe number and mass concentrations of each aerosol and iceclass form the basis of our bulk microphysical two-momentscheme.
Note that we prefer mass distributions whereas observerspresent their measurements usually as size distributions. Icecrystals in nature appear in a myriad of shapes. Crystal massis therefore a more convenient choice for model formula-tion than crystal size. Therefore we formulate the prognosticequations for masses; sizes and shapes are diagnosed fromthem.
Ice crystal shape is important for depositional growth(Stephens, 1983), sedimentation (Heymsfield and Iaquinta,2000) and radiative properties (Wendisch et al., 2005, 2007)of ice crystals. The ice crystal shape depends clearly ontemperature and ice supersaturation (e.g.Bailey and Hal-let, 2004; Libbrecht, 2005) but columns seem to be a fre-quent habit below−40◦C in a variety of field measurements(Heymsfield and McFarquhar, 2002, their Table 4.1). There-fore we assume columnar ice crystals in our model.
One essential difference of our scheme to other schemes(e.g. Kessler, 1969; Seifert and Beheng, 2005) is that wedo not differentiate ice classes according to their size. Tra-ditionally, cirrus ice was classified as cloud ice and snow,where cloud ice consisted of ice crystals that are so smallthat their terminal fall speed could be set to zero, while snowwas the ice fraction that had non-negligible fall speeds. Thisclassification allowed a better treatment of sedimentation insingle-moment models. As a two-moment model partly over-comes the problems with sedimentation by introducing twosedimentation fluxes, for number and mass concentration, re-spectively, we no longer differentiate between cloud ice andsnow. Instead our ice classes correspond to various nucle-ation processes (or to the respective aerosol class).
The processes ice crystal nucleation, depositionalgrowth/sublimation and sedimentation are currently imple-mented in the scheme. The prognostic equations for potentialtemperature and the microphysical variables forn classes ofice (index c) and aerosol (index a) are thus:
Dθ
Dt=Lθe
cp Te(NUC + DEP)+Dθ (10)
Dqv
Dt= − (NUC + DEP)+Dqv (11)
Dqc,j
Dt=
1
ρ
∂(ρqc,jvm,j )
∂z+ NUCj + DEPj +Dqc,j (12)
DNc,j
Dt=
1
ρ
∂(ρNc,jvn,j )
∂z+ NNUCj + NDEPj +DNc,j (13)
Dqa,j
Dt= NUCAj + DEPAj +Dqa,j (14)
DNa,j
Dt= −NNUCj + NDEPj +DNa,j (15)
wherej is the respective class index and
NUC =
n∑j=1
NUCj, DEP=
n∑j=1
DEPj . (16)
Here, θ denotes potential temperature,Te and θe denotethe physical and potential temperature of the environmentalstate, respectively.Ls is the latent heat of sublimation,cpdenotes the specific heat at constant pressure andρ denotesthe density of the reference state.qv is the specific humidity.Dψ terms represents sources and sinks of the model variableψ due to processes not explicitely represented in the equa-tions (e.g. turbulent transport, diffusion etc.).vm,j andvn,jare the mass and number weighted terminal velocities (seeSect.3.4), respectively. The terms NUCj and NNUCj repre-sent the sources and sinks for the ice crystal mass and numberconcentration, respectively, due to nucleation. Sources andsinks related to diffusional growth or sublimation are repre-sented by the terms DEP and NDEP. We assume that everyice crystal nucleates from an aerosol particle (for both nu-cleation types, heterogeneous and homogeneous), hence theaerosol particle will be removed (i.e. it is now inside the crys-tal) from the aerosol number concentration and it will be re-leased if the ice crystal sublimates completely. Therefore wecan treat the sources and sinks for the aerosol number con-centration using the same terms NNUCj and NDEPj . Fortreating the sources and sinks of the aerosol mass concentra-tion we use the terms NUCAj and DEPAj . Note, that there isno sedimentation of the aerosol particles (due to their smallmasses).
3.1.2 Crystal shape and mass-size relation
For parameterisation of the various processes we need as-sumptions on the properties of single ice crystals, for in-stance their shapes. Generally, we assume that ice crystalsare hexagonal columns (Bailey and Hallet, 2004), with heightL and diameterD (twice the side length of the hexagon).The aspect ratiora : =L/D depends on crystal size, suchthat small crystals havera=1 and larger crystals havera>1.Mass-length relations fromHeymsfield and Iaquinta(2000)of the formL(m)=α(m)mβ(m) with piecewise constant pa-rameter functionsα(m), β(m) (Table 1) are used to derivecrystal size from the prognostic quantity crystal mass. Thebulk ice density is assumed asρb=0.81·103kg m−3 (Heyms-field and Iaquinta, 2000). The parameter values are such thatthe boundary between small and large crystals ismt=2.146·
10−13 kg, or equivalentlyLt=7.416 µm. The aspect ratiocan be formulated as a function ofm; using the formula forthe volume of a hexagonal column (V=(
√27/8) ·D2
·L) andthe mass-length relations we arrive at:
ra(m) =
1 form < mt√√
27ρb
8α3β
·m3−β2β for m ≥ mt
(17)
Atmos. Chem. Phys., 9, 685–706, 2009 www.atmos-chem-phys.net/9/685/2009/

P. Spichtinger and K. Gierens: Modelling cirrus clouds – Part 1a 689
Table 1. Values forα, β in the general mass-length relation; here,mt=2.146 · 10−13 kg denotes the transition between aspect ratiora=1 andra>1, this ice crystal mass is equivalent to a ice crystallength ofLt=7.416µm
m α(m)−1 β(m)−1
m<mt 526.1 3.0m>mt 0.04142 2.2
0.1
1
10
100
1000
1e-16 1e-14 1e-12 1e-10 1e-08
leng
th (
µm)
mass (kg)
length Ldiameter D
Lcrit = 7.42 µm
Fig. 1. Length (L) and diameter (D) of hexagonal ice crystals asfunctions of the ice crystal massm.
In Fig. 1 length and diameter of the ice crystals are shown asfunctions of crystal mass, and in Fig.2 the aspect ratio vs. theice crystal mass and length is shown.
3.1.3 Sedimentation and mass-fall speed relation
For formulating the sedimentation fluxes of the ice mass andnumber concentrations, we need assumptions on the terminalvelocity of a single ice crystal. Here again we use an ansatzby Heymsfield and Iaquinta(2000): v0(L)=x · Ly .
Using the mass-length relations derived above we formu-late the terminal velocity as a function of crystal mass:
v0(m) = γ (m) ·mδ(m) (18)
with piecewise constant parameter functionsγ (m), δ(m), asgiven in Table2. The parameters have been derived using thecoefficients for small columns byHeymsfield and Iaquinta(2000). The terminal velocitiesv0 are valid for referencevalues ofT0,1=233 K,p0,1=300 hPa, for other temperaturesand pressures we apply the correction factor
c(T , p) =
(p
p0
)−0.178 (T
T0
)−0.394
, (19)
such thatv(m, T , p)=γ (m)mδ(m) c(T , p). For very largeice crystals (L>1899µm) we use coefficients adapted from
1
3
5
7
9
11
1e-14 1e-13 1e-12 1e-11 1e-10 1e-09 1e-08 1e-07
aspe
ct r
atio
mass (kg)
1
3
5
7
9
11
1 10 100 1000
aspe
ct r
atio
length (µm)
Fig. 2. Aspect ratiora of hexagonal ice crystals versus ice crystalmassm (upper panel) and lengthL (lower panel), respectively.
Table 2. Values forγ, δ in the velocity-mass Eq. (18); the transitionmasses arem1=2.146·10−13kg,m2=2.166·10−9 kg,m3=4.264·
10−8 kg; equivalent lengths areL1=7.416µm, L2=490.0µm,L3=1899µm
m γ (m) δ(m)
m ≤ m1 735.4 0.42m1 ≤ m ≤ m2 63292.4 0.57m2 ≤ m ≤ m3 329.8 0.31m3 ≤ m 8.8 0.096
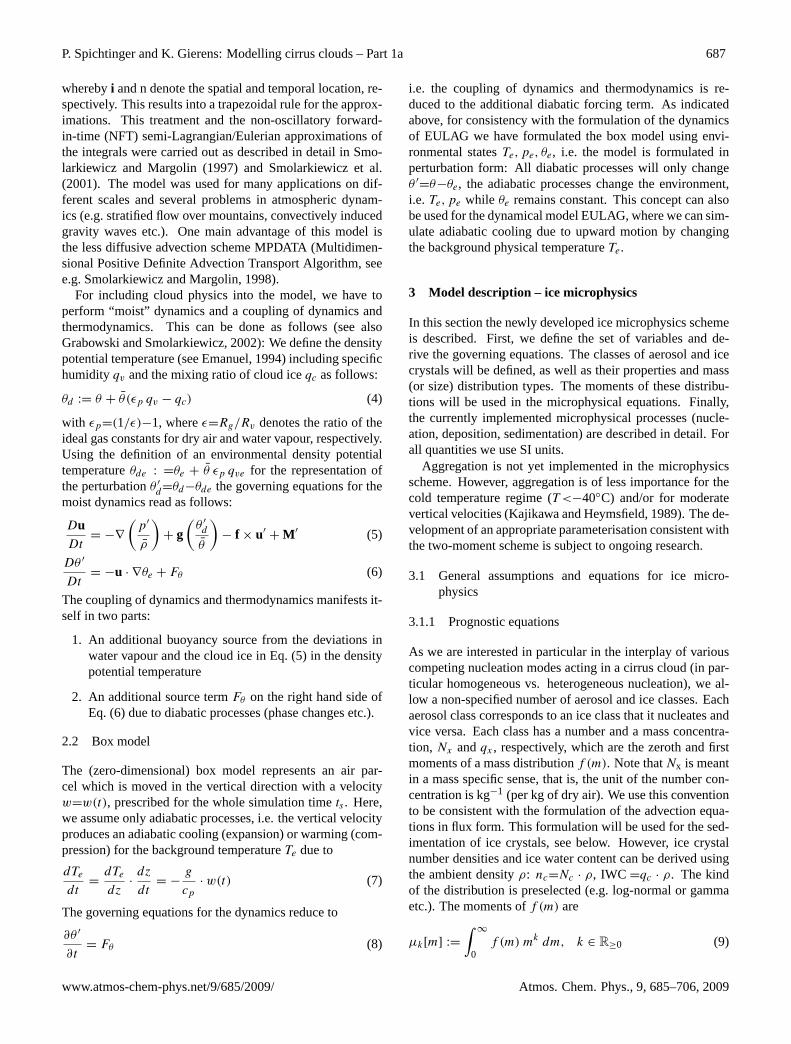
Barthazy and Schefold(2006), who used a reference stateof T0,2=270 K, p0,2=815 hPa. This second reference statewas taken into account in the derivation of our coefficients,which are then valid for the whole tropospheric temperatureand pressure range. The terminal velocity of a single ice crys-tal vs. its mass is shown in Fig.3.
3.1.4 Choice of distribution type
For the formulation of the process rates in Eqs. (10–15) it isrequired to choose an a priori distribution type for the crys-tal masses and the masses of single aerosol particles. Thischoice can be handled very flexible (for instance as an en-try in a FORTRAN namelist) when we are able to formulatethe process rates in terms of general moments of the distribu-tion. Then specification of a distribution in the model simplymeans branching into the corresponding function for the gen-eral moments. Because of this flexibility it does not matter
www.atmos-chem-phys.net/9/685/2009/ Atmos. Chem. Phys., 9, 685–706, 2009
690 P. Spichtinger and K. Gierens: Modelling cirrus clouds – Part 1a
0.0001
0.001
0.01
0.1
1
1e-16 1e-15 1e-14 1e-13 1e-12 1e-11 1e-10 1e-09 1e-08 1e-07
term
inal
vel
ocity
(m
/s)
mass (kg)
Fig. 3. Terminal velocityv(m) of a single ice crystal as function ofthe crystal massm.
much which kind of distribution we use here to derive theprocess rates. However, the model formulation is simplerwhen we select a lognormal distribution than when we se-lect something else. The reason for that is the special formof the mass-size and mass-fall speed relations that we haveassumed and that are common to cloud microphysics formu-lations at least since the 1970s. These relations have the formof a power law. It can easily be shown that when two quanti-ties are related by such a power law and one quantity is log-normally distributed, then the other quantity is lognormallydistributed as well. There are other distributions that havethat property as well, e.g. Weibull and generalised gammadistributions. The former of these is a generalisation of theexponential distribution and might sometimes apply, e.g. foryoung contrails (Gierens, 1996). The latter has more param-eters then the lognormal, which has two. Since it is difficultto derive equations for all parameters, one usually has to fixthem somehow in an ad hoc way. Hence, we prefer to havea distribution with few parameters that avoids such proce-dures as much as possible. When a gamma distribution isselected for crystal sizes, as is often done, then masses andterminal velocities are generalised gamma distributed. How-ever, from observations there is no evidence for preferring(generalised) gamma distributions against lognormal distri-butions for fitting size distributions of ice crystals. For manyobservational data, a lognormal distribution can be fitted aswell as a generalised gamma distribution (M. DeReus, per-sonal communication), and indeed, lognormal fits were usedin several studies (e.g.Schroder et al., 2000)
Also the observation of multiple size modes does not callfor multi-parameter distributions. We strongly believe thatmultiple modes are the result of mixing of ice crystal pop-ulations that have different origin. In our model such casesare covered by the use of multiple ice classes, where the com-bined size distribution of several classes will often show sev-eral modes. Hence, we prefer the lognormal distribution.
The lognormal distribution for the ice crystal mass can bewritten as
f (m) =Nc
√2π logσm
· exp
−1
2
log(mmm
)logσm
2 ·1
m(20)
with geometric mean massmm and geometric mass standarddeviationσm. The lognormal distribution is completely spec-ified once its zeroth, first, and second moment are given. Theprognostic variables of the two-moment scheme let the sec-ond moment a free parameter that we either have to fix to aconstant or to make a function of the mean mass. We use thelatter possibility. For this purpose we followHoller (1986)and define a “predominant mass”:mpre : =µ2[m]/µ1[m],divide it by the mean massm : =µ1[m]/µ0[m] and set theratio r0 of these masses constant, that is:
r0 :=mpre
m=µ2[m]µ0[m]
µ1[m]2= exp
((log(σm))
2). (21)
Hence, the geometric standard deviation can be expressed as
σm = exp(√
logr0)
or logσm =√
logr0 (22)
Using Eq. (22) the analytical expression for the moments ofthe lognormal distributionf (m) can be written as follows:
µk[m] = Nc ·mkm exp
(1
2(k log(σm))
2)
(23)
= Nc ·mkmrk22
0 = Nc ·mkrk(k−1)
20 (24)
Obviously the formulation using the ratior0 is much simplerthan the formulation usingσm.
Given the lognormal mass distribution, the correspond-ing lognormal distributions for the related quantities size andfall speed are obtained using the following transformation(e.g. for crystal lengthL):
Lm = α ·mβm, log(σL) = β · log(σm) (25)
Here we have considered the parameters as constant for thesake of simplicity. Since the coefficients are actually piece-wise constant functions of mass, the transformation formulaabove is not strictly correct. One possible correction is theuse of truncated moments (see below).
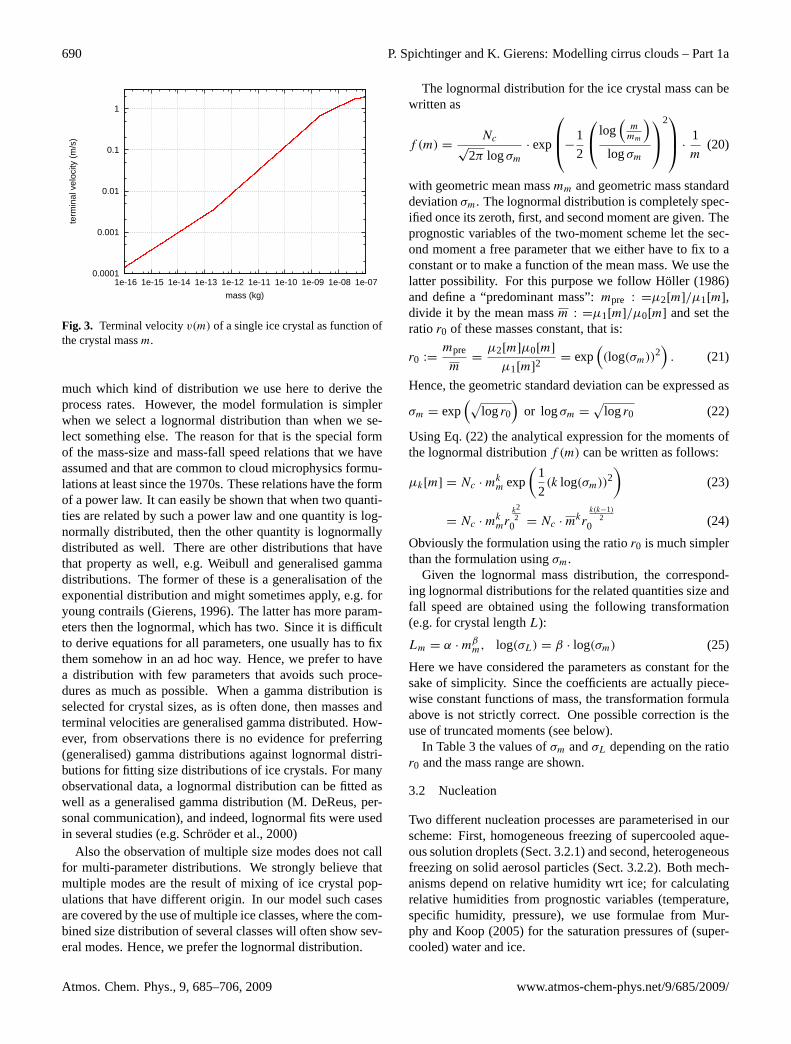
In Table3 the values ofσm andσL depending on the ratior0 and the mass range are shown.
3.2 Nucleation
Two different nucleation processes are parameterised in ourscheme: First, homogeneous freezing of supercooled aque-ous solution droplets (Sect.3.2.1) and second, heterogeneousfreezing on solid aerosol particles (Sect.3.2.2). Both mech-anisms depend on relative humidity wrt ice; for calculatingrelative humidities from prognostic variables (temperature,specific humidity, pressure), we use formulae fromMur-phy and Koop(2005) for the saturation pressures of (super-cooled) water and ice.
Atmos. Chem. Phys., 9, 685–706, 2009 www.atmos-chem-phys.net/9/685/2009/
P. Spichtinger and K. Gierens: Modelling cirrus clouds – Part 1a 691
Table 3. Geometric standard deviationsσm andσL, depending onthe ratior0. The transition massmt=2.146· 10−13kg is equivalentto a length ofLt=7.416µm.
r0 σm σL
m<mt m>mt1.25 1.60 1.17 1.241.50 1.90 1.24 1.342.00 2.23 1.32 1.463.00 2.85 1.42 1.614.00 3.25 1.48 1.716.00 3.81 1.56 1.848.00 4.23 1.62 1.9216.0 5.29 1.74 2.13
3.2.1 Homogeneous nucleation
The solute mass (mass of H2SO4) in a solution droplet isequivalent to the radiusr of a sphere of the pure solute. Forthis radius we prescribe a lognormal size distributionf (r)with the geometric mean radiusrm and a geometric standarddeviationσr .
Given the solute mass, the radiusrd of the solution dropletis obtained from the Kohler theory, depending on tempera-ture and relative humidity. From the Kohler theory in its sim-plest form we know that at (water) saturation the equilibriumdroplet radiusrd is proportional to the square root of the so-lute mass, i.e. proportional tor3/2, a power law relationship.Hence the solution droplets are approximately lognormallydistributed as well, which is in accordance to measurementsof upper tropospheric aerosol (Minikin et al., 2003).
The probability for an aqueous H2O/H2SO4 solutiondroplet of volumeVd to freeze within a time period1t is
P(1aw, T ,1t) = 1 − exp[−Jhom(1aw, T )Vd(T )1t ] (26)
whereJhom(1aw, T ) denotes the homogeneous nucleationrate which is parameterised according toKoop et al.(2000)in terms of temperature and1aw : =aw−aiw, the differenceof water activity in the solution andaiw, the activity of thewater in the solution in equilibrium with ice at temperatureT (i.e. aiw=e∗i (T )/e
∗w(T ), the ratio of the saturation vapour
pressures wrt ice and liquid water, respectively).aiw is thus afunction of temperature alone. The water activity itself is theratio of the equilibrium vapour pressure over the solution tothe equilibrium vapour pressure over pure liquid water.
When dynamical processes (uplift) are slow enough thatsolution droplets can equilibrate their volume to changes inrelative humidity, then the water activity equals the saturationratio (wrt water). This is assumed here. Hence, the homoge-neous nucleation rateJhom can be expressed as a function ofrelative humidity and the temperature. The number of ice
crystals created within a time step1t from an initial aerosolconcentrationNa can now be calculated as
1Nc = Na
∫∞
0f ′a(r)P (1aw, T ,1t) dr (27)
(wheref ′a(r) is the aerosol size distribution normalised to 1)
and the frozen ice water content can be calculated as
1qc = Na
∫∞
0f ′a(r)(r)wwρdVdP(1aw, T ,1t) dr (28)
whereww denotes the H2O weight fraction andρd the den-sity of the solution, respectively. Exploiting the lognormalcharacter of the dry aerosol size distribution, we can use aGauss-Hermite integration for numerical calculation of theintegral (Gierens and Strom, 1998). The integral in Eq. (28)is usually much less than one, so that homogeneous nucle-ation usually is not number limited. Note, that homoge-neous freezing of solution droplets only occurs atT<−38◦C,i.e. below the supercooling limit of pure water.
Formation of1Nc ice crystals simply implies loss of1Na= − 1Nc aerosol particles. However, a priori it is notclear how much aerosol mass is transferred to the ice in thenucleation process. Here we use the following procedure.While the aerosol number concentration decreases by a fac-tor fn=|1Na|/Na the dry aerosol mass concentration in theaerosol class decreases by a factorfm. Hence the mean dryaerosol mass is reduced by a factor(1−fm)/(1−fn). We cancompute and apply this factor once a relation betweenfm andfn is given. For this we make the ansatz
f αm = fn. (29)
The postulateα≥1 expresses that fact that large droplets(consisting of large aerosols) will freeze first and vanish fromthe aerosol pool (see e.g.Haag et al., 2003a, Fig. 8). It turnsout from additional calculations, that a factorα=1.33 is agood approximation. We will use the same approach for thesublimation of ice crystals, see Sect.3.3. Note that we let thewidth parameter (σm) of the aerosol mass distribution un-changed during the nucleation event.
The shift of the mean mass of the background aerosol dis-tribution is optional and can be switched on and off. Forvery large background aerosol concentrations, the shift of themean mass is marginal and can be switched off. Then, onlythe number concentration is decreased, while the mean massor size of the aerosol distribution remains constant; the newmass distribution is calculated using the new number concen-tration. For simulations with high vertical velocities at verycold temperatures (T<210 K) the shift of the mean mass isrecommended.
The impact of shifting the modal radius of the backgroundaerosol distribution leads to smaller radii of solution dropletsduring the ongoing nucleation event, resulting in a decreaseof number density of nucleated ice crystals due to the abruptchange during a nucleation event.
www.atmos-chem-phys.net/9/685/2009/ Atmos. Chem. Phys., 9, 685–706, 2009

692 P. Spichtinger and K. Gierens: Modelling cirrus clouds – Part 1a
3.2.2 Heterogeneous nucleation
Although the investigation of different nucleation mecha-nisms within the same environment is one of the key issueswhich will be studied using the new cirrus microphysics, wemention heterogeneous nucleation only briefly here, becausewe will not use it further in the present paper. Generally,the parameterisation for heterogeneous nucleation makes useof prescribed background aerosols, which act as ice nuclei.Thus, there is an explicit impact of the aerosol on the for-mation of ice crystals and also washout of the backgroundaerosol trapped in the sedimenting ice crystals is described.After nucleation the aerosol particles are trapped inside theice crystals and are released as soon as the ice crystals evap-orate.
In our model we can use parameterisations of heteroge-neous nucleation of any type, more or less sophisticated. InPart 1b (Spichtinger and Gierens, 2009) we will extensivelyuse heterogeneous and homogeneous nucleation within thesame environment; the parameterisation that is used is de-scribed there.
3.3 Deposition growth and sublimation
The growth Eq. (see e.g.Stephens, 1983) for a single icecrystal of massm reads:
dm
dt= 4πCDvf1f2
[ρv(Te)− ρs,i(Ts)
](30)
whereρv(Te) andρs,i(Ts) denote the ambient water vapourdensity, derived from ambient humidity and temperatureTeand the saturated (with respect to ice) water vapour densityat the ice crystal surface, i.e. at surface temperatureTs . Theother factors in Eq. (30) are as follows:
– Diffusivity of water vapour in air
Dv = 2.11 · 10−5(T
T0
)1.94(p0
p
)m2s−1 (31)
according toPruppacher and Klett(1997) using refer-ence valuesT0=273.15 K andp0=101325 Pa, respec-tively.
– Capacitance factorC which accounts for the non-spherical crystal shape. We could have used the ca-pacitance factors for hexagonal columns ofChiruta andWang(2005) here, but we did not for the following rea-sons: First, the well-known uncertainty in the deposi-tion coefficient (see below) has a larger effect on theresults than the choice ofC. Second, the formulationof ventilation factors (see below) has been derived forspherical water drops and only few experiments havebeen carried out for other shapes than sphericalHalland Pruppacher(1976). Third, an ice cloud containsanyway a mixture of crystal shapes and habits. Inclu-sion of the correct capacitance factor for one habit leads
to inconsistencies with other habits. For these reasonswe simply followedHall and Pruppacher(1976). Forspheres of radiusr, C=r. Hexagonal columns withlengthL=2a and diameterD=2b can be approximatedby prolate spheroids with semi axesa and b (a≥b),i.e. with an aspect ratiora=L/D=a/b. The capacitancefactorC can be determined using the electrostatic anal-ogy (McDonald, 1963)
C =Lε′
log(
1+ε′
1−ε′
) =A′
log(a+A′
b
) (32)
where ε′=√
1 − (b/a)2= 1a
√a2 − b2=A′
adenotes the
eccentricity of the spheroid. We use the aspect ratioraintroduced in Sect.3.1for our calculations.
– Correction factorf1 for the difference between thetransfer of water molecules to the crystal by pure diffu-sion and that according to kinetic treatment of individ-ual water molecules (important for very small crystalswith sizes less than 1µm):
f1 =r∗
r∗ + l∗M, with (33)
r∗ =A
4πC, l∗M =
2πMw
RTs
Df2
2αd(2 − αd)−1(34)
whereA is the surface area of the ice crystal,Mw
denotes molecular weight of water andR is the uni-versal gas constant.αd denotes the deposition coef-ficient. Currently there is no agreement on a gen-erally accepted value ofαd . Measured values rangebetween 0.004≤αd≤1 (see e.g.Pruppacher and Klett,1997; Magee et al., 2006), however most models workwell with αd ≥ 0.1 (Lin et al., 2002) for reasons dis-cussed inKay and Wood(2008). The deposition coeffi-cient could even depend on crystal size (e.g.Gierens etal., 2003) or on ice supersaturation (Wood et al., 2001).For our validation runs we have setαd=0.5 (see e.g.Karcher and Lohmann, 2002a,b).
– Ventilation factorf2 to correct for the enhanced growthof ice crystals due to enhanced water vapour flux arisingfrom motion of the crystal relative to the environmentalair (important for large crystals). We followHall andPruppacher(1976) and set:
f2 =
1 + 0.14(N13ScN
12Re)
2 for N13ScN
12Re ≤ 1
0.86+ 0.28(N13ScN
12Re) for N
13ScN
12Re > 1
(35)
whereNSc=Dη/ρ denotes the Schmidt number,η is theviscosity of air andNRe is the Reynolds number definedby characteristic dimensions of the ice crystal.
Atmos. Chem. Phys., 9, 685–706, 2009 www.atmos-chem-phys.net/9/685/2009/

P. Spichtinger and K. Gierens: Modelling cirrus clouds – Part 1a 693
The latent heat released on the growing crystal must be dif-fused to the ambient air. This is described by an analogousequation:
Lsdm
dt= 4πCDvf
∗
1 f∗
2 (Te − Ts) (36)
Ls denotes the latent heat of sublimation, the coefficientsf ∗
1 , f∗
2 are the counterparts to those in Eq. (30):
– f ∗
1 =r∗
r∗+l∗Qwith l∗Q =
Kf ∗
2
ρ14a urβdcp
.
Here,K is the thermal conductivity of moist air,ur isthe average thermal velocity of air molecules strikingthe ice surface andβd=1 is the thermal accommodationcoefficient.
– The ventilation factorf ∗
2 for thermal diffusion is calcu-lated as follows (Hall and Pruppacher, 1976):
f ∗
2 =
{1.00+ 0.14χ2
Q for χQ < 10.86+ 0.28χQ for χQ > 1
, (37)
χQ=N13PrN
12Re,l∗Q
, whereNPr denotes the Prandtl num-
ber andNRe,l∗Q denotes the Reynolds number for thecharacteristic lengthl∗Q.
In order to compute the parameters required for a pa-rameterisation, the two diffusion equations are solved iter-atively using a fourth order Runge-Kutta scheme. For crys-tals of intermediate size, i.e. above the kinetic regime but stillsmall enough such that ventilation is negligible, the ansatz byKoenig (1971) dm
dt≈amb, provides a good approximation to
the numerical solution. The coefficientsa, b depend on satu-ration ratio, temperature and pressure and can be derived us-ing a least squares regression of exponential typef (x)=axb.The coefficientsa, b have been calculated for pressures inthe range 150≤p≤600 hPa in 50 hPa bins and for the tem-perature range−80≤T≤−20◦C in 1 K bins. For the Runge-Kutta integration we have assumed water saturation. The ac-tual value ofa during a simulation is the product of the tab-ulated value and(e−e∗i )/(e−e
∗w). This factor is negative for
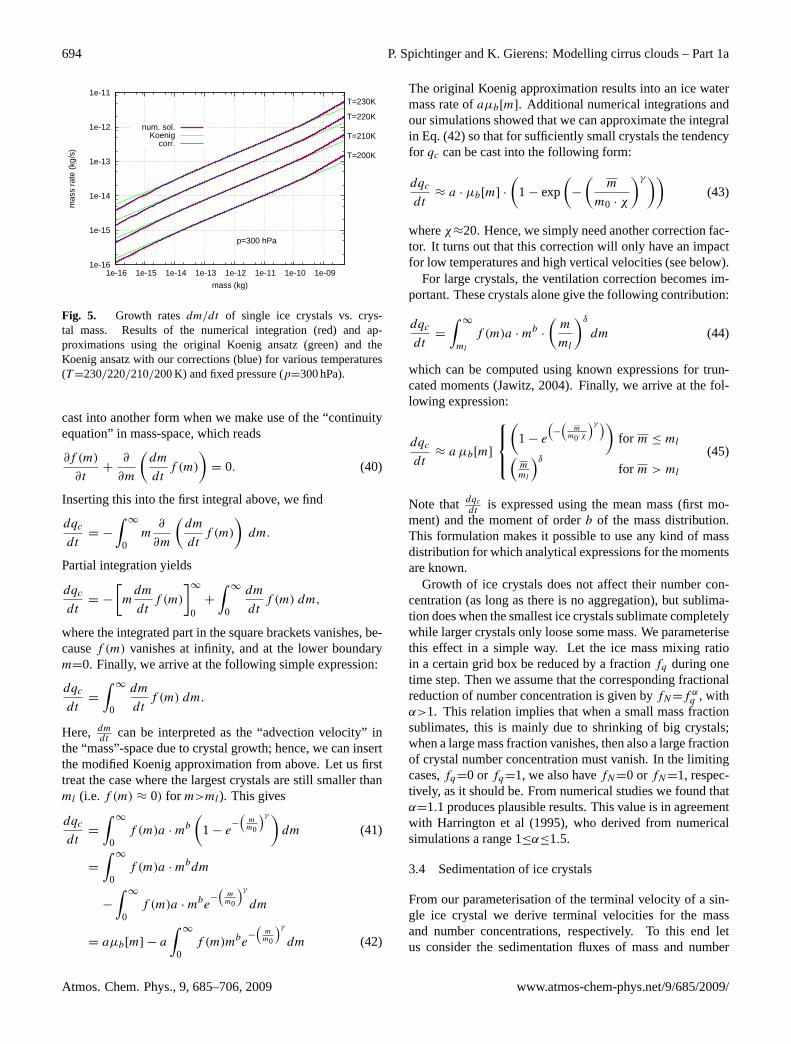
ice-subsaturated conditions, i.e. the equations then describecrystal sublimation. The functionsa(p, T ) andb(p, T ) forselected pressures are displayed in Fig.4. The form of theKoenig approximation makes it ideal for later use in the prog-nostic equation forqc. However, it overestimates strongly thecrystal growth in the kinetic regime and underestimates theinfluence of the ventilation factor for large crystals. In orderto overcome these problems, we introduce a correction of thefollowing form:
dm
dt≈
a ·mb ·
(1 − exp
(−
(mm0
)γ ))for m < ml
a ·mb ·
(mml
)δfor m ≥ ml
(38)
1e-11
1e-10
1e-09
1e-08
1e-07
-80 -75 -70 -65 -60 -55 -50 -45 -40 -35 -30 -25 -20
coef
ficie
nt a
(T,p
)
temperature (K)
p=200hPap=300hPap=400hPap=500hPa
0.362
0.363
0.364
0.365
0.366
0.367
0.368
0.369
0.37
0.371
0.372
0.373
0.374
0.375
0.376
-80 -75 -70 -65 -60 -55 -50 -45 -40 -35 -30 -25 -20
coef
ficie
nt b
(T,p
)
temperature (K)
p=200hPap=300hPap=400hPap=500hPa
Fig. 4. Coefficients a(p, T ) (top) and b(p, T ) (bottom) forKoenig’s ansatzdm/dt≈a(p, T )mb(p,T ) and the approximation ofthe numerical solution of Eq. (30) for different pressures.
wherem0=m0(p, T ) ∼ 10−16− 10−14 kg, γ=γ (p, T ) ∼
0.2−0.25,ml=2.2 · 10−10 kg, andδ=0.12.Using these corrections we are able to approximate the
mass growth rates for single crystals within an error marginof less than 5% compared to the numerical solution.
The numerical solutions together with the original Koenigansatz and the new approximations are shown in Fig.5.
Now we are going to derive the “integrated” equation forthe cloud ice mixing ratio tendency:
dqc
dt=d
dt
∫∞
0f (m)m dm (39)
We may interchange the derivative with integration, invokethe product rule and arrive at:
dqc
dt=
∫∞
0
∂f (m)
∂tm dm+
∫∞
0f (m)
∂m
∂tdm
The second integral vanishes, since∂m/∂t ≡ 0 (becausemmust be interpreted here a co-ordinate inm-space, and the co-ordinate system is, of course, fixed). The first integral can be
www.atmos-chem-phys.net/9/685/2009/ Atmos. Chem. Phys., 9, 685–706, 2009
694 P. Spichtinger and K. Gierens: Modelling cirrus clouds – Part 1a
1e-16
1e-15
1e-14
1e-13
1e-12
1e-11
1e-16 1e-15 1e-14 1e-13 1e-12 1e-11 1e-10 1e-09
mas
s ra
te (
kg/s
)
mass (kg)
T=200K
T=210K
T=220K
T=230K
p=300 hPa
num. sol.Koenig
corr.
Fig. 5. Growth ratesdm/dt of single ice crystals vs. crys-tal mass. Results of the numerical integration (red) and ap-proximations using the original Koenig ansatz (green) and theKoenig ansatz with our corrections (blue) for various temperatures(T=230/220/210/200 K) and fixed pressure (p=300 hPa).
cast into another form when we make use of the “continuityequation” in mass-space, which reads
∂f (m)
∂t+
∂
∂m
(dm
dtf (m)
)= 0. (40)
Inserting this into the first integral above, we find
dqc
dt= −
∫∞
0m∂
∂m
(dm
dtf (m)
)dm.
Partial integration yields
dqc
dt= −
[mdm
dtf (m)
]∞
0+
∫∞
0
dm
dtf (m) dm,
where the integrated part in the square brackets vanishes, be-causef (m) vanishes at infinity, and at the lower boundarym=0. Finally, we arrive at the following simple expression:
dqc
dt=
∫∞
0
dm
dtf (m) dm.
Here, dmdt
can be interpreted as the “advection velocity” inthe “mass”-space due to crystal growth; hence, we can insertthe modified Koenig approximation from above. Let us firsttreat the case where the largest crystals are still smaller thanml (i.e.f (m) ≈ 0) for m>ml). This gives
dqc
dt=
∫∞
0f (m)a ·mb
(1 − e
−
(mm0
)γ )dm (41)
=
∫∞
0f (m)a ·mbdm
−
∫∞
0f (m)a ·mbe
−
(mm0
)γdm
= aµb[m] − a
∫∞
0f (m)mbe
−
(mm0
)γdm (42)
The original Koenig approximation results into an ice watermass rate ofaµb[m]. Additional numerical integrations andour simulations showed that we can approximate the integralin Eq. (42) so that for sufficiently small crystals the tendencyfor qc can be cast into the following form:
dqc
dt≈ a · µb[m] ·
(1 − exp
(−
(m
m0 · χ
)γ))(43)
whereχ≈20. Hence, we simply need another correction fac-tor. It turns out that this correction will only have an impactfor low temperatures and high vertical velocities (see below).
For large crystals, the ventilation correction becomes im-portant. These crystals alone give the following contribution:
dqc
dt=
∫∞
ml
f (m)a ·mb ·
(m
ml
)δdm (44)
which can be computed using known expressions for trun-cated moments (Jawitz, 2004). Finally, we arrive at the fol-lowing expression:
dqc
dt≈ a µb[m]
(
1 − e
(−
(m
m0·χ
)γ ))for m ≤ ml(
mml
)δfor m > ml
(45)
Note that dqcdt
is expressed using the mean mass (first mo-ment) and the moment of orderb of the mass distribution.This formulation makes it possible to use any kind of massdistribution for which analytical expressions for the momentsare known.
Growth of ice crystals does not affect their number con-centration (as long as there is no aggregation), but sublima-tion does when the smallest ice crystals sublimate completelywhile larger crystals only loose some mass. We parameterisethis effect in a simple way. Let the ice mass mixing ratioin a certain grid box be reduced by a fractionfq during onetime step. Then we assume that the corresponding fractionalreduction of number concentration is given byfN=f αq , withα>1. This relation implies that when a small mass fractionsublimates, this is mainly due to shrinking of big crystals;when a large mass fraction vanishes, then also a large fractionof crystal number concentration must vanish. In the limitingcases,fq=0 orfq=1, we also havefN=0 orfN=1, respec-tively, as it should be. From numerical studies we found thatα=1.1 produces plausible results. This value is in agreementwith Harrington et al(1995), who derived from numericalsimulations a range 1≤α≤1.5.
3.4 Sedimentation of ice crystals
From our parameterisation of the terminal velocity of a sin-gle ice crystal we derive terminal velocities for the massand number concentrations, respectively. To this end letus consider the sedimentation fluxes of mass and number
Atmos. Chem. Phys., 9, 685–706, 2009 www.atmos-chem-phys.net/9/685/2009/
P. Spichtinger and K. Gierens: Modelling cirrus clouds – Part 1a 695
concentrations:
Fm :=
∫∞
0ρf (m)v(m)mdm (46)
Fn :=
∫∞
0ρf (m)v(m) dm (47)
We use these definitions to define mass and number weightedterminal velocities, such thatFm=ρ qc vm,Fn=ρ Nc vn.Hence:
vm =1
qc
∫∞
0f (m)v(m)mdm (48)
vn =1
Nc
∫∞
0f (m)v(m) dm (49)
The terminal velocity of one single ice crystal is a function ofits mass, viz.v(m)=γ (m) ·mδ(m). For simplicity, let us firstassumeγ (m) = γ0, δ(m)=δ0 to be constants. This allowsto simply express the mass and number weighted terminalvelocities via the moments off (m):
vm = γ0 ·µδ+1
µ1, vn = γ0 ·
µδ
µ0(50)
Actually, the coefficients in the mass vs. fall speed relationare piecewise constant, hence we can express the integralsby using truncated moments:∫
∞
0f (m)v(m) dm =
4∑k=0
∫ mk+1
mk
f (m)γ (m)mδ(m)dm
=
4∑k=0
γ (m)µδ(m)(mk, mk+1) (51)
∫∞
0f (m)v(m)m dm =
4∑k=0
∫ mk+1
mk
f (m)γ (m)mδ(m)+1dm
=
4∑k=0
γ (m)µδ(m)+1(mk, mk+1) (52)
whereµk(ml, mu) denotes the kth truncated moment withboundariesml<m<mu. Here,m0=0, m4=∞, the valuesm1, m2, m3 are given in Table2. For the lognormal distri-bution the truncated moments can be expressed as follows(Jawitz, 2004):
µk(ml, mu) = µk[m]1
√π
∫ z(mu)
z(ml)
exp(−z2)dz (53)
with the transformation
z(m) =
log(mmm
)− k log(σm)√
2, (54)
For the calculation of the integral we have to evaluate theerror function
erf(x) =2
√π
∫ x
0exp(−r2)dr (55)
1e-05
0.0001
0.001
0.01
0.1
1
1e-18 1e-16 1e-14 1e-12 1e-10 1e-08
term
inal
vel
ocity
(m
/s)
mean mass (kg)
vmvn
approx. vmapprox. vn
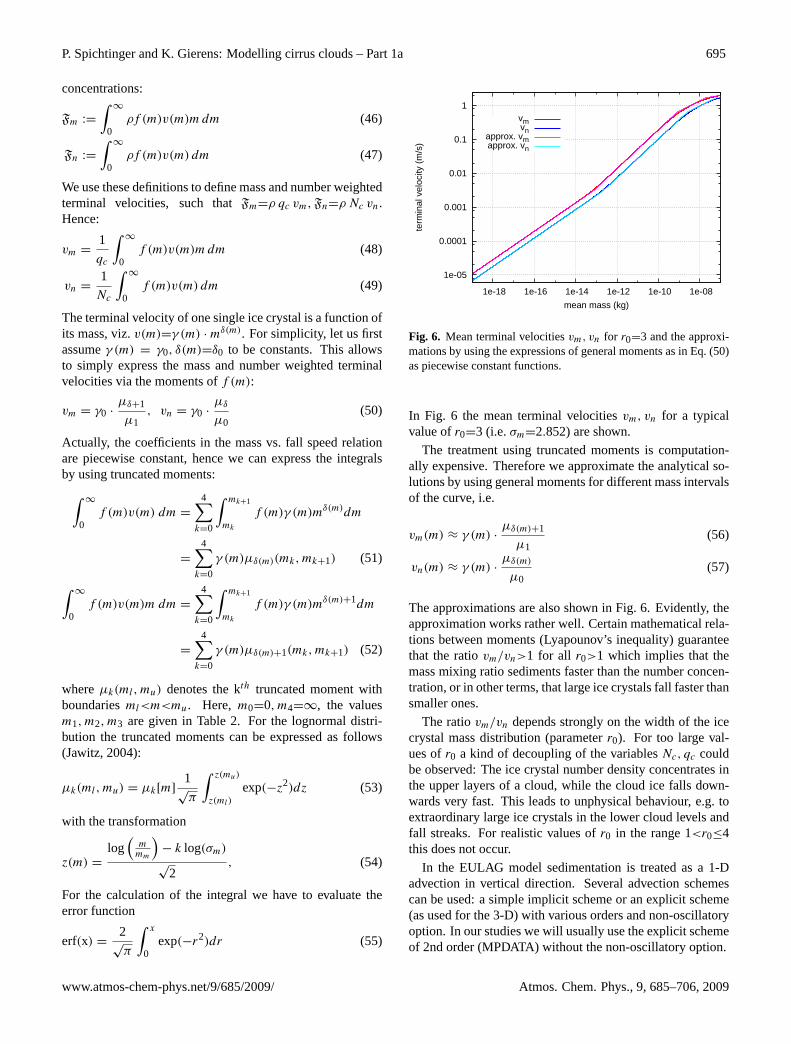
Fig. 6. Mean terminal velocitiesvm, vn for r0=3 and the approxi-mations by using the expressions of general moments as in Eq. (50)as piecewise constant functions.
In Fig. 6 the mean terminal velocitiesvm, vn for a typicalvalue ofr0=3 (i.e.σm=2.852) are shown.
The treatment using truncated moments is computation-ally expensive. Therefore we approximate the analytical so-lutions by using general moments for different mass intervalsof the curve, i.e.
vm(m) ≈ γ (m) ·µδ(m)+1
µ1(56)
vn(m) ≈ γ (m) ·µδ(m)
µ0(57)
The approximations are also shown in Fig.6. Evidently, theapproximation works rather well. Certain mathematical rela-tions between moments (Lyapounov’s inequality) guaranteethat the ratiovm/vn>1 for all r0>1 which implies that themass mixing ratio sediments faster than the number concen-tration, or in other terms, that large ice crystals fall faster thansmaller ones.
The ratiovm/vn depends strongly on the width of the icecrystal mass distribution (parameterr0). For too large val-ues ofr0 a kind of decoupling of the variablesNc, qc couldbe observed: The ice crystal number density concentrates inthe upper layers of a cloud, while the cloud ice falls down-wards very fast. This leads to unphysical behaviour, e.g. toextraordinary large ice crystals in the lower cloud levels andfall streaks. For realistic values ofr0 in the range 1<r0≤4this does not occur.
In the EULAG model sedimentation is treated as a 1-Dadvection in vertical direction. Several advection schemescan be used: a simple implicit scheme or an explicit scheme(as used for the 3-D) with various orders and non-oscillatoryoption. In our studies we will usually use the explicit schemeof 2nd order (MPDATA) without the non-oscillatory option.
www.atmos-chem-phys.net/9/685/2009/ Atmos. Chem. Phys., 9, 685–706, 2009
696 P. Spichtinger and K. Gierens: Modelling cirrus clouds – Part 1a
3.5 Microphysical time step
As we will see later in the validation section, the parame-terisations can be sensitive to the prescribed time step. Forbox model calculations this is not a problem; the computa-tional effort is so small, that we can easily use a very smalltime step. However, for the application of the microphysicsscheme in a 2D/3D framework of the EULAG model thecomputational effort is much higher. For solving this prob-lem, we implemented a so-called microphysical time step.Here, the “dynamical” time step, i.e. the time step for thedynamics in the EULAG model is split into a number of sub-time steps, i.e.1tmp = 1t/nmp. There is an additionalloop for each vertical column ofnmp sub time steps; here,only the microphysics (nucleation, growth/sublimation, sed-imentation) is calculated. Then, the summed forcing termsfrom the sub-time steps are used for the next dynamical timesteps. We use the microphysical time step adaptively: First,the forcings for a normal dynamical time step are calculated.If homogeneous nucleation takes place within this time stepor the change in relative humidity wrt ice is larger than 1%due to deposition/sublimation, then the time splitting is used.We will see later in the validation of the nucleation parame-terisation, which number of sub-time steps is appropriate.
4 Validation and discussion
The microphysics scheme is validated using two differenttypes of comparisons. First, we use our microphysics in abox model setting to compare the ice crystal number den-sities that are nucleated homogeneously under a large vari-ety of conditions with values derived from a box model withdetailed ice microphysics scheme (Karcher and Lohmann,2002a,b). Additionally, some sensitivity studies are carriedout. Second, we simulate a well-documented case of arc-tic cirrostratus and compare our results with 1-D simulations(Lin et al., 2005; Karcher, 2005).
4.1 Comparison with detailed box model calculations
Karcher and Lohmann(2002a) used a detailed box model(particle tracking, highly resolved aerosol size distribution)for testing an analytically derived relationship between themaximum possible ice crystal number density, formed byhomogeneous nucleation, and vertical velocity. In our firststep of validating the model, we carry out box model runsfor the same conditions to compare ice crystal number den-sities with the results ofKarcher and Lohmann(2002a). Thecode ofKarcher and Lohmann(2002a) has been successfullyapplied to measurements of homogeneous nucleation in thelarge cloud chamber AIDA (Haag et al., 2003a) and to fieldmeasurements during INCA (Interhemispheric differencesin cirrus properties from anthropogenic emissions,Gayet etal., 2006). So, our comparison with results ofKarcher and
Lohmann(2002a) can be viewed as an indirect comparisonwith the AIDA and INCA results.
We use the following setup: We allow only homogeneousfreezing and prescribe a constant vertical velocity in therangew=0.01−5.0 m s−1. The initial conditions (p, T , qv)are adapted such that temperature and pressure reach pre-scribed valuesp±5 hPa,T±0.1 K at the beginning of thehomogeneous freezing event.
Initially we assume a very high aerosol number density sothat nucleation is not constrained by the number of availablenuclei. Later we will investigate cases with realistic back-ground aerosol conditions, obtained from observations (e.g.Minikin et al., 2003). Within the box model framework wewill also investigate the impact of pressure on the numberdensity of ice crystals produced in the nucleation event.
4.1.1 Idealised simulations
In our first series of experiments we use only one classof (homogeneously formed) ice. The number density ofthe background aerosol is set to the very large value ofNa=10 000 cm−3, such that nucleation cannot exhaust thebackground aerosol. Therefore we may safely neglect theshift in the mean mass of the aerosol size distribution. Wechoose a geometric standard deviation ofσm=2.85 (r0=3)for the lognormal distribution of the ice crystal mass. Ad-ditional sensitivity tests have been performed withr0 in therange 2≤r0≤4; these resulted in only slight variations com-pared tor0=3. For a certain vertical velocityw we choosethe time step such that the nucleation event is resolved:1t=(0.05 m/w) (B. Karcher, personal communication). Thenumber of time steps is fixed atnt=12 000.
We choose the same conditions (p, T ) as in Karcherand Lohmann(2002a), i.e. T=196, 216, 235 K andp=200 hPa, and a mean radius for the (dry) H2SO4 aerosolof rm=25 nm. The reported values of temperature and pres-sure, respectively, in all boxmodel simulations refer alwaysto the onset of homogeneous freezing. For investigating theeffect of the width of the aerosol size distribution we vary thegeometrical standard deviation:σr=1.3, 1.6, 1.9.
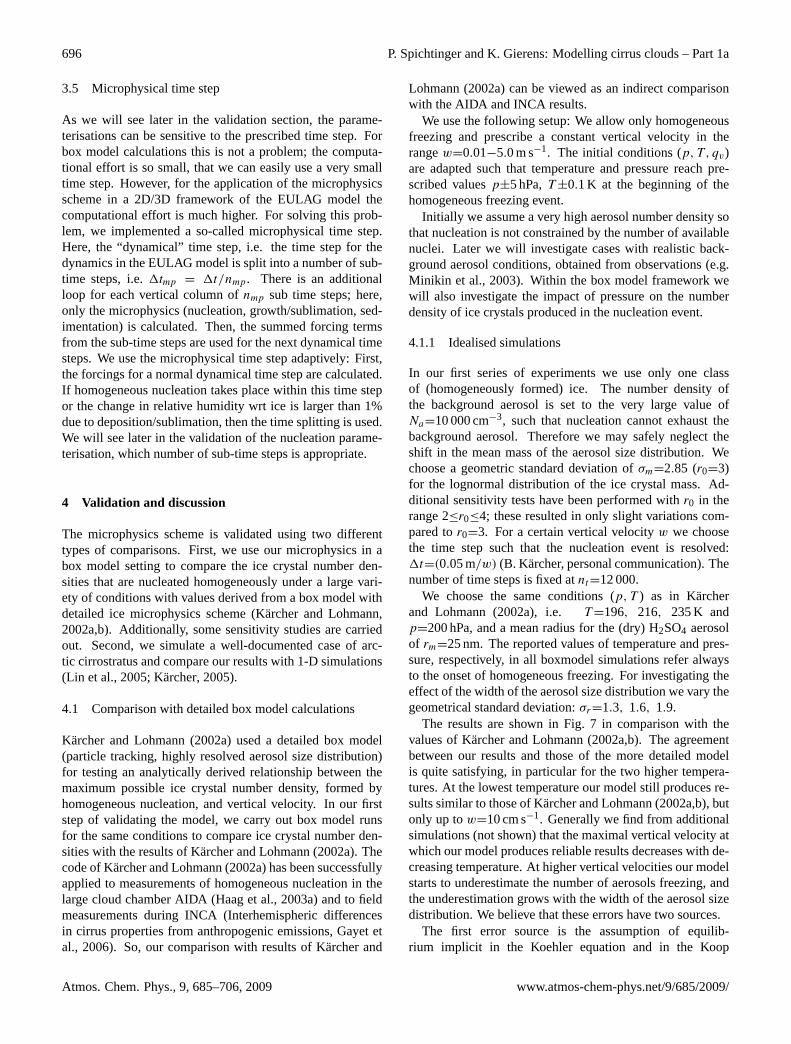
The results are shown in Fig.7 in comparison with thevalues ofKarcher and Lohmann(2002a,b). The agreementbetween our results and those of the more detailed modelis quite satisfying, in particular for the two higher tempera-tures. At the lowest temperature our model still produces re-sults similar to those ofKarcher and Lohmann(2002a,b), butonly up tow=10 cm s−1. Generally we find from additionalsimulations (not shown) that the maximal vertical velocity atwhich our model produces reliable results decreases with de-creasing temperature. At higher vertical velocities our modelstarts to underestimate the number of aerosols freezing, andthe underestimation grows with the width of the aerosol sizedistribution. We believe that these errors have two sources.
The first error source is the assumption of equilib-rium implicit in the Koehler equation and in the Koop
Atmos. Chem. Phys., 9, 685–706, 2009 www.atmos-chem-phys.net/9/685/2009/
P. Spichtinger and K. Gierens: Modelling cirrus clouds – Part 1a 697
0.001
0.01
0.1
1
10
100
1000
10000
1 10 100 1000
ice
crys
tal n
umbe
r de
nsity
(cm
-3)
vertical velocity (cm/s)
KL02, T=196KKL02, T=216KKL02, T=235K
0.001
0.01
0.1
1
10
100
1000
10000
1 10 100 1000
ice
crys
tal n
umbe
r de
nsity
(cm
-3)
vertical velocity (cm/s)
KL02, T=196KKL02, T=216KKL02, T=235K
0.001
0.01
0.1
1
10
100
1000
10000
1 10 100 1000
ice
crys
tal n
umbe
r de
nsity
(cm
-3)
vertical velocity (cm/s)
KL02, T=196KKL02, T=216KKL02, T=235K
Fig. 7. Box model calculations for the homogeneously formed icecrystal number densities depending on the vertical velocity. Thecalculations for different temperatures are indicated by the colours(red: T=235 K, green:T=216 K, blue:T=196 K). Line points in-dicate calculations with our box model, points denotes values fromKarcher and Lohmann(2002a). The panels show the impact of thewidth of the aerosol distribution: top:σr=1.3, middle: σr=1.6,bottom:σr=1.9.
1
100
10000
1e+06
1e+08
1e+10
1e+12
1e+14
1e+16
1e-09 1e-08 1e-07 1e-06 1e-05
freq
uenc
y de
nsity
droplet radius (m)
T=200 K, RHi=161%
σr=1.9, rm=50 nm
H2O/H2SO4 bf. nucl.nucleated crystals
H2O/H2SO4 af. nucl.
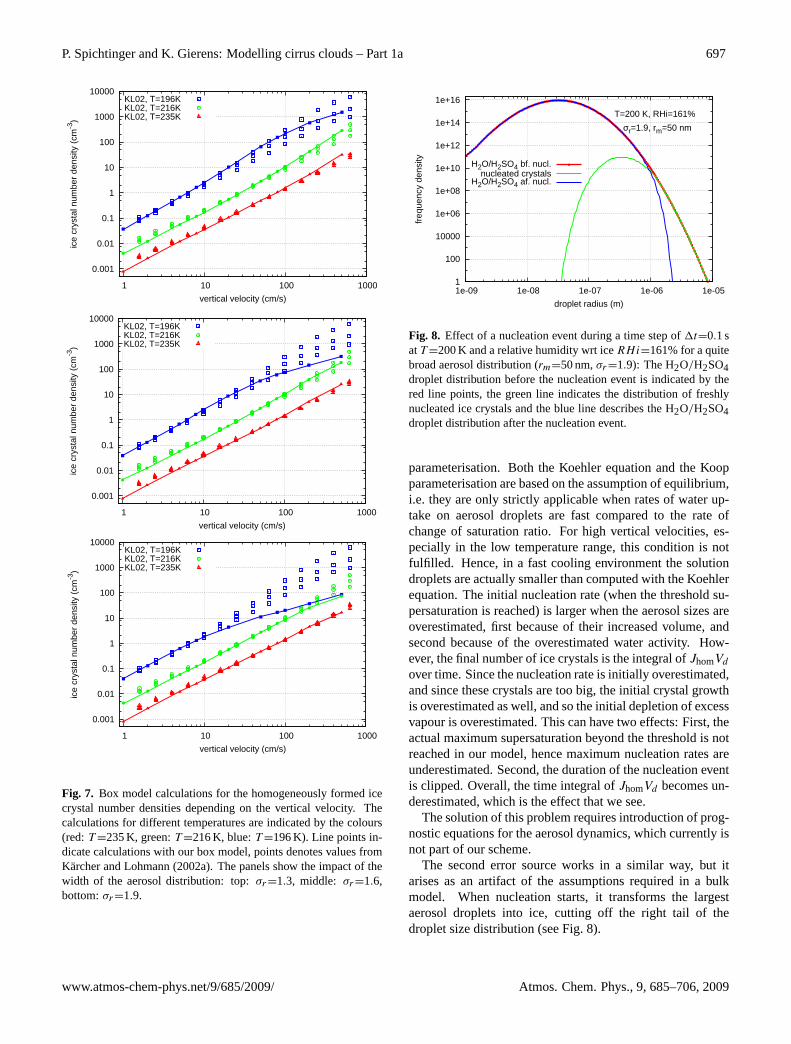
Fig. 8. Effect of a nucleation event during a time step of1t=0.1 satT=200 K and a relative humidity wrt iceRHi=161% for a quitebroad aerosol distribution (rm=50 nm,σr=1.9): The H2O/H2SO4droplet distribution before the nucleation event is indicated by thered line points, the green line indicates the distribution of freshlynucleated ice crystals and the blue line describes the H2O/H2SO4droplet distribution after the nucleation event.
parameterisation. Both the Koehler equation and the Koopparameterisation are based on the assumption of equilibrium,i.e. they are only strictly applicable when rates of water up-take on aerosol droplets are fast compared to the rate ofchange of saturation ratio. For high vertical velocities, es-pecially in the low temperature range, this condition is notfulfilled. Hence, in a fast cooling environment the solutiondroplets are actually smaller than computed with the Koehlerequation. The initial nucleation rate (when the threshold su-persaturation is reached) is larger when the aerosol sizes areoverestimated, first because of their increased volume, andsecond because of the overestimated water activity. How-ever, the final number of ice crystals is the integral ofJhomVdover time. Since the nucleation rate is initially overestimated,and since these crystals are too big, the initial crystal growthis overestimated as well, and so the initial depletion of excessvapour is overestimated. This can have two effects: First, theactual maximum supersaturation beyond the threshold is notreached in our model, hence maximum nucleation rates areunderestimated. Second, the duration of the nucleation eventis clipped. Overall, the time integral ofJhomVd becomes un-derestimated, which is the effect that we see.
The solution of this problem requires introduction of prog-nostic equations for the aerosol dynamics, which currently isnot part of our scheme.
The second error source works in a similar way, but itarises as an artifact of the assumptions required in a bulkmodel. When nucleation starts, it transforms the largestaerosol droplets into ice, cutting off the right tail of thedroplet size distribution (see Fig.8).
www.atmos-chem-phys.net/9/685/2009/ Atmos. Chem. Phys., 9, 685–706, 2009

698 P. Spichtinger and K. Gierens: Modelling cirrus clouds – Part 1a
0.001
0.01
0.1
1
10
100
1000
10000
1 10 100 1000
ice
crys
tal n
umbe
r de
nsity
(cm
-3)
vertical velocity (cm/s)
KL02, T=196KKL02, T=216KKL02, T=233K
ra=12.5nmra=25.0nmra=50.0nm
Fig. 9. Box model calculations for the homogeneously formed icecrystal number densities depending on the vertical velocity and onthe temperature. For comparisons, the values from detailed micro-physics calculations inKarcher and Lohmann(2002a) are shown.For the simulations, we assume a fixed width for the aerosol distri-bution ofσr=1.4. Here, the impact of geometric mean size of theaerosol distribution is shown:rm=12.5 nm (black),rm=25.0 nm(cyan),rm=50.0 nm (magenta).
In the next time step this cutoff is forgotten, however, be-cause the bulk model always assumes the same type of sizedistribution. This has the effect that at each time step dur-ing nucleation (except the first) the size of freezing dropletsis overestimated. The newly formed crystals come out toolarge, consume too much excess vapour and quench nucle-ation prematurely, so that eventually too few crystals areproduced. We can try to mitigate this error by reducing themean aerosol size during the nucleation phase (switched offfor the idealised experiments), but this does not always help,because the error depends in a non-linear way on the timestep (simply because the mass distribution is a non-linearfunction). Later we will see that the mentioned problems be-come unimportant in cases with realistic aerosol backgroundconcentrations, so that fortunately it turns out unnecessaryto invent a much more complicated correction for the meanaerosol size.
With the same setup as before we now study the effect ofchanging the geometric mean radius of the “dry” sulphuricacid: rm=12.5,25.0,50.0 nm. We hold the width constant atσ=1.4. Fig.9 shows the results.
At the two higher temperatures there is hardly an effect ofthe aerosol core mass distribution. But at the lowest tem-perature and at high uplift rates, there is an effect. Ourmodel follows the detailed microphysical results ofKarcherand Lohmann(2002a,b) the best when the acid mass in thedroplets is smallest. In this case equilibrium between the so-lution droplets and their environment is easier to maintaincompared to cases with larger acid fractions; hence use ofthe Koehler equations is still justified at strong uplift. We
0.001
0.01
0.1
1
10
100
1000
1 10 100
ice
crys
tal n
umbe
r de
nsity
(cm
-3)
vertical velocity (cm/s)
T=200K
T=215K
T=230K
200hPa300hPa400hPa
Fig. 10. Box model calculations for the homogeneously formed icecrystal number densities depending on the vertical velocity and onthe temperature. For the simulations, we assume a fixed width forthe aerosol size distribution ofσr=1.4 and a geometric mean radiusof rm=25 nm. Here, the impact of pressure on the formation of icecrystals is shown using values ofp=200/300/400 hPa.
have already stated above that at (water) saturation the equi-librium droplet radiusrd is proportional to the square rootof the solute mass, i.e. proportional tor3/2, which shows thatgenerally droplets are smaller with smaller solute mass underotherwise identical conditions. The relaxation time (the timeneeded to equilibrate with changed ambient saturation ratio)of a droplet increases with its size because the number of wa-ter molecules that have to be transferred between the vapourand the droplets increases with droplet size. A simple rem-edy of the problem encountered above could therefore be tochoose smaller values ofrm orσr than in corresponding spec-tral microphysics simulations. As we have seen, this choicegives better results at low temperatures and high uplift ve-locities while it has merely a weak effect at other conditions.Such an approach is justified as long as it is rather the icethan the aerosol that is the focus of the studies.
Finally we study the pressure dependence of the numberconcentration of ice crystals freezing by homogeneous nu-cleation. We expect an influence via the pressure depen-dence of the diffusion coefficient. Also results ofHoyle etal. (2005) point at the possibility that changes in pressurecan change the amount of ice crystals formed in a homoge-neous freezing event up to one order of magnitude. We selectσr=1.4, rm=25 nm as a setup that gave reasonably consistentresults withKarcher and Lohmann(2002a) who, however,did not investigate the pressure dependence. We choose tem-peratures in the rangeT=200, 215, 230 K and pressures inthe rangep=200,300,400 hPa. The results are presented inFig. 10.
We can see clearly that the ambient pressure has an im-pact on the ice crystal number densities produced duringthe cooling experiment. The diffusion constant depends on
Atmos. Chem. Phys., 9, 685–706, 2009 www.atmos-chem-phys.net/9/685/2009/

P. Spichtinger and K. Gierens: Modelling cirrus clouds – Part 1a 699
pressure, i.e.Dv∝p−1 (see Eq.31); thus diffusional growthrates decrease with increasing ambient pressure due to de-creasing mean free path of the water molecules in air. Slowergrowth at higher pressures implies that supersaturation canstay longer above the nucleation threshold, hence more crys-tals nucleate. Varying the pressure from 200 to 400 hPa leadsto an increase in the ice crystal number concentrations by afactor of 4–5.
4.1.2 Realistic background conditions
Realistic background aerosol concentrations are much lowerthan in the idealised simulations, for instance in the rangena=Naρ∼100−300 cm−3 (Minikin et al., 2003). Hence, werepeat the simulations of Sect.4.1.1 with a realistic back-ground aerosol density ofna=300 cm−3. In this case we alsouse the correction for the mean aerosol mass, i.e. the aerosolsize distribution is now shifted to smaller masses after a nu-cleation event. Under realistic conditions the number of icecrystals that form in homogenous nucleation events can beconstrained by the available aerosol.
Figure11shows the impact of the width of the aerosol sizedistribution. We see that it hardly has an effect on the num-ber of crystals formed, even at the lowest temperature and thehighest uplift velocities (except for a very broad distributionwith σr=1.9). This is in sharp contrast to the idealised caseswhereσr had a much larger influence at the lowest tempera-ture. We conclude that it is here the constraint by the avail-able aerosol rather than the equilibrium assumptions in theKoehler and Koop theories that leads to lower crystal num-bers than in theKarcher and Lohmann(2002a) studies. Thisimplies that the problems encountered above are less impor-tant in reality than in the idealised situations, which meansthat our parameterisation can be used at low temperaturesand high uplift velocities.
We also repeated the simulations with different pressureswith the realistic aerosol distribution. While we still find thepressure effect at low uplift speeds, the effect gets weak oreven vanishes at high uplift speeds due to the constraintsposed by the number of available aerosol particles (seeFig. 12).
4.1.3 Time step issues
In all previous box model simulations we have adapted thetime step such that the homogeneous nucleation event canbe resolved in time. However, for more expensive 2-D/3-D simulations one would like to use longer time steps. Wehave tested how the model behaves with fixed time stepsof 1t=0.1,0.5,1.0,2.0 s, respectively, both in the idealisedand realistic cases from above. Figure13shows the results.
Obviously, problems appear with too long time stepsat high uplift speeds. While there are no problemseven with a time step of 1 s at small vertical veloci-ties (w≤20−50 cm s−1), there are strong deviations from
0.001
0.01
0.1
1
10
100
1000
10000
1 10 100 1000
ice
crys
tal n
umbe
r de
nsity
(cm
-3)
vertical velocity (cm/s)
KL02, T=196KKL02, T=216KKL02, T=233K
sigma=1.3sigma=1.6sigma=1.9
background
Fig. 11. Box model calculations for the homogeneously formed icecrystal number densities depending on the vertical velocity and onthe temperature. For comparisons, the values from detailed micro-physics calculations inKarcher and Lohmann(2002a) are shown.For the simulations, we assume a fixed geometric mean size of theaerosol distribution (rm=25.0 nm). Here, the impact of differentwidth of the aerosol distribution is shown (black:σr=1.3, cyan:σr=1.6, magenta:σr=1.9). In contrast to the simulations shownin Fig. 7, we use realistic background concentrations for the sul-phuric acid aerosol (nc=300cm−3). This leads to less ice crystalsfor low temperatures and/or high vertical velocities due to a limitedreservoir of solution droplets.
0.001
0.01
0.1
1
10
100
1000
1 10 100
ice
crys
tal n
umbe
r de
nsity
(cm
-3)
vertical velocity (cm/s)
T=200KT=215K
T=230K
200hPa300hPa400hPa
background
Fig. 12. Box model calculations for the homogeneously formed icecrystal number densities depending on the vertical velocity and onthe temperature. For the simulations, we assume a fixed width forthe aerosol size distribution ofσr=1.4 and a geometric mean radiusof rm=25 nm. Here, the impact of pressure on the formation of icecrystals is shown using values ofp=200/300/400 hPa. In contrastto the simulations showed in Fig.10, we use realistic backgroundconcentrations for the sulphuric acid aerosol (nc=300cm−3). Thisleads to less ice crystals for low temperatures and/or high verticalvelocities due to a limited reservoir of solution droplets.
the previously shown cases at higher vertical velocities(w>50 cm s−1) where the non-linear behaviour of both, the
www.atmos-chem-phys.net/9/685/2009/ Atmos. Chem. Phys., 9, 685–706, 2009

700 P. Spichtinger and K. Gierens: Modelling cirrus clouds – Part 1a
0.001
0.01
0.1
1
10
100
1000
10000
1 10 100 1000
ice
crys
tal n
umbe
r de
nsity
(cm
-3)
vertical velocity (cm/s)
KL02, T=196KKL02, T=216KKL02, T=233K
refdt=0.1sdt=0.5sdt=1.0sdt=2.0s
0.001
0.01
0.1
1
10
100
1000
10000
1 10 100 1000
ice
crys
tal n
umbe
r de
nsity
(cm
-3)
vertical velocity (cm/s)
KL02, T=196KKL02, T=216KKL02, T=233K
refdt=0.1sdt=0.5sdt=1.0sdt=2.0s
Fig. 13. Box model calculations for the homogeneously formed icecrystal number densities depending on the vertical velocity and onthe temperature. For comparison, the values from detailed micro-physics calculations inKarcher and Lohmann(2002a) are shown.For the simulations, we assume a fixed width for the aerosol distri-bution ofσr=1.4 and a geometric mean radius ofrm=25 nm. Here,the impact of the prescribed (fixed) time step (dt=0.1/0.5/1.0/2.0)for the simulations is shown, compared to simulations using anadapted time step (simulation “ref”, red line). For the simulationsshown at the top panel, the background aerosol reservoir is large,while for the simulations at the bottom panel, we used a realisticbackground aerosol concentration (nc=300cm−3).
nucleation process and the depositional growth introducelarge deviations from the reference cases. The deviationsare more severe for higher than colder temperatures. Crys-tal growth proceeds faster at warmer than at colder tempera-tures, which means that the duration of the nucleation pulseincreases with decreasing temperature. When the nucleationevent is not resolved, its duration will be overestimated andtoo much crystals will form. This effect is evidently the moresevere the shorter is the nucleation pulse; i.e. the largest erroroccurs at the warmest temperature considered.
4.2 Formation and evolution of an arctic cirrostratus
In this section we compare the performance of our bulk mi-crophysics scheme with the spectrally resolving schemes ofLin et al. (2005) andKarcher(2005) for the case of an arcticcirrostratus triggered by a constant vertical updraught.
4.2.1 Setup
We use the following setup for our simulations: Thewhole 2D model domain (0≤x≤6.3 km, 2≤z≤11 km) islifted up adiabatically with a constant updraught velocity ofw=0.05 m s−1 as described inKarcher(2005). This is equiv-alent to a constant cooling of the background profileTe with arate of dT /dt=dT /dz·dz/dt=−g/cp·w =−0.000489 K/s.The same cooling rate was used in the box model simulationsin Sect.4.1. The cooling is adiabatic (i.e.θe is constant), andis continued for a total simulation time ofts=7 h. In Fig.14the initial profiles for the simulations are shown.
We use a horizontal resolution of1x=100 m with a hor-izontal extension of 6.3 km, cyclic boundary conditions inx-direction, a vertical resolution of1z=10 m and a dynam-ical time step of1t=1 s. According to our discussion inSect.4.1.3, there is no need of a small microphysical timestep for the moderate vertical updraught in this case. Forthe background aerosol (H2SO4) we use a number densityof na=Naρ=300 cm−3 with geometric standard deviationσr=1.4 and geometric mean radius ofrm=25 nm for thelognormal distribution, as these values gave good results inSect.4.1.
4.2.2 Results
For our comparisons we mostly refer to the simulation byKarcher(2005), because he also parameterised homogeneousnucleation according toKoop et al.(2000).
In Fig. 15 the time evolution of the variables relative hu-midity wrt ice, ice crystal mass and number concentrations,resp., are shown.
The first nucleation event occurs att≈60 min. The super-saturation peak of about 154% RHi triggers homogeneousnucleation. Within a few minutes a large amount of ice crys-tals (Ncρ∼100 L−1) is formed. Because of the high supersat-uration the ice crystals can grow quickly and deplete a frac-tion of the water vapour, which reduces the relative humidity,see Fig.16. Ice crystals grow and soon start to fall. There-fore the peak of high supersaturation at the top of the ISSR isinfluenced very weakly by the depletion of the water vapour.The peak is permanently maintained for the whole simulationtime and is a permanent source for homogeneous nucleationat the top of the ISSR.
The combination of crystal growth and sedimentationcauses two effects: On the one hand, the supersaturation isreduced by crystal growth such that the relative humiditycannot reach the threshold for homogeneous nucleation in
Atmos. Chem. Phys., 9, 685–706, 2009 www.atmos-chem-phys.net/9/685/2009/

P. Spichtinger and K. Gierens: Modelling cirrus clouds – Part 1a 701
P. Spichtinger and K. Gierens: Modelling Cirrus Clouds. Part 1a 17
4000
5000
6000
7000
8000
9000
10000
11000
200 300 400 500 600
altit
ude
(m)
pressure (hPa)
initial pISSR
4000
5000
6000
7000
8000
9000
10000
11000
200 210 220 230 240 250al
titud
e (m
)temperature (K)
initial TISSR
4000
5000
6000
7000
8000
9000
10000
11000
285 290 295 300 305 310
altit
ude
(m)
potential temperature (K)
initial thetaISSR
4000
5000
6000
7000
8000
9000
10000
11000
0 20 40 60 80 100 120 140 160
altit
ude
(m)
relative humidity wrt ice (%)
initial RHiISSR
Fig. 14. Initial vertical profiles (pressure, temperature, potential temperature and relative humidity wrt ice) for the simulations of a synopti-cally driven cirrostratus.
5
5
5
5
5 5 5
1010
10 10
100100
alti
tud
e (m
)
time (min)
4000
4500
5000
5500
6000
6500
7000
7500
8000
8500
9000
9500
10000
10500
11000
0 60 120 180 240 300 360 420
28 34 40 46 52 58 64 70 76 82 88 94 100 106 112 118 124 130 136 142 148 154 160 166 172 RHi (%)
Fig. 15. Time evolution of the simulated cirrostratus lifted with aconstant vertical velocity of w = 0.05 m s−1. The colours indicaterelative humidity wrt ice, while lines indicate ice crystal numberdensities (black, in L−1, ∆nc = 10L−1) and ice water content(purple, in mg m−3, ∆IWC = 1mg m−3)
layer would everywhere lead to nucleation, then the crystalswould grow until the excess vapour would be consumed overthe whole depth of the layer. Sedimentation obviously playsa crucial role for the development and the structure of thesimulated cirrus cloud and for the maintenance of supersatu-ration within the cloud.
The first nucleation event forms a large number of ice crys-tals. Many crystals fall downwards, resulting in a down-ward moving peak of high ice crystal number densities infig. 17. These results agree qualitatively well with those ofKarcher (2005), yet there are differences in details. For in-stance, the in–cloud supersaturation is higher in our simula-tion than in Karcher’s. This is simply a consequence of dif-ferent assumptions of crystal shape in the two codes. Whilewe use hexagonal columns with an aspect ratio ra > 1 forcrystal lengths L ≥ 7.42µm, Karcher (2005) assumes spher-
8000
8100
8200
8300
8400
8500
8600
8700
8800
8900
9000
9100
9200
120 130 140 150 160
altit
ude
(m)
relative humidity wrt ice (%)
t=60mint=70mint=90min
Fig. 16. Temporal evolution of the vertical RHi profiles for simu-lation time 60 ≤ t ≤ 90 min. The notch of the profile due to icecrystal growth is represented clearly, while the supersaturation atthe cloud top remains.
ical crystals (ra = 1) for crystal lengths up to L ∼ 25µm;spherical crystals always grow faster than columns. Hencehigh supersaturation can be maintained for a longer period inour simulation than in Karcher’s. Second, our treatment ofsedimentation is more diffusive than that of Karcher (2005)who uses a particle approach with the advection scheme byWalcek (2000). Numerical diffusion in the double–momentscheme (see Wacker and Seifert, 2001) leads to smoothingof vertical gradients in ice crystal number concentrations andcloud ice mixing ratio, such that peak values are smaller thanin Karcher (2005).
In spite of these differences in details we find that our bulkmicrophysics scheme is able to well reproduce the main fea-tures of the arctic cirrostratus case, namely:
– High supersaturation at the top of the cloud with contin-uously ongoing homogeneous nucleation;
Fig. 14. Initial vertical profiles (pressure, temperature, potential temperature and relative humidity wrt ice) for the simulations of a synopti-cally driven cirrostratus.
5
5
5
5
5 5 5
1010
10 10
100100
alti
tud
e (m
)
time (min)
4000
4500
5000
5500
6000
6500
7000
7500
8000
8500
9000
9500
10000
10500
11000
0 60 120 180 240 300 360 420
28 34 40 46 52 58 64 70 76 82 88 94 100 106 112 118 124 130 136 142 148 154 160 166 172 RHi (%)
Fig. 15. Time evolution of the simulated cirrostratus lifted with aconstant vertical velocity ofw=0.05 m s−1. The colours indicaterelative humidity wrt ice, while lines indicate ice crystal numberdensities (black, in L−1, 1nc=10L−1) and ice water content (pur-ple, in mg m−3,1IWC = 1mg m−3).
the lower part of the cloud. On the other hand, the fallingice crystals formed at the top of the cloud are the only sinkfor the water vapour. Although the continuous homogeneousnucleation events permanently form new ice crystals, theseare spread vertically over the whole cloud depth resulting inrelatively low number densities. Thus, inside the cloud, icesupersaturation is maintained. If there were no sedimenta-tion or if it were very weak, the cooling in the supersaturatedlayer would everywhere lead to nucleation, then the crystalswould grow until the excess vapour would be consumed overthe whole depth of the layer. Sedimentation obviously playsa crucial role for the development and the structure of thesimulated cirrus cloud and for the maintenance of supersatu-ration within the cloud.
The first nucleation event forms a large number of ice crys-tals. Many crystals fall downwards, resulting in a downwardmoving peak of high ice crystal number densities in Fig.17.
8000
8100
8200
8300
8400
8500
8600
8700
8800
8900
9000
9100
9200
120 130 140 150 160
altit
ude
(m)
relative humidity wrt ice (%)
t=60mint=70mint=90min
Fig. 16. Temporal evolution of the vertical RHi profiles for simula-tion time 60≤t≤90 min. The notch of the profile due to ice crystalgrowth is represented clearly, while the supersaturation at the cloudtop remains.
These results agree qualitatively well with those ofKarcher(2005), yet there are differences in details. For in-stance, the in-cloud supersaturation is higher in our simula-tion than in Karcher’s. This is simply a consequence of dif-ferent assumptions of crystal shape in the two codes. Whilewe use hexagonal columns with an aspect ratiora>1 forcrystal lengthsL≥7.42µm, Karcher(2005) assumes spheri-cal crystals (ra=1) for crystal lengths up toL∼25µm; spher-ical crystals always grow faster than columns. Hence highsupersaturation can be maintained for a longer period inour simulation than in Karcher’s. Second, our treatment ofsedimentation is more diffusive than that ofKarcher(2005)who uses a particle approach with the advection scheme byWalcek(2000). Numerical diffusion in the double-momentscheme (seeWacker and Seifert, 2001) leads to smoothingof vertical gradients in ice crystal number concentrations andcloud ice mixing ratio, such that peak values are smaller thanin Karcher(2005).
www.atmos-chem-phys.net/9/685/2009/ Atmos. Chem. Phys., 9, 685–706, 2009

702 P. Spichtinger and K. Gierens: Modelling cirrus clouds – Part 1a
7500
8000
8500
9000
9500
0 10 20 30 40 50 60 70 80 90 100 110 120 130
altit
ude
(m)
ice crystal number density (1/L)
t= 70 mint= 90 min
t=120 mint=150 min
Fig. 17. Downward moving peak of high ice crystal number densi-ties formed by the first homogeneous nucleation event att≈60 minin the reference simulation (i.e. constant uplift ofw=0.05 m s−1).At the top of the cloud there is continuous nucleation, indicated bythe high peak values of ice crystal number density.
In spite of these differences in details we find that our bulkmicrophysics scheme is able to well reproduce the main fea-tures of the arctic cirrostratus case, namely:
– High supersaturation at the top of the cloud with contin-uously ongoing homogeneous nucleation;
– Significant supersaturation within the cloud for thewhole simulation time;
– Downward moving peak of high ice crystal number con-centrations formed at the first nucleation event.
Lin et al. (2005) noted that high vertical resolution isneeded for the reproduction of these features. We havechecked this issue using various resolutions in the range5≤z≤50 m. It turned out that the number of ice crystalsthat are produced is underestimated with too coarse verti-cal resolution, which occurs when the continuous nucleationsource at the cloud top is unresolved. This renders the su-persaturation inside the cloud too high. Results change onlymarginally between simulations with resolutions of1z=5 mand1z=10 m. Therefore, we used1z=10 m.
Regarding the occurrence of ice supersaturation inside cir-rus clouds we want to remark that this feature is not limited tothe very cold temperature range in the tropics (an example ispresented byGao et al., 2004). Also in the temperature rangeof midlatitude and arctic cirrus clouds ice supersaturationinside the clouds can be found frequently, see for instancethe results ofOvarlez et al.(2002); Comstock et al.(2004);Kramer et al.(2008) and also the recent SPARC newsletterabout the supersaturation issue (Peter et al., 2008).
5 Conclusions
We have described a new bulk microphysics parameterisationfor simulation of cirrus clouds on the cloud resolving scale.In the two-moment scheme the processes nucleation (homo-geneous and heterogeneous), deposition growth/sublimationand sedimentation of ice crystals are implemented. An arbi-trary number of ice classes can be treated that are discrimi-nated by their formation mechanism. Each ice class is con-nected to an aerosol type that freezes into the respective iceclass. We tried to formulate process rates as functions ofgeneral moments of the assumed underlying ice mass distri-bution in order to keep the model flexible enough that var-ious kinds of mass distribution can be chosen. Currentlywe use log-normal distributions for the aerosol and the icemasses. The new parameterisation was implemented intoa simple box model and into the anelastic, non-hydrostaticmodel EULAG.
In a first validation step we compared the ice crystal num-ber densities generated during box model simulations with asteady and constant updraught with results from a box modelthat was equipped with a more detailed microphysics scheme(Karcher and Lohmann, 2002a). The agreement of our re-sults with the results from the detailed model was very good.Additionally we used the box model to study the impact ofthe ambient pressure on the generated ice crystal numberconcentrations. Also, for realistic background aerosol condi-tions simulations were carried out. In this case we could findthat the background aerosol acts as a limiting factor, i.e. theproduced ice crystal number density is strongly reduced inthe low temperature range in combination with high verticalvelocities (consistent with results ofKay and Wood, 2008).This partly offsets the underestimation of ice crystal numberdensities of our parameterisation. Additionally, the pressuredependence of the parameterisation was investigated.
In a second validation step we simulated the case of anarctic cirrostratus using EULAG as a 1-D column model first.Also in this case the agreement with a much more detailedmicrophysical model (Karcher, 2005) was very good.
These studies led to the following conclusions:
– The model is validated against models with detailed mi-crophysics and produces reliable results;
– Sedimentation is of utmost importance in the evolutionof the cloud structure and the in-cloud humidity field;
– Persistent in-cloud supersaturation is found in our sim-ulations consistent withKarcher(2005).
Finally, we conclude that the model is suitable to representcirrus clouds in cloud-resolving simulations. In the secondpart of our study (Spichtinger and Gierens, 2009), we will in-vestigate the validation case of an arctic cirrostratus carefullyin terms of changing the large scale dynamics (i.e. updraughtvelocity) and in terms of possible changes due to 2-D effects
Atmos. Chem. Phys., 9, 685–706, 2009 www.atmos-chem-phys.net/9/685/2009/
P. Spichtinger and K. Gierens: Modelling cirrus clouds – Part 1a 703
introduced by temperature fluctuations and wind shear. Infuture applications the model will be used for investigatingthe effects of the competition of different nucleation mech-anisms (Spichtinger and Gierens, 2008) and for the multi-scale problem of the impact of mesoscale dynamics on theformation and evolution of cirrus clouds (as inSpichtingerand Dornbrack, 2006).
Appendix A: Notation
a long half axis of spheroida(p, T ) factor for Koenig’s approximation (abbrev. bya)aw water activity in the solutionaiw water activity in the solution in equilib. with iceA Ice crystal surfaceA′
=√a2 − b2
b short half axis of spheroidb(p, T ) exponent for Koenig’s approximation (abbrev. byb)C Capacitance factorcp heat capacity for constant pressurec(T , p) correction factor for sedimentationDDt
advection operator/total derivativeD ice crystal diameterDv Diffusion constante water vapour pressuree∗i saturation water vapour pressure over icee∗w saturation water vapour pressure over waterFθ additional forcing for potential temperaturef Coriolis vectorf (m) ice crystal mass distributionf1 correction, kinetic growth regime (mass growth rate)f2 correction, ventilation (mass growth rate)f ∗
1 correction, kinetic growth regime (latent heat release)f ∗
2 correction, ventilation (latent heat release)fa(m) aerosol mass distributionf ′a(m) aerosol mass distribution, normalised to 1fm mass concentration fraction (aerosol)fn number concentration fraction (aerosol)fN number concentration fraction (ice)fq mass concentration fraction (ice)g gravity vectorg gravitational accelerationL ice crystal lengthLi i = 1,2,3 transition sizes for terminal velocityLm geometric mean size in lognormal distributionl∗m reference length for kinetic correction (mass)l∗Q reference length for kinetic correction (heat)Ls latent heat of sublimationLt transition size between spherical crystals and columnsM metric termm (ice crystal) massm mean massm0(p, T ) mass for appr. in Eq. (38) (abbrev.m0)mi i=1,2,3 transition masses for terminal velocity
mm geometric mean mass in lognormal distributionmpre predominant massmt transition mass between spherical crystals and columnsMw molecular weight of water vapourNa aerosol number concentration per kg dry airna aerosol number density (na=Naρ) per m3 dry airNc ice crystal number concentration per kg dry airnc ice crystal number density (nc=Ncρ) per m3 dry airNPr Prandtl numberNRe Reynolds numberNSc Schmidt numberP freezing probabilityp pressurep′ pressure deviationp0 reference pressure = 101 325 hPap0,1 reference pressure = 30 000 hPap0,2 reference pressure = 81 500 hPape pressure, environmental stateqa aerosol mass mixing ratioqc cloud ice mass mixing ratioqv specific humidityqve specific humidity, environmental stater radiusr∗ effective crystal radius for growthr0 ratio of predominant and mean massra aspect ratiord radius of solution dropletsrm geometric mean radius in lognormal distributionR universal gas constantRg ideal gas constant for dry airRv ideal gas constant for water vapourRH relative humidity with respect to waterRHi relative humidity with respect to icet timets simulation timeT temperatureTe temperature, environmental stateT0 reference temperature =273.15 KT0,1 reference temperature =233 KT0,2 reference temperature =270 KTS temperature at ice surfaceu velocity fieldu′ velocity field deviationue velocity field, environmental stateu horizontal windur average thermal velocity of air moleculesVd solution droplet volumev(m) terminal velocity of a single ice crystalv0(m) reference terminal velocity of a single ice crystalvm mass weighted terminal velocityvn number weighted terminal velocityw vertical velocityww H2O weight fractionx horizontal coordinate
www.atmos-chem-phys.net/9/685/2009/ Atmos. Chem. Phys., 9, 685–706, 2009

704 P. Spichtinger and K. Gierens: Modelling cirrus clouds – Part 1a
x coefficient for terminal velocityy coefficient for terminal velocityz vertical coordinate
α exponent for mass/number fraction (Eq.29)αd deposition coefficientβd thermal accommodation coefficientγ (p, T ) exponent for appr. in Eq. (38) (abbrev.γ )γ (m) factor for terminal velocityδ coefficient for approximation in (Eq.38)δ(m) exponent for terminal velocityε′ eccentricity of an ellipseε ratio of gas constants for dry air and water vapourεp = (1/ε)− 1µk kth moment of probability distributionfρ air densityρ air density, base stateρb bulk ice densityρd solution densityρs,i saturated water vapour density at crystal surfaceρv water vapour partial densityσL geometric std. dev., size distribution (ice)σm geometric std. dev., mass distribution (ice)σr geometric std. dev., radius distribution (aerosol)θ potential temperatureθ ′ potential temperature deviationθd density potential temperature, (Eq.4)θ ′
d density potential temperature deviationθde density potential temperature, environmental stateθe potential temperature, environmental stateθ potential temperature, base state
Acknowledgements.We are grateful to Piotr K. Smolarkiewiczfor sharing his model and Andreas Dornbrack for help in usingthe model. Both of these and Marcia Baker, Bernd Karcher,Ulrike Lohmann, Thomas Peter, Olaf Stetzer and Marian deReusstimulated the work with many fruitful discussions. This study con-tributes to the DFG (German research foundation) project “DunnerZirrus” (GI 333/1-1) and to the DLR/HGF-project “Particles andCirrus Clouds” (PAZI-2). The numerical simulations were carriedout at the European Centre for Medium-Range Weather Forecasts(special project “Ice supersaturation and cirrus clouds”).
Edited by: P. Haynes
References
Barthazy, E. and Schefold, R.: Fall velocity of snowflakes of differ-ent riming degree and crystal types, Atmos. Res., 82, 391–398,2006.
Bailey, M. and J. Hallet, 2004: Growth rates and habits of ice crys-tals between –20 and –70◦C, J. Atmos. Sci., 61, 514–544.
Bunz, H., Benz, S., Gensch, I., and Kramer, M.: MAID: a model tosimulate UT/LS aerosols and ice clouds, Environ. Res. Lett., 3,035001, doi: 10.1088/1748-9326/3/3/035001, 2008.
Chen, T., Rossow, W. B., and Zhang, Y.: Radiative Effects of Cloud-Type Variations, J. Climate, 13, 264–286, 2000.
Chiruta, M. and Wang, P. K.: The capacitance of solid and hol-low hexagonal ice columns, Geophys. Res. Lett., 32, L05803,doi:10.1029/2004GL021771, 2005.
Comstock, J., Ackerman, T. P., Turner, D. D.: Evidence ofhigh ice supersaturation in cirrus clouds using ARM Ra-man lidar measurements, Geophys. Res. Lett., 31, L11106,doi:10.1029/2004GL019705, 2004.
Emanuel, K.: Atmospheric convection. Oxford University Press,580 pp., 1994.
Fusina, F., Spichtinger, P., and Lohmann, U.: The im-pact of ice supersaturated regions and thin cirrus on radia-tion in the mid latitudes, J. Geophys. Res., 112, D24S14,doi:10.1029/2007JD008449, 2007.
Gao, R. S., Popp, P.J., Fahey, D.W., et al.: Evidence that nitric acidincreases relative humidity in low-temperature cirrus clouds, Sci-ence, 303, 516–520, 2004.
Gayet, J.-F., Shcherbakov, V., Mannstein, H., Minikin, A., Schu-mann, U., Strom, J., Petzold, A., Ovarlez, J., and Immler, F.:Microphysical and optical properties of midlatitude cirrus cloudsobserved in the southern hemisphere during INCA, Q. J. Roy.Meteror. Soc., 132, 2719–2748, 2006.
Gettelman, A., Fetzer, E. J., Eldering, A., Irion, F. W.: The globaldistribution of supersaturation in the upper troposphere from theatmospheric infrared sounder, J. Climate, 19, 6089–6103, 2006.
Gierens, K.: Numerical simulations of persistent contrails, J. At-mos. Sci., 53, 3333–3348, 1996.
Gierens, K. M. and Strom, J.: A numerical study of aircraft wake in-duced ice cloud formation, J. Atmos. Sci. 55, 3253–3263, 1998.
Gierens, K., Schumann, U., Helten, M., Smit, H., and Marenco, A.:A distribution law for relative humidity in the upper troposphereand lower stratosphere derived from three years of MOZAICmeasurements, Ann. Geophys., 17, 1218–1226, 1999,http://www.ann-geophys.net/17/1218/1999/.
Gierens, K.: On the transition between heterogeneous and homoge-neous freezing, Atmos. Chem. Phys., 3, 437–446, 2003,http://www.atmos-chem-phys.net/3/437/2003/.
Gierens, K., Monier, M., and Gayet, J.-F.: The deposition coeffi-cient and its role for cirrus clouds, J. Geophys. Res., 108, 4069,doi:10.1029/2001JD001558, 2003.
Grabowski, W. and Smolarkiewicz, P.: A multiscale anelastic modelfor meteorological research, Mon. Weather Rev., 130, 939–956,2002.
Haag, W., Karcher, B., Schurath, U., Mohler, O., Stetzer, O., Schae-fers, S., Schiller, C., and Kramer, M.: Numerical simulations ofhomogeneous freezing processes in the aerosol chamber AIDA,Atmos. Chem. Phys., 3, 195–210, 2003a,http://www.atmos-chem-phys.net/3/195/2003/.
Haag, W. and Karcher, B., Strom, J., Minikin, A., Lohmann, U.,Ovarlez, J., and Stohl, A.: Freezing thresholds and cirrus cloudformation mechanisms inferred from in situ measurements of rel-ative humidity, Atmos. Chem. Phys., 3, 1791–1806, 2003b,http://www.atmos-chem-phys.net/3/1791/2003/.
Haag, W. and Karcher, B.: The impact of aerosols and gravity waveson cirrus clouds at midlatitudes, J. Geophys. Res., 109, D12202,doi:10.1029/2004JD00457, 2004.
Hall, W. D. and Pruppacher, H. R.: The survival of ice particlesfalling from cirrus clouds in subsaturated air, J. Atmos. Sci., 33,
Atmos. Chem. Phys., 9, 685–706, 2009 www.atmos-chem-phys.net/9/685/2009/
P. Spichtinger and K. Gierens: Modelling cirrus clouds – Part 1a 705
1995–2006, 1976.Harrington, J. Y., Meyers, M. P., Walko, R. L., and Cotton, W. R.:
Parameterization of ice crystal conversion processes due to va-por deposition for mesoscale models using double-moment basisfunctions. Part I: Basic formulation and parcel model test, J. At-mos. Sci., 52, 4344–4366, 1995.
Heymsfield, A. J. and Sabin, R. M.: Cirrus crystal nucleation byhomogeneous freezing of solution droplets, J. Atmos. Sci., 46,2252–2264, 1989.
Heymsfield, A. and Iaquinta, J.: Cirrus crystal terminal velocities,J. Atmos. Sci., 57, 916–938, 2000.
Heymsfield, A. and McFarquhar, G. M.: Mid-latitude and tropi-cal cirrus: Microphysical properties. In:Cirrus [D.K. Lynch, K.Sassen, D. O’C. Starr, G. Stephens (Eds.)]. Oxford UniversityPress, Oxford, U.K., 78–101, 2002
Holler, H.: Parameterization of cloud-microphysical processes ina three-dimensional convective mesoscale model, Forschungs-bericht, Deutsche Forschungs- und Versuchsanstalt fur Luft- undRaumfahrt, DFVLR FB 86-02, 82 pp., ISSN 0171-1342, 1986.
Hoyle, C., Luo, B., and Peter, T.: The origin of high ice crystalnumber densities in cirrus clouds, J. Atmos. Sci., 62, 2568–2579,2005.
IPCC: Climate Change 2007: The Physical Science Basis. in: Con-tribution of Working Group I to the Fourth Assessment Reportof the Intergovernmental Panel on Climate Change, edited by:Solomon, S., Qin, D., Manning, M., Chen, Z.,Marquis, M., Av-eryt, K. B., Tignor, M., and Miller, H. L., Cambridge UniversityPress, Cambridge, United Kingdom and New York, NY, USA,996 pp., 2007.
Jawitz, J. W.: Moments of truncated continuous univariate distribu-tions, Adv. Water Res., 27, 269–281, 2004.
Jensen, E. J., Toon, O. B., Westphal, D. L., Kinne, S., and Heyms-field, A. J.: Microphysical modeling of cirrus 1. Comparisonwith 1986 FIRE IFO measurements, J. Geophys. Res., 99(D5),10421–10442, doi:10.1029/93JD02334, 1994.
Kajikawa, M. and Heymsfield, A.: Aggregation of ice crystals, J.Atmos. Sci., 46, 3108–3121, 1989.
Karcher, B.: Supersaturation, dehydration, and denitrification inArctic cirrus, Atmos. Chem. Phys., 5, 1757–1772, 2005,http://www.atmos-chem-phys.net/5/1757/2005/.
Karcher, B. and Lohmann, U.: A Parameterization of cirrus cloudformation: Homogeneous freezing of supercooled aerosols,J. Geophys. Res., 107(D2), 4010, doi:10.1029/2001JD000470,2002a.
Karcher, B. and Lohmann, U.: A parameterization of cir-rus cloud formation: Homogeneous freezing including ef-fects of aerosol size, J. Geophys. Res., 107, D23, D01205,doi:10.1029/2001JD001429, 2002b.
Karcher, B., Hendricks, J., and Lohmann, U.: Physically-based parameterization of cirrus cloud formation for use inglobal atmospheric models, J. Geophys. Res., 111, D01205,doi:10.1029/2005JD006219, 2006.
Kay, J. and Wood, R.: Timescale analysis of aerosol sensitivityduring homogeneous freezing and implications for upper tropo-spheric water vapor budgets, Geophys. Res. Lett., 35, L10809,doi:10.1029/2007GL032628, 2008.
Kessler, E.: On the distribution and continuity of water substancein atmospheric circulations, Meteor. Monogr., 32, Am. Meteorol.Soc., 84 pp., Boston, 1969.
Koenig, L.: Numerical modeling of ice deposition, J. Atmos. Sci.,28, 226–237, 1971.
Koop, T., Luo, B., Tsias, A., and Peter, T.: Water activity as the de-terminant for homogeneous ice nucleation in aqueous solutions,Nature 406, 611–614, 2000.
Kramer, M., Schiller, C., Afchine, A., Bauer, R., Gensch, I., Man-gold, A., Schlicht, S., Spelten, N., Sitnikov, N., Borrmann, S., deReus, M., Spichtinger, P.: Ice supersaturations and cirrus cloudcrystal numbers, Atmos. Chem. Phys. Discuss., 8, 21089–21128,2008,http://www.atmos-chem-phys-discuss.net/8/21089/2008/.
Lee, S.-H., Wilson, J. C. Baumgardner, D., Herman, R. L., We-instock, E. M., LaFleur, B. G., Kok, G., Anderson, B., Law-son, P., Baker, B., Strawa, A., Pittman, J. V., Reeves, J. M.,and Bui, T. P.: New particle formation observed in the trop-ical/subtropical cirrus clouds, J. Geophys. Res., 109, D20209,doi:10.1029/2004JD005033, 2004.
Libbrecht, K. G.: The physics of snow crystals, Rep. Prog. Phys.,68, 855–895, 2005.
Lin, R.-F., Starr, D., DeMott, P., Cotton, R., Sassen, K., Jensen,E., Karcher, B., and Liu, X.: Cirrus Parcel Model ComparisonProject. Phase 1: The critical components to simulate cirrus ini-tiation explicitly, J. Atmos. Sci., 59, 2305–2329, 2002.
Lin, R.-F., Starr, D., Reichardt, J., and DeMott, P.: Nucleation insynoptically forced cirrostratus, J. Geophys. Res., 110, D08208,doi:10.1029/2004JD005362, 2005.
Liu, X., Penner, J. E., Ghan, S. J., and Wang, M.: Inclusion ofIce Microphysics in the NCAR Community Atmospheric ModelVersion 3 (CAM3), J. Climate, 20, 4526–4547, 2007.
Lohmann, U. and Karcher, B.: First interactive simulations of cirrusclouds formed by homogeneous freezing in the ECHAM GCM,J. Geophys. Res., 107, 4105, doi:10.1029/2001JD000767, 2002.
Magee, N., Moyle, A. M., Lamb, D.: Experimental deter-mination of the deposition coefficient of small cirrus-likeice crystals near−50◦C, Geophys. Res. Lett., 33, L17813,doi:10.1029/2006GL026665, 2006.
McDonald, J. E.: Use of the electrostatic analogy in studies of icecrystal growth, ZAMP, 14, 610–620, 1963
Meyers, M. P., DeMott, P. J., and Cotton, W. R.: New primary ice-nucleation parameterizations in an explicit cloud model, J. Appl.Meteorol., 31, 708–721, 1992.
Minikin, A., Petzold, A., Strom, J., Krejci, R., Seifert, M., vanVelthoven, P., Schlager, H., and Schumann, U.: Aircraft observa-tions of the upper tropospheric fine particle aerosol in the North-ern and Southern Hemispheres at midlatitudes, Geophys. Res.Lett., 30, 1503, doi:10.1029/2002GL016458, 2003.
Murphy, D. and Koop, T.: Review of the vapour pressure of iceand supercooled water for atmospheric applications, Q. J. Roy.Meteror. Soc., 131, 1539–1565, 2005.
Ovarlez, J., Gayet, J.-F., Gierens, K., Strom, J., Ovarlez, H., Au-riol, F., Busen, R.,Schumann,U.: Water vapor measurements in-side cirrus clouds in northern and southern hemispheres duringINCA, Geophys. Res. Lett., doi:10.1029/2001GL014440, 2002.
Peter, T., Marcolli, C., Spichtinger, P., Corti, T., Baker M. B., andKoop, T.: When dry air is too humid, Science, 314 (5804), 1399–1400, 2006.
Peter, T., Kraemer, M., and Moehler, O.: Upper Tropospheric Hu-midity, SPARC/WCRP Newsletter 30, 9–15, 2008.
Phillips, V. T. J., Choularton, T. W., Illingworth, A. J., Hogan, R. J.,
www.atmos-chem-phys.net/9/685/2009/ Atmos. Chem. Phys., 9, 685–706, 2009

706 P. Spichtinger and K. Gierens: Modelling cirrus clouds – Part 1a
and Field, P. R. Simulations of the glaciation of a frontal mixed-phase cloud with the Explicit Microphysics Model, Q. J. Roy.Meteror. Soc., 129, 1351–1371, 2003.
Pruppacher, H. and Klett, J.: Microphysics of Clouds and Precipi-tation, Kluwer Acad. Pub., Dordrecht, 954 pp., 1997
Reisner, J., Rasmussen, R. M., and Bruintjes, R. T.: Explicit fore-casting of supercooled liquid water in winter storms using theMM5 mesoscale model, Q. J. Roy. Meteror. Soc., 124, 1071–1107, 1998.
Sassen, K. and Dodd, G. C.: Homogeneous nucleation rate forhighly supercooled cirrus cloud droplets, J. Atmos. Sci., 45,1357–1369, 1988.
Sassen, K. and Dodd, G. C.: Haze particle nucleation simulationsin cirrus clouds, and applications for numerical and lidar studies,J. Atmos. Sci., 46, 3005–3014, 1989.
Schroder, F., Karcher, B., Duroure, C., Strom, J., Petzold, A., Gayet,J.-F., Strauss, B., Wendling, P., and Borrmann, S.: On the transi-tion of contrails into cirrus clouds, J. Atmos. Sci., 57, 464–480,2000.
Seifert, A. and Beheng, K. D.: A two-moment cloud microphysicsparameterization for mixed-phase clouds. Part 1: Model descrip-tion, Meteorol. Atmos. Phys., 92, 45–66, 2005.
Smolarkiewicz, P. and Margolin,L.: On forward-in-time differ-encing for fluids: an Eulerian/Semi-Lagrangian non-hydrostaticmodel for stratified flows, Atmos.-Ocean., 35, 127–152, 1997.
Smolarkiewicz, P. K. and Margolin, L. G.: MPDATA: A positivedefinite solver for geophysical flows, J. Comput. Phys., 140,459–480, 1998.
Smolarkiewicz, P., Margolin, L., and Wyszogrodzki, A.: A classof nonhydrostatic global models, J. Atmos. Sci., 58, 349–364,2001.
Spichtinger, P., Gierens, K., Leiterer, U., and Dier, H.: Ice super-saturation in the tropopause region over Lindenberg, Germany,Meteorol. Z., 12, 143–156, 2003a.
Spichtinger, P., Gierens, K., and Read, W.: The global distribu-tion of ice supersaturated regions as seen by the microwave limbsounder, Q. J. Roy. Meteror. Soc., 129, 3391–3410, 2003b.
Spichtinger, P., Gierens, K., Smit, H. G. J., Ovarlez, J., and Gayet,J.-F.: On the distribution of relative humidity in cirrus clouds.Atmos. Chem. Phys., 4, 639–647, 2004,http://www.atmos-chem-phys.net/4/639/2004/.
Spichtinger, P., Gierens, K., and Wernli, H.: A case study on theformation and evolution of ice supersaturation in the vicinity ofa warm conveyor belt’s outflow region, Atmos. Chem. Phys., 5,973–987, 2005a,http://www.atmos-chem-phys.net/5/973/2005/.
Spichtinger, P., Gierens, K., and Dornbrack, A.: Formation ofice supersaturation by mesoscale gravity waves, Atmos. Chem.Phys., 5, 1243–1255, 2005b,http://www.atmos-chem-phys.net/5/1243/2005/.
Spichtinger P. and Dornbrack, A.: Microphysical modeling of oro-graphic cirrus clouds, Proceedings of the 12th AMS Conferenceon Cloud Physics, Madison, USA, 2006.
Spichtinger, P. and Gierens, K.: Modelling of cirrus clouds – Part1b: Structuring cirrus clouds by dynamics, Atmos. Chem. Phys.,9, 707–719, 2009,http://www.atmos-chem-phys.net/9/707/2009/.
Spichtinger, P. and Gierens, K. M.: Modelling of cirrus clouds –Part 2: Competition of different nucleation mechanisms, Atmos.Chem. Phys. Discuss., 8, 9061–9098, 2008,http://www.atmos-chem-phys-discuss.net/8/9061/2008/.
Starr, D. and Cox, S.: Cirrus clouds. Part I: A Cirrus Cloud Model,J. Atmos. Sci., 42, 2663–2681, 1985.
Stephens, G.: The influence of radiative transfer on the mass andheat budgets of ice crystals falling in the atmosphere, J. Atmos.Sci., 40, 1729–1739, 1983.
Tompkins, A., Gierens, K., and Radel, G.: Ice supersaturation inthe ECMWF integrated forecast system, Q. J. Roy. Meteror. Soc.,133, 53–63, 2007.
Wernli, H. and Davies, H.: A Lagrangian-based analysis of extrat-ropical cyclones. I: The method and some applications, Q. J. Roy.Meteror. Soc., 123, 467–489, 1997.
Walcek, C.: Minor flux adjustment near mixing ratio extremes fora simplified yet highly accurate monotonic calculation of traceradvection, J. Geophys. Res., 105, 9335–9348, 2000.
Wacker, U. and Seifert, A.: Evolution of rain water profiles resultingfrom pure sedimentation: Spectral vs. parameterized description,Atmos. Res., 58, 19–39, 2001.
Wendisch, M., Pilewskie, P., Pommier, J., Howard, S., Yang, P.,Heymsfield, A. J., Schmitt, C. G., Baumgardner, D., and Mayer,B.: Impact of cirrus crystal shape on solar spectral irradiance: Acase study for subtropical cirrus, J. Geophys. Res., 110, D03202,doi:10.1029/2004JD005294, 2005.
Wendisch, M., Yang, P., and Pilewskie, P.: Effects ofice crystal habit on thermal infrared radiative propertiesand forcing of cirrus, J. Geophys. Res., 112, D08201,doi:10.1029/2006JD007899, 2007.
Wood, S. E., Baker, M. B., and Calhoun, D.: New model for the va-por growth of hexagonal ice crystals in the atmosphere, J. Geo-phys. Res., 106, 4845–4870, 2001.
Atmos. Chem. Phys., 9, 685–706, 2009 www.atmos-chem-phys.net/9/685/2009/