Embed Size (px)
Citation preview

Modelling Neuroimaging Data Using the General
Linear Model (GLM©Karl)
Jesper AnderssonKI, Stockholm & BRU, Helsinki

No escaping this one
MotionCorrection
Smoothing
SpatialNormalisation
General Linear Model
Statistical Parametric Map
fMRI time-seriesParameter Estimates
Design matrix
Anatomical Reference
Overview
• The Experiment
• The Data
• The Model
• The Estimation
• The Inquisition (of the data)
• A Better Model

+
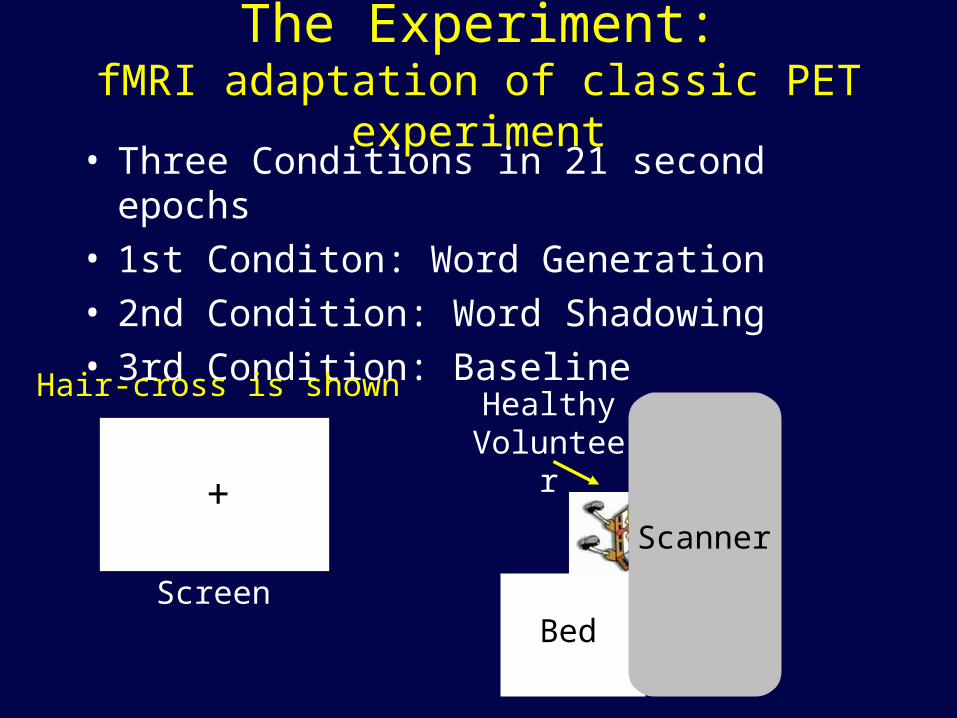
The Experiment:fMRI adaptation of classic PET experiment
Scanner
Bed
Healthy Volunteer
Screen
• Three Conditions in 21 second epochs• 1st Conditon: Word Generation

Jellyfish
The Experiment:fMRI adaptation of classic PET experiment
Scanner
Bed
Healthy Volunteer
Screen
• Three Conditions in 21 second epochs• 1st Conditon: Word Generation
Noun is presented
Catch
Verb is generated

Burger
The Experiment:fMRI adaptation of classic PET experiment
Scanner
Bed
Healthy Volunteer
Screen
• Three Conditions in 21 second epochs• 1st Conditon: Word Generation
Noun is presented
Fry
Verb is generated

Swim
The Experiment:fMRI adaptation of classic PET experiment
Scanner
Bed
Healthy Volunteer
Screen
• Three Conditions in 21 second epochs• 1st Conditon: Word Generation• 2nd Condition: Word Shadowing
Verb is presented
Swim
Verb is repeated

Strut
The Experiment:fMRI adaptation of classic PET experiment
Scanner
Bed
Healthy Volunteer
Screen
• Three Conditions in 21 second epochs• 1st Conditon: Word Generation• 2nd Condition: Word Shadowing
Verb is presented
Strut
Verb is repeated
+
The Experiment:fMRI adaptation of classic PET experiment
Scanner
Bed
Healthy Volunteer
Screen
• Three Conditions in 21 second epochs• 1st Conditon: Word Generation• 2nd Condition: Word Shadowing• 3rd Condition: Baseline
Hair-cross is shown

+
The Experiment:fMRI adaptation of classic PET experiment
Scanner
Bed
Healthy Volunteer
Screen
• Three Conditions in 21 second epochs• 1st Conditon: Word Generation• 2nd Condition: Word Shadowing• 3rd Condition: Baseline
Hair-cross is shownzzzz z z z
zzz
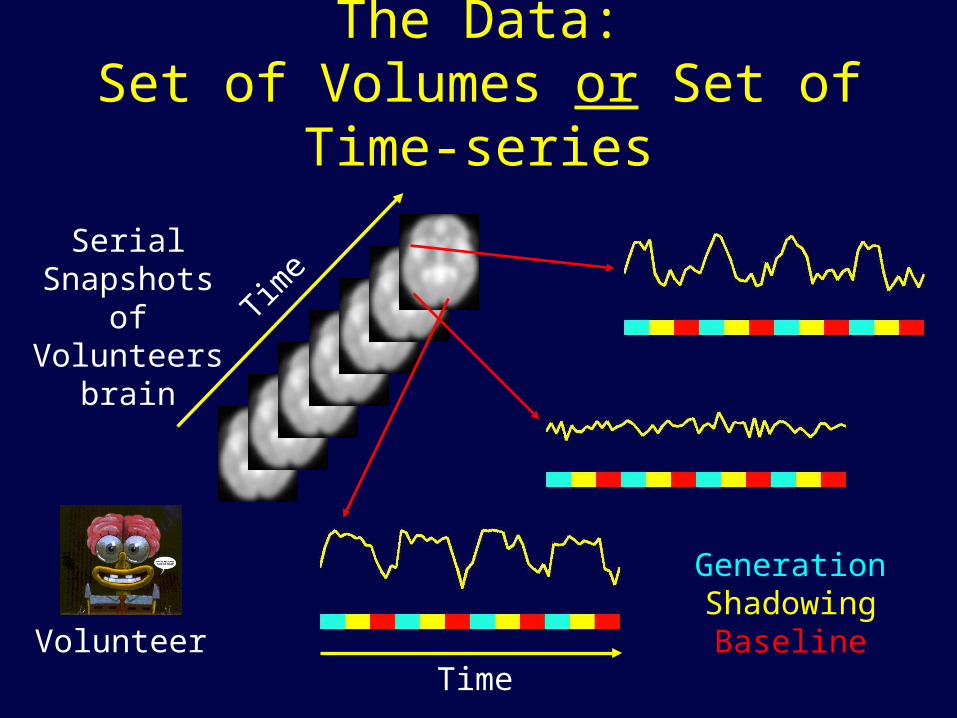
The Data:Set of Volumes or Set of Time-series
Volunteer
Time
Serial Snapshots of Volunteers
brain
Generation Shadowing
BaselineTime

Time
• A model consists of a set of assumptions of the type:
• and
The Model:A Set of Hypothetical Time-series
Generation Shadowing Baseline
”I think a voxel that is into generating words might have a time-series looking like this”
”A voxel that is into repeating, like this”
and”A voxel that just
doesn’t care, like this”

The Model:A Set of Hypothetical Time-series
Generation S
hadowing B
aseline
≈ β1∙ + β2∙ + β3∙
• For a given voxel (time-series) we try to figure out just what type that is by ”modelling” it as a linear combination of the hypothetical time-series.
Measured ”Known” Unknown ”parameters”

The Estimation:Finding the ”best” parameter values
Generation S
hadowing B
aseline
≈ β1∙ + β2∙ + β3∙
• The estimation entails finding the parameter values such that the linear combination ”best” fits the data.
2 3 4 0 1 0 1 0 1 2

The Estimation:Finding the ”best” parameter values
Generation S
hadowing B
aseline
≈ β1∙ + β2∙ + β3∙
• The estimation entails finding the parameter values such that the linear combination ”best” fits the data.
2 3 4 0 1 0 1 0 1 2
0 0 3Not brilliant

The Estimation:Finding the ”best” parameter values
Generation S
hadowing B
aseline
≈ β1∙ + β2∙ + β3∙
• The estimation entails finding the parameter values such that the linear combination ”best” fits the data.
2 3 4 0 1 0 1 0 1 2
1 0 4Neither that

The Estimation:Finding the ”best” parameter values
Generation S
hadowing B
aseline
≈ β1∙ + β2∙ + β3∙
• The estimation entails finding the parameter values such that the linear combination ”best” fits the data.
2 3 4 0 1 0 1 0 1 2
0.83 0.16 2.98Cool!

The Estimation:Finding the ”best” parameter values
Generation S
hadowing B
aseline
≈ β1∙ + β2∙ + β3∙
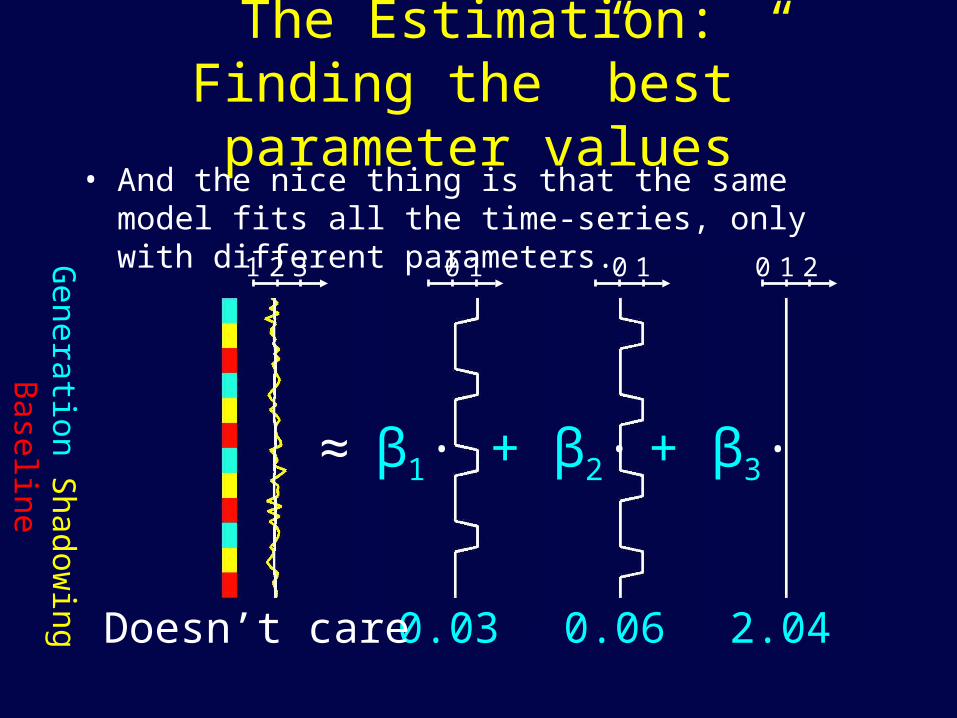
• And the nice thing is that the same model fits all the time-series, only with different parameters.
1 2 3 0 1 0 1 0 1 2
0.68 0.82 2.17Into words
The Estimation:Finding the ”best” parameter values
Generation S
hadowing B
aseline
≈ β1∙ + β2∙ + β3∙
• And the nice thing is that the same model fits all the time-series, only with different parameters.
1 2 3 0 1 0 1 0 1 2
0.03 0.06 2.04Doesn’t care

The Estimation:The format of data, model and parameters
• Same model for all voxels.
• Different parameters for each voxel.
98.2
16.0
83.0
β
04.2
06.0
03.0
β
17.2
82.0
68.0
β
beta_0001.img
beta_0002.img
beta_0003.img...
...
Time-
serie
s
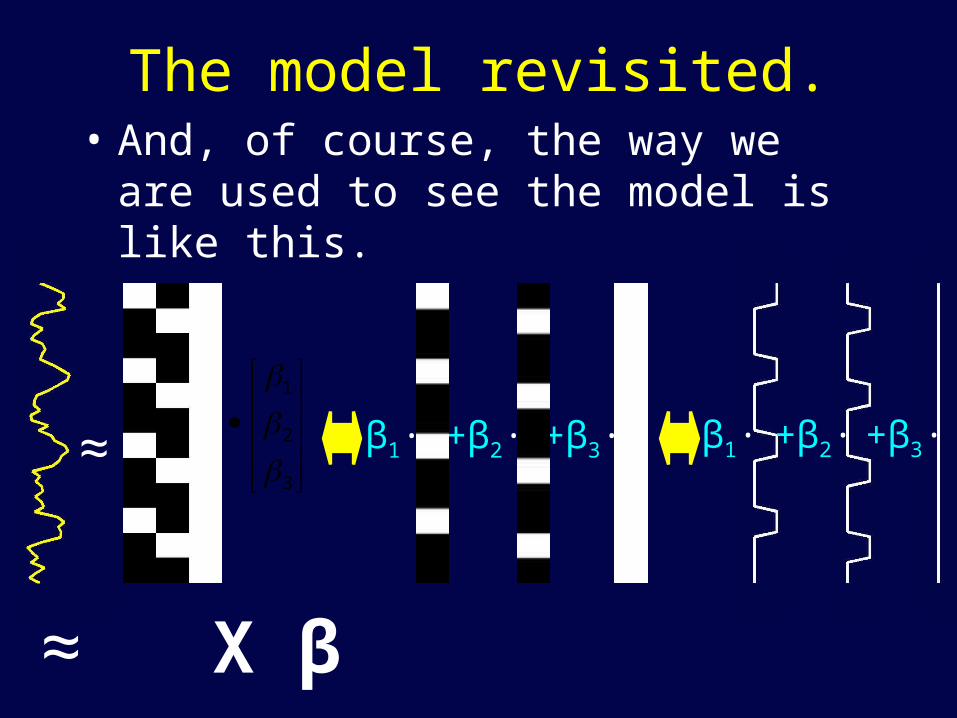
The model revisited.• And, of course, the way we are used to see
the model is like this.
β1∙ +β2∙ +β3∙≈
3
2
1
β1∙ +β2∙ +β3∙
y ≈ X β

The estimation revisitedWhat do I mean by ”best” fit
98.2
16.0
83.0
β
31.3
0
0
β – Error
– Data– Best fit
– Data– Some fit
– Error
ei
n
iie
1
0
n
iie
1
0
n
iie
1
2 16.17
n
iie
1
2 47.9

Model revisited – again
≈
3
2
1
≈
Remember?
Now, what’s that all about?
3
2
1
= +
y = Xβ+e
e ~ N(0,σ2I)
Observed Known Unknown
We need a model for the error!

Format of data revisitedbeta_0001.img
beta_0002.img
beta_0003.img
...
...
Time-
serie
s
ResMS.img
98.2
16.0
83.0
β
47.91
2
n
iie

But why do we need the error?It is about trust.

But why do we need the error?Would you trust this time-series?

But why do we need the error?Or this (why/why not)?

But why do we need the error?What about this?

But why do we need the error?This?

But why do we need the error?Surely this one?

But why do we need the error?Would you trust these?
β1=1σ=0.2n=60
β1=1σ=0.5n=60
β1=0.3σ=0.2n=60
β1=1σ=0.2n=15
Age: 52Good hair
Scary smile

But why do we need the error?In conclusion:
• We trust long series with large effects and small error.
cXXc
βc1)(
TT
T
t 1)( XXT
βcT
Effect size
Uncertainty of effect size

But why do we need the error?In conclusion:
• We trust: Long series with large effects and small error.
cXXc
βc1)(
TT
T
t 1)( XXT
βcT
beta_0001.img beta_0002.img beta_0003.img
ResMS.img ?

Asking questions of your datat-contrasts
98.2
16.0
83.0
β
04.2
06.0
03.0
β
17.2
82.0
68.0
β
...
...
Time-
serie
s
• Can we find voxels that are active in word-generation taks?

Asking questions of your datat-contrasts
98.2
16.0
83.0
β
04.2
06.0
03.0
β
17.2
82.0
68.0
β
...
...
Time-
serie
s
• Can we find voxels that are active in word-generation taks?
Hmm, seem to have large
values for β1

Asking questions of your datat-contrasts
**42.6
32.0*41.0
83.0
32.0*41.0
98.2
16.0
83.0
001
t
...
...
Time-
serie
s
• Can we find voxels that are active in word-generation taks?
44.032.0*19.0
03.0
32.0*19.0
04.2
06.0
03.0
001
t
**41.5
32.0*40.0
68.0
32.0*40.0
17.2
82.0
68.0
001
t
c 001

Asking questions of your datat-contrasts
**16.5
32.0*41.0
67.0
32.0*41.0
98.2
16.0
83.0
011
t
...
...
Time-
serie
s
• Voxels that are more active in generation than shadowing?
58.032.0*19.0
03.0
32.0*19.0
04.2
06.0
03.0
011
t
12.132.0*40.0
14.0
32.0*40.0
17.2
82.0
68.0
011
t
c 011
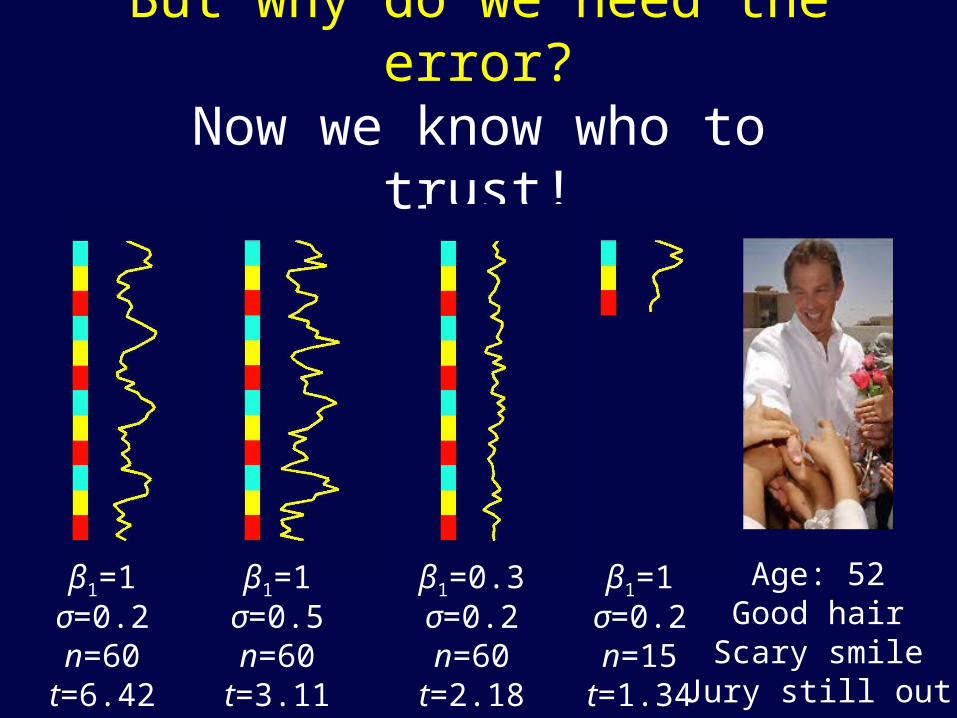
But why do we need the error?Now we know who to trust!
β1=1σ=0.2n=60
t=6.42
β1=1σ=0.5n=60
t=3.11
β1=0.3σ=0.2n=60
t=2.18
β1=1σ=0.2n=15
t=1.34
Age: 52Good hair
Scary smileJury still out

t-contrasts revisited
c
98.2
16.0
83.0
β
Get data
Fit model Get effect size
Get error
cf.
t ~
(sort of)
=6.42

I’m sorry, can you pose that question differently?
F-contrasts
98.2
16.0
83.0
β
40.3
25.0β
Get data
Fit model
Fit reduced model
Estimate error
Estimate error
2
2
=
=
cf.
F ~(sort of)
=41.21
-

But why ask the same question twice?Isn’t that like nagging?
QUIZ: Let us say you wanted to find ares that changed its activity as a result of word-generation or word-shadowing, or both. How would you construct your t-contrast?
001
010
011
?
?
?

Quite arrogant voxel that likes to generate words, but positively disdains
repeating.
Let us try [1 1 0]
c
86.2
71.0
74.0
β
Fit model
Get effect size
Get error
t = 0.10

86.2
71.0
74.0
β
87.2β
Get data
Fit model
Fit reduced model
Estimate error
Estimate error
Where as
010
001
SS=40.5
SS=19.6
F2,57=60.8

F-contrasts made easyA stack of t-contrasts
Is any condition different from the other?
Is there any difference between the two conditions?
0011
Is condition A different from condition B?

F-contrasts made easyA stack of t-contrasts
Is any condition different from the other?
Is there any difference between the two conditions?
0101
Is condition A different from condition C?
0011

F-contrasts made easyA stack of t-contrasts
Is any condition different from the other?
Is there any difference between the two conditions?
1001
Is condition A different from condition D?
0011 0101

F-contrasts made easyA stack of t-contrasts
Is any condition different from the other?
Is there any difference between the two conditions?
0110
Is condition B different from condition C?
0011 0101 1001

F-contrasts made easyA stack of t-contrasts
Is any condition different from the other?
Is there any difference between the two conditions?
0110
Is condition B different from condition C?
0011 0101 1001
Wait a second, do we really need that?

F-contrasts made easyA stack of t-contrasts
Is any condition different from the other?
Is there any difference between the two conditions?
0011 0101 1001
Nah, too messy!

F-contrasts made easyA stack of t-contrasts
Is any condition different from the other?
Is there any difference between the two conditions?
0011 0101 1001
That’s much nicer.

F-contrasts made easyA stack of t-contrasts
Is any condition different from the other?
Is there any difference between the two conditions?
Amplitude of response
Latency of response
Duration of response
This is actually ”our” study.
Promise!

F-contrasts made easyA stack of t-contrasts
Is any condition different from the other?
Is there any difference between the two conditions?
001001
Is the amplitude response different between generation and shadowing?

F-contrasts made easyA stack of t-contrasts
Is any condition different from the other?
Is there any difference between the two conditions?
010010
Is the latency of response different between generation and shadowing?
001001

F-contrasts made easyA stack of t-contrasts
Is any condition different from the other?
Is there any difference between the two conditions?
100100
Is the duration of response different between generation and shadowing?
001001 010010

F-contrasts made easyA stack of t-contrasts
Is any condition different from the other?
Is there any difference between the two conditions?
100100
001001 010010
aka

And now all this is perfectly clear?(And yes, there really was such an
experiment.)

Summary
• A model is used to summarise data in a few (sometimes a big few) parameters that are pertinent to the experiment.
• It consists of a set of hypotheses about how BOLD activity might change as a result of the experiment.
• Specific questions may be asked of the data, via the model, through contrasts.
• Contrasts may be t- or F-contrasts, depending on the nature of the question.