Embed Size (px)
Citation preview
Applied Mathematical Sciences, Vol. 8, 2014, no. 17, 817 - 822
HIKARI Ltd, www.m-hikari.com http://dx.doi.org/10.12988/ams.2014.312710
Modelling Malaysian Gold Using Symmetric
and Asymmetric GARCH Models
Maizah Hura Ahmad1 and Pung Yean Ping
2
Department of Mathematical Sciences, Faculty of Science
Universiti Teknologi Malaysia,
81310 UTM Skudai, Johor, Malaysia
Copyright © 2014 Maizah Hura Ahmad and Pung Yean Ping. This is an open access article
distributed under the Creative Commons Attribution License, which permits unrestricted use,
distribution, and reproduction in any medium, provided the original work is properly cited.
Abstract
The purpose of the current study is to model Malaysian gold prices, known as
Kijang Emas, using a popular class of generalized econometric models called
Generalized Autoregressive Conditional Heteroskedasticity (GARCH) and three
of its variants. The variant models selected are GARCH in the mean
(GARCH-M), Threshold GARCH (TGARCH) and Exponential GARCH
(EGARCH). While the standard GARCH and GARCH-M are symmetric models,
TGARCH and EGARCH are asymmetric. Using Akaike Information Criterion
(AIC) and Schwarz Information Criterion (SIC) as model selection criteria, the
best fit model for modelling Malaysian gold is TGARCH.
Keywords: Generalized Autoregressive Conditional Heteroskedasticity
GARCH-M, TGARCH, EGARCH
1 Introduction
Malaysia’s own gold bullion coins called Kijang Emas provide an
alternative form of investment. Minted by the Royal Mint of Malaysia in three
different sizes of 1 oz, ½ oz and ¼ oz, the prices are quoted daily, while pegged to
the international gold price. In the current market, Kijang Emas prices remain
volatile, a condition where the conditional variance changes between extremely
high and low values [1].

818 Maizah Hura Ahmad and Pung Yean Ping
The purpose of the current study is to model Kijang Emas prices using
symmetric and asymmetric models from the Garch family. Bollersvlev
generalized the popular class of econometric models called Autoregressive
Conditional Heteroskedasticity (ARCH) pioneered by Engle and developed
Generalized Autoregressive Conditional Heteroskedasticity (GARCH). GARCH
can capture volatility clustering or the periods of fluctutations and is used to
predict volatilities in the future [2]. Since the introduction of this model, many
extensions or variants of the GARCH model have been introduced.
,
In the current study, the symmetric models considered are Generalized
Autoregressive Conditional Heteroscedasticity (GARCH) and GARCH in the
mean (GARCH-M), while the asymmetric models are Threshold GARCH
(TGARCH) and Exponential GARCH (EGARCH). The method of maximum
likelihood is used in estimating the parameters [3]. Akaike Information Criterion
(AIC) and Schwarz Information Criterion (SIC) are used to select the best model.
All analyses are carried out using a software called E-views.
The paper is organized as follows: Section 2 presents the methodology of
the current study, while Section 3 presents the data analysis. Section 4 concludes
the study.
2 Methodology
Considered Symmetric and Asymmetric GARCH Models
The standard GARCH models is symmetric in response to the past volatility
and variance. A GARCH model makes volatility or variance depends on the
volatility or variance of the past and keeps the expected return constant.
The GARCH model is where yt are returns and the mean value, is
expected to be positive and small. ttttt hu 2, )1,0(~ Nt
The conditional variance equation is
where , , for stationarity; p is the order of
the GARCH terms 2 , which is the last period forecast variance; q is the order of
the ARCH terms 2, which is the information about volatility from the previous;
and t is the error and assumed to be normally distributed with zero mean and
conditional variance, . All parameters in the variance equation must be
Modelling Malaysian gold using GARCH models 819
positive.
The value of is expected to be less than but close to unity and > .
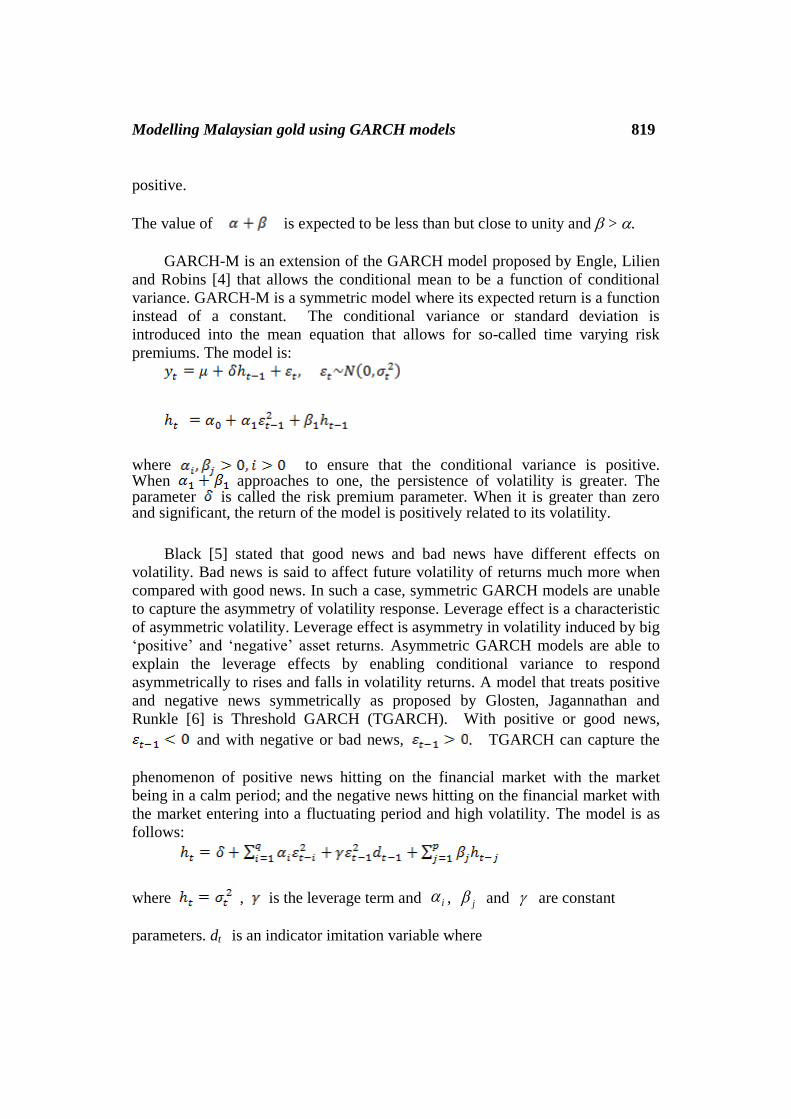
GARCH-M is an extension of the GARCH model proposed by Engle, Lilien
and Robins [4] that allows the conditional mean to be a function of conditional
variance. GARCH-M is a symmetric model where its expected return is a function
instead of a constant. The conditional variance or standard deviation is
introduced into the mean equation that allows for so-called time varying risk
premiums. The model is:
where to ensure that the conditional variance is positive. When approaches to one, the persistence of volatility is greater. The parameter is called the risk premium parameter. When it is greater than zero and significant, the return of the model is positively related to its volatility.
Black [5] stated that good news and bad news have different effects on
volatility. Bad news is said to affect future volatility of returns much more when
compared with good news. In such a case, symmetric GARCH models are unable
to capture the asymmetry of volatility response. Leverage effect is a characteristic
of asymmetric volatility. Leverage effect is asymmetry in volatility induced by big
‘positive’ and ‘negative’ asset returns. Asymmetric GARCH models are able to
explain the leverage effects by enabling conditional variance to respond
asymmetrically to rises and falls in volatility returns. A model that treats positive
and negative news symmetrically as proposed by Glosten, Jagannathan and
Runkle [6] is Threshold GARCH (TGARCH). With positive or good news,
and with negative or bad news, . TGARCH can capture the
phenomenon of positive news hitting on the financial market with the market
being in a calm period; and the negative news hitting on the financial market with
the market entering into a fluctuating period and high volatility. The model is as
follows:
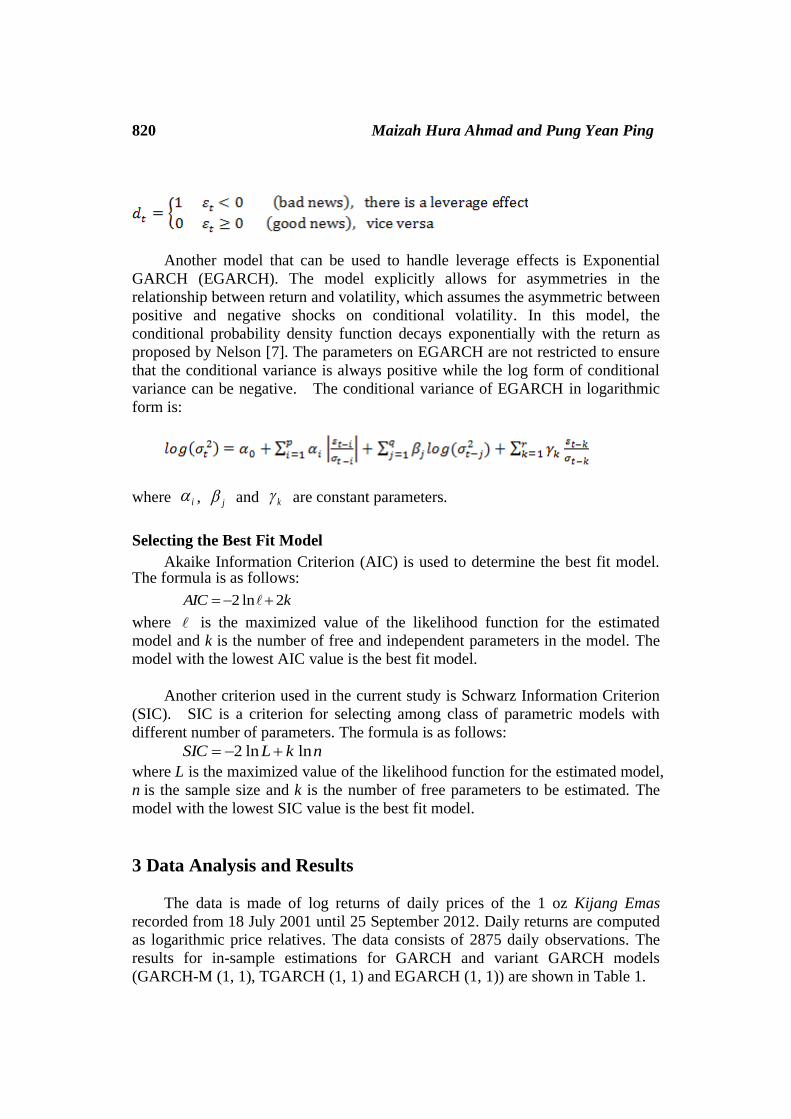
where , is the leverage term and i , j and are constant
parameters. dt is an indicator imitation variable where
820 Maizah Hura Ahmad and Pung Yean Ping
Another model that can be used to handle leverage effects is Exponential
GARCH (EGARCH). The model explicitly allows for asymmetries in the
relationship between return and volatility, which assumes the asymmetric between
positive and negative shocks on conditional volatility. In this model, the
conditional probability density function decays exponentially with the return as
proposed by Nelson [7]. The parameters on EGARCH are not restricted to ensure
that the conditional variance is always positive while the log form of conditional
variance can be negative. The conditional variance of EGARCH in logarithmic
form is:
where i , j and k are constant parameters.
Selecting the Best Fit Model
Akaike Information Criterion (AIC) is used to determine the best fit model. The formula is as follows:
kAIC 2ln2
where is the maximized value of the likelihood function for the estimated
model and k is the number of free and independent parameters in the model. The
model with the lowest AIC value is the best fit model.
Another criterion used in the current study is Schwarz Information Criterion
(SIC). SIC is a criterion for selecting among class of parametric models with
different number of parameters. The formula is as follows:
nkLSIC lnln2
where L is the maximized value of the likelihood function for the estimated model,
n is the sample size and k is the number of free parameters to be estimated. The
model with the lowest SIC value is the best fit model.
3 Data Analysis and Results
The data is made of log returns of daily prices of the 1 oz Kijang Emas
recorded from 18 July 2001 until 25 September 2012. Daily returns are computed
as logarithmic price relatives. The data consists of 2875 daily observations. The
results for in-sample estimations for GARCH and variant GARCH models
(GARCH-M (1, 1), TGARCH (1, 1) and EGARCH (1, 1)) are shown in Table 1.
Modelling Malaysian gold using GARCH models 821
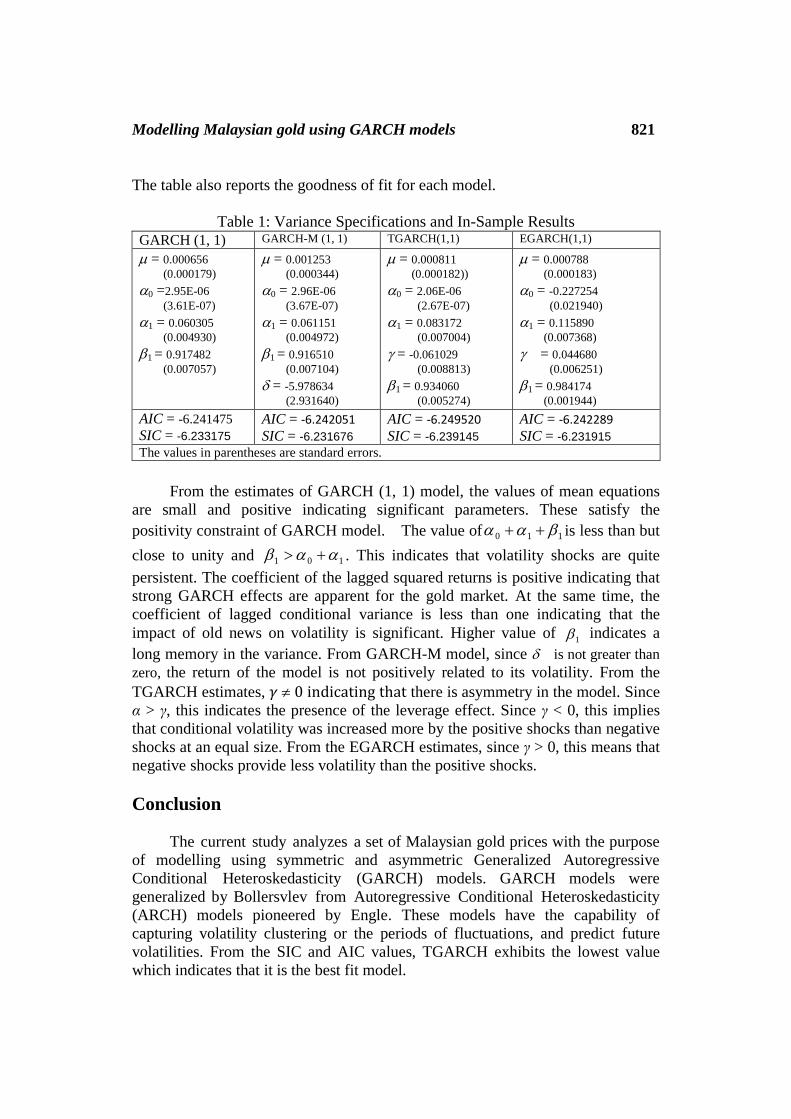
The table also reports the goodness of fit for each model.
Table 1: Variance Specifications and In-Sample Results GARCH (1, 1) GARCH-M (1, 1) TGARCH(1,1) EGARCH(1,1)
= 0.000656
(0.000179)
0 =2.95E-06
(3.61E-07)
1 = 0.060305
(0.004930)
1 = 0.917482
(0.007057)
= 0.001253
(0.000344)
0 = 2.96E-06
(3.67E-07)
1 = 0.061151
(0.004972)
1 = 0.916510
(0.007104)
= -5.978634
(2.931640)
= 0.000811
(0.000182))
0 = 2.06E-06
(2.67E-07)
1 = 0.083172
(0.007004)
= -0.061029
(0.008813)
1 = 0.934060
(0.005274)
= 0.000788
(0.000183)
0 = -0.227254
(0.021940)
1 = 0.115890
(0.007368)
= 0.044680
(0.006251)
1 = 0.984174
(0.001944)
AIC = -6.241475
SIC = -6.233175 AIC = -6.242051
SIC = -6.231676
AIC = -6.249520
SIC = -6.239145
AIC = -6.242289
SIC = -6.231915 The values in parentheses are standard errors.
From the estimates of GARCH (1, 1) model, the values of mean equations
are small and positive indicating significant parameters. These satisfy the
positivity constraint of GARCH model. The value of 110 is less than but
close to unity and 101 . This indicates that volatility shocks are quite
persistent. The coefficient of the lagged squared returns is positive indicating that
strong GARCH effects are apparent for the gold market. At the same time, the
coefficient of lagged conditional variance is less than one indicating that the
impact of old news on volatility is significant. Higher value of 1 indicates a
long memory in the variance. From GARCH-M model, since is not greater than
zero, the return of the model is not positively related to its volatility. From the
TGARCH estimates, 𝛾 0 indicating that there is asymmetry in the model. Since
α > γ, this indicates the presence of the leverage effect. Since γ < 0, this implies
that conditional volatility was increased more by the positive shocks than negative
shocks at an equal size. From the EGARCH estimates, since γ > 0, this means that
negative shocks provide less volatility than the positive shocks.
Conclusion
The current study analyzes a set of Malaysian gold prices with the purpose
of modelling using symmetric and asymmetric Generalized Autoregressive
Conditional Heteroskedasticity (GARCH) models. GARCH models were
generalized by Bollersvlev from Autoregressive Conditional Heteroskedasticity
(ARCH) models pioneered by Engle. These models have the capability of
capturing volatility clustering or the periods of fluctuations, and predict future
volatilities. From the SIC and AIC values, TGARCH exhibits the lowest value
which indicates that it is the best fit model.

822 Maizah Hura Ahmad and Pung Yean Ping
Acknowledgement This work is supported by Universiti Teknologi Malaysia. The authors would like to thank the university for providing the fund and facilities.
References
[1] Pung Yean Ping, Nor Hamizah Miswan and Maizah Hura Ahmad,
Forecasting Malaysian Gold Using GARCH Model, Applied Mathematical
Sciences, 7 (58), 2013, 2879-2884.
[2] T. Bollerslev, Generalized Autorregressive Conditional Heteroskedasticity,
Journal of Econometrics, 31 (1986), 307-327.
[3] Nor Hamizah Miswan, Pung Yean Ping and Maizah Hura Ahmad, On
Parameter Estimation for Malaysian Gold Prices Modelling and Forecasting,
International Journal of Mathematical Analysis, 7 (22), 2013, 1059-1068.
[4] R. F. Engle, D. M. Lilien and R. P. Robins, Estimating Time-varying Risk
Premia in the Term Structure: The ARCH-M Model. Econometrica 55(1987),
391–408.
[5] F. Black, Studies of Stock Price Volatility Changes, Proceedings of the
Business and Economics Section of the American Statistical Association,
1976, 177-181. [6] L. Glosten, R. Jagannathan and D. Runkle, Relationship between the
Expected Value and Volatility of the Nominal Excess Returns on Stocks, Journal of Finance, 48, 1993, 1779-802.
[7] D. Nelson, Conditional Heteroskedasticity in Asset Returns: A New Approach. Econometrica, 59, 1991, 347-70.
Received: December 21, 2013