Embed Size (px)
Citation preview

- 0 -
Université de Liège
Faculté d’Economie, de Gestion et de Sciences Sociales
Sébastien LAURENT & Jean-Philippe PETERS
Octobre 2000
Working Paper
GG@@RRCCHH 11..11 :: AANN OOXX PPAACCKKAAGGEE FFOORR
EESSTTIIMMAATTIINNGG VVAARRIIOOUUSS AARRCCHH MMOODDEELLSS

- 1 -
G@RCH 1.1 : An Ox Package for Estimating Various
ARCH Models
BY SEBASTIEN LAURENT 1 AND JEAN-PHILIPPE PETERS
2
Faculty of Economy, Business and Social Science, University of Liège, Belgium
October 2000
I. INTRODUCTION.................................................................................................... 3
1. THE G@RCH PACKAGE ......................................................................................... 3
1.1. Definition ......................................................................................................... 3
1.2. Program Versions ............................................................................................ 3
2. DISCLAIMER............................................................................................................ 4
3. AVAILABILITY AND CITATION................................................................................. 4
4. STRUCTURE OF THE PROGRAM ................................................................................ 4
4.1. Classes and Functions ..................................................................................... 4
4.2. GARCH Member Functions List...................................................................... 5
II. G@RCH MEMBERS FUNCTIONS .................................................................... 8
III. FEATURES OF THE PACKAGE .................................................................... 17
1. INTRODUCTION...................................................................................................... 17
2. MODELS OF THE PROGRAM ................................................................................... 17
2.1 Mean equation ................................................................................................ 17
2.2 Variance equation........................................................................................... 18
2.3 ARCH Model................................................................................................... 18
2.4 GARCH Model ................................................................................................ 19
2.5 EGARCH Model.............................................................................................. 20
2.6 GJR Model ...................................................................................................... 20
2.7 APARCH Model .............................................................................................. 21
2.8 Integrated Models ........................................................................................... 21
1 http://www.egss.ulg.ac.be/econometrie/SLaurent.htm2 http://www.eaa.egss.ulg.ac.be/rogp/peters/

- 2 -
2.9 Fractionally Integrated Models ...................................................................... 22
3. ESTIMATION METHODS ......................................................................................... 24
3.1 The Distributions ............................................................................................ 24
3.2. The Standard Deviation Estimation Methods................................................ 26
3.3 Tests ................................................................................................................ 26
IV. USING THE PROGRAM................................................................................... 28
1. INSTALLING THE FILES .......................................................................................... 28
2. RUNNING THE “FULL VERSION" ............................................................................ 28
3. RUNNING THE "LIGHT VERSION"........................................................................... 39
V. VERSIONS AND FUTURE IMPROVEMENTS .............................................. 42
1. RELEASES HISTORY............................................................................................... 42
2. FUTURE IMPROVEMENTS ....................................................................................... 42
VI. REFERENCES.................................................................................................... 42

- 3 -
I. Introduction
1. The G@RCH Package
1.1 . Definition
G@RCH 1.1 is an Ox package dedicated to the estimation of GARCH models and
many of its extensions. It can be used via OxPack (with a dialog-oriented interface) or
via the traditional (programming) way.
The available models are ARCH (Engle, 1982), GARCH (Bollerslev, 1986),
EGARCH (Nelson, 1991), GJR (Glosten et al., 1993), APARCH (Ding et al., 1993),
IGARCH (Engle and Bollerslev, 1986), FIGARCH (Baillie et al., 1996 and Chung,
1999), FIEGARCH (Bollerslev and Mikkelsen, 1996) and FIAPARCH (Tse, 1998).
These models can be estimated by Approximate (Quasi-) Maximum Likelihood under
three assumptions: Normal, Student-t or GED errors. Finally, explanatory variables
can enter both the mean and the variance equations.
1.2. Program Versions
Two versions of our program are available called the "Light Version" and the "Full
Version".
The "Light Version" is launched from the Ox file GarchEstim.ox. This
version requires some experience with the program and its structure. The "Light
Version" is therefore dedicated to advanced users. This is also dedicated to users who
do not possess the GiveWin software. Indeed, since the OxPack module is only
available for registered Ox users, users who have a free Ox version cannot use our
dialogs-oriented (or "Full") version. Hence, the "Light Version" is a solution, since its
use just requires an Ox executable and a text editor.
The "Full Version" provides the same features as the other version, but also a
friendly interface and some graphical features. This package needs to be launched
from OxPack.

- 4 -
This tutorial is structures as follows: in Section II, we introduce the G@RCH
class members (that is, the procedures composing the class). In Section III, we
propose an overview of the package's features, with the presentation of the models
and the estimation methods (distributions, standard deviation estimation and testing
procedures). Then, a user guide is provided for both versions of our package in
Section IV. Finally, we underline the future improvements of the G@RCH package
in Section V.
2. Disclaimer
This package is functional but no warranty is given whatsoever. The most appropriate
way to discuss about problems and issues of the G@RCH package is the Ox-users
forum (see http://www.mailbase.ac.uk/lists/ox-users for registration and archives).
Suggestions can be reported to the authors via e-mail: [email protected] for
Sébastien and [email protected] for Jean-Philippe.
3. Availability and Citation
The G@RCH package is available for downloading at the following address:
http://www.egss.ulg.ac.be/garch
For easier validation and replication of empirical findings, please cite this
documentation in all reports and publications involving the use of this G@RCH 1.1
package.
4. Structure of the Program
4.1. Classes and Functions
Ox provides support for object-oriented programming. An interesting concept is
therefore the "Classes". Indeed, "complex data structures can be encapsulated within
instances of a class that only can be accessed by class member functions".3
Furthermore, derived classes such as our GARCH class can be constructed.
In other words, one can create new classes based on other existing parent-
classes and use the functions of these parents, avoiding to be obliged of rewriting
procedures for derived classes. In our case, the GARCH class is defined as a
Modelbase type of class. This Modelbase class derives itself from the Database
class (Figure 3.1).
3 Kusters and Steffen, (1996), p.13.

- 5 -
The Database class is dedicated to the handling of the database, the sample,
the names of the variables, the selection of variables… The Modelbase implement
model estimation features. It is not intended to be used directly but as a base for a
more specialized class, such as our GARCH class or already available classes such as
ARFIMA, DPD (Panel Data estimation), SVPack (Stochastic Volatility models) or
SsfPack (State space forms).
Figure 3.1. Classes Structure
4.2. GARCH Member Functions List
Here is the list of the Garch member functions and a brief description for each
of them. Our program also uses functions from other classes (Modelbase and
Database).
ConstructorGarch Constructor
Model Formulation (only "Light Version")APARCH Specifies if APARCH is wanted in the varianceARFIMA Specifies if ARFIMA is wanted in the meanARMA Specifies the AR and MA orders in the meanCSTS Specifies if constants are wanted in the mean and in the varianceDISTRI Specifies the desired distribution.EGARCH Specifies if EGARCH is wanted in the varianceFIGARCH Specifies if FIGARCH is wanted and selects the estimation method
(BBM; i.e. Baillie et al., 1996, or Chung, 1999)GARCH Specifies the p and q orders of the GARCH(p,q)GJR Specifies if GJR is wanted in the varianceIGARCH Specifies if IGARCH model is wanted in the varianceLAGS Specifies the desired lags for the Box-Pierce testsMLE Specifies the standard errors estimation method
STORE Allows storing estimated εt, εt2 and σt
2 series
TESTSONLY Allows running only tests, prior to any estimation.
Database
Modelbase
DPDGGAARRCCHHARFIMA

- 6 -
InputInitData Initializes the characteristics of the model (sample, regressors…)InitStartValues Initializes the starting values of the parameters to estimate
Parameters related functionsDialogs Parameter starting values (only "Full Version")Filter Allocates the filter number depending on the model specificationGetPara Constructs the parameters vectorGetRes Gets residuals from the mean equationSplitPara Allocates the value of each element of the parameters vector to the
correct variable
FiltersAParch APARCH filterEGarch EGARCH filterGarch GARCH FilterGarch_Leverage GJR filterGaussLik Computes the log-likelihood for the Gaussian distributionGEDLik Computes the log-likelihood for the GEDFIAParch FIAPARCH filterFIEGarch FIEGARCH filter (the Fractional Integration process uses Chung's
method)Figarch_BBM FIGARCH filter with the Baillie et al. (1996) method (BBM)Figarch_Chung FIGARCH filter with the Chung (1999) methodFigLL Function to be maximized by BFGSFiltARMA ARMA filterStudentLik Computes the log-likelihood for the Student distribution
GeneralGetParName Gets parameters namesGetXNames Gets the names of the regressors in the mean equationGetZNames Gets the names of the regressors in the variance equation
Model EstimationDoEstimation Estimates the model ("Light version")Estimate Estimates the model ("Full version")ScoreContributions Computes the numerical derivatives.
Post EstimationArchTest Computes the Engle's LM ARCH testBoxPQ Computes the modified Box-Pierce Q-statistics and the associated p-
valuesICriterion Computes the four Information Criteria (Akaike, Hannan-Quinn,
Schwarz and Shibata)Normality Computes the skewness, kurtosis and Jarque-Bera test, with
associated t-test and p-values

- 7 -
MLEMeth Prints the estimated parameters, their standard deviations, t-tests andp-values
Output Prints the model specification and launches other post-estimationprocedures
SBT Computes the sign bias test, the negative size bias test, the positivesize bias test and a joint test of the three
Tests Computes and prints the testsTestGraphicAnalysis Prints the graphics

- 8 -
II. G@RCH Members Functions
Garch::APARCH, Garch::ARFIMA, Garch::CSTS, Garch::EGARCH, Garch::GJR,
Garch::INTEGRATE
APARCH(const cAPARCH) ;ARFIMA(const cARFI) ;CSTS(const cstM, const cstV) ;EGARCH(const cEGARCH) ;IGARCH(const integ) ;GJR(const cLeverage) ;
cAparch in: 1 or 0, APARCH selectioncArfi in: 1 or 0, ARFIMA selectioncstM in: 1 or 0, constant in the mean equation selectioncstV in: 1 or 0, constant in the variance equation selectioncEgarch in: 1 or 0, EGARCH selectionInteg in: 1 or 0, IGARCH selectioncLeverage in: 1 or 0, GJR selection
No return value
Description
When the argument is 1, the concerned specification is selected. GJR, IGARCH,APARCH, EGARCH and GJR are exclusive selection.
Garch::ARMA, Garch::GARCH,
ARMA(const cAR, const cMA) ;GARCH(const cP, const cQ) ;
cAR in: integer, AR order, pcMA in: integer, MA order, qcP in: integer, GARCH order, pcQ in: integer, ARCH order, q
No return value
Description
Fixes the ARMA and GARCH orders.
Garch::AParch, Garch::EGarch, Garch::Garch, Garch::GJR_Filt,
Garch::Figarch_BBM, Garch::Figarch_Chung, Garch::FIEGarch, Garch::FIAParch,
AParch (const e, const level, const p, const q) ;

- 9 -
EGarch (const e, const level, const p, const q) ;Garch (const e, const level, const p, const q) ;GJR_Filt (const e, const level, const p, const q) ;Figarch_BBM (const e, const level, const p, const q, const laglamb) ;Figarch_Chung (const e, const level, const p, const q);FIEGarch (const e, const level, const p, const q) ;FIAParch (const e, const level, const p, const q);
e in: (m_cT x 1) matrix, residuals series.level in: (m_cT x 1) matrix, independent variables.p in: integer, GARCH order, pq in: integer, ARCH order, qlaglamb in: integer, truncation order (BBM method)
Return value
A (m_cT x 1) matrix with the estimated conditional variance (σ2).
Description
These are the filters of the different models. Recall that two methods are available forthe FIGARCH models: the Baillie et al. (1996) method (BBM) that includes atruncation order or the Chung (1999) method that do not. See FIGARCH(const d,const method, const trunc) for further information. Note that "level" is a (m_cT x 1)ones vector if there is no independent variable and a (m_cT x m_cX) matrix equal tob'X if there are explanatory variables.
Garch::Dialogs
Dialogs () ;
No return value
Description
Only used with OxPack. Launches dialogs related to the starting values. There aretwo possibilities: the "Parameter-by-parameter" dialog or the "Vector" dialog. Theformer is launched if the user has previously selected the "Manually (IndividualForm)" option in OxPack while the latter is available when having chosen "Manually(Vector Form)".
Garch::DISTRI
DISTRI(const dist) ;dist in: integer, distribution selection
No return value

- 10 -
Description
Selection of the distribution. If dist is 0, this is the Gaussian distribution (Normal), ifit is 1, it is the Student-t distribution and if it is 2, it is the Generalized Errordistribution (GED).
Garch::DoEstimation, Garch::Estimate
DoEstimation(const vStart) ;Estimate () ;
vStart in: (m_cParam x 1) matrix, starting values of the parameters to be estimated.
Return value
1 if model successfully estimated, 0 if it failed.
Description
DoEstimation is launched from the “Light version” of the program while Estimate islaunched from the “Full version”. These procedures are the core procedures of theprogram. They successively launch others procedures to initialize parameters, toestimate the formulated model, to print the results, to run the tests or to print thegraphics.
Garch::FIGARCH
FIGARCH(const d, const method, const trunc) ;d in: 1 or 0, FIGARCH selectionmethod in: 1 or 0, estimation method selectiontrunc in: integer, truncation order (only if method = 1)
No return value
Description
It is related to the fractionally integrated (FI) model selection. If d = 1, a F.I. modelwill be estimated. If method = 0, the estimation method will follow Chung’s (1999)specification. If method = 1, the estimation method will follow BBM’s (1996)specification. One notable difference (among others) between these two method isthat BBM uses a fix number of lags equal to trunc in order to compute the binomialexpansion (Taylor's theorem) while Chung proposes an increasing number of lags (infact, it includes all previous observations). To estimate a FIEGARCH model for
instance, you have to select both EGARCH and FIGARCH ⇒ EGARCH(1), and
FIGARCH(1, method, trunc).
Garch::FigLL
FigLL(const vP, const adFunc, const avScore, const amHessian);vP in: (m_cP x 1) matrix, parameters to be estimated
out: estimated parameters
- 11 -
adFunc in: addresseout: double, log-likelihood function value at vP
avScore in: 0, or an addressout: if not 0 on input, (m_cP x 1) matrix with first derivatives at vP
amHessian in: 0, as MaxBFGS does not require the Hessian.
Return value
1 if successful, 0 if evaluation failed.
Description
This is the procedure optimized by Ox with the MaxBFGS function. This functionuses the Broyden, Fletcher, Goldfarb and Shanno (BFGS) quasi-Newton method (seeDoornik, 1999, p.240, for further details).
Garch::Filter
Filter() ;
Return value
1 if successful, 0 if failure.
Description
Allocates the correct filter depending on the specification made to the selectionprocedures (GARCH, FIGARCH, EGARCH, GJR, APARCH, INTEGRATE).
Garch::Garch
Garch() ;
No return value
Description
Constructor.
Garch::GaussLik, Garch:: GEDLik, Garch::StudentLik
GaussLik(const vE, const vSigma2) ;GEDLik(const vE, const vSigma2, const a) ;StudentLik(const vE, const vSigma2, const v) ;
vE in: (m_cT x 1) matrix, residuals.vSigma2 in: (m_cT x 1) matrix, conditional variance.a in: double, asymmetric coefficient.v in: double, degree of freedom.
Return value
The log-likelihood function value associated with vE and vSigma2.

- 12 -
Description
Computes the log-likelihood functions of the three available distributions.
Garch:: GetPara;
GetPara();
Return value
1 if successful, 0 if failure.
Description
It constructs the parameters vector and allocates it to m_vPar. The order of theparameters is the following: constant in mean, regressors in mean coefficients, d
coefficient, AR coefficients, MA coefficients, constant in var., regressors in var.coefficients, F.I.(d) coefficient, GARCH coefficients, ARCH coefficients, GJRcoefficients, EGARCH coefficients, APARCH coefficients, GED degrees of freedomand Student degrees of freedom.
Garch::GetParNames , Garch::GetXNames, Garch::GetZNames;
GetParNames();GetXNames();GetZNames();
Return value
Array of strings with the names of the variables or parameters.
Description
These procedures collect the names of the regressors in the mean equation (X) or inthe variance equation (Z) or the names of the estimated parameters.
Garch::GetRes
GetRes(const y, const x);y in: (m_cT x 1) matrix, dependent variablex in: (m_cT x m_cX) matrix, regressors
Return value
(m_cT x 1) matrix containing the residuals.
Description
Computes the residuals of the mean equation without taking account of AR(FI)MAprocesses.
Garch::InitData

- 13 -
InitData() ;
Return value
1 if successful, 0 if failure.
Description
Allocates the Y series and the regressors to class members, computes the no. ofobservations of the sample, the no. of parameters to be estimated.
Garch::InitStartValues
InitStartValues() ;
No return value
Description
Initializes the starting values when the user do not enter any specific starting values.These values are:- Constant in the mean: 0.05- Regressors in the mean: 0.01- ARFIMA(p,d,q): p1 = 0.2, p>1 = 0.05, d = 0.1, q1 = 0.15, q>1 = 0.02- Constant term in the variance equation: 0.01
- FIGARCH(p,d,q): β1 = 0.7 (if GARCH) or 0.45 (if FIGARCH), β>1 = 0.1, d = 0.5
and α = 0.1 (for all q)- GJR: leverage coefficients = 0.01
- EGARCH: φ1 = -0.1 and φ2 = 0.2
- APARCH: δ = 1.2, γ1 = 0.15, γ>1 = 0.05
- Student distribution: υ = 6 (degrees of freedom).
- GED distribution: υ = 2.
Garch::Integrate
Integrate(const par) ;par in: (m_cPar x 1) matrix, parameters.
out: modified parameters ("sum equals to one")
Return value
1 if successful, 0 if failure.
Description
Integrated GARCH.
Garch::LAGS
LAGS(const lags) ;

- 14 -
No return value
Description
Fix the lags wanted when computing Box-Pierce statistics. By default, lags is5;10;20. This means that BP(5), BP(10) and BP(20) are computed for thestandardized residuals and squared standardized residuals.
Garch::MLE
MLE(const method);method in: integer, method selection.
No return value
Description
Selection of the estimation method. If method = 0, both (Approximate) MaximumLikelihood and Quasi-Maximum Likelihood Estimates will be computed. If method =1, only MLE is selected and if it is equal to 2, only QMLE are computed.
Garch::MLEMeth
MLEMeth(const par, const parnames, const title);par in: (m_cPar x 1) matrix, estimated parametersparnames in: array of m_cPar strings, estimated parameters namestitle in: string, selected method name
No return value
Description
Prints the estimated parameters, their standard deviations, t-tests and p-values withtheir names. Depending on the user's choice, ML estimates, QML estimates or bothwill be printed.
Garch::Output
Output() ;
No return value
Description
Prints the specification of the formulated model and launches the standard errorscomputations.
Garch::SplitPara

- 15 -
SplitPara(vP) ;vP in: (m_cP x 1) matrix, parameters vector.
Return value
1 if successful, 0 if failure.
Description
Splits the parameters vector and allocates each one to the correct variable (or classmember).
Garch::STORE
STORE(const res, const res2, const condv, const name, const file) ;res in: 1 or 0, to store the residuals or not.res2 in: 1 or 0, to store the squared residuals or not.condv in: 1 or 0, to store the cond. Variance or not.name in: string, suffix added to "Res_", "SqRes_" or "CondV_" to name
the saved series.file in: 1 or 0; to save in a new file or in the used database.
No return value
Description
Stores the residuals, their squared and the conditional variance of the estimatedmodels. Argument 4 provides a default suffix ("01") that can be modified. Ifargument 5 equals 1, the series will be stored in a new .in7 file. If it is equal to 0, thesaved series will be appended in the used database.
Garch::Tests
Tests() ;
No return value
Description
Runs the selected tests.
Garch::TestGraphicAnalysis
TestGraphicAnalysis(const ser, const res, const sqres, const h) ;ser in: 1 or 0; 1 if raw series plot wanted.res in: 1 or 0; 1 if residuals plot wanted.sqres in: 1 or 0; 1 if squared residuals plot wanted.h in: 1 or 0; 1 if cond.variance plot wanted.
No return value

- 16 -
Description
Displays graphics of the series and/or the residuals and/or the squared residualsand/or the conditional variance in the GiveWin front-end.
Garch::TESTSONLY
TESTSONLY(const t) ;t in: 0 or 1.
No return value
Description
Allows to run the test for the raw series, prior to any estimation..
OxPack Functions
OxPack related functions are described in Doornik (1999).

- 17 -
III. Features of the package
1. Introduction
There are nine models provided with the program:
- the ARCH and GARCH models, certainly the most common ones.
- the IGARCH and FIGARCH models, which allow the integrated and the fractional
integrated extensions of the GARCH model.
- three asymmetric models : GJR, EGARCH and APARCH.
- and the fractionally integrated extensions of the last two models (FIEGARCH and
FIAPARCH).
All these models can be estimated under three different distributions: the
Gaussian, the Student-t and the Generalized Error (GED) distributions. Moreover,
explanatory variables can be added both in the mean and in the variance equations.
2. Models of the Program
2.1 Mean equation
Let us consider a discrete time series {yt}. If ψt-1 is the information set (i.e. all the
information) available at time t-1, we can define its functional form as
1( ; )t t ty g bψ ε−= + (2.1)
where ( ).g is a function, b is a vector of the parameters to be estimated and tε is the
disturbance term.
This equation is the mean equation and it has been studied and modeled in
hundreds of different ways. Two of the most famous specifications are the Auto
Regressive (AR) and Moving Average (MA) models. Mixing these two processes and
introducing k explanatory variables in the equation, we obtain this ARMA(m,l)
process,
( )( ) ( )
1
t t t
k
t i iki
L y L
x
µ ε
µ µ δ=
Φ − = Θ
= +∑ (2.2)
where L is the lag operator ( )kt t kL y y −= , ( )
1
1m
ii
i
L Lφ=
Φ = −∑ and ( )1
1l
ii
i
L Lθ=
Θ = −∑ .

- 18 -
Several studies have shown that the dependant variable (interest rate returns,
exchange rate returns, etc.) exhibit significant autocorrelation between
observations widely separated in time. In such a case, we can say that ty
displays long memory, or long-term dependence and is best modelled
by a fractionally integrated ARMA process (so called ARFIMA process) initially
developed by Granger (1980), Granger and Joyeux (1980) among others. Such a
model is described as follows:
( )( ) ( ) ( )1d
t t tL L y Lµ εΦ − − = Θ (2.3)
2.2 Variance equation
The εt term in equations (2.1)- (2.3) is the innovation of the process. The conditional
expectation is the expectation conditional to all past information available at time t-1.
About twenty years ago, Engle (1982) defined as an Autoregressive Conditional
Heteroskedastic (ARCH) process, all {εt} of the form
t t tzε σ= (2.4)
where tz is an independently and identically distributed (i.i.d.) process, ( )tE z = 0 ,
( )tVar z = 1 and where tσ is a time-varying, positive and measurable function of the
information set at time t-1. By definition, tε is serially uncorrelated with mean zero,
but its conditional variance equals to 2tσ and, therefore, may change over time,
contrary to what is assumed in OLS estimations.
The models provided by our program are all ARCH-type. They differ on the
functional form of 2tσ but the basic ideas are the same. Besides the traditional ARCH
and GARCH models, we focus mainly on two kinds of models: the asymmetric
models and the fractionally integrated models. The former are defined to take into
account the so-called "leverage effect" observed in many stock returns, while the
latter allows for long-memory in the variance.
2.3 ARCH Model
The Autoregressive Conditional Heteroskedasticity (ARCH) model is introduced in
Engle (1982). Let εt be the residuals of the mean equation and let ψt be the
information set a time t. The ARCH (q) model can be expressed as:
- 19 -
21
( ) 0 ( ) 0,
| (0, ),
t t t t t
t t t
z with E z and Var z
N
ε σε ψ σ−
= = =
�
2 20 1
1
q
t i ti
σ α α ε −=
= +∑ (2.5)
In the rest of this tutorial, α0 is assumed fixed. If explanatory variables are
introduced in the models, 0 01
k
t i iti
Xα α κ=
= +∑ with an exception for the exponential
models (EGARCH and FIEGARCH) where 0 01
ln 1k
t i iti
Xα α κ=
= + + ∑ .
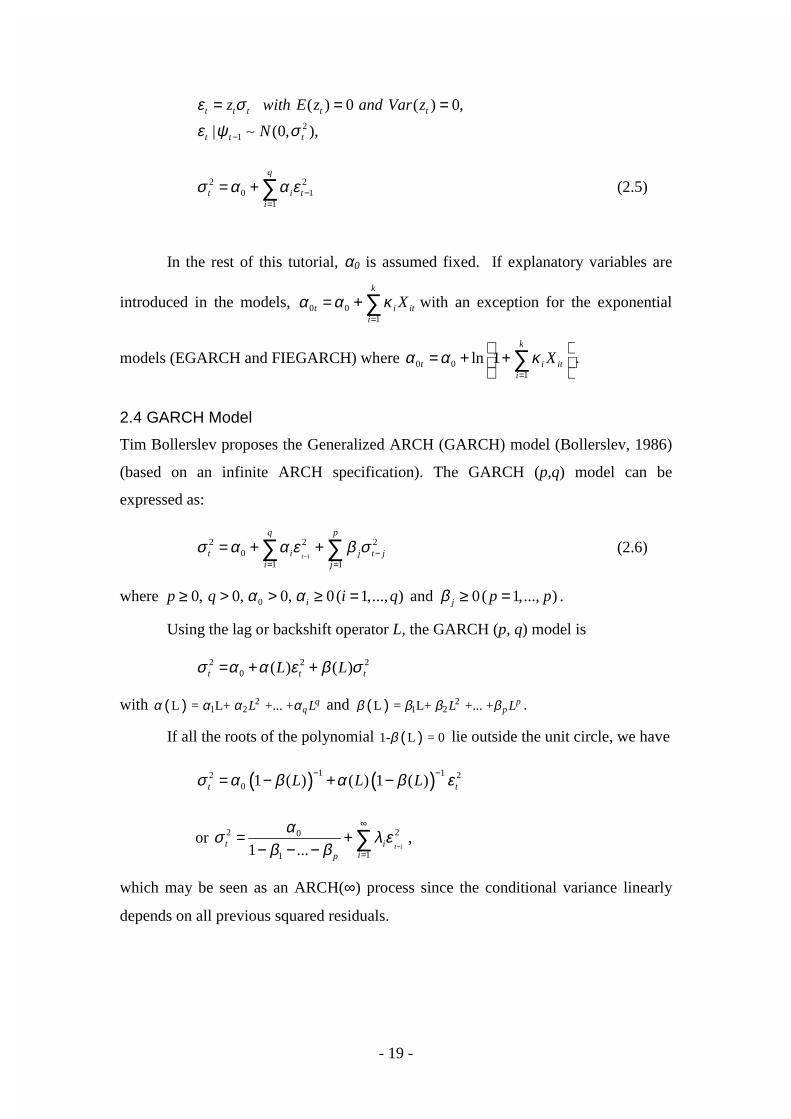
2.4 GARCH Model
Tim Bollerslev proposes the Generalized ARCH (GARCH) model (Bollerslev, 1986)
(based on an infinite ARCH specification). The GARCH (p,q) model can be
expressed as:
2 2 20
1 1t i
q p
t i j t ji j
σ α α ε β σ− −
= =
= + +∑ ∑ (2.6)
where 00, 0, 0, 0( 1,..., )ip q i qα α≥ > > ≥ = and 0( 1,..., )j p pβ ≥ = .
Using the lag or backshift operator L, the GARCH (p, q) model is
2 2 20 ( ) ( ) t t tL Lσ α α ε β σ= + +
with ( ) 21 2L = L+ +... + q
qL Lα α α α and ( ) 21 2L = L+ +... + p
pL Lβ β β β .
If all the roots of the polynomial ( )1- L = 0 β lie outside the unit circle, we have
( ) ( )1 12 20 1 ( ) ( ) 1 ( )t tL L Lσ α β α β ε− −= − + −
or 2 20
111 ... t it iip
ασ λ εβ β −
∞
== +
− − − ∑ ,
which may be seen as an ARCH(∞) process since the conditional variance linearly
depends on all previous squared residuals.

- 20 -
2.5 EGARCH Model
The Exponential GARCH (EGARCH) model is proposed in Nelson (1991) and can be
presented as :
2 20
1 1
ln ( ) ln( )q p
t i t i i t ji j
g zσ α α β σ− −= =
= + +∑ ∑ (2.7)
where tt
t
zεσ
= is the normalized residuals series.
The value of g(zt) depends on several elements. Nelson (1991) notes that, "to
accommodate the asymmetric relation between stock returns and volatility changes
(…) the value of g(zt) must be a function of both the magnitude and the sign of zt ." 4
That is why he suggests to express the function g(.) as
�1 2( )t t t t
sign effect magnitude effect
g z z z E zθ θ≡ + − �������
(2.8)
2.6 GJR Model
This popular model is proposed by in Glosten, Jagannathan and Runkle (1993). Its
generalized version is given by:
2 2 2 20
1 1
( )q p
t i t i i t i t i j t ji j
Sσ α α ε ω ε β σ−− − − −
= =
= + + +∑ ∑ (2.9)
where St- is a dummy variable.
In this model, it is assumed that the impact of 2tε on the conditional variance
2tσ is different when tε is positive or negative. That is why the dummy variable St
-
takes the value "0" (respectively "1") when tε is positive (negative). Note that the
TGARCH model of Zakoian (1992) is very similar to the GJR but models the
conditional standard deviation instead of the conditional variance.
4 Nelson, D.B., (1991), p. 351.

- 21 -
2.7 APARCH Model
Ding et al. (1993) introduce the Asymmetric Power ARCH (APARCH) model. The
APARCH (p, q) model can be expressed as:
01 1
( )q p
t i t i i t i j t ji j
δ δ δσ α α ε γ ε β σ− − −= =
= + − +∑ ∑ (2.10)
where 0 0, 0, 0 ( 1,..., ), 0j ij pα δ β α> ≥ ≥ = ≥ and 1 1 ( 1,..., )i i qγ− < < = .
This model couples the flexibility of a varying exponent with the asymmetry
coefficient (to take the "leverage effect" into account). It includes seven other ARCH
extensions as special cases:
− ARCH when δ = 2, γi = 0 (i = 1,…,p) and βj = 0 (j = 1,…,p).
− GARCH when δ = 2 and γi = 0 (i = 1,…,p).
− Taylor/Schwert's GARCH when δ = 1, and γi = 0 (i = 1,…,p).
− GJR when δ = 2.
− TARCH when δ = 1.
− NARCH when γi = 0 (i = 1,…,p) and βj = 0 (j = 1,…,p).
− The Log-ARCH of Geweke (1986) and Pantula (1986), when δ → 0.5
2.8 Integrated Models
In many high-frequency time-series applications, the conditional variance estimated
using a GARCH(p,q) process exhibits persistence, that is
1 1
1p q
j ij i
β α= =
+ ≈∑ ∑ .
When this sum is equal to one, we are in presence of an Integrated GARCH
(IGARCH) model, meaning that current information remains of importance when
forecasting the volatility for all horizons. A similar concept is present in the mean
equation: when the sum of all AR coefficients and MA coefficients is equal to one, we
face an ARIMA process.
Recall that the GARCH(p,q) model can be expressed as an ARMA(m,l)
process. With the lag operator L, we can rearrange Equation (2.6) as
( ) ( ) ( ) ( )2 2 201 1t t tL L Lα β ε α β ε σ− − = + − −

- 22 -
When the ( ) ( )1 L Lα β− − polynomial contains a unit root, i.e. the sum of all the αi
and the βj is one, we have the IGARCH(p,q) model of Engle and Bollerslev (1986). It
can then be written as
[ ]2 2 20( )(1 ) 1 ( ) ( )t t tL L Lφ ε α β ε σ− = + − − , (2.11)
where [ ] 1( ) 1 ( ) ( ) (1 )L L L Lφ α β −= − − − is of order [max{p,q}-1].
We can rearrange Equation (2.11) to express the conditional variance as a
function of the squared residuals. After some manipulations, we have
[ ] [ ] 12 20 1 ( )(1 ) 1 ( )1 ( )t tL L L
L
ασ φ β εβ
− = + − − − −. (2.12)
2.9 Fractionally Integrated Models
Volatility tends to change quite slowly, and, as shown in Ding et al. (1993) among
others, the effects of shocks take a considerable time to decay.6 Therefore, the
distinction between I(0) and I(1) processes is far too restrictive. Indeed, the
propagation of shocks in I(0) processes occurs at an exponential rate of decay (so that
it only captures the short-memory), while, in I(1) processes, the persistence of shocks
is infinite. Introducing the fractional degree of integration implies a slow hyperbolic
rate of decay, thus allowing a shock to be transitory. In the conditional mean, the
ARFIMA specification has been proposed so that the short-run behavior of the time-
series is captured by the ARMA parameters, while the fractional differencing
parameter allows for modeling the long-run dependence.7
Similar issues existing in financial time series volatility, Baillie et al. (1996)
(hereafter denoted BBM) introduced the Fractionally Integrated GARCH (FIGARCH)
model by replacing the first difference operator of Equation (2.12) by ( )1 dL− .
5 Complete developments leading to these conclusions are available in Ding et al. (1993).6 In their study of the daily S&P500 index, they find that the squared returns series has positive
autocorrelations over more than 2,500 lags (or more than 10 years !!).7 See Bollerslev and Mikkelsen (1996, p.158) for a discussion on the importance of non-integer values
of integration when modeling long-run dependencies in the conditional mean of economic time series.

- 23 -
The conditional variance is therefore given by:
[ ] [ ]1 12 20
( )
1 ( ) 1 1 ( ) ( )(1 )dt t
L
L L L L
ω λ
σ α β β φ ε− − = − + − − − ��������������������
(2.13)
or 2 2( )t tLσ ω λ ε= + , with 0 < d < 1.8
Chung (1999) underscores some little drawbacks in the BBM model: there is a
structural problem in the BBM specification since the parallel with the ARFIMA
framework of the mean equation is not perfect, leading to difficult interpretations of
the estimated parameters. Indeed the fractional differencing operator of the ARFIMA
process applies to the constant term of the mean equation (ARFIMA) while it does not
in the variance equation (FIGARCH). Chung proposes a slightly different process:
( ) [ ]2 2 2 2( )(1 ) 1 ( ) ( )dt t tL L Lφ ε σ β ε σ− − = − − , (2.14)
where 2σ is the unconditional variance of εt .
If we keep the same definition of ( )Lλ as in Equation (2.13), we can
formulate the conditional variance as
[ ] ( )12 2 2 21 1 ( ) ( )(1 )dt tL L Lσ σ β φ ε σ− = + − − − −
or ( )2 2 2 2( )t tLσ σ λ ε σ= + − . (2.15)
Notice that ( )Lλ is an infinite summation which, in practice, has to be
truncated. BBM propose to truncate ( )Lλ at 1000 lags (this truncation order may be
changed by the user) and initialize the unobserved 2tε at their unconditional moment.
Contrary to BBM, Chung proposes to truncate ( )Lλ at the size of the information set
(t-1) and to initialize the unobserved ( )2 2tε σ− at 0 (this quantity is small in
absolute values and has a zero average).
The idea of fractional integration has then been applied to other GARCH types
of models, including the Fractionally Integrated EGARCH (FIEGARCH) of
Bollerslev and Mikkelsen (1996) and the Fractionally Integrated APARCH
(FIAPARCH) of Tse (1998).
8 Note that, in the ARFIMA specification, we have 0 < d < 0.5

- 24 -
Similarly to the GARCH(p,q) process, the EGARCH(p,q) of Equation (2.7)
can be rearranged as an ARMA process:
( ) ( )( ) ( ) [ ]
[ ] ( )121 1
1
1 ... 1 ( )ln
1 ( )1 ...
t t tqq
L L Lg z g z
LL L
ψ ψ ψσ ω ω− −
+ + + += + = +
−∆−∆ − −∆.
Factorizing the autoregressive polynomial [ ]1 ( ) ( )(1 )dL L Lφ−∆ = − where all the roots
of φ(z) = 0 lie outside the unit circle, we can define the FIEGARCH (p,d,q) as9
( ) ( ) [ ]2 11ln ( ) 1 1 ( ) ( )
d
t tL L L g zσ ω φ ψ−−−= + − + . (2.16)
Finally, the FIAPARCH (p,d,q) model can be written as 10
( )( ) ( )( ) ( )11 1 1
d
t t tL L Lδδσ ω β φ ε γε
− = + − − − − . (2.17)
3. Estimation Methods
3.1 The Distributions
Three distributions are available in our program: the usual Gaussian (Normal)
distribution, the Student-t distribution and the Generalized Error Distribution (GED).
The GARCH models are estimated using a maximum likelihood (ML)
approach. The logic of ML is to interpret the density as a function of the parameters
set, conditional on a set of sample outcomes. This function is called the likelihood
function. It is quite evident from Equation (2.5) (and all the following equations of
Section 2) that the recursive evaluation of this function is conditional on unobserved
values. The ML estimation is therefore not perfectly exact. To solve the problem of
unobserved vales, we have set this quantities to their unconditional expected values.
9 Using the option BBM, ( )1 dL −− is truncated at some predefined value (see above). It is also possible
to truncate this polynomial at the information size at time t, i.e. t-1 (using option Chung in the Light
version).10 Notice that the FIAPARCH is also available in the ARFIMA-type specification, i.e.
( )( ) ( )( ) ( )12 21 1 1d
t t tL L Lδδσ σ β φ ε γε σ− = + − − − − − by using the option "Chung".

- 25 -
If we express the mean equation as in Equation (2.1) and t t tzε σ= , the density
function of the standard normal distribution is written as
( ) ( )2
1
exp 0.5|
2
t
t t
t
zfυ ε ψ
σ π−
−= .
The log-likelihood function to maximize is given by
( ) ( )2 2
1
1ln 2 ln
2
T
T t tt
L zπ σ=
= − + + ∑ , (2.18)
where T is the number of observations.
For a Student-t distribution, the log-likelihood is
( ) ( )2
2
1
1ln ln 0.5ln 2 0.5 ln 1 ln 1
2 2 2
Tt
T tt
zL
υ υ υ σ υυ=
+ = Γ − Γ − − − + + + − ∑
(2.19)
where υ is the degrees of freedom, 0 < υ ≤ ∞ and Γ( . ) is the gamma function.
The GED log-likelihood function of a normalized random variable is given by
( ) ( ) ( ) ( )1 2
1
ln 0.5 1 ln(2) ln 1 0.5lnT
tT t
t
zL
υ
υ λ υ υ σλ
−
=
= − − + − Γ −
∑
(2.20)
where -∞ < zt < ∞ , 0 < υ ≤ ∞ , Γ( . ) is the gamma function and
( ) ( )( )
22 1
3
υ υλ
υ
− Γ≡
Γ.
Of course, the choice of distribution has an particular impact on some models, such as
the EGARCH.11
11 For the Normal (Gaussian) distribution, the g(zt) function of equation 2.4 is
( )1 22( )t t tg z z zθ θ π
= + − For the Student-t distribution,
1 2
2 ( 2)( )
1( 1)* (0.5)
2 2
t t tg z z zυ
θ θυ υυ
− = + − + − Γ −Γ −Γ

- 26 -
3.2. The Standard Deviation Estimation Methods
Approximate Maximum Likelihood Estimates (MLE) and Quasi-Maximum
Likelihood Estimates (QMLE) of the standard deviations of the estimated parameters
are available. With the MLE method, when the assumption of conditional normality
does not hold, the ARCH parameters estimates will still be consistent (provided the
mean and variance functions are correctly specified) but the estimates of the
covariance matrix will not be consistent. Thus QMLE provide a solution to this
problem. The method used for the QMLE estimation is the one proposed by
Bollerslev and Wooldridge (1992).
3.3 Tests
In addition to the possibilities offered by GiveWin (ACF, PACF, QQ-plots…), several
tests are provided in our package:
1) Four Information Criteria that can be expressed as: 12
- LogL
Akaike = - 2 2n
kn
+
- ( )[ ]log logLogL
Hannan-Quinn = - 2 2n
k nn
+
- ( )logLogL
Schwarz = - 2 2n
kn
+
- LogL 2
Shibata = - 2 logn
n kn+ +
2) The value of the skewness and the kurtosis of the standardized residuals of the
estimated model, their t-tests and p-values. Moreover, the Jarque-Bera normality test
(Jarque and Bera, 1987) is also reported.
with υ being the degree of freedom of the distribution and Γ(.) denoting the gamma function.
Using the same notation for the GED, we have
( ) ( )( )
( ) ( )( )
21
2 2 1( ) 2 *
1 3t t tg z z ll z whereυ
υ υυλ λυ
υ
−Γ Γ= − − =
ΓΓ
12 LogL = log likelihood value, n = #observations and k = # parameters

- 27 -
3) The modified Box-Pierce statistics at lag *l for both standardized, i.e. ( )*BP l , and
squared standardized residuals, i.e. ( )2 *BP l . Under the null hypothesis of no
autocorrelation, the statistics ( ) ( )* 2 * and BP l BP l should be evaluated against the
( ) ( )2 * 2 * and l m l l p qχ χ− − − − , respectively (see McLeod and Li, 1983).
4) The diagnostic test of Engle and Ng (1993) that investigate possible
misspecification of the conditional variance equation. The Sign Bias Test examines
the impact of positive and negative return shocks on volatility not predicted by the
model under construction. The negative Size Bias Test (resp. positive Size Bias Test)
focuses on the different effects that large and small negative (resp. positive) return
shocks have on volatility, which is not predicted by the volatility model. Finally, a
joint test for these three tests is also provided.
5) The Engle LM ARCH test (Engle, 1982) to test the presence of ARCH effects in a
series.

- 28 -
IV. Using the Program
1. Installing the Files
To run the G@RCH 1.1 package, unzip the garch11.zip file in the ox/packages
directory (using folders names). A new Garch folder should be automatically created.
The list of the files contained in this garch11.zip file is available in readme.txt.
To run the "Full Version" of the program, you need to be sure that garch.oxo
and garch.h are present. Moreover, you have to be sure that you have a registered
version of Ox Professional 2.20, and that GiveWin and OxPack are correctly installed
on your computer. If you want to use the "Light Version", you need GarchEstim.ox,
garch.oxo and garch.h.
2. Running the “Full Version"
Open the database you want to use in GiveWin, and then select the OxPack
module by clicking on Modules\Start OxPack (see Figure 4.1).
Figure 4.1. Launching OxPack

- 29 -
Once you are in the OxPack environment, select the Add/Remove Package…
option in the Package menu. Click on the Browse button, then find and select
garch.oxo. Click on the Add button (see Figure 4.2).
Figure 4.2. Adding the Garch package
Then select Package/Garch and launch Model/Estimate. We are now in the
windows environment of our program. The list of all the variables of the database
appears in the Database section. Select those you want to use in your estimation and
click on the Add button. There are three possible statuses for each variable: dependent
variable (Y variable), regressor in the Mean (Mean) or regressor in the variance
(Variance).
Our program provides estimation for univariate models, so only one Y
variable per model is accepted. However you can include several regressors in the
mean and variance equations and the same variable can be a regressor in both
equations as in our example (Figure 4.3). Once you click on OK, the Model Settings
box automatically appears. This box allows you to select the specification of the
model: AR(FI)MA orders for the mean equation, GARCH orders, type of GARCH
model for the variance equation and the distribution (Figure 4.4).

- 30 -
.
Figure 4.3. Selecting the variables
Figure 4.4. Model Settings

- 31 -
When you click OK, you are asked to make a choice regarding the starting
values (Figure 4.5): you may (1) let the program choose the starting values, (2) enter
them manually, element by element, or (3) enter the starting values in a vector form
(the required form is "value1;value2;value3").
Figure 4.5. Selecting the Starting Values Method
The first method is obviously the easiest, and may be indicated for beginning
users, since it prevents from entering aberrant values. If a user wants particular
starting values for the estimation and if he does not know the sequence of the
parameters in the parameter vector used in our program, the second method should be
a solution. An advanced user knowing the program quite well may use the third
option as it is faster to do than the previous one. Note that, in the output, the estimated
parameters are notably given in a vector form, so that a user can just copy the vector
and paste it in this box for a subsequent estimation.
Then, the estimation method for standard deviations is asked: Maximum
Likelihood (ML) or Quasi-Maximum Likelihood (QML) or both. On this box (see
Figure 4.6), one may also select the sample and some maximization options when
clicking on the Options button (such has the number of iterations between printing
intermediary results…).

- 32 -
Figure 4.6. Standard Errors Estimation Methods
When the user clicks on OK, the Estimation procedure is launched and he
comes back to GiveWin. A new dialog box is launched if the starting values are
entered manually.
Let us assume that the element-by-element method has been selected. A new
window appears with all the possible parameters to be estimated. Depending on the
specification, some parameters have a value, other have not. The user should replace
only the former, since they are the parameters to be estimated for the specified model.
An example is proposed on Figure 4.7. If there are more than one value for the
same parameter (for instance an AR(2) process requires 2 autoregressive coefficients),
they have to be separated by semicolons and entered as follows:
value1;value2;…;valuek.

- 33 -
Figure 4.7. Entering the Starting Values
When the user clicks on the OK button, the program starts iterating and
estimating. Depending on the options selected earlier, it prints intermediary iteration
results such as this one:
Position after 10 BFGS iterations
parameters
// [0][0]...[0][9]
-0.053958 0.072994 -0.065922 0.0025936 0.059744
0.64508 0.23925 -0.043541 1.4105 1.0566
gradients
// [0][0]...[0][9]
2383.8 -4.8684 572.86 17393. 1854.0 2104.8
1629.5 -28.949 423.38 -375.30
function value =
-774.187995086
Obviously, the first part corresponds to the current estimated values of the
parameters, the second to their gradients and the third to the current Log Likelihood
value of the function. The final output is divided by default in two main parts: the
model specification reminder and the estimated values and other useful statistics of
the parameters.

- 34 -
Here is an example:
SPECIFICATIONS
--------------
Mean Equation : ARMA (0, 0) model.
No regressor in the mean
Variance Equation : EGARCH (1, 1) model.
No regressor in the variance
The distribution is a Student distribution, with 4.99811
degrees of freedom.
Strong convergence using numerical derivatives
Log-likelihood = -3080.02
Quasi Maximum Likelihood Estimation
Coefficient Std.Error t-value t-prob
Cst(M) 0.050169 0.01778 2.822 0.0048
Cst(V) 1.585800 1.02031 1.554 0.1203
GARCH(Beta1) 0.982485 0.00598 164.2 0.0000
ARCH(Alpha1) 0.296244 0.77182 0.3838 0.7011
EGARCH(Theta1) -0.019184 0.01667 -1.151 0.2499
EGARCH(Theta2) 0.077116 0.04642 1.661 0.0968
Student(DF) 4.998116 0.63231 7.905 0.0000
Estimated Parameters Vector :
0.050169; 1.585800; 0.982485; 0.296244;-0.019184; 0.077116;
4.998116
Note that the estimations are based on the numerical gradients (and not the
analytical gradients).
Once the model is estimated and once the results are printed, the program
returns to OxPack. New options are available in the Test menu: Graphic Analysis,
Tests and Store. The Graphic Analysis option allows to plot four different graphics:
the raw series, the residuals, the squared residuals and the conditional variance. These
graphics are drawn in GiveWin. Just as any other graph in the GiveWin environment,
they can be easily edited (colour, size…) and exported in many formats (.eps, .ps,
.wmf, .emf and .gwg).

- 35 -
Figure 4.8 provides an example:
Figure 4.8. Graphic Analysis
The Tests option launches a new dialog box (see Figure 4.9) where different
tests are available:
− the Information Criteria (Akaike, Schwarz, Hannan-Quinn and Shibata),
− the skewness, kurtosis and Jarque-Bera normality test,
− the Box-Pierce statistics for both residuals and squared residuals,
− the Sign Bias test of Engle & Ng (1993) and
− the Engle' LM ARCH test.

- 36 -
Figure 4.9. Tests Dialog Box
The results of these tests are printed in GiveWin.
TESTS :
-------
Information Criterium (minimize)
Akaike 2.716250 Shibata 2.716231
Schwarz 2.733893 Hannan-Quinn 2.722686
---------------
Statistic t-Test P-Value
Skewness -1.6246 31.642 9.7533e-220
Excess Kurtosis 22.347 217.72 0.00000
Jarque-Bera 48296. 48296. 0.00000
---------------
BOX-PIERCE :
Value
Mean of standardized residuals -0.00029
Mean of squared standardized residuals 1.07289

- 37 -
H0 : No serial correlation ==> Accept H0 when prob. is High [Q
< Chisq(lag)]
Box-Pierce Q-statistics on residuals
Q(5) = 8.27589 [0.141672 ]
Q(10) = 9.44816 [0.490164 ]
Q(50) = 46.8869 [0.599069 ]
---------------
Box-Pierce Q-statistics on squared residuals
--> P-values adjusted by 2 degree(s) of freedom
Q(5) = 7.05218 [0.070253 ]
Q(10) = 10.1216 [0.256595 ]
Q(50) = 15.9991 [0.999996 ]
---------------
Diagnostic test based on the news impact curve (EGARCH vs.
GARCH)
Test Prob
Sign Bias t-Test 0.97629 0.32892
Negative Size Bias t-Test 4.66895 0.00000
Positive Size Bias t-Test 0.17200 0.86344
Joint Test for the Three Effects 23.30871 0.00003
---------------
ARCH 1-2 test: F(2,2266)=2.39961 [0.0910]
---------------
Finally, the residuals, the squared residuals and the conditional variance series
can be stored in the database as a new variable. When selecting this option, a first
window appears and the user selects the series to be stored (Figure 4.10a). A default
name is then proposed for this series (Figure 4.10b).

- 38 -
Figure 4.10a. Storing in the Database
Figure 4.10b. Storing in the Database

- 39 -
3. Running the "Light Version"
First, to specify the model you want to estimate, you have to edit GarchEstim.ox with
any text editor. Yet we recommend OxEdit. It is a shareware that highlights Ox syntax
in color and its 1.50 version is free (see http://www.oxedit.com for more details).
From now on, we will assume that OxEdit is used.
The file is displayed like this:
Figure 4.11. GarchEstim.ox (part I)
The #include and #import statements show the files and the libraries that are
linked with GarchEstim. First, a new Garch object is created and a database is
loaded. The user has to enter the correct path of the database, but also has to pay
attention to the kind of database he wants to use. Indeed, the LoadIn7 function is
dedicated to In7 files (GiveWin databases). For other extensions, other functions need
to be called. For instance, to use a Microsoft Excel file, one has to pay attention to
two elements: the use of the correct function (LoadXls ) and the format of the
spreadsheet. The following convention has to be adopted when loading an Excel
spreadsheet: variables are in columns, columns with variables are labeled, there is an
unlabeled column containing the dates (with the form Year-Period) and the data form
a contiguous sample.

- 40 -
Here is an small example: 13
A B C D1 RET MON HOL2 1990-1 0.0439 1 03 1990-2 -0.0302 0 04 1990-3 0.0845 0 1
Coming back to Figure 4.11, we note then that the dependent variable (Y), the
regressor(s) in the mean equation (X) and the regressor(s) in the variance equation (Z)
are selected with the Select function. Ox being case- sensitive, the exact name of the
variable has to be entered. The second and third arguments denote the starting and
ending observations to be considered. By default, "0" and "0" mean that all the
observations are selected. From this selection, a sample can be extracted with the
SetSelSample function. The arguments are ordered as (StartYear, StartPeriod,
EndYear, EndPeriod2) and the default (-1, 1, -1, 1) means all the selected
observations. Next, the specification of the model for both the conditional mean and
the conditional variance equations can be fixed with the functions displayed on Figure
4.12.
Figure 4.12. GarchEstim.ox (part II)
13 See Doornik (1996) for the supported formats, the Load functions and other related information.You can also take a look at the DJIA.xls file included in the package for an example of Excel file readyto be loaded by Ox.

- 41 -
Quite explicit explanations are given within the GarchEstim file, so we will
not explain every line. We will nevertheless mention several elements. The
specification consists in four parts:
- the GARCH related part (from GARCH to APARCH) where orders, specific models
or distribution are specified.
- the Tests and Estimation Procedures part. MLE is related to the computation method
of the standard deviations of the estimated parameters, LAGS requires a vector of
integers corresponding to the lags of the Box-Pierce statistics and TESTONLY is
useful when you want to run some tests on the raw series, prior to any estimation.
- the Parameters related part consists in the DoEstimation function that launches the
estimation of the model. The argument is a vector containing starting values of the
parameters in a specified order. If "<>" is entered as argument, the program will use
predefined values as the starting values for the parameters. The order of the
parameters is the following (see the equation in Models section of this tutorial):
<Cst in Mean; Regressors in mean coefficients; d in ARFIMA ; AR coefficients ; MA
coefficients ; Cst in Variance ; Regressors in variance coefficients ; FI coefficient ; GARCH β
coefficients ; ARCH α coefficients ; GJR ω coefficient ; EGARCH θ1 ; EGARCH θ2 ; APARCH
γ coefficient ; APARCH δ coefficient ; GED degree of freedom ; Student degree of freedom>
- the Results part include the GRAPHS function to print or not the graphics after the
estimation and the STORE function, which allows storing the estimated residuals,
squared residuals or conditional variances in the opened database or as a new file.
When the parameterization is done, run the file. If you use oxl, select
Modules/Run Default Module and the results will be printed in OxEdit. If you use
OxRun, select Modules/OxRun and the results will be printed in GiveWin. Graphics
will only be displayed if you are using GiveWin.

- 42 -
V. Versions and Future Improvements
1. Releases History
v.1.1 : October, 30th 2000.
v.1.0 : September, 4th, 2000.
2. Future Improvements
• Analytical gradients
• Mean / Variance / Density forecast
• Inclusion of other densities (mixtures of Normal or Student-t)
• Specification tests (stability, goodness-of-fit, …)
• GARCH-In-Mean and extensions
• Faster procedures for Fractionally Integrated models
• …
WE WISH YOU A PRODUCTIVE USE OF G@RCH 1.1 !
VI. References
BAILLIE, R.T, BOLLERSLEV, T., & MIKKELSEN, H.O., (1996), "Fractionally Integrated
Generalized Autoregressive Conditional Heteroskedasticity", Journal of
Econometrics, Vol.74, 3-30.
BEINE, M., LAURENT, S., & LECOURT, C., (1999), "Accounting for Conditional
Leptokurtosis and Closing Days Effects in FIGARCH Models of Daily Exchange
Rates", Forthcoming in Applied Financial Economics.
BOLLERSLEV, T, (1986), "Generalized Autoregressive Conditional
Heteroskedasticity", Journal of Econometrics, Vol.31, 307-327.
BOLLERSLEV, T., & WOOLDRIDGE, J.M., (1992), "Quasi-Maximum Likelihood
Estimation and Inference in Dynamic Models with Time Varying Covariances",
Econometric Reviews, Vol.11, 143–172.

- 43 -
BOLLERSLEV, T., & MIKKELSEN, H.O., (1996), "Modeling and Pricing Long Memory
in Stock Market Volatility", Journal of Econometrics, Vol.73, 151-184.
BOX, G. & JENKINS, G.M., (1976), Time Series Analysis: Forecasting and Control,
Revised Edition, Holden-Day.
CHUNG, C.F., (1999), "Estimating the Fractionally Integrated GARCH Model",
National Taiwan University, Working Paper.
DING, Z., GRANGER, C.W.J., & ENGLE, R.F., (1993), "A Long Memory Property of
Stock Market Reurns and a New Model", Journal of Empirical Finance, Vol. 1,
83-106.
DOORNIK, J.A., (1999), Ox : An Object Oriented Matrix Programming Language,
Third Edition, Timberlake Consultants Ltd., 485 p.
DOORNIK, J.A., DRAISMA, G., & OOMS, M., (1998), Introduction to Ox, Timberlake
Consultants Ltd..
DOORNIK, J.A., & OOMS, M., (1999), "A Package for Estimating, Forecasting and
Simulating ARFIMA models: Arfima package 1.0 for Ox", Nuffield College,
Oxford, Discussion Paper.
ENGLE, R.F., (1982), "Autoregressive Conditional Heteroscedasticity with Estimates
of the Variance of United Kingdom Inflation", Econometrica, Vol.50, No.4, 987-
1007.
ENGLE, R.F., & BOLLERSLEV, T., (1986), "Modeling the Persistence of Conditional
Variances", Economic Reviews, Vol.5, 1-50.
ENGLE, R.F., & NG, V.K., (1993), "Measuring and Testing the Impact of News on
Volatility", Journal of Finance, Vol.48, No. 5, 1749-1778.
GEWEKE, J., (1986), "Modeling the Persistence of Conditional Variances: A
Comment", Econometric Review, Vol.5, 57-61.
GLOSTEN, L.R., JAGANNATHAN, R. & RUNKLE, D.E., (1993), "On the Relation
between Expected Value and the Volatility of the Nominal Excess Return on
Stocks", Journal of Finance, Vol. 48, No.5, 1779-1801.
GRANGER, C.W.J., (1980), "Long Memory Relationships and the Aggregation of
Dynamic Models", Journal of Econometrics, Vol.14, 227-238.

- 44 -
GRANGER, C.W.J., & JOYEUX, R., (1980), "An Introduction to Long-Memory Time
Series Models and Fractional Differencing", Journal of Time-Series Analysis,
Vol.1, 15-29.
JARQUE, C.M., & BERA, A.K., (1987), "A Test for Normality of Observations and
Regression Residuals", International Statistical Review, Vol.55, 163-172.
MCLEOD, A.I. & LI, W.K., (1983), "Diagnostic Checking ARMA Time Series Models
Using Squared Residuals Autocorrelations", Journal of Time Series Analysis, 4,
269-273.
NELSON, D.B., (1991), "Conditional Heteroskedasticity in Asset Returns : A New
Approach", Econometrica, Vol..59, No.2, 347-370.
PENTULA, S.G., (1986), "Modeling the Persistence of Conditional Variances: A
Comment", Econometric Review, Vol.5, 71-74.
SCHWERT, W., (1990), "Stock Volatility and the Crash of '87", Review of Financial
Studies, Vol.3, No.1, 77-102.
TAYLOR, S., (1986), Modelling Financial Time Series, New York, John Wiley &
Sons.
TSE, Y.K., (1998), "The Conditional Heteroscedasticity of the Yen-Dollar Exchange
Rate", Journal of Applied Econometrics, Vol..13, 49-55.
ZAKOIAN, J-M., (1994), "Threshold Heteroskedastic Models", Journal of Economic
Dynamics and Control, Vol.18, 931-955.