Embed Size (px)
Citation preview
Modelling individual-building energy use and
indoor health exposures for urban areas using
machine learning
Dr Jonathon [email protected]
Lecturer (Assistant Professor) Urban Physics and HealthUCL Institute for Environmental Design and Engineering, London, UK

Slide 2 of 24
Outline
1. Background
2. Tools we use
3. Example results
4. Conclusions
23rd May 2019 | Finnish Association of Civil Engineers RIL

Slide 3 of 24
1. About Us• The Bartlett
• UCL’s school of the Built Environment• #1 Institution in the world for Architecture/Built Environment
(QS)
• Institute for Environmental Design and Engineering• “pursues a deeper understanding of the interactions between
the built environment and health, human wellbeing, productivity, energy use and climate change”
23rd May 2019 | Finnish Association of Civil Engineers RIL

Slide 4 of 24
1. Research we do
• Interested in the intersection between health and energy in the
buildings
• Involvement in a number of projects estimating exposure to
environmental hazards in indoor environments, e.g. for
•UK Government
• Public Health England
•UK Committee on Climate Change
•World Health Organisation
• Longstanding collaboration with environmental epidemiologists
at LSHTM to combine buildings and health data.
23rd May 2019 | Finnish Association of Civil Engineers RIL
Slide 5 of 24
1. Background – Why Housing?
• There is a critical need to reduce energy consumption and CO2
emissions
• Buildings are responsible for 25% of all greenhouse gas
emissions in the UK
• Very poor energy performance
• In developed countries, around 90% of time spent indoors
• Around 60% or our time is spent in our own homes
• Housing can modify population exposures to e.g:
• Cold
• Heat exposure during hot weather
• Air pollution from both outdoor and indoor sources
• Communicable disease, damp, etc….
23rd May 2019 | Finnish Association of Civil Engineers RIL

Slide 6 of 24
1. Background – Hazards, exposures, and vulnerabilities
• Climate change means higher average temperatures and an increasing number of
heatwave events will occur in the future
• Heatwaves such as the 2003 heatwave that is thought to have caused 70,000 excess deaths
across Europe will become the norm
• The population is also aging
• The elderly are significantly more vulnerable during hot weather and air pollution
episodes.
• Cities are developing
• Urban areas are growing
• Houses are changing
• We need to build energy efficient housing
23rd May 2019 | Finnish Association of Civil Engineers RIL

Slide 7 of 24
1. Background – Research Questions• What is the role of housing on population health?
• How might changes to housing from different policies impact energy consumption and population health?
• Where are the areas at risk due to the environment, vulnerable populations, and poor housing?
23rd May 2019 | Finnish Association of Civil Engineers RIL

Slide 8 of 24
2. Tools we use – Building Physics
Building inputs Output:
.epw file input
Weather
23rd May 2019 | Finnish Association of Civil Engineers RIL
• We use EnergyPlus, a dynamic building simulation tool, to model typical
archetypes within the English housing stock
• EnergyPlus is a building simulation software which can estimate dynamic indoor
conditions given outdoor weather conditions and occupant behaviours
Slide 9 of 24
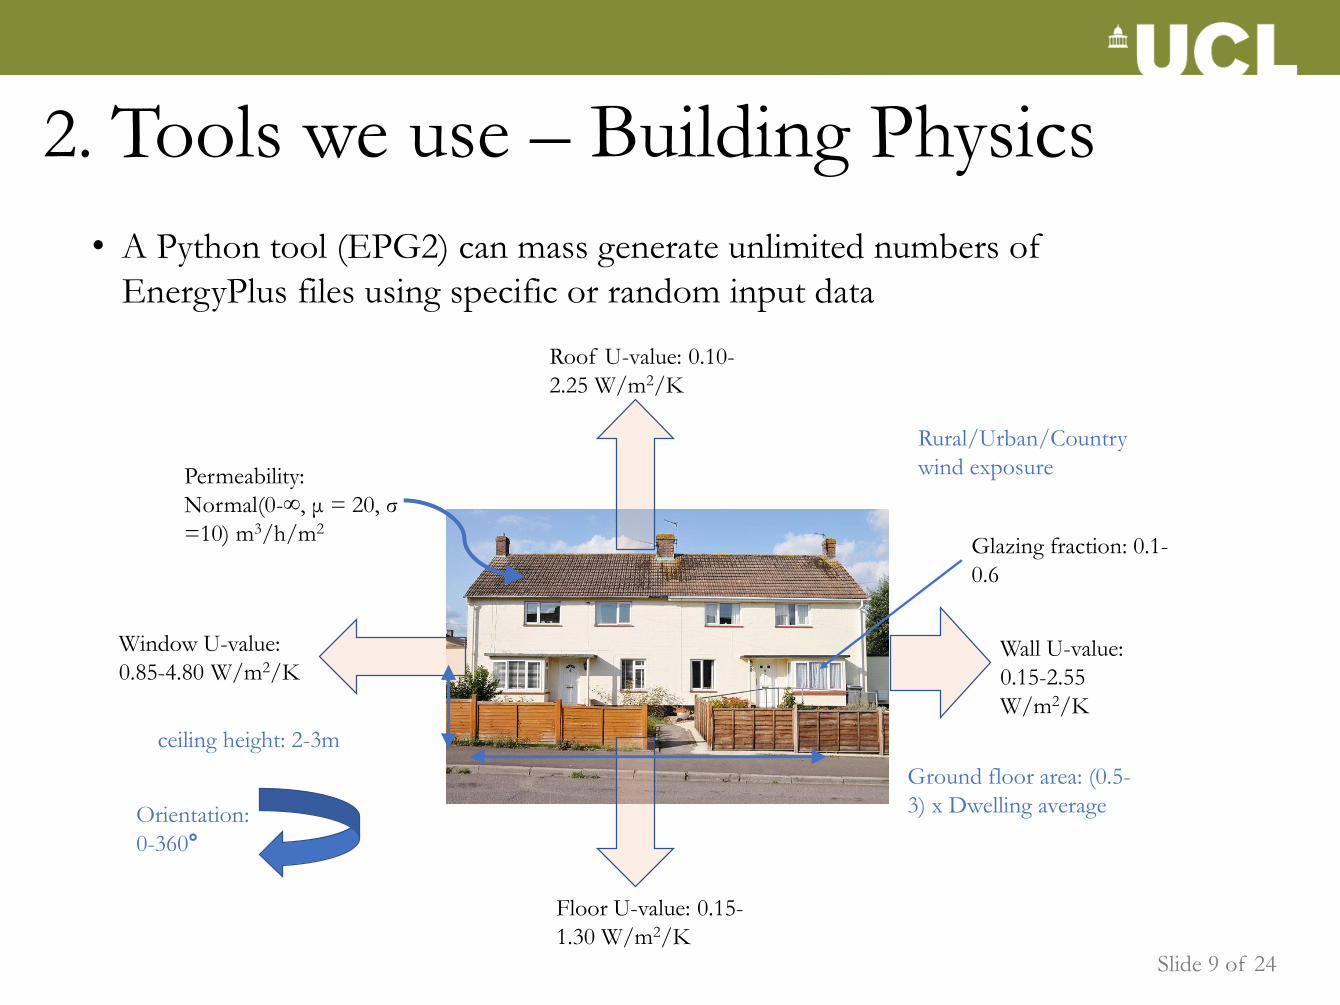
Orientation:
0-360°
Wall U-value:
0.15-2.55
W/m2/K
Roof U-value: 0.10-
2.25 W/m2/K
Window U-value:
0.85-4.80 W/m2/K
Permeability:
Normal(0-∞, μ = 20, σ
=10) m3/h/m2
Floor U-value: 0.15-
1.30 W/m2/K
ceiling height: 2-3m
Ground floor area: (0.5-
3) x Dwelling average
Glazing fraction: 0.1-
0.6
Rural/Urban/Country
wind exposure
2. Tools we use – Building Physics
• A Python tool (EPG2) can mass generate unlimited numbers of
EnergyPlus files using specific or random input data

Slide 10 of 24
2. Tools we use – Building Physics
• Model results for energy, temperature, and ventilation (as proxy for
indoor air quality) compare quite well with measured values
• Scope for additional (Bayesian) calibration with measured values
• Problem:
• EnergyPlus is slow – it can take 5-10 minutes to simulate a single
dwelling for a year on a laptop
• We want to do things at population or stock-level
• We want to be able to rapidly compare housing and environment
policies
• Solution
• High Throughput Computing
• Machine learning
23rd May 2019 | Finnish Association of Civil Engineers RIL
Slide 11 of 24
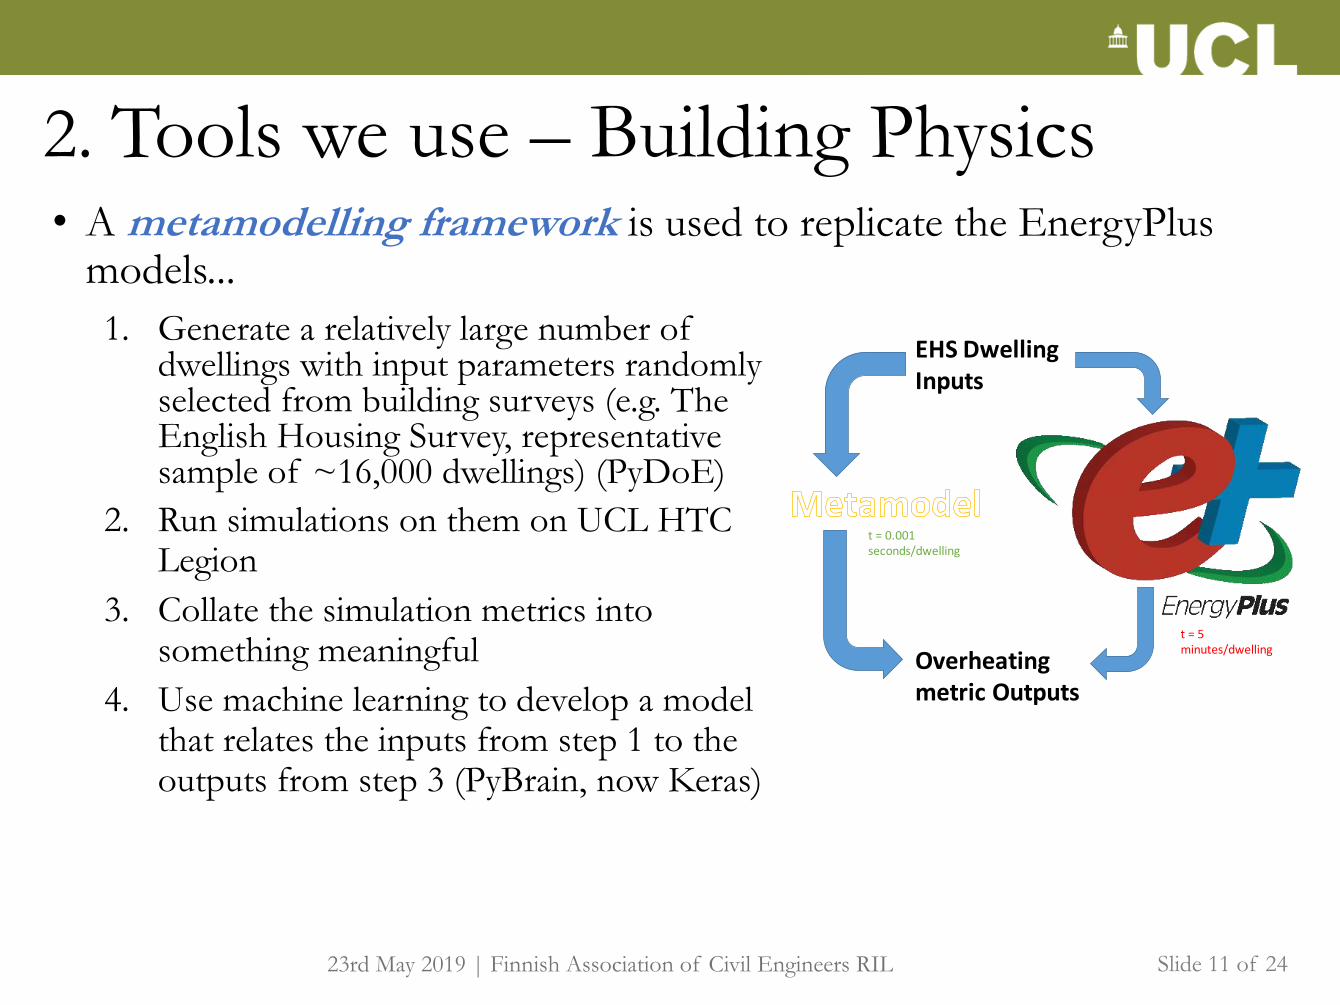
• A metamodelling framework is used to replicate the EnergyPlus models...
EHSDwellingInputs
OverheatingmetricOutputs
t =0.001seconds/dwelling
t =5minutes/dwelling
2. Tools we use – Building Physics
23rd May 2019 | Finnish Association of Civil Engineers RIL
1. Generate a relatively large number of dwellings with input parameters randomly selected from building surveys (e.g. The English Housing Survey, representative sample of ~16,000 dwellings) (PyDoE)
2. Run simulations on them on UCL HTC Legion
3. Collate the simulation metrics into something meaningful
4. Use machine learning to develop a model that relates the inputs from step 1 to the outputs from step 3 (PyBrain, now Keras)

Slide 12 of 24
• Much faster!
• Can do around 10,000 dwellings a minute
• We have developed NN models for:
• Space heating energy demand
• Indoor overheating risk
• Indoor cold risk
• Indoor air pollution (with flags for houses with indoor sources of pollution)
• Moisture/DampExample of a typical neural network architecture
2. Tools we use – Machine learning
23rd May 2019 | Finnish Association of Civil Engineers RIL
Symonds et al, (2016). Development of an England-wide indoor overheating and air pollution model using artificial neural networks. JBPS, 1-14
• Neural Networks performed best of all machine learning methods

Slide 13 of 24
2. Tools we use – Building Stock Models
• Model can be applied to parameterised housing stock models:• English Housing Survey (~16,000
dwellings)• Representative• Includes occupant info where
vulnerabilities can be inferred
• Energy Performance Certificate (EPC) database• Database of around 11 million homes
in England and Wales with address-level information
• Can be located (useful for local UHI or ambient air pollution)
23rd May 2019 | Finnish Association of Civil Engineers RIL

Slide 14 of 24
2. Tools we use – Health Calculations
• Health models can be used to relate exposures to health outcomes.
• Usually derived using outdoor relationships which we assume are valid for indoors
• Metamodel estimates exposure
• E.g. Heat Exposure
• The age(s) of the dwelling occupant
• Background mortality rate for age groups
• Outdoor weather conditions
• Housing modification of temperature exposure
𝑖𝑜𝑐𝑐𝑢𝑝𝑎𝑛𝑡𝑠𝑖 × 𝑑𝑒𝑎𝑡ℎ𝑟𝑎𝑡𝑒𝑖 × 𝑅𝑅ℎ𝑒𝑎𝑡,𝑖 − 1
Armstrong et al (2011)
23rd May 2019 | Finnish Association of Civil Engineers RIL

Slide 15 of 24
3. Example Results - Overheating• Model may be used to predict risks due to housing and UHI over
time at the individual-building level.
23rd May 2019 | Finnish Association of Civil Engineers RIL
Slide 16 of 24
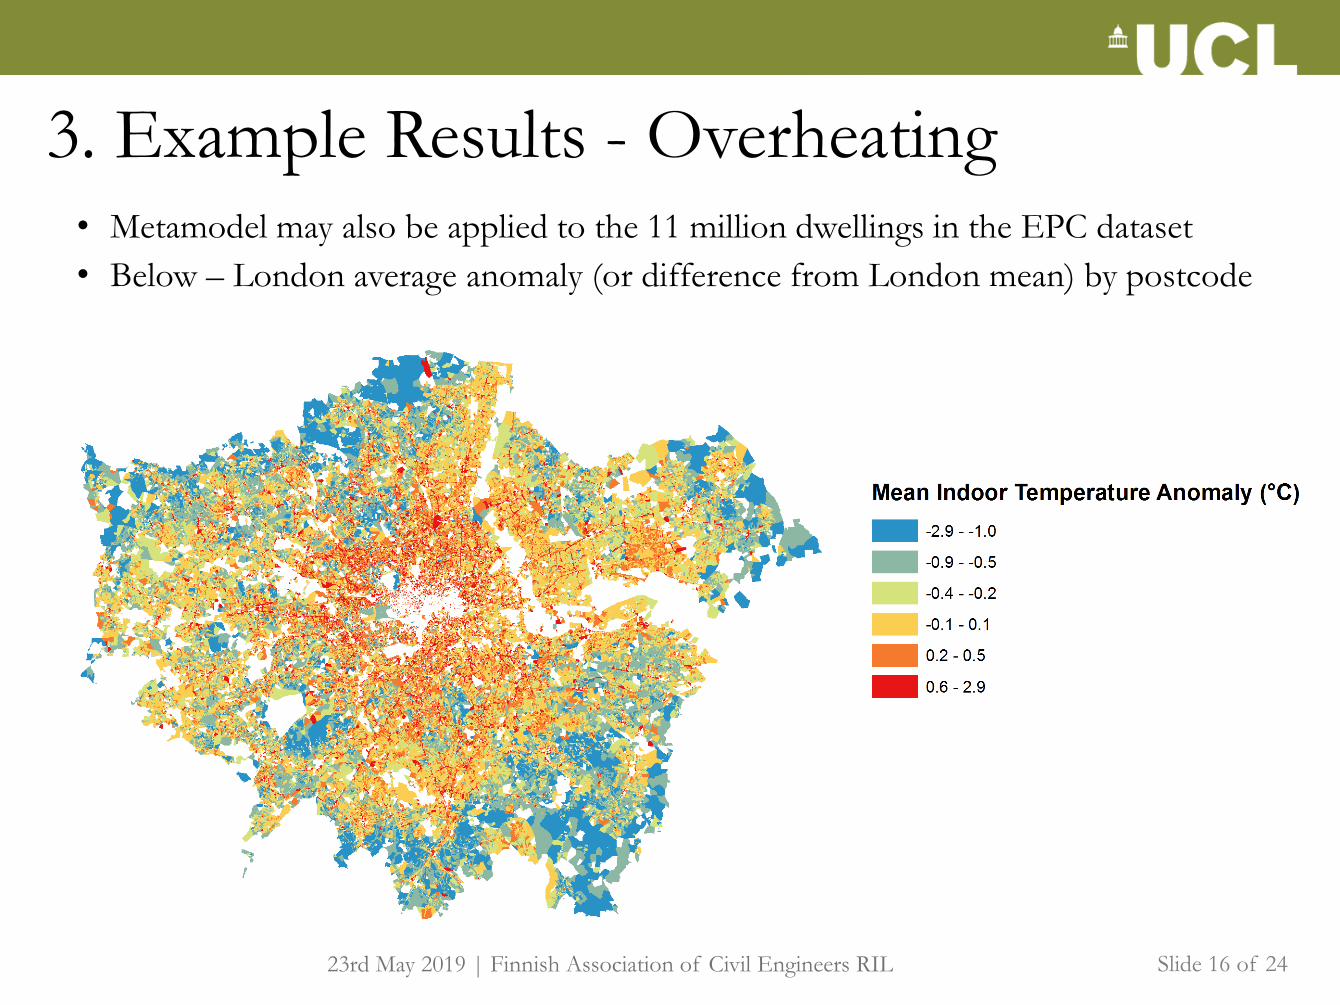
3. Example Results - Overheating• Metamodel may also be applied to the 11 million dwellings in the EPC dataset
• Below – London average anomaly (or difference from London mean) by postcode
23rd May 2019 | Finnish Association of Civil Engineers RIL

Slide 17 of 24
3. Example Results - Overheating• Indoor temperatures can be adjusted relative to local outdoor temperatures
• Here, it’s adjusted using a coarse resolution national air temperature map, but could use any UHI
23rd May 2019 | Finnish Association of Civil Engineers RIL
Slide 18 of 24
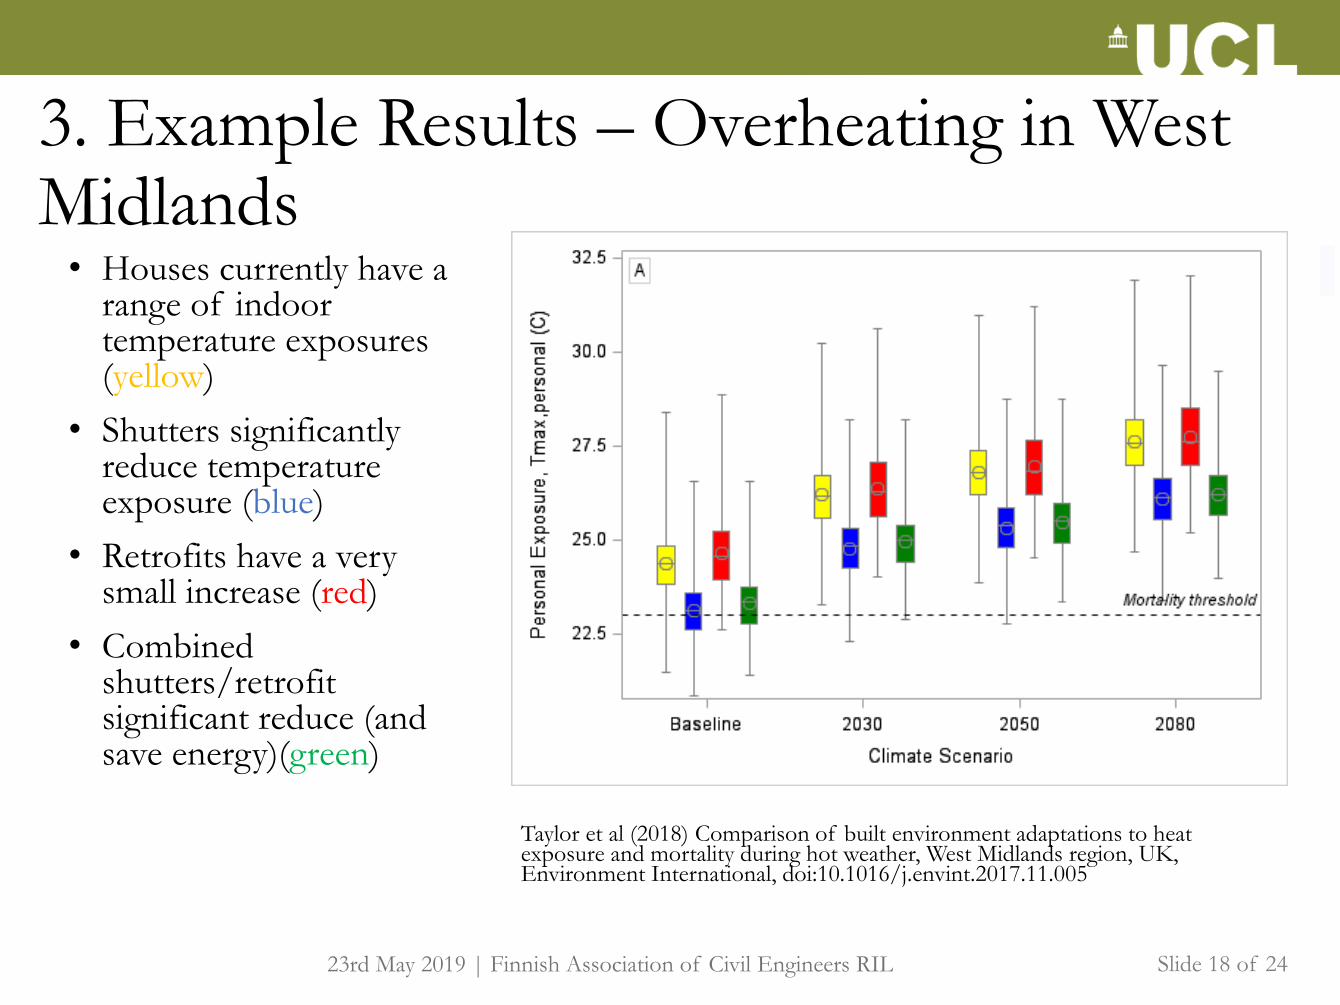
3. Example Results – Overheating in West Midlands• Houses currently have a
range of indoor temperature exposures (yellow)
• Shutters significantly reduce temperature exposure (blue)
• Retrofits have a very small increase (red)
• Combined shutters/retrofit significant reduce (and save energy)(green)
23rd May 2019 | Finnish Association of Civil Engineers RIL
Taylor et al (2018) Comparison of built environment adaptations to heat exposure and mortality during hot weather, West Midlands region, UK, Environment International, doi:10.1016/j.envint.2017.11.005

Slide 19 of 24
3. Example Results - Overheating in West Midlands• Shutters may decrease
mortality by• 60% in current conditions• 30% in heatwave
conditions
• Retrofits may increase mortality by when not combined with additional cooling• 14% in current conditions• 1% in heatwave
conditions
• Effectiveness of shutters at preventing mortality decreases as temperatures increase
23rd May 2019 | Finnish Association of Civil Engineers RIL

Slide 20 of 24
3. Example Results - Overheating in West Midlands
• Adaptations can have implications for energy use• Painting the roof
white reduces temperature exposures
• But, increases winter space heating energy consumption by 4%
• Energy efficiency upgrades reduce energy use, but can increase overheating
23rd May 2019 | Finnish Association of Civil Engineers RIL
Slide 21 of 24
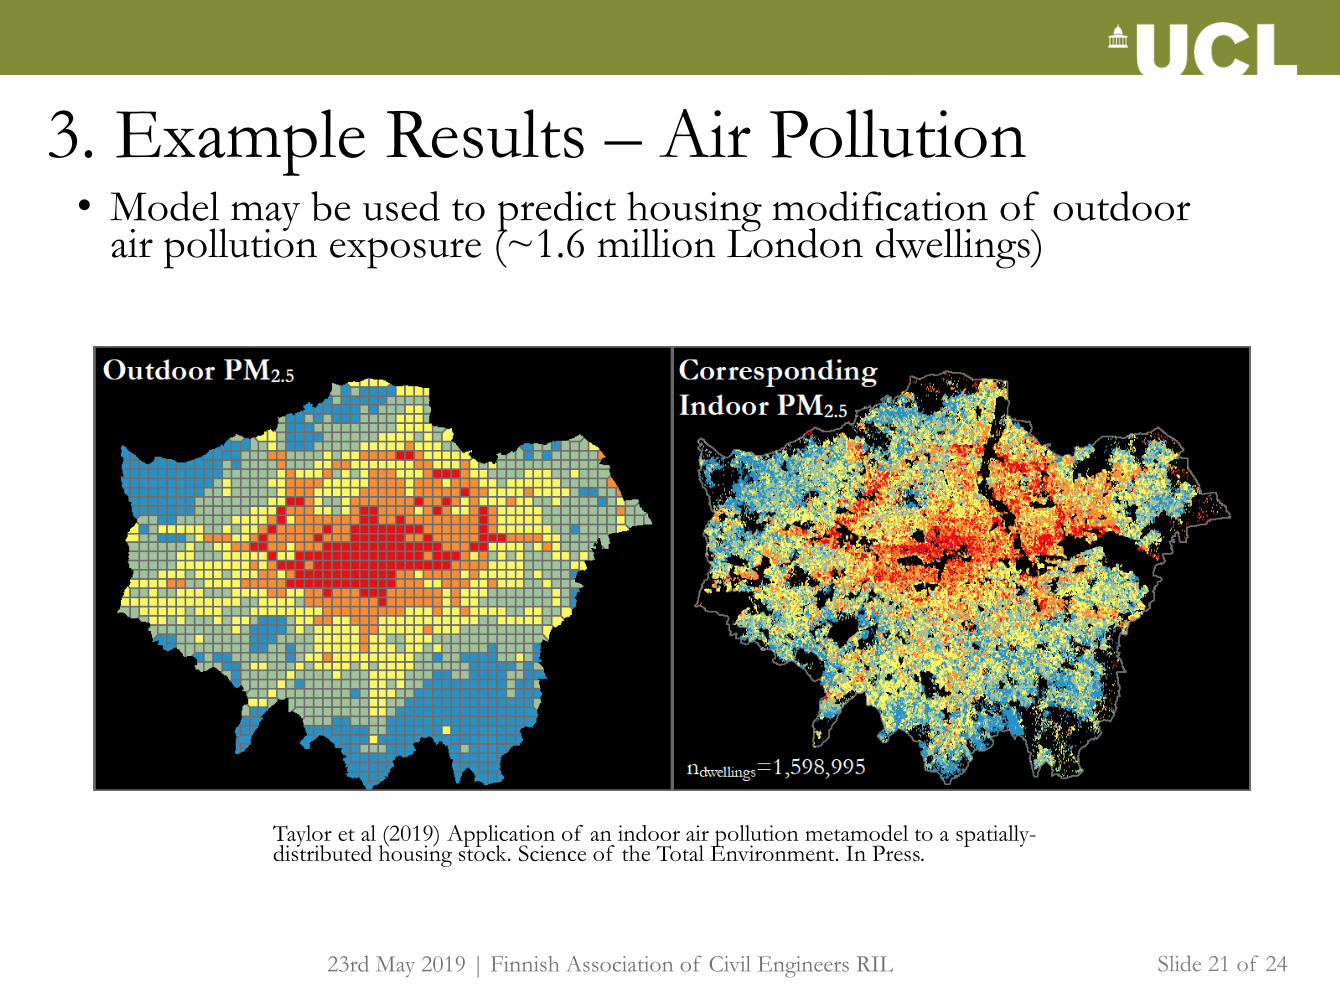
3. Example Results – Air Pollution• Model may be used to predict housing modification of outdoor
air pollution exposure (~1.6 million London dwellings)
23rd May 2019 | Finnish Association of Civil Engineers RIL
Taylor et al (2019) Application of an indoor air pollution metamodel to a spatially-distributed housing stock. Science of the Total Environment. In Press.

Slide 22 of 24
3. Results – Air Pollution• Model may be used to predict exposure from both indoor and outdoor
sources (~11.5 million dwellings)
23rd May 2019 | Finnish Association of Civil Engineers RIL
• Full energy efficient retrofit of the stock may reduce space heating demands by around 25% but increase e.g. CO exposures by 17.6%

Slide 23 of 24
3. Conclusions
• Housing is an important area to reduce energy consumption
• Primary environment where people spend their time.
• We can use building physics tools, stock models, and health models to explore housing energy/health trade-offs at population level
• We can model changes to exposures from, e.g.• Energy efficient retrofit
• Housing adaptations to climate change
• Outdoor environmental changes
23rd May 2019 | Finnish Association of Civil Engineers RIL

Slide 24 of 24
Questions?
Feel free to get in touch:[email protected]
23rd May 2019 | Finnish Association of Civil Engineers RIL