Embed Size (px)
Citation preview

INDOOR MODELLING BENCHMARK FOR 3D GEOMETRY EXTRACTION
Charles Thomson* & Jan Boehm
Dept. of Civil, Environmental & Geomatic Engineering (CEGE),
University College London, Gower Street, London, WC1E 6BT, UK
[email protected]; [email protected]
Commission V, WG V/4
KEY WORDS: Indoor, 3D Modelling, Benchmark, Terrestrial Laser Scanning, Segmentation, Reconstruction
ABSTRACT:
A combination of faster, cheaper and more accurate hardware, more sophisticated software, and greater industry acceptance have all
laid the foundations for an increased desire for accurate 3D parametric models of buildings. Pointclouds are the data source of choice
currently with static terrestrial laser scanning the predominant tool for large, dense volume measurement. The current importance of
pointclouds as the primary source of real world representation is endorsed by CAD software vendor acquisitions of pointcloud
engines in 2011. Both the capture and modelling of indoor environments require great effort in time by the operator (and therefore
cost). Automation is seen as a way to aid this by reducing the workload of the user and some commercial packages have appeared
that provide automation to some degree. In the data capture phase, advances in indoor mobile mapping systems are speeding up the
process, albeit currently with a reduction in accuracy. As a result this paper presents freely accessible pointcloud datasets of two
typical areas of a building each captured with two different capture methods and each with an accurate wholly manually created
model. These datasets are provided as a benchmark for the research community to gauge the performance and improvements of
various techniques for indoor geometry extraction. With this in mind, non-proprietary, interoperable formats are provided such as
E57 for the scans and IFC for the reference model. The datasets can be found at: http://indoor-bench.github.io/indoor-bench
* Corresponding author
1. INTRODUCTION
1.1 Motivation
The need for 3D models of buildings has gained increased
momentum in the past few years with the increased accuracy
and reduced cost of instrumentation to capture the initial
measurements. This tied with more sophisticated geometric
modelling tools to create the digitised representation has helped
smooth the process. Alongside this, the concurrent development
of Building Information Modelling (BIM) worldwide has
created demand for accurate 3D models of both exterior and
interior of assets throughout their lifecycle. This is due to a key
component of BIM being a data-rich 3D parametric model that
holds both geometric and semantic information.
Generally, digital modelling is carried out to provide a
representation or simulation of an entity that does not exist in
reality. However Geomatics seeks to model entities as they exist
in reality. Currently the process is very much a manual one and
recognised by many as being time-consuming, tedious,
subjective and requiring skill (Rajala and Penttilä, 2006; Tang
et al., 2010).
Human intuition provides the most comprehensive
understanding of the complex scenes presented in most indoor
environments, especially when adding rich semantic
information as required for BIM to be effective. However with
the continuing development of capture devices and modelling
algorithms, driven by the increased need for indoor models, it is
felt that a common benchmark dataset is required that represents
the status quo of capture, allowing different geometry extraction
methods to be tested against it as they are developed.
1.2 Indoor Geometry Extraction
Geomatics has a track record in geometry recovery with
reconstruction from terrestrial data of facades (Schmittwilken
and Plümer, 2010), pipe work (Kawashima et al., 2011) and
also from aerial LIDAR data (Pu and Vosselman, 2009; Tao,
2005). However Nagel et al. (2009) points out that the full
automatic reconstruction of building models has been a topic of
research for many groups over the last 25 years with little
success to date.
That said changes in capture requirements and improvements in
technology have pushed the focus onto interior reconstruction.
That focus has mainly been on the use of computational
geometry algorithms to extract the 3D representation of
building elements, including surface normal approaches (Barnea
and Filin, 2013), plane sweeping (Budroni and Boehm, 2010)
and region growing (Adan and Huber, 2011).
Laser scanners can naturally only measure visible surfaces and
surface-based reconstructions have been common as above.
However the 3D parametric model at the heart of BIM requires
the production of volumetric geometry, therefore approaches
based on voxels have been advanced, such as the reconstruction
of the indoor environment from (Oesau et al., 2014) who use
space partitioning, labelling and graph-cut to reconstruct
geometry. It should be noted that all these methods only
The International Archives of the Photogrammetry, Remote Sensing and Spatial Information Sciences, Volume XL-5, 2014ISPRS Technical Commission V Symposium, 23 – 25 June 2014, Riva del Garda, Italy
This contribution has been peer-reviewed.doi:10.5194/isprsarchives-XL-5-581-2014 581
construct simple CAD geometry and not parametric geometry as
would be required for BIM.
Due to the activity in this field two review papers have been
written summarising the state of reconstruction research into
automated geometry reconstruction for buildings. Tang et al.
(2010) comprehensively reviews the area of geometry
generation for BIM from laser scanning and divides the review
into the main parts of the process to be achieved: knowledge
representation, geometric modelling, object recognition,
relationship modelling and performance evaluation. The paper
states that "methods and testbeds for evaluating algorithm
performance have not been formalized" and calls for "...work to
develop reference testbeds that span the use cases for as-built
BIMs".
Hichri et al. (2013) summarises this landscape by concluding
similarly to Tang et al. (2010) by saying that these approaches
are satisfactory for simple planar geometry but for varied shapes
many automation approaches would have to increase in
complexity meaning that they would risk becoming bespoke to
the scene being interpreted for reconstruction.
2. AREAS UNDER INVESTIGATION
The areas chosen to create the benchmark datasets are both
sections of the UCL Chadwick Building; a late Victorian steel-
framed building with stone façades. This represents a typical
historical building in London that has had several retrofits over
the years to provide various spaces for the changing nature of
activities within the UCL department housed inside; currently
the Department of Civil, Environmental & Geomatic
Engineering.
The first area is a simple corridor section from the second floor
of the building. The second area is a cluttered office from a
modern retrofitted mezzanine.
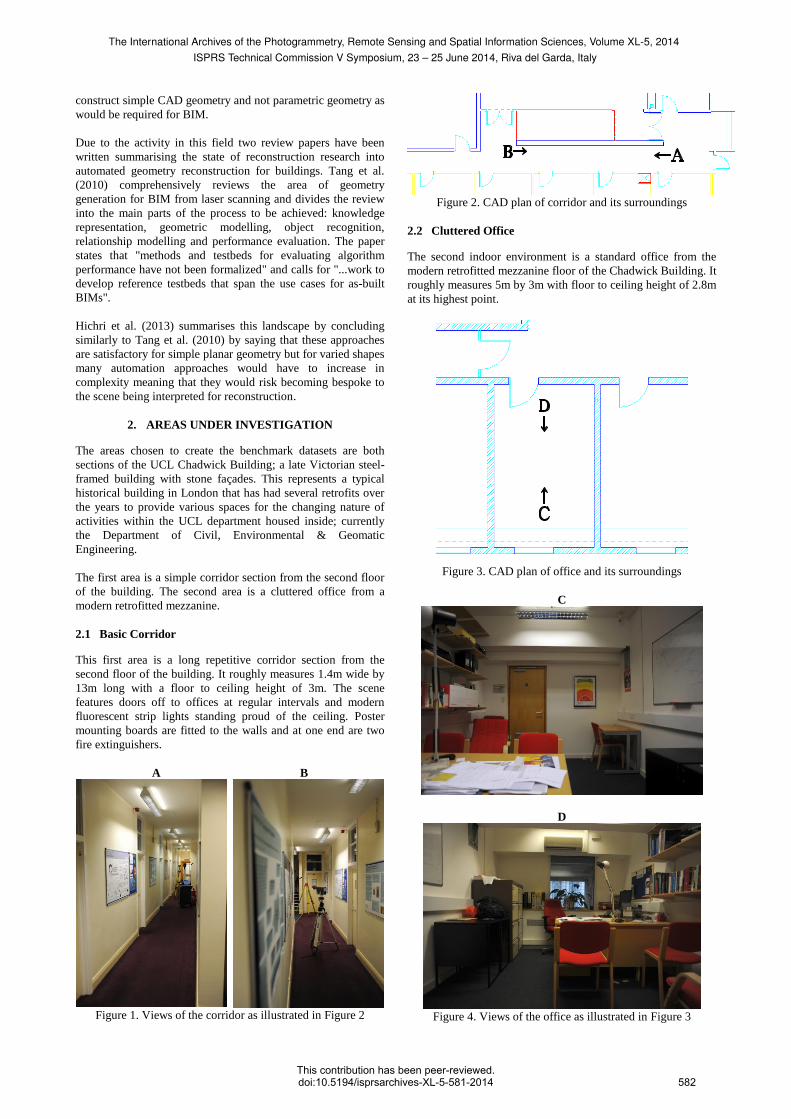
2.1 Basic Corridor
This first area is a long repetitive corridor section from the
second floor of the building. It roughly measures 1.4m wide by
13m long with a floor to ceiling height of 3m. The scene
features doors off to offices at regular intervals and modern
fluorescent strip lights standing proud of the ceiling. Poster
mounting boards are fitted to the walls and at one end are two
fire extinguishers.
A B
Figure 1. Views of the corridor as illustrated in Figure 2
Figure 2. CAD plan of corridor and its surroundings
2.2 Cluttered Office
The second indoor environment is a standard office from the
modern retrofitted mezzanine floor of the Chadwick Building. It
roughly measures 5m by 3m with floor to ceiling height of 2.8m
at its highest point.
Figure 3. CAD plan of office and its surroundings
C
D
Figure 4. Views of the office as illustrated in Figure 3
The International Archives of the Photogrammetry, Remote Sensing and Spatial Information Sciences, Volume XL-5, 2014ISPRS Technical Commission V Symposium, 23 – 25 June 2014, Riva del Garda, Italy
This contribution has been peer-reviewed.doi:10.5194/isprsarchives-XL-5-581-2014 582
The environment contains many items of clutter that occlude the
structural geometry of the room including filing cabinets, air
conditioning unit, shelving, chairs and desks. Also there is a
variable ceiling height due to supporting beams that have been
boxed in with plasterboard with the top of the window recessed
into a void. Although the structural steel is not visible, the steel
hangers that support them are visible on each wall under each
beam.
3. BENCHMARK DATA FOR EVALUATION
For each of the benchmark datasets, the capture process is
described including the static scanning with a Faro Focus 3D
laser scanner and indoor mobile mapping with a Viametris
iMMS. These instruments represent the state of the art in both
categories of system at time of writing. More can be read about
their operation and fitness for purpose for indoor geometry
capture in (Thomson et al., 2013) as well as test of manually
created geometry.
The manual ‘truth’ model creation is also described with
clarifications of what has been modelled and why. This model is
created using the same standard process as done in industry to
create the parametric model of an existing asset, thereby
presenting a product of the status quo that is acceptable for
further use by other participants in the BIM process. The
specification used for the parametric modelling of both datasets
is the freely available BIM Survey Specification produced by
the UK-based surveying company Plowman Craven (Plowman
Craven Limited, 2012). Both models were taken up to Level 3
as defined by this specification which requires basic families
but not detailed and moveable objects to be created.
All the benchmark data described below in this section is freely
available at: http://indoor-bench.github.io/indoor-bench
3.1 Basic Corridor Data
3.1.1 Faro Focus 3D S
Five scans were captured with the Faro Focus terrestrial laser
scanner. The scan setting used was 1/8 of full density at 4x
quality. This provides a prospective density of 12mm at 10m
with a full scan providing up to 10.9 million point
measurements. The five scan setups were as shown in Figure 5
and were surveyed in using a Leica TS15 total station, as were
their checkerboard targets.
Scan No. Scan Position (metres) Cropped
Points X Y Z
000 4.814 -8.115 0.229 254,159
002 9.294 -2.044 0.287 460,043
004 4.814 4.281 0.193 10,222,459
006 -3.825 -3.377 0.236 9,761,475
008 0.000 0.000 0.000 10,677,978
Total: 31,376,114
Table 1. Scan positions and number of points in E57 benchmark
The scans were processed in Faro Scene 5.1 and a cropped
section of the corridor exported as an E57 from CloudCompare
(Girardeau-Montaut, 2012) with the extents illustrated in Figure
5. This means the cropped section includes a wall thickness to
the adjoining lecture theatre in which scans 000 and 002 were
captured. The pointclouds have had no further cleaning and so
still contain the tripod setup positions of the total station.
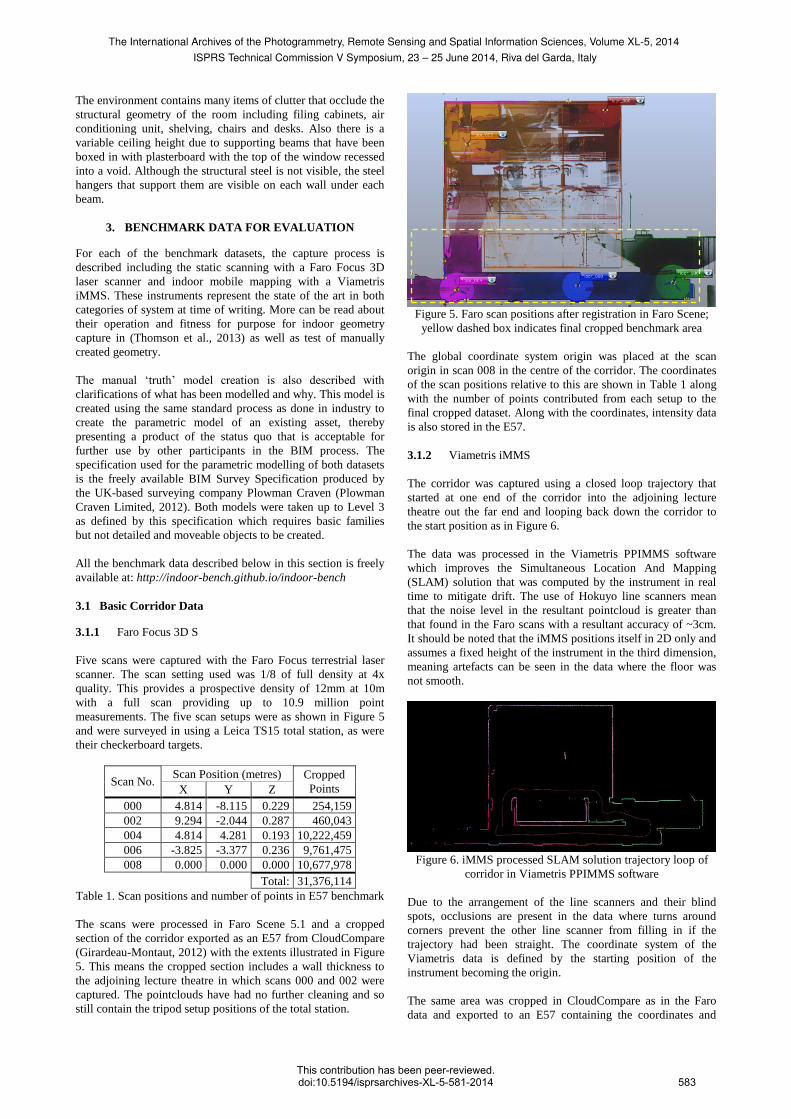
Figure 5. Faro scan positions after registration in Faro Scene;
yellow dashed box indicates final cropped benchmark area
The global coordinate system origin was placed at the scan
origin in scan 008 in the centre of the corridor. The coordinates
of the scan positions relative to this are shown in Table 1 along
with the number of points contributed from each setup to the
final cropped dataset. Along with the coordinates, intensity data
is also stored in the E57.
3.1.2 Viametris iMMS
The corridor was captured using a closed loop trajectory that
started at one end of the corridor into the adjoining lecture
theatre out the far end and looping back down the corridor to
the start position as in Figure 6.
The data was processed in the Viametris PPIMMS software
which improves the Simultaneous Location And Mapping
(SLAM) solution that was computed by the instrument in real
time to mitigate drift. The use of Hokuyo line scanners mean
that the noise level in the resultant pointcloud is greater than
that found in the Faro scans with a resultant accuracy of ~3cm.
It should be noted that the iMMS positions itself in 2D only and
assumes a fixed height of the instrument in the third dimension,
meaning artefacts can be seen in the data where the floor was
not smooth.
Figure 6. iMMS processed SLAM solution trajectory loop of
corridor in Viametris PPIMMS software
Due to the arrangement of the line scanners and their blind
spots, occlusions are present in the data where turns around
corners prevent the other line scanner from filling in if the
trajectory had been straight. The coordinate system of the
Viametris data is defined by the starting position of the
instrument becoming the origin.
The same area was cropped in CloudCompare as in the Faro
data and exported to an E57 containing the coordinates and
The International Archives of the Photogrammetry, Remote Sensing and Spatial Information Sciences, Volume XL-5, 2014ISPRS Technical Commission V Symposium, 23 – 25 June 2014, Riva del Garda, Italy
This contribution has been peer-reviewed.doi:10.5194/isprsarchives-XL-5-581-2014 583

intensity data, leaving a mobile mapping dataset of 7.1 million
points.
3.1.3 Parametric Model
To provide a form of verification ground truth, a manual model
was created from the Faro scans following the workflow used
currently by the UK survey industry. This involved loading the
scans into Autodesk’s Revit 2014. This meant that Revit
performed a conversion into the Autodesk pointcloud format
(.rcs).
As the model is an abstraction of the pointcloud, then certain
assumptions are made by the user along the way to generate the
geometry. In this case elements from the object library that
comes with Revit 2014 were used, with the exception of the
windows above the doors to the left of Figure 7 which are from
the UK National BIM Library (NBS National BIM Library,
2014). All thicknesses are arbitrary, except for the separating
wall between the lecture theatre and corridor as it was scanned
from both sides.
Figure 7. Hybrid showing pointcloud (coloured by normals) and
resultant parametric model in a Revit 2014 3D view
3.2 Cluttered Office Data
3.2.1 Faro Focus 3D S
Severn scans were captured with the Faro Focus terrestrial laser
scanner of office GM14. The scan setting used was 1/5 of full
density at 4x quality. This provides a prospective density of
8mm at 10m with a full scan providing up to 26.5 million point
measurements. The seven scan setups were as shown in Figure 8
and, as with the corridor data, were surveyed in using a Leica
TS15 total station, as were their checkerboard targets.
Scan No. Scan Position (metres) Cropped
Points X Y Z
GM13_001 11.124 -16.552 4.413 2,164,250
GM13_002 12.788 -15.634 4.412 3,047,686
GM14_002 13.181 -19.433 4.402 24,885,862
GM14_003 14.812 -17.870 4.401 25,314,529
GM15_001 16.884 -20.470 4.415 2,301,605
GM15_002 14.987 -21.794 4.414 1,670,996
GMC_006 19.693 -17.779 4.501 1,922,178
Total: 61,307,106
Table 2. Scan positions and number of points in E57 benchmark
Figure 8. Faro scan positions after registration in Faro Scene;
yellow dashed box indicates final cropped benchmark area
The scans were processed in Faro Scene 5.1 and a cropped
section of the corridor exported as an E57 from CloudCompare
with the extents illustrated in Figure 8. This means the cropped
section includes wall thicknesses to the adjoining offices
(GM13 & GM15) as well as to a corridor (GMC). As with the
Simple Corridor data, the pointclouds have had no further
cleaning and still contains a tripod setup position as well as
artefacts e.g. from the light reflectors.
The scans derive from a much larger surveyed dataset collected
for the GreenBIM project (Backes et al., 2014) and therefore
have a coordinate system whose origin is derived from the
centre of the Chadwick Building at ground level. This means
that the origin does not reside within the scope of any of the
scans in this dataset. The coordinates of the scan positions are
shown in Table 2 along with the number of points contributed
from each setup to the final cropped dataset. Along with the
coordinates, intensity data is also stored in the E57.
3.2.2 Viametris iMMS
The office was captured in a similar way to the corridor with a
trajectory that starts outside the office, enters it and then returns
to the starting position. However as the office has only one
point of access, the loop is restricted to a fairly straight path
with constrained turns. An advantage of this type of trajectory is
that occlusions caused by the blind spots of the scanners are
minimised as most areas get captured by a scanner in each
orientation.
As with the corridor data this Viametris pointcloud of the office
has its origin at the start position of the instrument.
The same area was cropped in CloudCompare as in the Faro
data and exported to an E57 file containing the coordinates and
intensity data, leaving a mobile mapping dataset of 3.0 million
points.
The International Archives of the Photogrammetry, Remote Sensing and Spatial Information Sciences, Volume XL-5, 2014ISPRS Technical Commission V Symposium, 23 – 25 June 2014, Riva del Garda, Italy
This contribution has been peer-reviewed.doi:10.5194/isprsarchives-XL-5-581-2014 584

Figure 9. iMMS processed SLAM solution trajectory loop of
office in Viametris PPIMMS software
3.2.3 Parametric Model
The model was manually built to the same specification as that
of the corridor but to a slightly higher level of detail. All of the
structure, door and window of the office model are built with
stock Revit elements. Prominent fixed features were included
from outside the stock Revit 2014 object library with the air
conditioning and strip lights coming from Autodesk Seek
respectively (Autodesk/Mitsubishi Electric, 2013) and
(Autodesk/Cooper Lighting, 2013).
Figure 10. Hybrid showing pointcloud (coloured by normals)
and resultant parametric model in a Revit 2014 3D view
4. INITIAL RECONSTRUCTION RESULTS
In this section, an initial test of the benchmark datasets is
presented to provide a guide of how the authors consider the
reconstructed geometry can be assessed against them. This test
made use of the prominent commercial tool for semi-automating
simple geometry reconstruction for BIM: Scan to BIM
(IMAGINiT Technologies, 2014). It should be noted the name
of the software is a misnomer as what it provides is the
parametric geometry necessary for the BIM process rather than
BIM itself.
Scan to BIM operates as a Revit plugin that embeds itself into
the Revit toolbar and for wall geometry reconstruction uses a
semi-automated region growing approach. This works with the
user picking three points to define the plane of the wall which is
then expanded to the extents of the pointcloud within a user-
defined tolerance. The user then has the option to create a wall
of a type from the project library which follows the orthogonal
constraints of the Revit environment or a mass wall which can
deform. For this test the former wall type was chosen. This is
illustrated below in Figure 11 with the tolerances used for both
datasets of 2.5cm planar tolerance and 3cm closeness tolerance.
Figure 11. Scan to BIM Wall Creation Settings
4.1 Basic Corridor
To assess the performance of the semi-automatically fitted walls
created by Scan to BIM, a series of common measurements
were taken and compared back to the manually-made reference
to see the success or detriment of this implementation.
Figure 12. Plan view of reference data and placement of
common measurements taken for all datasets
Measurements
(mm)
Relative difference from
reference data (mm)
Corridor
Geometry Reference StB Faro
StB
Viametris
A-B 1096 -36 -6
A-H 11066 +37 +70
A-I 11169 +37 +59
C-E 2453 -5 -1
D-E 1677 -102 +5
F-G 1426 +4 +22
H-I 1424 +5 -4
I-J 2031 -5 -57
J-K 1091 -8 -84
From Reference:
Mean deviation - -8 0
St. Deviation - 42 49
Table 3. Comparison measurements between the corridor
reference geometry and that created from Scan to BIM (StB)
The International Archives of the Photogrammetry, Remote Sensing and Spatial Information Sciences, Volume XL-5, 2014ISPRS Technical Commission V Symposium, 23 – 25 June 2014, Riva del Garda, Italy
This contribution has been peer-reviewed.doi:10.5194/isprsarchives-XL-5-581-2014 585

Measurements G-F, E-D, H-I and J-K are created perpendicular
to the wall line of F-I.
As shown in Table 3 there is fairly good agreement of a few mm
between wall-to-wall measurements of the reference model and
Faro-derived walls. Overall the short measurements in Figure
12 are within 4cm of the reference. The outliers are D-E and I-J,
J-K. The 10cm deviation between D-E is likely due to the wall
mounted poster board on the wall defined at D skewing the fit.
The wall at D has been well captured by the Faro scan at that
end of the corridor as opposed to in the Viametris data where it
seems to have had less of an influence over the fit. Removing
this outlier brings the mean to around 3mm deviation. The
deviations of I-J and J-K in the Viametris derived geometry are
due to poor coverage in the pointcloud caused by the scanners’
blind spot positions when the instrument turned.
4.2 Cluttered Office
The same process was carried out with the office data,
producing common measurements across the model to see the
performance of the Scan to BIM software. The measurements in
Figure 13 are to the corners of the room but are illustrated with
leader tails on the dimension lines for clarity.
Figure 13. Plan view of reference data and placement of
common measurements taken for all datasets
Measurements
(mm)
Relative difference from
reference data (mm)
Office Geometry Reference StB Faro StB
Viametris
A-B 2987 -8 -49
B-C 4999 -3 -43
C-D 2975 -4 -11
D-A 5014 -12 -20
A-C 5836 -9 -29
From Reference:
Mean deviation - -7 -30
St. Deviation - 4 16
Table 4. Comparison measurements between the office
reference geometry and that from Scan to BIM (StB)
The datasets for the office, although cluttered, provide results
shown in Table 4 more in line with expectations than the
previous corridor data. The fitted wall geometry from the Faro
data is in the order of a few mm, with that from the Viametris
around 3cm. These results tally with the behaviour expected
based on the performance and related modelling ambiguity from
these instruments.
In both cases the semi-automated geometry from Scan to BIM is
within the medium tolerance specified by UK survey companies
with the Faro derived walls fulfilling the high tolerance of
15mm (Plowman Craven Limited, 2012).
5. DISCUSSION
The tests in the previous section with Scan to BIM demonstrate
what is possible currently with commercial software for
automating parametric geometry creation. Between both scenes
there is a difference in the reconstructed geometry’s quality,
with the cluttered office more successful overall than the
corridor.
Clutter has an effect in the office data set but not as much as
expected. This could be due to the enclosed nature of the space
and scan settings, meaning a dense point spacing was achieved
on the parts of the walls that were captured. In terms of
performance the deviations were within a few cm at most and in
most cases were within industry specifications for model
tolerance.
Based on the accuracy of the manually created Revit models
from the same instruments in (Thomson et al., 2013) the simple
walls reconstructed here compare favourably, especially when
the reduction of user input is factored in.
Overall this is promising but is only the reconstruction of the
simplest elements: the walls. There exist many other features in
the two scenes (floor, ceiling, air conditioning unit, beams, etc.)
that could potentially be modelled with reduced user
interaction.
6. CONCLUSIONS
The literature indicates that automation to some degree may aid
this reconstruction and quite a few techniques have been
presented. As shown by this initial paper, one commercial
application of semi-automation is effective with simple wall
geometry. There exist questions around implementation and
validation of the geometry created. With 25 years of research
having not achieved full automation of geometry extraction then
semi-automated approaches as used by current commercial
software tools in this space appears to be the favoured
approach.
Current laser scanning technology easily allows a 'capture all'
mentality. Thanks to improvements in capture rate, and with
indoor mobile mapping, this trend will continue into the
foreseeable future. This creates a new paradigm on the geometry
reconstruction side of modelling where fast generation of
models is crucial to keep the workflow optimal, especially in a
BIM context. Therefore the pointcloud remains as a complex
representation with good visuals and high level of geometric
detail but non-existent level of information overall as it is just
'dumb' points requiring interpretation.
This is not good for BIM which requires a high level of
geometric intelligence in the form of parametrics and semantics.
As shown here there has been some progress in commercial
software with a semi-automated process and tied with the
increasing approaches to the problem of indoor reconstruction
in literature shows the significance of the topic. That said, few
The International Archives of the Photogrammetry, Remote Sensing and Spatial Information Sciences, Volume XL-5, 2014ISPRS Technical Commission V Symposium, 23 – 25 June 2014, Riva del Garda, Italy
This contribution has been peer-reviewed.doi:10.5194/isprsarchives-XL-5-581-2014 586
approaches show the creation of the parametric geometry
needed for BIM which involves larger questions about levels of
detail of representation, accuracy and semantic completeness.
Certainly in the UK, BIM is of increasing importance. With the
majority of buildings that exist now still forecast to exist in
2050 (UK Green Building Council, 2013) then models of
existing assets and more optimal ways of producing them will
only become more necessary.
Lastly the authors invite the research community to participate
by taking the benchmark datasets and using them to help gauge
the improvements and success of different techniques that could
lead to better, more efficient 3D geometry extraction for the
indoor environment.
6.1 Future Work
Although it is felt these datasets provide adequate initial scenes
for testing, the lack of well-known initial dimensions in the real
world means the comparison to a ‘truth’ is from one abstracted
set of measurements to another. The only way to have a definite
truth at the beginning of the process is with synthetic data
generated from a known 3D model. Therefore it is envisaged
that this would be the next dataset that would be added to the
benchmark alongside the real world data presented in this paper.
There is also the potential to expand the dataset with other
representative scenes that are prevalent in buildings that require
a model of existing conditions for BIM, e.g. plant rooms, large
open-plan spaces, etc.
7. REFERENCES
Adan, A., Huber, D., 2011. 3D Reconstruction of Interior Wall Surfaces
under Occlusion and Clutter, in: 2011 International Conference on 3D
Imaging, Modeling, Processing, Visualization and Transmission. IEEE,
pp. 275–281. doi:10.1109/3DIMPVT.2011.42
Autodesk/Cooper Lighting, 2013. Autodesk Seek: Cooper Lighting:
MetaluxTM 2PGAX Series Luminaire, 4“ Precision Cell Louver Into A
6-3/4” Deep Para-Contoured Fixture Housing. URL:
http://seek.autodesk.com/product/latest/agg/cooperlighting/Cooper-
Lighting/CooperLightingPara2PGAX (accessed 08.05.14).
Autodesk/Mitsubishi Electric, 2013. Autodesk Seek: Mitsubishi
Electric: Wall Mounted, MSY Series Air Conditioner. URL:
http://seek.autodesk.com/product/latest/agg/mitsubishielectric/Mitsubis
hi-Electric/MitsubishiElectric019 (accessed 08.05.14).
Backes, D., Thomson, C., Malki-Ephshtein, L., Boehm, J., 2014.
Chadwick GreenBIM: Advancing Operational Understanding of
Historical Buildings with BIM to Support Sustainable Use, in: BSO
2014 Proceedings. IBPSA-England, London, UK, p. (In Press).
Barnea, S., Filin, S., 2013. Segmentation of terrestrial laser scanning
data using geometry and image information. ISPRS J. Photogramm.
Remote Sens. 76, 33–48. doi:10.1016/j.isprsjprs.2012.05.001
Budroni, A., Boehm, J., 2010. Automated 3D Reconstruction of
Interiors from Point Clouds. Int. J. Archit. Comput. 8, 55–73.
doi:10.1260/1478-0771.8.1.55
Girardeau-Montaut, D., 2012. CloudCompare-Open Source project.
OpenSource Proj. URL: http://www.danielgm.net/cc/ (accessed
30.06.13).
Hichri, N., Stefani, C., Luca, L. De, Veron, P., 2013. REVIEW OF
THE « AS-BUILT BIM » APPROACHES, in: Boehm, J., Remondino,
F., Kersten, T., Fuse, T., Gonzalez-Aguilera, D. (Eds.), 3D-ARCH 2013
- 3D Virtual Reconstruction and Visualization of Complex
Architectures. International Society for Photogrammetry and Remote
Sensing, Trento, Italy, pp. 107–112.
IMAGINiT Technologies, 2014. Scan to BIM. URL:
http://www.imaginit.com/software-solutions/imaginit-products/scan-to-
bim (accessed 11.05.14).
Kawashima, K., Kanai, S., Date, H., 2011. AUTOMATIC
RECOGNITION OF PIPING SYSTEM FROM LARGE-SCALE
TERRESTRIAL LASER SCAN DATA. ISPRS - Int. Arch.
Photogramm. Remote Sens. Spat. Inf. Sci. XXXVIII-5/, 283–288.
doi:10.5194/isprsarchives-XXXVIII-5-W12-283-2011
Nagel, C., Stadler, A., Kolbe, T.H., 2009. Conceptual requirements for
the automatic reconstruction of building information models from
uninterpreted 3d models, in: Kolbe, T.H., Zhang, H., Zlatanova, S.
(Eds.), GeoWeb 2009 Academic Track - Cityscapes. Vancouver,
Canada, pp. 46–53. doi:10.1.1.150.9821
NBS National BIM Library, 2014. Window for flexible opening sizes.
URL: http://www.nationalbimlibrary.com/generic/window-for-flexible-
opening-sizes (accessed 08.05.14).
Oesau, S., Lafarge, F., Alliez, P., 2014. Indoor scene reconstruction
using feature sensitive primitive extraction and graph-cut. ISPRS J.
Photogramm. Remote Sens. 90, 68–82.
doi:10.1016/j.isprsjprs.2014.02.004
Plowman Craven Limited, 2012. PCL BIM Survey Specification v2.0.3.
Harpenden, UK.
Pu, S., Vosselman, G., 2009. Knowledge based reconstruction of
building models from terrestrial laser scanning data. ISPRS J.
Photogramm. Remote Sens. 64, 575–584.
doi:10.1016/j.isprsjprs.2009.04.001
Rajala, M., Penttilä, H., 2006. Testing 3D Building Modelling
Framework in Building Renovation, in: Bourdakis, V., Charitos, D.
(Eds.), Communicating Space(s), Proceedings of the 24th Education
and Research in Computer Aided Architectural Design in Europe
Conference. Volos, Greece, pp. 268–275.
Schmittwilken, J., Plümer, L., 2010. Model-based reconstruction and
classification of facade parts in 3D point clouds. Int. Arch.
Photogramm. Remote Sens. Spat. Inf. Sci. 38, 269–274.
Tang, P., Huber, D., Akinci, B., Lipman, R., Lytle, A., 2010. Automatic
reconstruction of as-built building information models from laser-
scanned point clouds: A review of related techniques. Autom. Constr.
19, 829–843. doi:10.1016/j.autcon.2010.06.007
Tao, C.V., 2005. 3D Data Acquision and Object Reconstruction for
AEC/CAD, in: Zlatanova, S., Prosperi, D. (Eds.), Large-Scale 3D Data
Integration: Challenges and Opportunities. CRC Press, Boca Raton,
Florida, pp. 39–56. doi:10.1201/9781420036282
Thomson, C., Apostolopoulos, G., Backes, D., Boehm, J., 2013. Mobile
Laser Scanning for Indoor Modelling. ISPRS Ann. Photogramm.
Remote Sens. Spat. Inf. Sci. II-5/W2, 289–293.
doi:10.5194/isprsannals-II-5-W2-289-2013
UK Green Building Council, 2013. Retrofit. URL:
http://www.ukgbc.org/content/retrofit (accessed 20.04.13).
The International Archives of the Photogrammetry, Remote Sensing and Spatial Information Sciences, Volume XL-5, 2014ISPRS Technical Commission V Symposium, 23 – 25 June 2014, Riva del Garda, Italy
This contribution has been peer-reviewed.doi:10.5194/isprsarchives-XL-5-581-2014 587


![[Jeffrey M. Lee] Manifolds and Differential Geomet(BookZZ.org)](https://img.dokumen.tips/doc/110x75/577cc77c1a28aba711a116c1/jeffrey-m-lee-manifolds-and-differential-geometbookzzorg.jpg)