Embed Size (px)
Citation preview
Waste Management & Research
Copyright © ISWA 2002Waste Management & Research
ISSN 0734–242X
514
Waste Manage Res 2002: 20: 514–528Printed in UK – all rights reserved
Introduction
Landfill simulationIn the recent past, the use of simulation programs as toolsfor the design and monitoring of different environmentalinstallations (sewerage networks, water treatment plants,etc.) has become widespread. However, a series of pro-grams has not yet been accepted as a general reference forthe simulation of landfills and their effects on the envi-ronment, as has happened in other fields (such as SWMM(Huber et al. 1988) or MOUSE (Danish HydraulicInstitute 1998) for sewerage networks, for example). A
model, validated with real data from various facilities,which considers the several aspects that must be takeninto account for the design and control of the environ-ment protection systems in landfills does not exist.
One of the most important environmental effects of amunicipal solid waste landfill is the pollution of under-ground water due to the migration of contaminatedleachate. For this reason, great efforts have been made inmodelling to predict the amount of leachate and its move-ment within the waste and through drainage elements andliners. Widely accepted hydrologic models such as HELP(Schroeder et al. 1994) are used for this. However, this has
Modelling for environmental assessment of municipalsolid waste landfills (Part II: Biodegradation)
Amaya Lobo García de CortázarJavier Herrero LantarónOscar Montero FernándezIñaki Tejero MonzónGrupo de Ingeniería Ambiental. Universidad de Cantabria(Spain).
Maria Fantelli LamiaEmpresa de Residuos de Cantabria (Spain).
Keywords: Landfill, biodegradation, organic pollution, leachate,mathematical modelling, dynamic simulation, municipal solidwaste, landfill history, wmr 438–7.
Corresponding author: Amaya Lobo García de Cortázar, Grupode Ingeniería Ambiental. Dpto. Ciencias y Técnicas del Agua yMedio Ambient, Universidad de Cantabria, EU IngenieríaTécnicas de Minas, 39316 Tanos, 254 Bulevar Ronda Rufino Peón,Torrelavega (Cantabria), Spain.
Received 2 August 2000, accepted in revised form 11 September2002.
The biodegradation module of a simulation program formunicipal solid waste landfills (MODUELO) was devel-oped. The biodegradation module carries out the balanceof organic material starting with the results of the hydro-logic simulation and the waste composition. It simulatesthe biologic reactions of hydrolysis of solids and the gasifi-cation of the dissolved biodegradable material. The resultsof this module are: organic matter (COD, BOD and ele-mental components such as carbon, hydrogen, nitrogen,oxygen, sulfur and ash), ammonium nitrogen generatedwith the gas and transported by the leachates and thepotential rates of methane and carbon dioxide generation.The model was calibrated by using the general tendencycurves of the pollutants recorded in municipal solid wastelandfills, fitting the first part of them to available landfilldata. Although the results show some agreement, furtherwork is being done to make MODUELO a useful tool forreal landfill simulation.

not been the case of the models representing the wastedegradation processes and their results (i.e. gas generation,water pollution, etc). In the last thirteen years, manymathematical models have been used in landfills with sev-eral objectives, mainly to quantify the potential pollutantemissions and to evaluate the options of landfill gas har-nessing. Few reports describe models for the assessment ofthe effects on the environment of different design or oper-ation strategies. Although some previous attempts havebeen reported (Vincent et al. (1991), PITTLEACH-2 (Al-Yousfi 1992, Pohland et al. 1994, Al-Yousfi et al. 1998),HEAT-GAS (El-Fadel et al. 1996a, 1996b, 1996c & 1997),…), only recently has work been started on the develop-ment of these kinds of models (Butler et al. 1999, Hanel etal. 2001, Haarstrick et al. 2001a & 2001b, Lee et al. 2001,McDougall et al. 2001, Shelley et al. 2001, White et al.2001, Zacharof et al. 1999 & 2001). As the definition ofthe processes and the detail required for the simulationbecome greater, a more accurate approach to hydrology isrequired to simulate the biochemical degradation of waste.It is necessary to consider the three spatial dimensions ofthe landfill, gas generation and transport and water move-ment and pollution are interrelated, heat generation andtransport have to be coupled and settlement must also bemodelled.
Many of the simplest models, whatever their final objec-tives are, gave acceptable fits to specific field data for thefacilities from which the expressions were developed, butnone has been adopted and generally used in the same wayHELP has. There are two main reasons for this situation:on the one hand, the great complexity of the processesthat take place in the heterogeneous mass of wastes madeit impossible to handle all the variables required and, onthe other, there is a scarcity of available historical data toassist with the calibration, validation and development ofthe models being proposed.
Landfill biodegradation modellingTwo kinds of formulations can be distinguished amongthose that try to represent the degradation of waste in thelandfill: “global” and “biokinetic” ones. The “global” for-mulations group all the processes in simple expressions,generally of the exponential type, that quantify theamount of gas generated as a function of time and includea few empirical calibration parameters (Palos Verdes,Sheldon Arleta, etc, many of them described in detail byEl-Fadel et al. 1997). As opposed to the former, the “bio-
kinetic” models study the landfill as a bioreactor andestablish more complicated formulations, based on anaer-obic digestion modelling, where not only the final productstake part but also the substrates and the biomass(Halvadakis 1983, Haarstrick et al. 2001a & 2001b, Lee etal. 1983, McDougall et al. 2001, Shelley et al. 2001, Straubet al. 1982a & 1982b, Swarbrick et al. 1995 & 2001, Young1989 & 1995). By simulating the proper degradationprocess, even in a simplified way, its applicability can beexpected to be transferable to any landfills.
Among the simplest “global” expressions and the multi-stage “biokinetic” ones, other models arise that considerseveral consecutive steps. but which try to avoid the inten-sive use of empirical parameters by developing simplifiedformulae. The calibration of these latter models can bebased only on the fit of the observed gas productioncurves, as Zacharof et al. (2001) or also depend on bioki-netic fundamentals (Manna et al. 1999), as is the case ofMODUELO, the model described here.
The biodegradation model that is presented in thispaper has also been developed based on kinetic theories, inan attempt to simplify the formulation. Its objective is tosimulate accurately enough the processes in large volumesof waste such as those found in landfills. The required cal-culating effort and the precision obtainable in the light ofthe usually poor data available have to be balanced.
The MODUELO general algorithmMODUELO is a dynamic simulation program for landfillsthat is being developed as a general tool for municipal solidwaste, landfill design, operation and monitoring. This pro-gram, whose first part was presented in a previous paper(Lobo et al. 2002) estimates leachate flow, its organic pol-lution and the gas produced over time. Lobo et al.(2002)developed the mathematical scheme and the modelsadopted in two of the program’s three main modules: the“present landfill layout” and the “hydrologic module”. Thelandfill in MODUELO is modelled as a three-dimensionalgrid constituted by parallelepipedic cells that form layerswhose vertical dimension can vary along its height. Sixtypes of cells can be defined in the landfill: the “land”(natural terrain) and “empty” cells that do not interactwith the others; the “landfill cell”, that is meant to be thetypical operating cell of any landfill, including anydrainage system and the daily cover; the “cover cell”, alandfill cell with the characteristics of the final closure;
Modeling for environmental assessment of municipal solid waste landfills (part II: Biodegradation)
515Waste Management & Research

and the “soil” and “drain” cells, that represent fillings ofwaste with different permeabilities.
The “present landfill layout” module reproduces the fillorder and the characterisation of the grid representing thelandfill, as well as its layout and the active cells for eachtime step (each hour). Later, with climatic data and basedon Darcy’s law, the “hydrologic module” calculates thewater flow between cells, giving the leachate flow in thedrainage collection system and the moisture in each cellover time. The data resulting from both modules consti-tute part of the input for the degradation calculations thatthe “biodegradation module” carries out, which is treatedin this paper.
Biodegradation Module
General layoutThe hydraulic, physio-chemical and biological processeswhich take place in a medium as complex as a landfill, giverise to a great variety of organic and inorganic substancesthat are transported by the infiltrated liquid or emitted asgas.
The MODUELO degradation module estimates theorganic pollution present in the leachate and the volumeof gas generated by the biologic decomposition of thewaste, distinguishing between the volumes of CH4
(methane) and CO2 (carbon dioxide). The leachate pollu-tion is expressed as the weight of carbon (C), hydrogen(H), nitrogen (N), oxygen (O) and sulfur (S) in bothbiodegradable and non-biodegradable forms, ammonia(NH3) originating in the gas generation process and theparameters of BOD (biochemical oxygen demand) andCOD (chemical oxygen demand). This first version doesnot include other pollutants such as heavy metals, salts,etc.
The processes that induce organic waste degradationover time in landfills are usually simplified into five mainstages: one aerobic and four anaerobic (hydrolysis, acido-genesis, acetogenesis and methanogenesis). This modeldoes not take into account the effect of the aerobic stage,which is usually so short that oxygen is rapidly consumedif artificial ventilation systems do not exist. The anaerobicphenomena are simplified in two main steps: the dissolv-ing of hydrolysable particulated organic material and thesubsequent biological anaerobic degradation of the “gasifi-able” (Ehrig et al. 2001), i.e. “convertible to gas” fraction
of this dissolved material.The simplified model considers the observed phenome-
na that two main steps can limit the rate of the breakdown of organic matter in landfills. These steps being thehydrolysis of the solids and the formation of methane fromacetic acid and carbon dioxide. The authors believe thatsimulating the global process by means of two stages canaccurately reproduce the rates of pollutant release into thewater and gas generation processes. Avoiding the rest ofthe biochemical steps leads to significant calculation sim-plification and time savings, which is very important in aprogram like MODUELO, which must repeat the degra-dation calculations for each landfill cell and for each timestep. A summary of the degradation algorithm is present-ed in the following paragraphs, as well as a description ofthe model chosen for the waste, which conditions the datarequired, the mathematical expressions of the breakdownprocesses and the calculation of the resulting parameters.The two stages of the degradation model presented belowconsider each landfill cell as a closed bioreactor and areapplied to each one for each time step. Their interactionsare controlled by the pollutant transport.
Required dataTo define the materials constituting each waste cell, thepresent quantities and future development rates for thedifferent types of waste have to be introduced in the “pro-duction module” (Lobo et al. 2002). It is possible to inputwaste characteristics on two levels of classification,according to how detailed the available data are. Forexample, the cardboard present in the waste may beexpressed as a general quantity or be divided into amountsof cardboard, carton and dirty cardboard. The primaryclassification establishes nine groups of organic waste(paper, cardboard, food waste, yard waste, wood, cellulose,textiles, rubber and leather, and plastics) and four groupsof inorganic wastes (glass, metals, ceramics and other noncombustible wastes).
In order to represent their biodegradability, the organicwaste materials have been divided in three classes consid-ering their hydrolysis rates: readily, slowly and nonhydrolysable or inert. For each primary waste component,it is necessary to define its proportion with respect to thetotal annual volume of waste; its “chemical formula” (con-tent in C, H, N, O, S and ashes); the nature of its “degrad-ability” (whether it is slowly or readily hydrolysable orwhether it is non hydrolysable); the percentage of its mass
516 Waste Management & Research
Amaya Lobo García de Cortázar, Javier Herrero Lantarón, Oscar Montero Fernández, Iñaki Tejero Monzón, Maria Fantelli Lamia
that is hydrolysable (hydro) and the fraction of thehydrolysable part that is “biodegradable” (fbio). Here“biodegradable” does not strictly mean “substances thatcan be converted by microorganisms” (in which case allthe matter would be “biodegradable”), but those that are“gasifiable”, that have the potential to be degraded tomethane and carbon dioxide.
In order to facilitate the wastes’ characterisation datainput the program will assign fixed chemical formulae(Tchobanoglous et al. 1996) and degradable fractions toeach of the primary classification groups. The user wouldnot need to specify the flux of each kind of organic mate-rial (“readily hydrolysable biodegradable”, “readilyhydrolysable non biodegradable”, “slowly hydrolysablebiodegradable”, etc) but the amount of each component(paper, food wastes, etc) arriving in the landfill. Of courseit is desirable to have a complete characterisation of thespecific waste degradability but this assumption would be avaluable help if data are not available. It is not to be for-gotten that specific data available in this type of facility arealways limited.
HydrolysisAll of the phenomena that give way to dissolving the par-ticulate material that initially makes up the solid waste fallunder the name of “hydrolysis”. These phenomena, whichare primarily attributed to the enzymatic activity of fer-mentative microorganisms, are assumed to follow first-order kinetics. A first-order model is applied to each classof degradable matter in a cell. The mass of solid materialof type “j” (SMij; “i” = “readily”, “slowly hydrolisable”; “j”= “biodegradable”, “non biodegradable”) that is brokendown to dissolved matter of type “j” (DMj) during a timestep (Dt) in the cell number “k” will depend on the totalamount of solid matter of type “j” remaining in it (1).
�DMjHYD(k;t)=�i�SMij(k;t)= �i khi’. SMij(k;t). �t (1)SMij(k;t+�t) = SMij(k;t) – �SMij(k;t) (2)
khj’ is the effective hydrolysis rate corresponding to thehydrolysis characteristics “j”.
The dissolution rate of a component will vary depend-ing on the conditions of the interaction between enzymesand waste. Some models include factors reducing a maxi-mum hydrolysis rate taking into account its inhibition bythe presence of hydrolysis products (Lee et al. 1993; Straubet al. 1982b; McDougall et al. 2001; the accessibility to thewaste structure and its crystallinity (Lee et al. 1993;McDougall et al. 2001), its moisture content (McDougallet al. 2001; Williams et al. 1987), ... Here khj’ =khj.FM.FT, where khj = maximum hydrolysis constantrate, “khrea” for readily hydrolysable matter and “khslo”for slowly hydrolysable matter; FM = influence factor ofthe moisture that determines the solid/liquid interface(table 1) and FT = temperature influence factor onhydrolysis.
The hydrolysis rates are very sensitive parameters inmost landfill gas generation models, usually used as cali-bration constants (El Fadel et al. 1997). They depend onwaste characteristics but can also be influenced by site-specific conditions not taken into account in the model.Maximum reference values can be taken from thoseobtained under controlled conditions (Pfeffer (1974)reports values from 0.007 to 0.99 d–1 in bioreactors andWilliams et al. (1987), from lysimeter experiments, aninterval from 0.0008 to 0.1 d–1) or from the more easilysoluble components of the mixture, as cellulose. On allaccounts reported values vary depending on the globaldegradation model and the landfill considered, fromhydrolysis constants in the order of 10–6 d–1 (El-Fadel1996) to the range of 10–1 d–1 (Haarstrick et al. 2001a).
Another parameter, the “activation time” (tact) has beenincluded to describe the lag in the degradation processes inthe landfill, where the waste forms isolated clusters,enclosed in bags, etc, with respect to an ideal situationwhere the solid is completely surrounded by water, whichpermits an immediate enzymatic attack. This initial lag isincremented by an acclimatisation period, a time whichthe respective microorganisms need to “get used to” thenew substrate, that will vary depending on the degradabil-ity of the waste. The sum of these two periods for the read-ily and slowly hydrolysable substances, respectively, resultsin each activation time parameter (“tact,rea” and “tact,slo”).
Finally, part of the hydrolysable fraction (“fhydro”) ofeach material could remain undissolved in the landfill forreasons such as being enclosed in isolated-from-water
Modeling for environmental assessment of municipal solid waste landfills (part II: Biodegradation)
517Waste Management & Research
Table 1: Values of the moisture influence factor for hydrolysis (FM).(Arias et al. 1995, Fantelli 1990).
Moisture(% in dry weight) FM Coefficient
0 < M < = 15 015 < M < = 35 (M -15)/8035 < M < = 65 0.25 + (M - 35)/6065 < M < = 90 0.75 + (M - 65)/100
90 < M 1

areas. This effect is described by a new parameter, “fah”,“actually hydrolysed fraction” that, applied to the ideallyhydrolysable mass of each material, expresses the part thatis really hydrolysed in the specific conditions of the land-fill. “fah” can be viewed as a parameter taking into accountthe “accessibility” of the matter to the microorganisms. Ithas to be considered as a site specific calibration parame-ter that can vary from 0 (microorganisms cannot accessany fraction of the waste and the landfill remains “mum-mified”) to 1 (the ideal situation in which all the degrad-able matter can be broken down).
For simplifying the calculations, it has been acceptedthat the dissolution affects each considered element ofmatter j (C, H, O, N, S and ashes) proportionally. Itschemical formula (i.e. the fraction of the total mass thateach element represents) remains constant. That meansthat there is no need to assume any compound as repre-sentative of the substances that stay dissolved in theleachate before their breakdown to gas. The mass of dis-solved matter, biodegradable or non biodegradable, will bethe sum of the masses of the elements (C, H, O, N, S andashes) of each type (Fig. 1). So, each expression develop-ing the transformation (hydrolysis and gasification) andtransport of the waste (1, 2, 3, 4, 5 and 6) is applied toeach of the chosen elements.
Transport of pollutantsThe transport of the substances that have been dissolvedin a cell is assumed to occur by advection (diffusion anddispersion phenomena have been neglected). Therefore,pollutants move from cell to cell and to the leachate col-lection system carried by the water flow. Moreover, aninstantaneous mixing of the moisture that flows to a celland its previous water content is assumed.
So, if we consider a cell “k”, once the volumes of waterflowing from the six adjacent “i” cells are known, in timet, “Qik(t)”, the mass quantity of each dissolved pollutanttransported (twelve substances are considered (C, H, O,N, S and ash, each of them “biodegradable” and “nonbiodegradable”) will be “�DMTT(k;t)” (3).
�DMTT(k;t) = �i Qik(t) �t . DM(i;t) / h(i;t) (3)
Where �t is the time step; h(i;t) : moisture content ofcell i in the instant t, calculated as by Lobo et al. 2002. Thetotal change in the dissolved pollutant mass content in celli will result from the sum of this transport term,
�DMTT(k;t), and the transformation terms due to hydrol-ysis (�DMjHYD(k;t)) and gasification (�DMbGAS(k;t)).
BiodegradationThe breaking down of dissolved biodegradable matter(DMb) to gas (BM) is simulated according to first-orderkinetics (4) with rate, kbio, constant and equal for all of thebiodegradable elements.
�DbGAS (k;t) = –kbio. DMb (k;t). �t (4)
�BM (t) = �� �DMbGAS (k;t) (5)
DD_MbGAS(k;t) : increment of the biodegradable ele-ments’ mass content in cell k due to their conversion togas.
It is assumed that the degradation is carried out com-pletely, as if all the hydrolysed biodegradable matter(CCbHHbOObNNb) were converted to carbon dioxide,methane and ammonia, according to expression (6).
CCbHHbOObNNb + [(4Cb – Hb – 2Ob + 3Nb) / 4] H2O [(4Cb +
Hb – 2Ob – 3Nb) / 8] CH4 + [(4Cb–Hb–2Ob+3Nb) / 8] CO2 +
Nb NH3 (6)
As can be concluded from (6) the biodegradation kinet-ics (4 and 5) apply only to the biodegradable carbon,hydrogen, oxygen and nitrogen. The organic material thathas been hydrolysed but not degraded appears pollutingthe filtrated liquid.
Methane gas and carbon dioxide are gasified immedi-ately and “extracted” directly while the NH3 remains dis-solved in the leachate. Gas movement and interactionwith water flow is not simulated in this first version, nor isthe carbonic and ammonia equilibrium.
By using the simplifications presented, the overall quan-tities of gas and pollutants that will be emitted by the land-fill can be estimated with a less-than-daily temporalprecision (in longer periods) because phenomena, such asthose retarding the release of gas to the outside, are notincluded. Thus, for example, an acceptable approximationto the monthly quantity of gas emitted could be made(supposing that all the generated gas is eventuallyreleased), but not that which emanates from the landfillon a day-to-day basis.
Organic pollution parametersIn order to quantify the great variety of organic con-stituents that leachate can transport, chemical oxygen
Amaya Lobo García de Cortázar, Javier Herrero Lantarón, Oscar Montero Fernández, Iñaki Tejero Monzón, Maria Fantelli Lamia
518 Waste Management & Research

Modeling for environmental assessment of municipal solid waste landfills (part II: Biodegradation)
519Waste Management & Research
Fig. 1: Schematic of the components of matter considered and their interrelationships.

demand (COD) is one of the most important parameters,as it is, in general, for wastewaters. The COD quantifiesthe overall organic material (biodegradable and non-biodegradable) present in the liquid without the need toidentify each compound. Its use simplifies the quantifica-tion or comparison of the pollution in different leachates.
Furthermore, in municipal solid waste landfills, thecharacteristics of many of the organic substances pollutingthe leachate allow their elimination in wastewater treat-ment plants with biological processes. The estimation ofthe biochemical oxygen demand (BOD) allows the quan-tification of the biodegradability of these compounds.
The quantities of the non-biodegradable hydrolysedorganic material and the remaining biodegradable materi-al (not yet converted to gas) are the direct result of themodel. To express these organic pollution values, accord-ing to the most widely-used parameters, the program cal-culates the oxygen consumed in reactions (7), BOD, and(8), COD. Expressions (7) and (8) try to reproduce thestoichiometry of the reactions that take place during theBOD (the aerobic consumption of the biochemicallydegradable matter) and COD (chemical oxidation of theorganic matter by potassium dichromate) tests.
CCbHHbOObNNb + [(4Cb+Hb–2Ob-3Nb)/4] O2 Cb CO2 + [(Hb-
3Nb)/2] H2O + Nb NH3 (7)
C(Cn+Cb)H(Hn+Hb)O(On+Ob)N(Nn+Nb) + [(4(Cn+Cb)+(Hn+Hb)–2(On+Ob))/4]
O2 (Cn+Cb) CO2 + (Hn+Hb)/2 H2O + (Nn+Nb)/2 N2 (8)
Where Cb, Hb, Ob and Nb are the masses ofbiodegradable carbon, hydrogen, oxygen and nitrogen pre-sent in the leachate respectively, and Cn, Hn, On and Nnare the non biodegradable masses.
Preliminary calibration
Application to Meruelo I landfillA preliminary calibration of the degradation model wasmade from the Meruelo landfill (Spain) based on data forits first stage (Meruelo I) that was operative fromDecember 1988 to December 1990. During this period,the municipal solid waste generated in the central andeastern areas of the region of Cantabria were buried in thelowest part of a valley, from elevation 186.6 m to elevation221.6 m. The 202,100 tons of waste were accumulatedbehind small berms with a height of 2.5 meters, forming
layers with a thickness of 50 cm with low-permeabilitydaily cover 20 cm thick. The final slope was interrupted bythree berms of about 20 m wide to ensure stability, whichcaused a change of the “hydrologically active” areathroughout the landfill’s life, as is common for thesedepression-type landfills. The final area of the surfaceextended in plan to 39,600 m2, with a total volume of429,200 m3.
Discretisation of Meruelo I occupies a total of 876 cells(14x14m2), the landfill-type cells being 2.5 m high (1.9 mof waste and 0.6 m of intermediate cover). The landfill’sdevelopment was simulated from its origin in December1988 to December 1997. Its final covering was simulatedto take place on December 1990 (when the operation ofMeruelo II started). The model was executed severaltimes, varying the percentage of overall “accessed” mater-ial (fah), the rapid and slow hydrolysis constants (khrea andkhslo) and the biodegradation constant (kbio), maintainingthe rest of the parameters (activation time for each kind ofsubstance and the different characteristics of degradabilityof each waste) with the values shown in table 3. Table 2shows the composition of the waste stream. In all casesfood, paper and cardboard were considered readilyhydrolysable, while rubber, leather, textiles and wood wereconsidered slowly hydrolysable. The remaining waste com-ponents were considered inert.
Available dataMeruelo I had been the subject of several studies for thecharacterisation of the waste (Arias et al. 1995, Szantó etal. 1992), of the leachate (Fantelli 1990, Tejero et al. 1993)and its geotechnical behaviour (Sánchez Alciturri et al.1993a & 1993b). With respect to the landfill emissionscharacterisation, it was extracted from available reportswhich included a large amount of valuable data. This,along with their knowledge of the landfill, was the reasonwhy the authors chose Meruelo I for initial testing ofMODUELO. With respect to the generated pollutants,measurements were made from March 1990 to October1990 for the leachate characterisation. Samples weretaken every three days and the following parameters wereevaluated: instantaneous water flow, pH, conductivity,suspended solids, volatile suspended solids, COD, alkalin-ity, chloride, sulfate, ammonium, nitrite, nitrate andorthophosphate content. The problem this landfill createsis that no further data on the releasing of pollutants from
Amaya Lobo García de Cortázar, Javier Herrero Lantarón, Oscar Montero Fernández, Iñaki Tejero Monzón, Maria Fantelli Lamia
520 Waste Management & Research

the analysed area could be obtained, as the leachate col-lection system for stage 1 was connected to that of stage 2.As a result this study can only be presented as “prelimi-nary” and not as a “complete” calibration, as it is based onlimited data.
In a previous paper (Lobo et al. 2002) the calibration ofthe hydrologic module and its results reproducing theleachate volume data points from the measurements werepresented. During this period 29,200 m3 of rainfall on thelandfill surface produced 8,371 m3 of leachate, having setthe initial and minimum field capacity of the waste at 47%and 30% and the saturation moisture of the waste at 70%.A detailed description of the parameter values resultingfrom the calibration is presented by Lobo et al. The cali-brated hydrologic section generates the moisture contentand water flow – time data for each cell which is essentialfor the simulation of the organic material’s breakdown.The degradation module parameters were then calibratedto fit the results of the measured data.
As the available data series were too short to obtain,reliable long-term parameters, this preliminary calibrationwas carried out taking into account not only the dataseries available for the first part of the simulated period,but also the general tendencies of the pollutant emissionsobserved in other landfills during their after-care period(Stegmann et al. 1989, Ehrig et al. 2001).
On the other hand the available data have beenprocessed in order to characterise the total measuring peri-od from the measured point values. For each pollutant itwas assumed that the average of the measured point con-centrations in the leachate made in the same month rep-resent the corresponding daily average of that substanceconcentration. Multiplying these daily concentration val-ues by the corresponding water flow, the average dailyloads for each month were obtained. During the calibra-tion this monthly data have also been fitted, to the CODand NH4–N series.
With respect to NH4–N, an estimation was needed, asorganic nitrogen was not measured and the output of themodel specifies only NH3–N coming from the gas genera-tion process and hydrolysed biodegradable N and nonbiodegradable N, without distinction between the organicand the ammonia forms. In order to compare the simulat-ed results with the measured values, it was assumed thatall the NH4–N content of the leachate comes from theNH3 generated together with the methane (6), being allthe hydrolysed matter’s nitrogen in the organic form. Itthus assumes that all the organic N resulting from thehydrolysis process is converted to ammonium in one step,together with the methanogenesis, instead of consideringthe amount released in each step of the anaerobic degra-dation.
Results
Calibration resultsTable 2 shows the degradation-model parameter values
resulting from the calibration described above. Fig. 2 pre-
Modeling for environmental assessment of municipal solid waste landfills (part II: Biodegradation)
521Waste Management & Research
Table 3: “Biodegradation” parameters’ values adopted for Meruelo I (“calibration”) and for the sensitivity analysis.
Parameter Description Calibration value Sensitivity valuesfah Fraction of the hydrolysable part of the waste that is actually accessible for
microorganisms in the landfill conditions 0.65 0.65, 0.8tact,rea Hydrolysis’ activation time period for the readily hydrolysable matter (year) 1 1
tact,slo Hydrolysis’ activation time period for the slowly hydrolysable matter (year) 0 0
khrea Maximun hydrolysis rate for the readily hydrolysable matter (d-1) 0.0004 0.0004, 0.0012
khslo Maximum hydrolysis rate for the slowly hydrolysable matter (d-1) 0.002 0.002, 0.0006
kbio Rate of conversion to gas of the biodegradable fraction of the hydrolysed waste (d-1) 0.005 0.005, 0.0015
Table 2: Composition of the waste in Meruelo I.
Main components Proportion of the total mass of waste (%)
READILY HYDROLYSABLE MATTERPaper 15.7Cardboard 6.2Food waste 52.1SLOWLY HYDROLYSABLE MATTERWood 2.4Textiles 3.7Rubber and leather 1.0INERT MATTERCellulous materials 2.0Plastics 8.3Glass 4.0Metals 3.2Other inorganic/ non combustible wastes 1.4

sents the relationship between the observed and the simu-lated daily average values corresponding to each month ofthe measuring campaign for the water flow, COD andNH4–N loads in the leachate collection system. A model’stendency to overestimate the pollutant fluxes in this casecan be observed. In fact the relative differences betweenthe simulated total mass of COD and NH4–N transportedby the leachate during the considered period and the val-ues estimated from the measures are around 30% (289,020kg versus 220,340 kg “measured”) for the COD and 38%for the ammonium nitrogen (5,020 kg versus 3,630 kg).Considering the mean values of the concentrations thedeviation reduces significantly in the case of COD, with anaverage relative overestimation of 3% (daily average simu-lated concentration of 35,800 mg/L versus 34,800 mg/Lmeasured). These values agree well with the conclusionsobtained from the hydrologic calibration (Lobo et al.2002). The accumulated volumes of leachate “recorded”and simulated during these 7 and a half months (6,233 m3
and 8,371 m3 respectively) deviate by 30%, which could beattributed to a possible leakage through the landfill barri-er. In that case a similar fraction of the total dissolved pol-lutants would migrate, being not registered in the leachatecharacterisation. Results seem to reveal this problem, as
30% of the global mass is missing, although the simulatedconcentrations of COD fit closely.
For the NH4–N concentrations the relative error ismuch greater (about –16%, being the measured daily aver-age value of 790 mg/L versus 660 mg/L for the simulation).This deviation could be attributed to the fact that moreNH3 is being dissolved during fermentation processes notconsidered by the model so that it is included in the organ-ic N fraction (as total nitrogen concentration average inthe simulated leachate is 1170 mg/L, the simulated organ-ic N would be 512 mg/L). Although the way the measureddata have been estimated, averaging point observations,can have an influence, this result indicates that the modelshould be improved upon in this respect. It might beimproved by incorporating a NH3–N generation factor inthe hydrolysis step, so that the ammonia generation beforemethane production phases would be taken into account.The proposed approach, giving the N that is finally con-verted to gas and the total nitrogen content of theleachate, could be useful in obtaining an order of magni-tude for the presence of NH3, but the big range of the totalKhjeldal nitrogen/ammonium nitrogen), but has to betaken into account. Ratios TKN/NH4–N reported for dif-ferent landfills vary from 30% to 150%. It should not be
forgotten that the ammonium load is oneof the most difficult leachate parametersto predict (Ehrig et al. 2001, Stegmann etal. 1989).
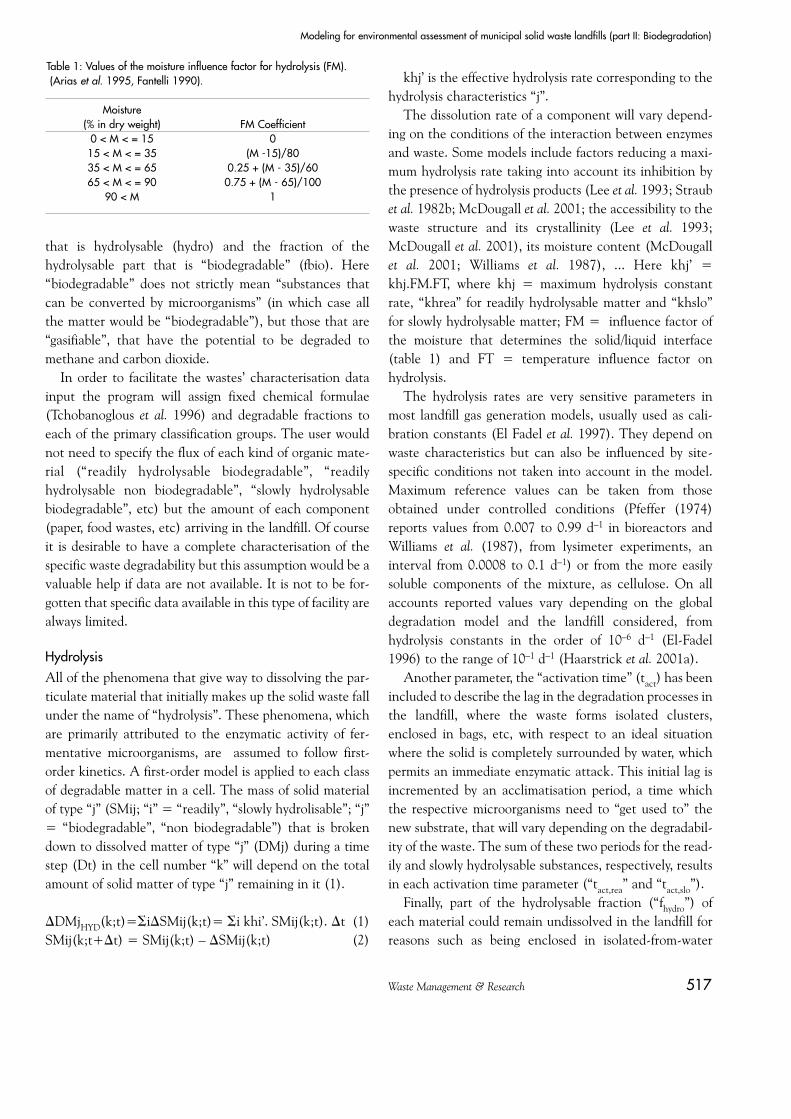
Fig. 3 shows the graphs of long-termbehaviour of COD, BOD, TKN, estimat-ed NH4–N concentrations and CO2 andCH4 resulting from the calibrated simu-lation. In order to analyse these resultsadequately, it is important to considerthe distinction between the point values,influenced by the rainfall events, andthese representing general tendencies.The pollutant concentration values andthe generated gas volumes seem to sensi-bly follow the reported general tenden-cies in other municipal landfills (Bagchi1984, Crawford et al. 1985, Ehrig et al.2001, Lu et al. 1984, Qasim et al. 1994,Stegmann et al. 1989, Tchobanoglous etal. 1996).
Around the date of its closure (day730 in the graphs), a maximum in the
522 Waste Management & Research
Fig. 2: Comparison of the daily averages COD and NH4–N loads and leachate flow
corresponding to each month of the measuring programme for MERUELO I and the simulated values.
Amaya Lobo García de Cortázar, Javier Herrero Lantarón, Oscar Montero Fernández, Iñaki Tejero Monzón, Maria Fantelli Lamia
Modeling for environmental assessment of municipal solid waste landfills (part II: Biodegradation)
523Waste Management & Research
Fig. 3: Results of simulation for MERUELO I (in all cases the X-axis represents days since landfills’ opening.

524 Waste Management & Research
Fig. 4: Effect of the ‘actually hydrolysed fraction’ fah, on emission trends of MERUELO I.
Fig. 5: Effect of hydrolysis constants, khrea and khslo, on emission trends of MERUELO I (‘khc’ = calibration value).
Fig. 6: Effect of biodegradation rate, kbio, on emission trends of MUERUELO I.
Amaya Lobo García de Cortázar, Javier Herrero Lantarón, Oscar Montero Fernández, Iñaki Tejero Monzón, Maria Fantelli Lamia

organic pollution of Meruelo I leachate was reached(38,000 mgCOD/L and 29,000 mgBOD/L), which is in theupper range of the reported intervals (boundary of 60,000mgCOD/L and 30,000 mgBOD/L have been published(Tchobanoglous et al. 1996)). They coincide with theobserved values which could be due to the topography ofMeruelo, being high but of relatively small superficial area.This form of waste deposition decreases the rainfall thatpenetrates per unit of waste volume, and therefore, thepollution washed-out by leachate leads to greater concen-trations, although the mass remains the same. It has alsobeen reported (Ehrig et al. 2001) that leachate from land-fills with more waste dumped in shorter operation periodsusually results in higher COD concentrations.
After closure, the organic pollution started to decreasesteeply, while the methanogenic stage developed(as indi-cated by the gas components graph). BOD/COD ratiosdecreased throughout the landfill’s life (as biodegradablematter was converted to gas) from a starting value of 0,9that exceeds usual values (reported to be greater than 0,4)to 0,3 at the end of the studied period.
The nitrogen compounds simulated curves also fallwithin the expected tendency, being the absolute values inthe high range (ammonium maximum concentrationsaround 1,500 mgN/L (Stegmann et al. 1989) and 2,000mgN/L (Ehrig et al. 2001) have been reported). A signifi-cant increase of the total organic nitrogen concentrationswas produced after closure (the maximum concentrationsaround 2,800 mgTKN/L were reached three and a halfyears after closure), mainly composed of NH4 from the gasformation process. As in other landfills (Stegmann et al.1989, Ehrig et al. 2001), there was a plateau of high valuesfor several years before a gentle decrease. A delay can beobserved between the simulated gas generation andNH4–N appearance in the leachate that corresponds tothe need of the leachate to reach the leachate collectionsystem before being analysed, while the gas was assumed tobe collected instantaneously.
With respect to the gases, the maximum generation ratefor both CO2 and CH4 was expected to occur beforeMeruelo I’s closure. After this, the curves show a steepdecrease corresponding to the gradual exhaustion of the“biodegradable” matter, which can last a very long time.The CH4/CO2 ratio stayed approximately constant withCH4 constituting 53% of the mixture. This was due to thesimplification, that assumes that all of the sequential phe-nomena that produce gas occur at a single time, without
intermediate generation of gas (CO2, H2). As a result thesimulated gas composition (6) is only sensitive to changesin the “biodegradable” matter’s composition with time.With this assumption variations of gas composition as aconsequence of different stages or rates in the productionof CO2 (acetogenic and acidogenic phases, for example)and CH4 cannot be simulated. On the other hand havingneglected the solution of CO2 in the leachate can have asignificant effect too. The resulting gas volumes only serveas a guide to the methane generation potential. Actually,part of the mass that generates methane will have beenlost in the form of other gases but, as these losses becomenegligible as the methane phase progresses, the long-termcurves can give an acceptable estimation.
Model sensitivityIn order to test MODUELO and assess the influence ofseveral parameters on the results obtained simulating areal case, the sensitivity of the model’s application to theMeruelo I landfill was analysed. Here is a brief summary ofthe principal conclusions obtained.
The base case used for comparisons is that resultingfrom the calibration. Table 3 shows the parameter valuesemployed in the different simulations, that were chosentrying not to deviate from what a real case could be (i.e.,keeping them on the range of the calibrated results). Figs.4, 5 and 6 present the results.
The only parameter that changes the amount of landfillemissions is fah, which controls the quantity of the poten-tially degradable solid waste that can be accessed by themicroorganisms in the specific landfill site. As Fig. 4 shows,the change in the fah values causes a vertical displacementof the curves: if the fah value reduces, the emitted sub-stances reduce (pollutant concentrations and gas volumesat a determined time decrease), although it retains thegeneral tendency with time. Nonetheless, the influence offah in degradation kinetics can be appreciated from theslopes of the increasing and decreasing parts of the curves,that are steeper the higher fah is (more solid matter is dis-solved). The effect on liquid and gaseous emissions is sim-ilar.
MODUELO is very sensitive to hydrolysis constants, asare other models. By increasing khrea and khslo, the “activ-ity” period of the landfill is reduced, as can be seen in Fig.5. If kbio does not change and khj are increased, a greateramount of “biodegradable” compounds is transported andappears in the leachate and the amount of gas generated
Modeling for environmental assessment of municipal solid waste landfills (part II: Biodegradation)
525Waste Management & Research

526 Waste Management & Research
falls. Finally, Fig. 6 shows the great sensitivity that the model
shows to the gasification rate, kbio. The increase of thedegradation rate decreases the leachate pollution whileincreasing the gas generated (greater biodegradable matterdecomposed before reaching the leachate collection sys-tem); so that kbio can be calibrated by fitting the pollutantfractions being emitted with the leachate and the gaseousform.
ConclusionsThis paper treats the biodegradation module of the simu-lation program for MSW landfills that were initially pre-sented by Lobo et al.(2002). With this module, based onhydrologic simulation data and reproducing the landfilloperation history, the program reproduces the tendency ofthe pollution-time curves: COD, BOD and total organicnitrogen present in the leachate and the potentialmethane and carbon dioxide generation rates. The scarci-ty and nature of the data available for the specific fitting toMeruelo I do not allow the extrapolation of conclusionsconcerning its capability of reproducing the long-termbehaviour of site-specific cases.
Simplified models have been chosen, in an attempt tolook for time and memory calculation savings: thus, mak-ing the program able to manage 3-D discretisation, whichis essential in many sites, as in depression-type landfills.Data input has also been especially considered, making itpossible to characterise the waste by specifying the princi-pal component streams, which is usually the only informa-tion available to the operators. In this aspect, an important
effort remains to be made in order to properly define thedegradability of each component (in the fhydro model). Ineach specific site, the model parameters (fah, khrea, khslo,tact,rea, tact,slo and kbio) should be calibrated to fit theobserved emissions’ behaviour in a similar way as in thecase of Meruelo I, which was presented by Lobo et al. 2002and here.
Thus, the module presented in this paper is meant to bethe base for the development of a useful tool for the designand management of municipal solid waste landfills. At thisdeveloping stage, MODUELO can be helpful for approxi-mating the capacity necessary for leachate treatment facil-ities (in flow and pollutant load), whether harnessing thegenerated gas is profitable or not, the effects of differentalternatives to the landfill space filling and cover material,etc. It can also be used to estimate the environmentalimpact due to the emissions generated over time, duringits operation phase as well as in the after-care period, andas a result, can facilitate the planning of adequate mea-sures to attenuate them.
MODUELO aims to constitute a direct help for thedesign of new facilities, for the analysis of leachate recy-cling and other remediation strategies, for the detection ofthe protection system’s failures (leakage through the barri-er, etc) or to evaluate the stability of old dumping sites. Butthere are still many aspects in which MODUELO has tobe and is being improved. The model will be extended tosimulate other pollutants, incorporating the effect of tem-perature on waste decomposition, the generation of gasesin intermediate breakdown phases, the movement of gas inthe waste, and improving the hydrologic model with amodel of flow in non-saturated areas, etc.
References
Al-Yousfi, A.B. (1992) Modelling of leachate and gas production and com-position at sanitary landfills. Ph.D. Thesis, University of Pittsburgh,PA, U.S.A.
Al-Yousfi, A.B., Basel, A. & Pohland, F.G. (1998) Strategies for simulation,design and management of solid wastes disposal sites as landfill biore-actors. Periodical of Hazardous, Toxic and Radioactive WasteManagement, 2, 1, pp. 13–21.
Arias, A., Gil, J.L., Sanchez, J.M., Tejero, I., Szanto, M., Fantelli, M. &Palma, J. (1995) Estimating material losses in sanitary landfills throughbiological degradation. 5th Waste Management and Landfill Symp,CISA, Cagliari, Italy. pp. 203–208.
Bagchi, (1984) Design, Construction and Monitoring of Landfills. Wiley-Interscience, New York, USA.
Butler, A.P., Zacharof, A.I. & Sollars, J. (1999) A stochastic flow and trans-port model for landfill leachate production. 7th Waste Managementand Landfill Symp. CISA, Cagliari, Italy. pp. 25–32.
Crawford, J.F. & Smith, P.G. (1985) Landfill technology. Butterworth,London (U.K.).
Danish Hydraulic Institute (1998) MOUSE User Manual and Tutorial.Horsholm, Denmark.
El-Fadel, M., Findikakis, A.N. & Leckie, J.O. (1996a) Transport of gas andheat in sanitary landfills I. Model Formulation. in Waste Managementand Research 14, 6, pp. 483–504.
El-Fadel, M., Findikakis, A.N. & Leckie, J.O. (1996b) Transport of gas andheat in sanitary landfills II. Model Application. in Waste Managementand Research 14, 6, pp. 537–551.
El-Fadel, M., Findikakis, A.N. & Leckie, J.O. (1996c) Transport of gas andheat in sanitary landfills III. Sensitivity analysis. in Waste Management& Research 15, pp. 87–102.
El-Fadel, M., Findikakis, A.N. & Leckie, J.O. (1997) Gas simulation modelsfor solid waste landfills. In Critical Reviews in Environmental Scienceand Technology, 27, 3, pp. 237–283.
Ehrig, H.J. & Kruempelbeck, I. (2001) The emission behaviour of old land-fills in the aftercare phase. 8th Waste Management and Landfill Symp.CISA, Cagliari, Italy, pp. 313–323.
Fantelli, Lamia (1990) Estudio de producción en cantidad y calidad de los
Amaya Lobo García de Cortázar, Javier Herrero Lantarón, Oscar Montero Fernández, Iñaki Tejero Monzón, Maria Fantelli Lamia

Modeling for environmental assessment of municipal solid waste landfills (part II: Biodegradation)
527Waste Management & Research
lixiviados del Vertedero de Meruelo. Master in Environmental andSanitary Engineering. Departamento de Ciencias y Técnicas del Aguay Medio Ambiente. Universidad de Cantabria.
Haarstrick, A. & Hempel, D.C. (2001a) Anaerobic digestion in municipallandfills – conceptual considerations and development of structuredbiodegradation models. 8th Waste Management and Landfill Symp.CISA, Cagliari, Italy. pp. 89–98.
Haarstrick, A., Hempel, D.C., Ostermann, L., Ahrens, H. & Dinkler, D.(2001b) Modelling of the biodegradation of organic matter in munici-pal landfills. Waste Management and Research, 19, 4, pp. 320–331.
Halvadakis, C.P. (1983) Methanogenesis in solid-waste landfill bioreactors.Ph.D. Thesis , Department of Civil Engineering, Stanford University,CA, U.S.A.
Hanel, J., Dinkler, D. & Ahrens, H. (2001) Coupled processes of wastedegradation, gas and leachate transport in municipal landfills. 8thWaste Management and landfill Symp. CISA, Cagliari, Italy, pp. 129–138.
Huber, W.C. & Dickinson, E. (1988) Storm Water Management ModelVersion 4. EPA/600/3-88/001. Athens, Georgia, U.S.A.
Lee, J.J., Jung, I.H., Lee, W.B. & Kim, J.O. (1993) Computer and experimen-tal simulations of the production of methane gas from municipal solidwaste in Water Science and Technology 27, 2, pp. 225–234.
Lee, Suk, Choi, Lee, & Chung, (2001) Numerical evaluation of landfill sta-bilisation by leachate circulation Journal Environmental Engineering127, 6), pp. 555–563.
Lobo, A., Herrero, J., Montero, O, Fantelli, M, & Tejero, I. (2002) Modellingfor environmental assessment of municipal solid waste landfills (Part 1:Hydrology). Waste Management and Research 20, 2, pp. 198–210.
Lu, J.C.S., Eichenberger, B. & Stearns, R.J. (1984) Production and manage-ment of leachate from municipal landfills: summary and assessment.EPA-602/2-84-092, Municipal Environmental Laboratory, Cincinnati,Ohio (U.S.).
Manna, L., Zannetti, M.C. & Genon, G. (1999) Modelling biogas productionat landfill site Resources, Conservation and Recycling, 26,pp. 1–14.
McDougall, J.R. & Philp, J.C. (2001) Parametric study of landfill biodegra-dation modelling: methanogenesis and initial conditions. 8th WasteManagement and Landfill Symp. CISA, Cagliari, Italy, pp. 79–88.
Pfeffer, J.T. (1974) Temperature effects on anaerobic fermentation of domes-tic refuse Biotechnology and Bioengineering, 26, pp. 771–787.
Pohland, F.G. & Al-Yousfi, B. (1994) Design and operation of landfills foroptimum stabilisation and biogas production. Water Science andTechnology, 30, 12, pp. 117–124.
Qasim, Syed R. & Chiang, Walter (1994) Sanitary Landfill Leachate.Generation, Control and Treatment. Technomic Publishing A.G,Basel, Switzerland.
Sánchez Alciturri, J.M., Palma, J.H., Sagaseta, C. & Cañizal, J., (1993a)Mechanical properties of wastes in a sanitary landfill. In ProceedingsGreen 93, Waste Disposal by Landfill, Bolton, (U.K.) pp. 357–363.
Sánchez Alciturri, J.M., Palma, J.H., Sagaseta, C. & Cañizal, J., (1993b)Three Years of deformation monitoring at Meruelo landfill. InProceedings Green 93, Waste disposal by Landfill, Bolton, (U.K.) pp. 365–371.
Schroeder, R., Dozier, S., Zappi, P.A., McEnroe, M, Sjostrom, W. &
Peyton, R.L (1994) The hydrologic evaluation of landfill performance(HELP) model. Engineering documentation for version 3. EPA/600/r-94/168b. U.S. Environmental Protection Agency.
Shelley, M.L., Nixon, W.B., Bleckmann, C.A., Coldorn, P.A. & Benter, B.D.(2001). Dynamic simulation of landfill waste stabilisation. Jour ofEnvironmental Engineering, 127, 12, pp. 1100–1110.
Stegmann, R. & Ehrig, H.J. (1989) Leachate production and quality -resultsof landfill processes and operation. 2nd Landfill Symp, CISA, Cagliari,Italy. XX VIII- pp. 1–16.
Straub, W.A. & Lynch, D.R. (1982a) Models of landfill leaching: moistureflow and inorganic strength. Jour, Environmental Eng. Div., ASCE,108, 2, pp. 231–250.
Straub, W.A. & Lynch, D.R. (1982b) Models of landfill leaching: organicstrength. Jour, Environmental Eng., Div., ASCE, 108, 2, pp. 251–268.
Swarbrick, G., Lethlean, J. & Pantelis, G. (1995) Physical and bio-chemicalmodelling of solid waste. 5th Waste Management and Landfill Symp.CISA, Cagliari, Italy, pp. 209–218.
Swarbrick, G. & Lethlean, J. (2001) A thermodynamc model for MSW land-fill degradation. 8th Waste Management and Landfill Symp. CISA,Cagliari, Italy. pp. 99–108.
Szanto, M., Tejero, I., Mira, J.R., Diaz, R., Fantelli, M. & Del Moral, C.(1992) Caracterización de los residuos sólidos urbanos de Cantabria. In6º Congreso y Exposición Internacional de Residuos Sólidos(ISWA´92). Madrid, Spain.
Tchobanoglous, Theisen & Vigil, A. (1996) Intergrated solid waste manage-ment. Engineering principles and management issues. McGraw-Hill,Madrid, Spain.
Tejero, I. Fantelli, M. Diaz, R. Szanto, M. (1993) Characteristics and treat-ment of leachates in the “Meruelo Landfill” (Spain). 3rd WasteManagement and Landfill Symp., pp. 1033–1042. CISA, Cagliari, Italy.
Vincent, F., Beaudoing, G. & Colin, F. (1991) Waste behaviour modelling: anumerical model to describe the flow, transport and biodegradationprocesses. 3rd Waste Management and Landfill Symp.. CISA, Cagliari,Italy, pp. 847–855.
Williams, N. Pohland, F. McGowan, K. & Sounders, M. (1987) Simulation ofleachate generation from municipal solid waste. EPA/600/2-87/059.U.S. Environmental Protection Agency, U.S.A.
White, J., Robinson, J. & Ren, Q. (2001) A framework to contain a spatial-ly distributed model of the degradation of solid waste in landfills. 8thWaste Management and Landfill Symp. CISA, Caligari, Italy, pp. 109–118.
Young, A. (1989) Mathematical modelling of landfill degradation. JourChemical Technology and Biotechnology, 466, pp. 189–208.
Young, A. (1995) Mathematical modelling of the methanogenic ecosystem,Microbiology of Landfill Sites (Senior E., ed), CRC Pres Inc., Florida,U.S., pp. 67–89.
Zacharof, A.I. & Butler, A.P. (1999) Modelling biodegradation processes inheterogeneous landfill waste. 7th Waste Management and LandfillSymp. CISA, Caligari, Italy, pp. 99–102.
Zacharof, A.I. & Butler, A.P. (2001) Application of a stochastic leachate andbiogas model to the Brogborough test cell experiment data incorporat-ing data uncertainty. 8th Waste Management and Landfill Symp.CISA, Caligari, Italy, pp. 119–128.

Amaya Lobo García de Cortázar, Javier Herrero Lantarón, Oscar Montero Fernández, Iñaki Tejero Monzón, Maria Fantelli Lamia
528 Waste Management & Research
Appendix: Greek letters and symbols
Symbolfhydro Fraction of the waste component that is
hydrolysablefbio Fraction of the hydrolysable fraction of the waste
component that can be biodegraded to gasSMij Solid material of type ij (“i”= readily hydr.,
slowly hydr.; “j” = “biodegradable” or “non biodegradable”)
DMj Dissolved matter of type j�–_ Increment of _ during the time step�t Time step
kh’ Effective hydrolysis rate.FM Moisture influence factor on the hydrolysis.FT Temperature influence factor on the hydrolysiskh Maximum hydrolysis ratetact Activation time for the degradation processfah Fraction of the solid waste that can actually be
accessed by microorganismsQik Water volume flowing from cell I to cell kh Moisture content