Embed Size (px)
Citation preview

17th European Symposium on Computer Aided Process Engineering – ESCAPE17 V. Plesu and P.S. Agachi (Editors) © 2007 Elsevier B.V. All rights reserved. 1
Modelling an Ice cream factory for de-bottlenecking
Peter Bongers, Bas Bakker
Process and Supply Chain Design – Unilever Food and Health Research Institute, Olivier van Noortlaan 120, PO Box 114, 3130 AC Vlaardingen, The Netherlands, [email protected]
Abstract
The process plant of Unilevers ice-cream factory in Hellendoorn, The Netherlands, needed to increase their output by 30%. Outsourcing the volume or working overtime are not possible to generate the additional output. The immediate engineering response was to propose a capital investment project for building additional capacity. The key question is then in which area of the plant to invest, because the bottleneck might not be obvious and depend on the actual portfolio. In this paper we will pursue a modelling and simulation route to identify which bottleneck(s) need enlarging, taking into account the costs and the time needed. The model will be designed to quantify the effect of working procedures, minimum storage time of the mixes, equipment extensions and modifications. The effects will be quantified by the feasibility of the production schedule for the whole factory. Using the model, various scenario’s have been simulated and the outcome evaluated. A number of bottlenecks have been identified, the two main ones being the high non-operational time of the main heat exchanger and the fact that only the packing lines are scheduled. By scheduling the factory as a whole, the available overall capacity of the factory can be increased significantly. The above factory schedule generates 10-30% additional capacity without significant capital expenditure.
2 P.Bongers et al.
1. Problem description
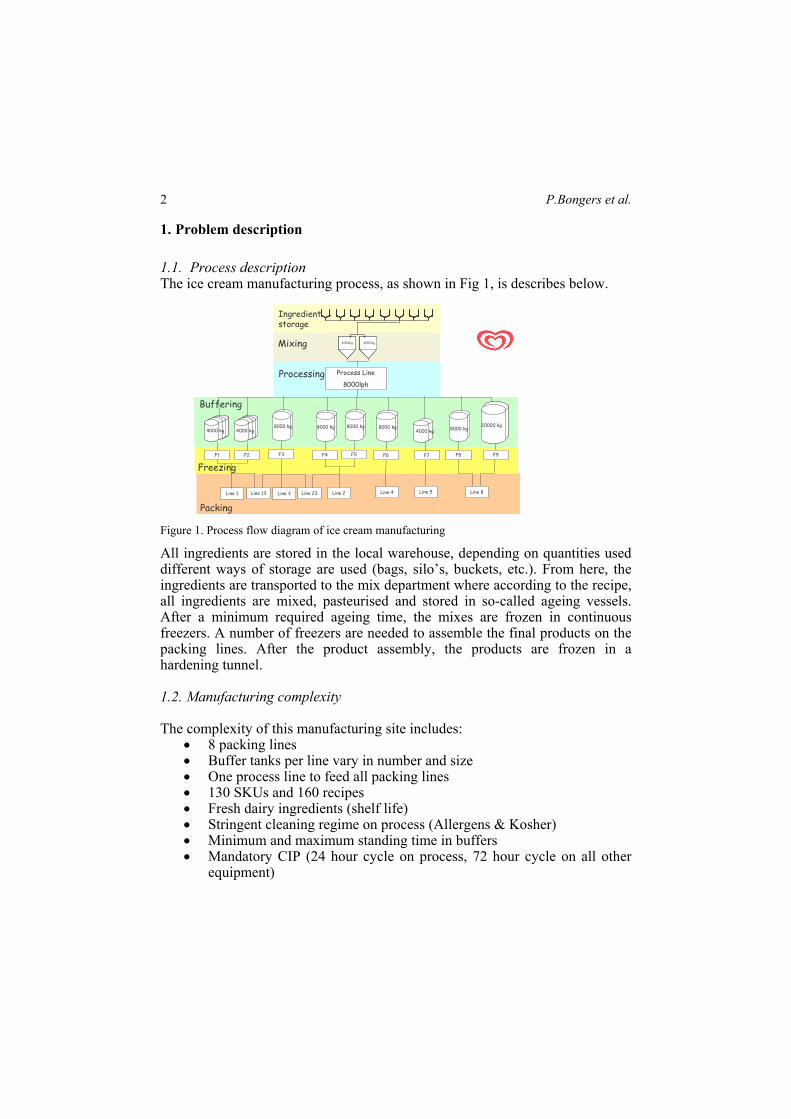
1.1. Process description The ice cream manufacturing process, as shown in Fig 1, is describes below.
Figure 1. Process flow diagram of ice cream manufacturing
All ingredients are stored in the local warehouse, depending on quantities used different ways of storage are used (bags, silo’s, buckets, etc.). From here, the ingredients are transported to the mix department where according to the recipe, all ingredients are mixed, pasteurised and stored in so-called ageing vessels. After a minimum required ageing time, the mixes are frozen in continuous freezers. A number of freezers are needed to assemble the final products on the packing lines. After the product assembly, the products are frozen in a hardening tunnel.
1.2. Manufacturing complexity
The complexity of this manufacturing site includes: • 8 packing lines • Buffer tanks per line vary in number and size • One process line to feed all packing lines • 130 SKUs and 160 recipes • Fresh dairy ingredients (shelf life) • Stringent cleaning regime on process (Allergens & Kosher) • Minimum and maximum standing time in buffers • Mandatory CIP (24 hour cycle on process, 72 hour cycle on all other
equipment)
Processing
Line 1
4000 kg
F1 F3
Process Line
8000lph
8000 kg4000 kg
F2
Line 13 Line 3 Line 23 Line 2
F4
8000 kg
F5
8000 kg4000 kg
F7
Line 5
F6
8000 kg
Line 4
F8
Line 8
8000 kg20000 kg
4000kg 4000 kg
F9
Mixing
Buffering
Freezing
Packing
Ingredientstorage
Processing
Line 1
4000 kg4000 kg
F1 F3
Process Line
8000lph
8000 kg4000 kg4000 kg
F2
Line 13 Line 3 Line 23 Line 2
F4
8000 kg
F5
8000 kg4000 kg
F7
Line 5
F6
8000 kg
Line 4
F8
Line 8
8000 kg20000 kg20000 kg
4000kg 4000 kg
F9
Mixing
Buffering
Freezing
Packing
Ingredientstorage

Modelling an Ice cream factory for de-bottlenecking 3
1.3. Problem description
The key question is how to increase the output of the factory by 30% within three month. Outsourcing the volume or working overtime are not possible to generate the additional output. The immediate engineering response is to propose a capital investment project for building additional capacity. The key question is then in which area of the plant to invest, because the bottleneck might not be obvious. In this paper we will pursue a modelling and simulation route to identify which bottleneck(s) need enlarging, taking into account the costs.
2. Factory modelling
In this section, the design of the multi-stage scheduling model of the ice cream plant will be described, following [1]. The model should be the lowest complexity description of the plant behaviour of the: o Manufacturing lines and their key equipment o Material flow through the plant;. o Operating procedures inside the plant. The model will be built according to the schematics of Fig.2. It should be noted that the ‘soft’information bit provides valuable information about the plant operations, as there is almost always a discrepancy between the written procedures and the actual ones.
Figure 2 Model building schematics.
The model has been implemented in the INFOR advanced scheduling software [2]. Within the INFOR software, stages are being defined as processes coupled with tanks. The behaviour of the stage is determined by the characteristics of both the process as well as the tank. Products can be seen as the material flow from one stage to another stage. A process step describes how a product is made (which stage, process, tank and characteristics).
Process flow sheetSKU’sMixesIngredients1 week planning
Process flow sheetSKU’sMixesIngredients1 week planning
Model AssumptionsModel Assumptions
Model (1st version)Model (1st version)
Model (2nd version)Model (2nd version)
Data refinementData refinement
Validated ModelValidated Model
Model validation & refinement
Model validation & refinement
Scheduling modelScheduling modelScheduling model
Obtain “soft” information
Obtain “soft” information
Use the model to:•Identify opportunities•Verify scenario’s
Process flow sheetSKU’sMixesIngredients1 week planning
Process flow sheetSKU’sMixesIngredients1 week planning
Model AssumptionsModel Assumptions
Model (1st version)Model (1st version)
Model (2nd version)Model (2nd version)
Data refinementData refinement
Validated ModelValidated Model
Model validation & refinement
Model validation & refinement
Scheduling modelScheduling modelScheduling model
Obtain “soft” information
Obtain “soft” information
Use the model to:•Identify opportunities•Verify scenario’s

4 P.Bongers et al.
As an example, the 2 stages of the plant are depicted in Fig.3.
Figure 3 two-stages as part of the scheduling model
3. Baseline operations
First, the designed and implemented multi-stage scheduling model has been used to establish the baseline, i.e. given the current portfolio, equipment and operating procedures is a 30% volume increase possible (see Fig. 4).
Figure 4 base-line
Fig.4 shows clearly that the requested 30% volume increase is not possible. It has been key to identify that the bottlenecks are upstream in the process and not at the packing lines. This is for the operational staff counter-intuitive as they observe a bottleneck if the packing lines can not run. There are two main
packing
processing
Packing line(s)
Vessel(s)
Process line(s)
Mixes
SKUs
Tank overlap
No space for CIP
Required volume= + 30%
Tank overlapTank overlap
No space for CIPNo space for CIP
Required volume= + 30%

Modelling an Ice cream factory for de-bottlenecking 5
bottlenecks identified: (i) the buffer vessels are not allowed to be filled and emptied at the same time; (ii) the process line needs a mandatory cleaning every 24 hrs.
4. Results
An engineering response to the above observations would be to increase the capacity of the process line and to build more buffer vessels. In figure 5 the preparation time of the recipes are shown. At the current throughput of the homogeniser, only a very few recipes need longer dosing time (i.e. are reducing the overall throughput). It can be seen that increasing the homogeniser throughput is not the solution.
Figure 5 effect of capacity increase on overall throughput.
Furher analysing the process line bottleneck showed that: (i) the homogeniser was blocked for a long time by the pre-mix vessels in preparing a water batch for cleaning between the different products; (ii) due to lack of transparancy in the operations, the mix plant operators are not aware that any delay in changing between batches was causing reduction in volume. As there is a large time delay between mix preparation and consumption, it is extremely difficult to relate packing shortages can be caused the day before. For both bottlenecks solutions have been identified: (i) water batches for cleaning are now taken from mains water. This needed some additional pipe work, valves and update of the control system; (ii) scheduling the upstream bottlenecks by multi-stage scheduling of the whole factory and instructing the mix plant operators about the importance of their work.
Homogeniser @ 10ton/hr
Homogeniser @ 8ton/hr
Critical recipes wh
0
5
10
15
20
25
30
35
40
0 20 40 60 80 100 120 140 160 180
recipe
prep
arat
ion
tim
e [m
in]
Increased throughput is no solution
Homogeniser @ 10ton/hrHomogeniser @ 10ton/hr
Homogeniser @ 8ton/hr
Critical recipes wh
Homogeniser @ 8ton/hrHomogeniser @ 8ton/hr
Critical recipes wh
0
5
10
15
20
25
30
35
40
0 20 40 60 80 100 120 140 160 180
recipe
prep
arat
ion
tim
e [m
in]
Increased throughput is no solutionIncreased throughput is no solution
6 P.Bongers et al.
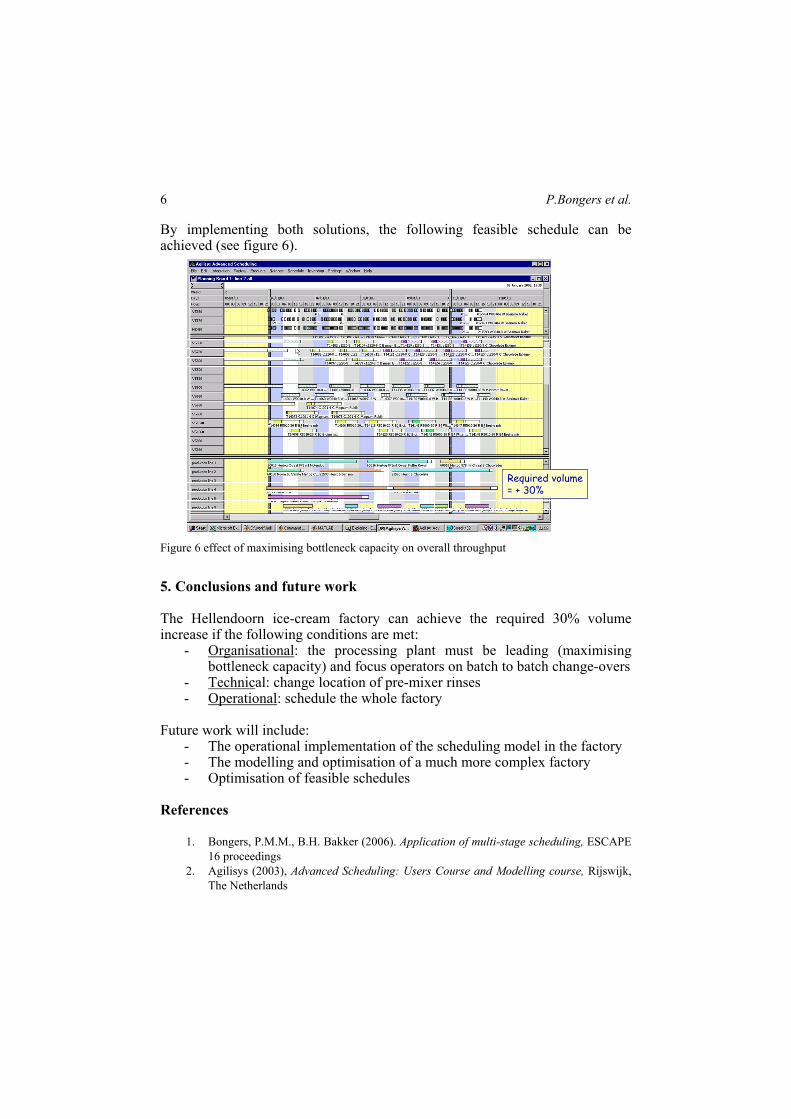
By implementing both solutions, the following feasible schedule can be achieved (see figure 6).
Figure 6 effect of maximising bottleneck capacity on overall throughput
5. Conclusions and future work
The Hellendoorn ice-cream factory can achieve the required 30% volume increase if the following conditions are met:
- Organisational: the processing plant must be leading (maximising bottleneck capacity) and focus operators on batch to batch change-overs
- Technical: change location of pre-mixer rinses - Operational: schedule the whole factory
Future work will include:
- The operational implementation of the scheduling model in the factory - The modelling and optimisation of a much more complex factory - Optimisation of feasible schedules
References
1. Bongers, P.M.M., B.H. Bakker (2006). Application of multi-stage scheduling, ESCAPE 16 proceedings
2. Agilisys (2003), Advanced Scheduling: Users Course and Modelling course, Rijswijk, The Netherlands
Required volume= + 30%Required volume= + 30%