Embed Size (px)
Citation preview

Modeling & Simulation What can they offer?
March 28, 2012Ottawa, ON
Waiting Time Management Strategies for Scheduled Health Care Services: A Workshop for Researchers, Managers and Decision-makers
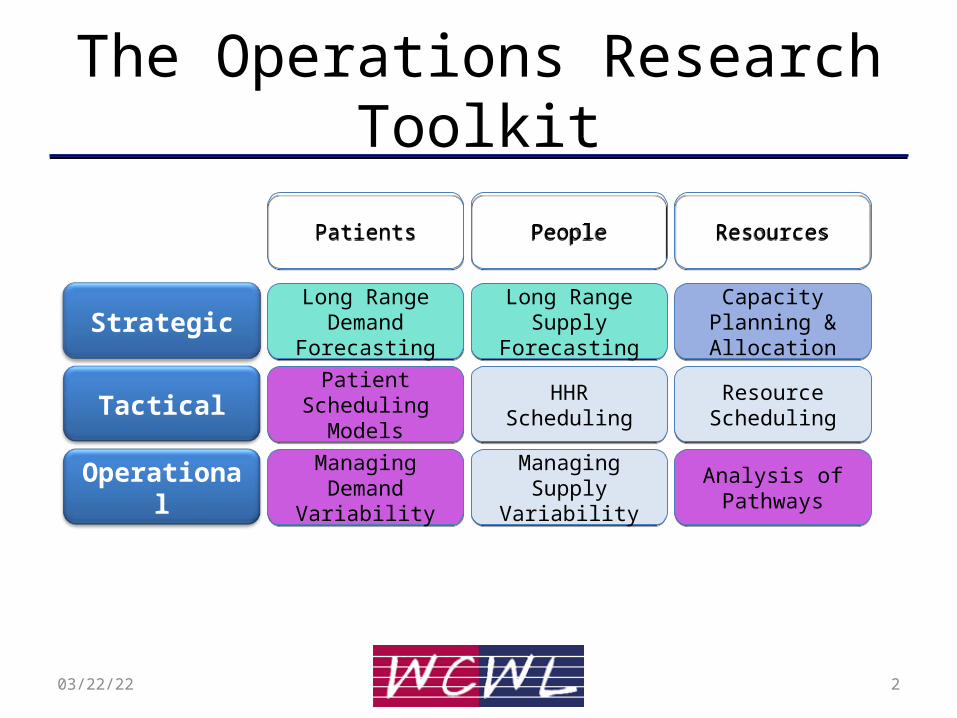
The Operations Research Toolkit
Strategic
Tactical
Operational
Long Range Demand
Forecasting
Long Range Demand
Forecasting
Long Range Supply Forecasting
Long Range Supply Forecasting
Capacity Planning & Allocation
Capacity Planning & Allocation
Patient Scheduling Models
Patient Scheduling Models HHR SchedulingHHR Scheduling Resource
SchedulingResource
Scheduling
Managing Demand Variability
Managing Demand Variability
Managing Supply Variability
Managing Supply Variability
Analysis of PathwaysAnalysis of Pathways
PatientsPatients PeoplePeople ResourcesResources
04/19/23 2
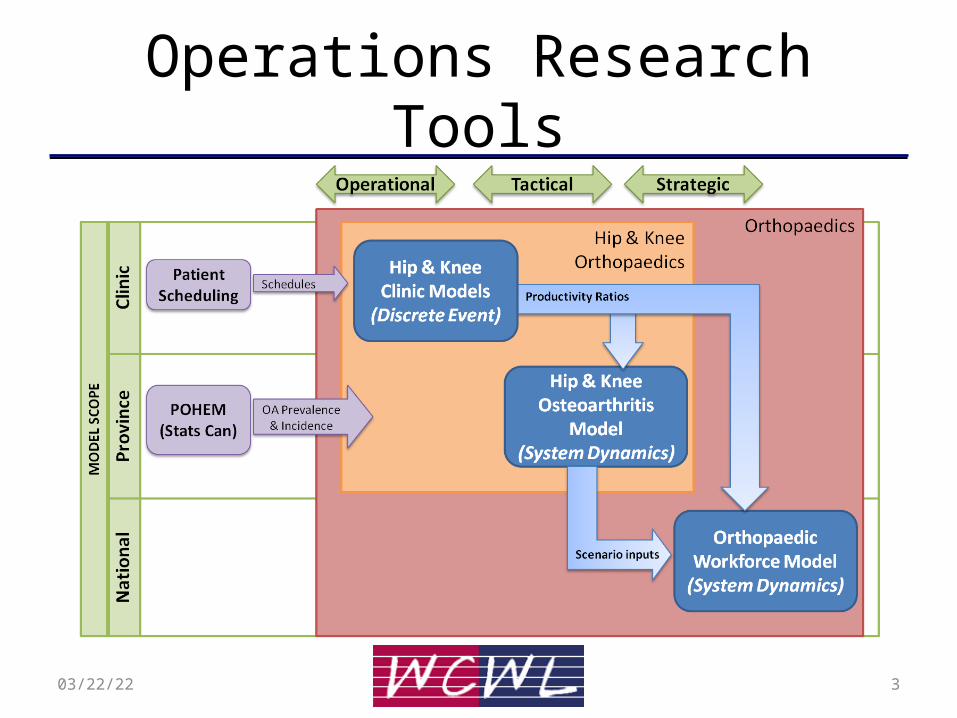
Operations Research Tools
04/19/23 3

Urgent Patient Queueing Model
• Objective: To develop a generalized model to determine how to best allocate capacity to urgent patients
• Scope: Any fixed capacity intervention with 2 urgency classes and a critical MAWT to meet for the high urgency class (Winnipeg, Edmonton)
• Modelling methodology: Stochastic Model to create closed-form Queueing formulas, tested against DES (Arena) models
04/19/23 4

Rationale• Goal: Provide more certainty around surgery
dates for all patient classes• Patient Scheduling variability depends upon:– OR Schedule stability
• Cancellations of OR time, frequency of scramble time– Surgeon variability
• Longer waitlists create more uncertainty of surgeon availability
– Patient readiness• Prehab and case management has improved this
– Arrival of urgent patients that ‘bump’ elective patients when there isn’t adequate time reserved
04/19/23 5

Literature Overview
• Scheduling Policies for managing Urgent/Elective Patrick & Puterman (2008) “Dynamic Multipriority Patient Scheduling for a
Diagnostic Resource• CT Scans for 3 outpatient categories, MAWT of 7, 14, 28 days• Markov Decision Process (MDP) that recommends that highest priority gets
scheduled right away and that lower priorities are scheduled into the latest appointment available to meet MAWT. When demand > capacity, higher priority patients are rejected vs. a bumping of elective.
• Increased flexibility with high priority scheduling improves system
Zonderland et al. (2010) “Planning and scheduling of semi-urgent surgeries.• Stochastic model created for specific location. • Difficult to multi-location replicate due to mathematical approach
604/19/23

Research Question• What is the ‘optimal’ number of urgent surgical
slots to set aside so as to meet a desired performance metric – specifically % of urgent patients that bump electives
• Required data:– Patient arrival rate– MAWT for urgent patients
• Output:– Minimum # of surgeries to reserve of MAWT window
704/19/23

Simulation Approach
04/19/23 8
Average arrival rate of urgent patients = 1 per week.
Surgery rate = Number of urgent surgical spots reserved over the next 4 weeks for urgent patients
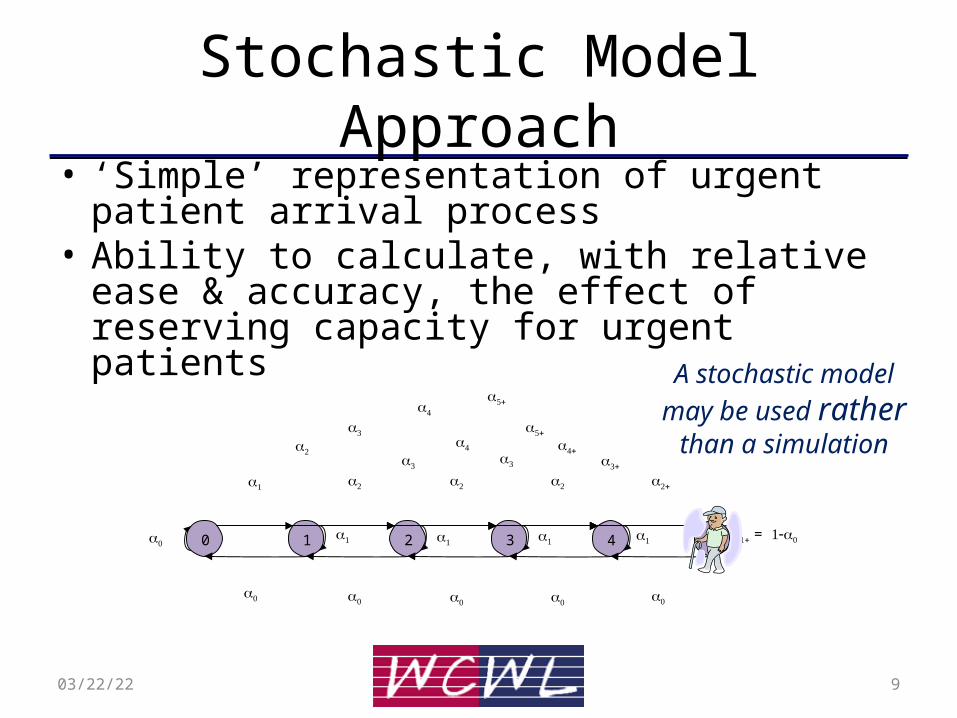
Stochastic Model Approach• ‘Simple’ representation of urgent patient arrival
process• Ability to calculate, with relative ease & accuracy,
the effect of reserving capacity for urgent patients
0 1 2 3 4 5
=
04/19/23 9
A stochastic model may be used rather
than a simulation

Analytical Queueing Model• Derive appropriate formulae based upon an
M/D/1/N queueing model• Test accuracy of queuing model against DES• Implement formula in Excel front-end
The stochastic model may be solved analytically to determine
the probability of having 0, 1, …N patients waiting.
04/19/23 10

Results
Low volumeMedium Volume
High VolumeExtreme Volume
Scenario 1 2 3 4 5 6 7 8
(arrivals/week) 0.25 0.25 1 1 3 3 5 5
(surgery/week) 0.75 0.50 1.25 1 3 2.75 5 4.75
Prob(empty) 0.6693 0.5481 0.2282 0.1304 0.0423 0.0158 0.0252 0.0087
Prob(bumping) 0.0078 0.0963 0.0353 0.1304 0.0423 0.0978 0.0252 0.0583
04/19/23 11

Validation – Comparing DES/Queue
04/19/23 12

Excel-based “OR Tool”
04/19/23 13

Next Steps
• Phase I - Data gathering and Implementation of logic into Concordia Scheduling Software, early 2012
Phase II - Integrate into Generalized DES Model as part of “best practices” options
• Phase III - Improve user interface and test at pilot clinics – gather performance feedback
04/19/23 14

Operations Research Tools
04/19/23 15

Thank you!
1604/19/23