Embed Size (px)
Citation preview

Health Service Performance Report
December Performance Report

Health Service Performance Report December 2015 2
Contents
Performance Overview .................................................................................................................................. 3
Quality & Safety ........................................................................................................................................... 18
Accountability Framework ........................................................................................................................... 21
Performance Overview by Service Provider ................................................................................................ 36
Finance ........................................................................................................................................................ 51
Human Resources ....................................................................................................................................... 58
Appendices .................................................................................................................................................. 62
Appendix 1: Hospital Groups ................................................................................................................... 63
Appendix 2: Community Health Organisations ........................................................................................ 64
Data used in this report refers to the latest performance information available at the time of publication
Health Service Performance Report December 2015 3
Key performance message
Emergency Departments
Emergency Department attendances increased by 1.2% year to date December 2015 when
compared with the corresponding period in 2014. The percentage of patients waiting in the
Emergency in December for 6 hours or less was 68.6%. The percentage of patients waiting for 9
hours or less in Emergency Departments in December was 83%. There was a significant reduction
in the number of patients waiting greater than 24 hours in the Emergency Department in December.
The number waiting greater than 24 hours reduced to 2,565 in December from 3,514 in November.
Under the Winter Planning Initiative, hospitals and Community Healthcare Organisations developed
Winter plans to assist Emergency Departments through the enforcement of priority actions along
with increased capacity being made available across hospitals and in the community.
Waiting lists for inpatient, day case and outpatient appointments
The HSE undertook an initiative to reduce waiting lists for inpatient, day case procedures and
outpatient appointments. Additional funding was allocated to the HSE to meet the costs associated
with supplementary treatment capacity to bring maximum wait times to 15 months by 31 December
2015.
The total number of people waiting over 15 months for an inpatient/day case procedure at the end of
December was 746.
Concerted efforts were made to reduce outpatient waiting lists by facilitating additional clinics
outside conventional working hours and by outsourcing where the capacity was limited in particular
hospital groups. The total number of people waiting over 15 months for an outpatient appointment at
the end of December was 9,887.
The HSE recognises that there are personnel and structural challenges which are impacting on
specialties and hospital sites. Waiting lists are being managed so that those patients waiting the
longest are scheduled within the available capacity, once emergency and urgent cases have been
dealt with.
Delayed Discharges
The number of delayed discharges in December was 509, which is down from 558 in November.
The number of bed days lost through delayed discharges has reduced by 24.7% since January, a
gain of 5,432 bed days.
The Government approved a €25m Delayed Discharge Initiative in 2015. This initiative has now
been fully implemented. Service improvements seen in 2015 include 300 additional Nursing Home
Support Scheme (NHSS) places, 50 additional ring fenced short stay residential beds and an
additional 65 short stay beds at Mount Carmel, an additional 400 Home Care Packages which are
being utilised by Hospitals to alleviate delayed discharges and there has been an extension of the
Community Intervention Teams to support the Acute Hospitals.

Health Service Performance Report December 2015 4
As part of the Emergency Department Taskforce Initiative an additional €74m was provided. Service
improvements include 713 additional NHSS places, the number on the placement list waiting for
NHSS approval has reduced to 358 and the waiting time for approval is being maintained at no
longer than 4 weeks. Also 1,513 additional transitional care beds have been approved for people
being discharged from acute care and 4,183 approvals have been given for these since April. 149
additional public beds and 24 additional private contracted beds are also operational under this
initiative.
Performance update
Acute Hospitals Services
Acute Activity
The number of elective admissions is 102,554 and the number of outpatient attendances is
3,297,475 year to date. There has been a 2.6% (2,581) increase in the number of elective
admissions and a 3.4% (107,726) increase in the number of outpatient attendances against
expected activity year to date.
Emergency presentations are up by 20,871 on 2014, the proportion of these who are admitted has
remained around 34%.
The proportion of all of the people seen between January and December 2015 who had completed
their visit to the Emergency Department within 9 hours was 81.7%.
Overview of key acute hospital activity
Activity Area
Result YTD
Jan - Dec 2014
Result YTD
Jan - Dec 2015
SPLY % Var
Against expected activity
YTD Feb- Dec
2014 Feb-Dec
2015 SPLY % Var
Result Oct
2015
Result Nov 2015
Result Dec 2015
Inpatients discharges
642,812 644,990 0.3%
(2,178) 0.2%
(1,242) 587,056 591,756
0.8% (4,700)
55,115 54,102 54,939
Day case discharges
861,138 878,821 2.1%
(17,683) 0.2%
(1,622) 786,687 808,441
2.8% (21,754)
74,861 77,111 67,500
Inpatient & Day Cases
1,503,950 1,523,811 1.3%
(19,861) 0.2%
(2,864) 1,373,743 1,400,197
1.9% (26,454)
129,976 131,213 122,439
% Inpatient 42.7% 42.3% -0.4%
42.7% 42.3% -1.1% 42.4% 41.2% 44.9%
% Day Cases 57.3% 57.7% 0.4%
57.3% 57.7% 0.8% 57.6% 58.8% 55.1%
Emergency
Presentations 1,272,269 1,293,140
1.6% (20,871)
1.2% (15,691)
1,165,264 1,190,749 2.2%
(25,485) 111,179 107,116 108,141
New ED attendances
1,098,008 1,102,720 0.4%
(4,712) -0.1%
(-1,411) 1,006,113 1,015,049
0.9% (8,936)
94,645 90,794 92,539
Emergency
Admissions 449,167 447,557
-0.4% (-1,610)
-0.8% (-3,600)
408,969 409,585 0.2% (616)
37,814 37,271 38,734
ED Admissions *
283,679 280,509 -1.1%
(-3,170) 258,847 256,215
-1% (-2,632)
23,573 23,068 24,446

Health Service Performance Report December 2015 5
Activity Area
Result YTD
Jan - Dec 2014
Result YTD
Jan - Dec 2015
SPLY % Var
Against expected activity
YTD Feb- Dec
2014 Feb-Dec
2015 SPLY % Var
Result Oct
2015
Result Nov 2015
Result Dec 2015
Elective Admissions
100,971 102,554 1.6%
(1,583) 2.6%
(2,581) 92,655 94,665
2.2% (2,010)
8,684 9,395 7,495
OPD Attendances
3,206,056 3,297,475 2.9%
(91,419) 3.4%
(107,726)
2,923,776
3,023,426
3.4% (99,650)
280,354
290,564
242,584
*Note: ED Admissions recorded in 2014 were higher than those in 2015 in some hospitals due to a different recording protocol.
Standardisation in 2015 has resulted in a difference of c 2,700 due this data definition change.
Inpatient discharges has increased by 1,242 patients YTD against target.
Daycase activity has increased by 17,683 cases in 2015 YTD compared with 2014, and is 0.2%
above projected target YTD.
The combined number of inpatients and day cases has increased by 19,861 which is significant
when taken in the context of a reduced birth rate, an increase in admissions of patients over 65
years of age and an increase in complexity of emergency presentations.
Patient experience in ED
108,141 (1,293,140 YTD) people registered for an ED service in December, 92,539 of these were
new attendances.
ED Patient Experience Jan Feb Mar Apr May Jun Jul Aug Sep Oct Nov Dec
Avg no. of patients on trolleys for over 9 hours in ED waiting admission
(Target ≤ 70) 144 177 156 122 123 128 91 97 110 114 108 83
83 was the average daily number of patients in ED waiting for admission/discharge for over 9 hours
in December. The average daily number in November was 108. (Target ≤ 70)
% of people admitted or discharged within 9 hours from ED (Target 100%)
ED Patient Experience Jan Feb Mar Apr May Jun Jul Aug Sep Oct
Nov
Dec
Dec 2015 80.4% 79.3% 79.9% 81.7% 82.3% 82.4% 83.6% 82.4% 82.3% 82.2% 82.7% 83.0%
Dec 2014 77.8% 77.7% 78.3% 81.1% 81.5% 82.6% 81.7% 82.2% 82.8% 82.9% 81.6% 81.9%
YTD 2015 80.4% 79.3% 79.7% 80.2% 80.6% 81.1% 81.3% 81.5% 81.6% 81.7% 81.6% 81.7%
YTD 2014 77.8% 77.7% 77.8% 78.7% 79.6% 80.1% 80.5% 80.7% 81.0% 81.2% 81.2% 81.3%
Health Service Performance Report December 2015 6
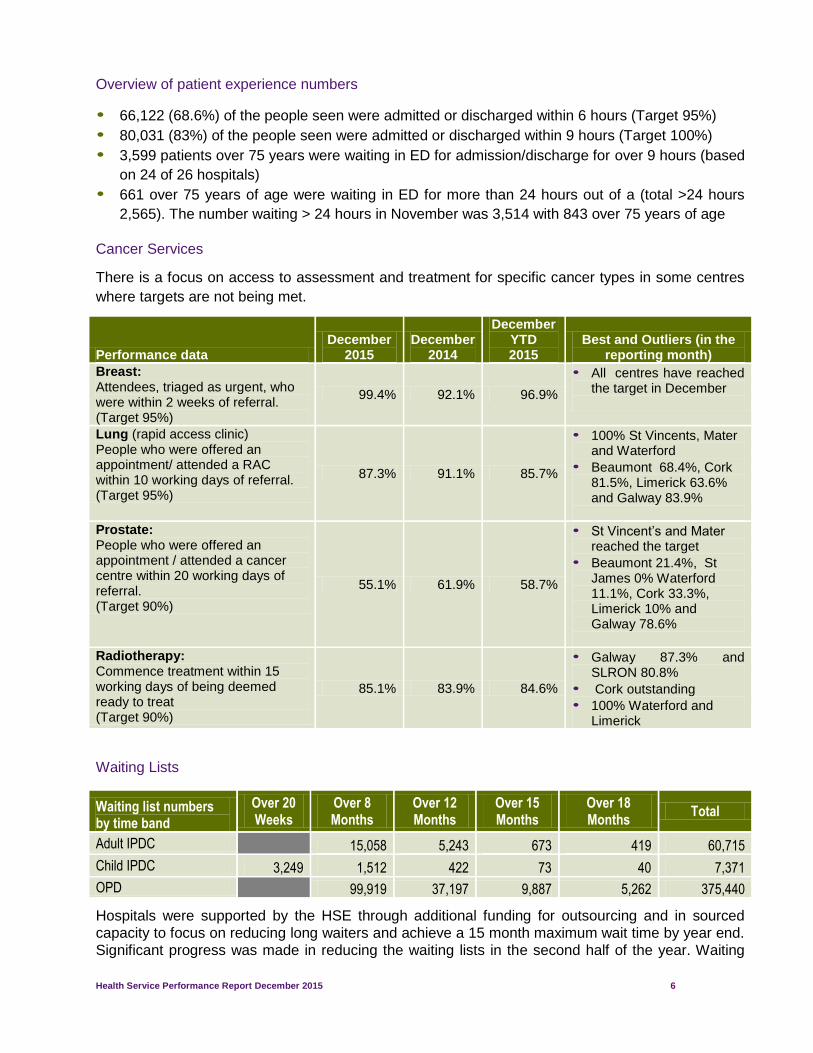
Overview of patient experience numbers
66,122 (68.6%) of the people seen were admitted or discharged within 6 hours (Target 95%)
80,031 (83%) of the people seen were admitted or discharged within 9 hours (Target 100%)
3,599 patients over 75 years were waiting in ED for admission/discharge for over 9 hours (based
on 24 of 26 hospitals)
661 over 75 years of age were waiting in ED for more than 24 hours out of a (total >24 hours
2,565). The number waiting > 24 hours in November was 3,514 with 843 over 75 years of age
Cancer Services
There is a focus on access to assessment and treatment for specific cancer types in some centres
where targets are not being met.
Performance data December
2015 December
2014
December YTD 2015
Best and Outliers (in the reporting month)
Breast: Attendees, triaged as urgent, who were within 2 weeks of referral. (Target 95%)
99.4% 92.1% 96.9%
• All centres have reached the target in December
Lung (rapid access clinic) People who were offered an appointment/ attended a RAC within 10 working days of referral. (Target 95%)
87.3% 91.1% 85.7%
• 100% St Vincents, Mater and Waterford
• Beaumont 68.4%, Cork 81.5%, Limerick 63.6% and Galway 83.9%
Prostate: People who were offered an appointment / attended a cancer centre within 20 working days of referral. (Target 90%)
55.1% 61.9% 58.7%
• St Vincent’s and Mater reached the target
• Beaumont 21.4%, St James 0% Waterford 11.1%, Cork 33.3%, Limerick 10% and Galway 78.6%
Radiotherapy: Commence treatment within 15 working days of being deemed ready to treat (Target 90%)
85.1% 83.9% 84.6%
• Galway 87.3% and SLRON 80.8%
• Cork outstanding
• 100% Waterford and Limerick
Waiting Lists
Waiting list numbers by time band
Over 20 Weeks
Over 8 Months
Over 12 Months
Over 15 Months
Over 18 Months
Total
Adult IPDC
15,058 5,243 673 419 60,715
Child IPDC 3,249 1,512 422 73 40 7,371
OPD
99,919 37,197 9,887 5,262 375,440
Hospitals were supported by the HSE through additional funding for outsourcing and in sourced
capacity to focus on reducing long waiters and achieve a 15 month maximum wait time by year end.
Significant progress was made in reducing the waiting lists in the second half of the year. Waiting

Health Service Performance Report December 2015 7
lists are being managed in order to ensure that those patients waiting the longest are scheduled
within the available capacity and having regard to the known capacity deficits.
Inpatient/Day Case Waiting Lists
Waiting list numbers for both inpatient/day case procedures and outpatient appointments have improved significantly. In summary, waiting lists have reduced as follows;
The total number of people waiting for an inpatient/day case procedure at the end of December
was 68,086, a reduction of 738 people waiting when the year to date December inpatient/day
case procedure waiting lists are compared with the respective waiting lists for November.
The number of people waiting over 18 months for an inpatient day case procedure was 459 at
the end of December, a reduction of 1,074 on the November waiting list numbers.
In terms of the number of people waiting over 15 months there was an overall reduction of 2,547
people waiting for inpatient/day case procedures. The total number of people waiting over 15
months at the end of December was 746.
Outpatient Appointments
Concerted efforts were made to reduce outpatient waiting lists by facilitating additional clinics outside conventional working hours and by outsourcing where the capacity is limited in particular hospital groups.
The total number of people waiting for outpatient appointments has fallen to 375,440 at the end
of December from 385,507 at the end of November, that is, a reduction of 10,067.
The number of people waiting over 18 months for an outpatient appointment was 5,262 at the
end of December, a reduction of 4,356 on the November waiting list numbers.
In terms of the number of people waiting over 15 months there was an overall reduction of
11,395 people waiting for an outpatient appointment. The total number of people waiting over 15
months at the end of December was 9,887.
Waiting List numbers by month, in time bands
Jan Feb Mar Apr May Jun July Aug Sept Oct Nov Dec
Adult Waiting list > 15 months (0 by Dec)
2,379 3,022 3,847 4,045 3,881 2,926 3,739 4,368 5,057 4,598 3,101 673
Of which Adult Waiting list > 18 months (0 by June)
832 1,105 1,557 1,848 1,603 77 607 1,317 2,107 1,993 1,431 419
Child Waiting list > 15 months (0 by Dec)
183 241 340 311 314 152 229 337 385 371 192 73
Of which Child Waiting list > 18 months (0 by June)
49 64 117 130 147 1 16 51 137 168 102 40
Outpatient Waiting list > 15 months (0 by Dec)
42,157 45,402 49,000 51,313 52,734 37,567 33,221 34,003 34,263 31,289 21,282 9,887
Of which Outpatient Waiting list > 18 months (0 by June)
24,847 27,001 30,092 33,252 33,496 15,542 10,162 11,235 13,176 13,353 9,618 5,262

Health Service Performance Report December 2015 8
GI Waiting List
Month 0 -1
Month
1 - 2
Months
2
Months
–13
Weeks
Total
under 13
weeks
13
Weeks –
3 Months
3-6
Months
6-12
Months
12+
Months
Total
Over 13
weeks
Overall
Total
May 4,303 2,750 1,860 8,913 56 2,972 3,000 828 6,856 15,769
June 3,789 2,836 1,966 8,591 86 3,258 2,909 1,081 7,334 15,925
July 3,887 2,473 1,906 8,266 73 3,390 3,095 1,162 7,720 15,986
August 3,779 2,639 1,934 8,352 52 3,443 3,154 1,310 7,959 16,311
Sept 4,197 2,723 1,919 8,839 125 3,233 3,215 1,427 8,000 16,839
Oct 4,244 2,813 1,814 8,871 72 3,333 3,166 1,449 8,020 16,891
Nov 4,188 3,125 1,942 9,255 60 3,030 3,242 451 6,783 16,038
Dec 3,689 3,311 2,084 9,084 48 3,094 3,531 204 6,877 15,961
There are 6,877 breaches of the target of 13 weeks in December. There is an increase of 94 in
December over the number of breaches in November. The overall numbers being referred for
routine colonoscopy are increasing and the proportion of those waiting over 12 months has
decreased from 8% in August to 1.3% in December. An Endoscopy Improvement Working Group
has been established to define and co-ordinate improvement actions across all hospitals.
Delayed Discharge and Emergency Task Force Initiatives
Delayed Discharges
The delayed discharge figure at the end of December was 509, down from the November figure of
558. The number of bed days lost through Delayed Discharge has reduced by 24.7% since January
– a gain of 5,432 bed days.
Jan Feb Mar Apr May Jun Jul Aug Sep Oct Nov Dec Target
Delayed Discharges 728 705 715 697 675 626 557 577 609 570 558 509 500
Delayed Discharge Initiative
As part of the Delayed Discharge Initiative an additional €25m was provided and the following
service improvements have taken place:
300 additional NHSS places are now operational
50 additional ring fenced short stay residential beds opened
In addition, 65 short stay beds have also opened up and are being used in Mount Carmel
An additional 400 Home Care Packages are being utilised by Hospitals to alleviate delayed
discharges.
The Community Intervention Teams service has been extended across the greater Dublin area
and to Louth, Meath and Kildare to support the Acute Hospitals.

Health Service Performance Report December 2015 9
Emergency Department Taskforce Initiative
As part of the Emergency Department Taskforce Initiative an additional €74m has been provided
and the following service improvements have taken place:
NHSS
300 additional NHSS places, (funded under the €10m provided in December 2014) are
operational and 713 of the additional 2015 planned 1,604 NHSS places are now operational
The number on the placement list waiting for NHSS approval has reduced to 358 (target 550 –
580).
The waiting time for approval is being maintained at no more than 4 weeks
Transitional beds
1,513 additional transitional care beds have been approved for people being discharged from
acute care.
4,183 people have availed of transitional care beds since April this is significantly above the
target of 500 placements.
Public & Private beds
149 additional public beds and 24 additional private contracted beds are operational
National Ambulance Service AS1 (112/999 emergency and urgent calls) and AS2 (urgent calls received from a general
practitioner or other medical sources) calls received were 24,952, up 4% (9,360) year to date.
ECHO calls (life-threatening cardiac or respiratory arrest) are up 19% (544) year to date. ECHO
incidents responded to within the target timeframe of 18 minutes and 59 seconds was 70%
(down 6% from last month).
DELTA (life threatening illness or injury, other than cardiac or respiratory arrest) activity is up
10% (8,205) year to date. DELTA incidents responded to within the target timeframe of minutes
and 59 seconds was 61% (down 1% last month).
Total of AS1 and AS2 (Emergency Ambulance) calls – including ECHO and DELTA
Feb-15 Mar-15 April-15 May-15 June-15 July-15 Aug-15 Sept-15 Oct 15
Nov - 15
North Leinster 7,794 8,366 7,660 8,302 7,807 7,801 7,859 7,826 7,943 7,896
Dublin Fire Brigade 5,624 6,234 5,929 6,413 6,241 6,273 6,292 6,449 6,583 6,270
South 5,215 5,531 5,290 5,665 5,550 5,203 5,705 5,453 5,746 5,388
West 4,931 5,494 5,194 5,441 5,397 5,376 5,595 5,315 5,572 5,398
National 23,564 25,625 24,073 25,821 24,995 24,653 25,451 25,043 25,844 24,952
NAS activity between January and November includes:
399 Emergency Aero Medical Service calls, 394 Irish Coast Guard calls, 103 Air Ambulance
calls

Health Service Performance Report December 2015 10
Transfers: 72 adult transplant patient transfers, 576 Neonatal Retrievals; 81 Paediatric
Retrievals; 96 Mobile Intensive Care; 77 transfers via the Children’s Ambulance Service.
Support for 134 Community First Responder Groups in 18 counties nationally( static with last
month) and 1,693 YTD CFR engagements
Patient transfer Calls and proportion dealt with by Intermediate Care Vehicles
Jan Feb March April May June July Aug Sept Oct Nov
Number of Patient
Transfer Calls 3,857 3,393 3,571 3,387 3,005 3,037 2,996 2,810 2,661 2,605 2,214
ICV 2,954 2,601 2,724 2,793 2,368 2,453 2,400 2,324 2,221 2,303 1,907
% ICV Transfer 77% 77% 76% 82% 79% 81% 80% 83% 83% 88% 86%
Community Healthcare
Health and Wellbeing Immunisations and Vaccines
September result shows the percentage of children aged 24 months who have received the
Measles, Mumps, Rubella (MMR) vaccine was 92.9%.
The percentage of children YTD aged 12 months who have received 3 doses Diphtheria (D3),
Pertussis (P3), Tetanus (T3) vaccine, Haemophilus influenzae type b (Hib3), Polio (Polio3)
hepatitis B (HepB3) (6 in 1) was 91.4% YTD.
87.5% of children aged 24 months received 3 doses Meningococcal C (MenC3) vaccine YTD,
(target 95%).
Child Health
December 2015 96.9% of newborn babies were visited by a PHN within 72 hours of hospital
discharge and 97.5% YTD, this is in line with target (97%).
November 2015 result: 94.1% (5,228 out of 5,556) of children reaching 10 months have
completed their child health developmental screening.
December 2015 54.8% of babies breastfed (exclusively and not exclusively) at first PHN visit
and 36.2% were breastfed (exclusively and not exclusively) at 3 month PHN visit in December.
Tobacco
In December 2015, 635 smokers received intensive cessation support from a cessation
counsellor, YTD 11,949 smokers have received support (Target YTD 9,000).
The number of frontline healthcare staff trained in brief intervention smoking cessation during
December is 94 and 1,279 YTD. (Target YTD 1,350).

Health Service Performance Report December 2015 11
The number of sales to minors, test purchases carried out year end to December was 540,
12.5% ahead of the year end target (480).
Screening
In December 9,312 women have had a mammogram screen as part of BreastCheck screening,
144,701 women have been screened during 2015, 3.4% above year end target. (Target Year
End 140,000).
12,859 women had a CervicalCheck screen in a primary care setting in December and 249,908
at year end. (Target Year End 271,000).
In December 14,922 invites were sent to clients to participate in BowelScreen. 223,487 clients
were invited during 2015. (Target Year End 200,000).
5,535 clients participated in Diabetic RetinaScreen during December and 76,248 have
participated at year end. (Target Year End 78,300).
Environmental Health
36,304 planned, and planned surveillance inspections of food businesses were carried out in
2015, 10% ahead of target.
The number of inspections of sunbed establishments was 36 in Q4 and 492 sunbed inspections
at year end, 23% ahead of target.
Primary Care
Medical Cards
As of 20th January there are 616 persons with a medical card application on hold where the date of
receipt of the application at the NMCU is > 3m and where the application is with the NMCU for
further processing.
Under 6 and over 70s GP Visit Cards
The under 6’s GP visit cards became available on 1st July 2015 and 227,941 cards have been
issued as at 20th January, 2016.
The over 70’s GP visit cards became available on 1st August 2015 and 51,118 cards have been
issued as at 20th January, 2016.
Community Intervention Teams
€2m additional funding to support Community Intervention Teams
The CIT service has been extended across the greater Dublin area and to Louth, Meath and Kildare
to support the Acute Hospitals. December activity was 2,142 bringing the YTD position to 19,675, an
increase in CIT activity of 34% compared with the same period last year. A new CIT service
commenced in Waterford on 14/12/15 and received 23 referrals in December.

Health Service Performance Report December 2015 12
Mental Health
CAMHs Waiting List by time bands 2015
Jan-
15
Feb-
15
Mar-
15
Apr-
15
May-
15
Jun-
15
Jul-
15
Aug-
15
Sep-
15
Oct-
15
Nov-
15
Dec-
15
Total no. to be seen 2,886 3,001 3,206 3,078 3,110 2,909 2,542 2,240 2,309 2,252 2,273 2,298
Total no. to be seen (0-3 months) 1,199 1,300 1,405 1,339 1,381 1,174 1,045 781 990 1,001 1,096 1,166
Wait List (i.e. those waiting >3 months) 1,687 1,701 1,801 1,739 1,729 1,735 1,497 1,459 1,319 1,251 1,177 1,132
No. on waiting list for first appointment at end of each month by wait time
No on CAMHS waiting list
(3-6 months) 535 610 648 661 693 781 679 641 550 464 412 387
No on CAMHS waiting list
(6-9 months) 377 342 375 377 434 404 354 356 345 374 363 321
No on CAMHS waiting list
(9-12 months) 346 311 299 242 219 174 164 221 210 191 195 243
No on CAMHS waiting list
(> 12 months) (Zero Tolerance) 429 438 479 459 383 376 300 241 214 222 207 181
The numbers waiting over 12 months dropped this month to the lowest level in 2015. There are 181
individuals waiting over 12 months in December 2015 compared to 459 in April 2015, when a Wait
list initiative began, resulting in a reduction of 60.5%.
Admission of Children to Child Adolescent Acute Inpatient Units (CAMHs)
Between January and December 2015, 356 young people received acute inpatient mental health
care. Of these 261 were admitted to child and adolescent mental health units directly and 95
(26.7%) were initially admitted to an adult unit. Of the 95, nine (9.5%) were aged 16 or younger.
Between January and December 2014, 290 young people received acute inpatient mental health
care. Of these 201 were admitted to child and adolescent mental health units directly and 89
(30.7%) were initially admitted to an adult unit. Of the 89, ten (10.1%) were aged 16 or younger.
In 2008, 25% of children who received acute inpatient mental health care were admitted to Child &
Adolescent Acute Inpatient Units, by December 2015, 73.4% of children who were admitted were
admitted to Child & Adolescent Acute Inpatient Units.
Mental Health Services: 2015 Operational Plan Targets
Performance Area
Outturn 2014.
2015 Target / EA
2015 Target / EA.
Aug-15
Sept-15
Oct-15
Nov-15
Dec-15
Year to date 2015
% var YTD v Tgt / EA
YTD
Same period last year 2014.
% var YTD
2015 v YTD 2014
No. of child / adolescent admissions to HSE child and adolescent mental health inpatient units
Total National 201 231 231 25 24 25 22 20 261 13.0% 201 29.9%
No. of children / adolescents admitted to adult HSE mental health inpatient units
Total National 89 30 30 10 5 10 6 5 95 >100% 89 7.1%
i). <16 years National 9 0 0 2 1 2 1 1 9 >100% 9 0%
ii). <17 years National 27 0 0 1 2 1 2 1 33 >100% 27 28%
iii). <18 years National 53 30 25 7 2 7 3 3 53 100% 53 -2%

Health Service Performance Report December 2015 13
Of the 95 children admitted to Adult Approved Centres up to December, 88 or 90.5% were 16/17
years old with 41.1% (39) of these discharged either the same day or within 3 days and 65.3% (62)
within a week.
All admissions of young people under the age of 18 years are notified to the Mental Health
Commission in accordance with regulations. All such admissions are also notified to a CAMHS
Service Improvement lead within the Mental Health division. The CAMHS Service Improvement
Lead works closely with local CAMHS in-patient services to ensure that the clinical needs of the
young person are assessed and addressed within the most appropriate setting for that young
person and their family.
Mental Health Services - Adult and Older Persons
The General Adult Community Mental Health Teams are exceeding the 90% target for the year to
date (92.6%) in offering a first appointment within 12 weeks.
73.6% of accepted referrals to the General Adult Community Mental Health Teams in December
were offered a first appointment and seen within 12 weeks which is below the 75% target. A
contributory factor in December is a significant ‘did not attend’ (DNA) rate of 21%.
In December, 95.8% of the Psychiatry of Old Age teams nationally offered a first appointment within
12 weeks with a YTD position at 97.9%.
In December, 94.2% of accepted referrals to Psychiatry of Old Age Teams nationally were seen with
12 weeks against a 95% target with a YTD position at 95.4%.
Child and Adolescent Mental Health
77.9% of referrals accepted by CAMHs Teams were offered a first appointment within 12 weeks in
December which is slightly below the targeted performance of 78%. Year to date is 76.4% which
could be attributed to the focus on reducing the Waiting List
In December 2015, 62.8% of referrals nationally were offered a first appointment and seen within 12
weeks with YTD performance of 67%. This is behind the target of 72%. The national ‘did not attend’
(DNA) rate was 22% in December.
In December, CAMHs Teams continued to implement the waiting list initiative with resources
focussed on addressing the waiting lists over 12 months.
In December, there were 1,132 children and adolescents waiting for a first appointment for longer than three months, of which 181 children or adolescents were waiting more than 12 months representing an decrease of 26 or 12.6% compared to November 2015. In 2008, 25% of children who received acute inpatient mental health care were admitted to Child &
Adolescent Acute Inpatient Units, by December 2015, 73.4% of children who were admitted were
admitted to Child & Adolescent Acute Inpatient Units.

Health Service Performance Report December 2015 14
Social Care
Disability Services
RT Training
The number of rehabilitative training places is exactly on target YTD at 2,583. There were 2,847
people with a disability in receipt of Rehabilitative Training in December 2015 (0.8% below target).
The slightly below target number of people in training reflects the fact that larger numbers of new
entrants are availing of a full time placement, with fewer ‘part-time’ placements.
School Leavers
98% of school leavers and RT graduates have received a placement which meets their needs (2%
below target). All people that requested a service in 2015 have been offered a service. However,
there are outstanding issues in CHO 9 where some people are getting an interim service and they
are not happy with the permanent service that is on offer. As a result of this, the % of School
Leavers and RT Graduates who have received a placement that meets their needs is currently 98%
for 2015.
Disability Act Compliance
Children’s disability services continue to struggle to complete Assessments of Need in line with
timelines outlined in the Disability Act 2005. 31.2% of assessments YTD were completed within the
timelines, -68.8% below target. There has been a decrease of 9.8%, between Q3 and Q4, however
it is important to note that the demand for assessments has increased by 18.5%, 910 additional
requests, over the last twelve months.
Since a High Court ruling of December 2009, the effect of which was to open eligibility to all children
born after 1st June 2002, the number of children over five years of age, and therefore of school-
going age, has risen steadily as a percentage of all applications received. At the 4th quarter
applications from persons aged 5 and over stood at 44.4% of total applications received.
Congregated Settings
Throughout 2015 all CHO Areas have been working towards their target, as part of the national end
of year target of 150 people to transition from congregated to community settings. A total of 137
people have transitioned from congregated to community settings year to date which is -8.6% below
target. The target of 150 was not fully met due to blockages and delays that arose throughout the
year in relation to changing need, HIQA compliance and registration and accessing suitable
appropriate accommodation. It is envisaged that the remaining 13 individuals will complete their
transition in 2016.
Older Persons
Home Care Services for Elderly Persons
47,891 People were in receipt of Home Help Services at the end of December 2015 (under
expected level of activity by 2,109) in line with 2014 level.
The number of persons in receipt of Home Help at a point in time is dependent on assessed
need of individual clients. If small numbers require high levels of service then the number in

Health Service Performance Report December 2015 15
receipt will be low and vice versa. Accordingly this is an expected level of activity indicator rather
than a target.
10,456,801 home help hours have been provided YTD, 1.5% above the expected service level
of activity (expected activity YTD 10,300,000).Projected outturn 10.437m hours has been
provided for in 2016 NSP. The Home Help Service will require careful management in 2016 as
the challenge will be to maintain this level of support and activity to growing numbers of
dependent people many of who require services outside of the core times at an increased cost
to the service.
Home Care Package (HCP)
15,274 people were in receipt of a Home Care Package at the end of December 2015 (expected
activity 13,200) (expected activity 13,800 including Delayed Discharges Initiative HCPs).
Intensive Home Care Package (IHCP)
In addition, 195 intensive home care packages were provided in December 2015 facilitating
patients with very high level of dependency/complex needs to return home after an acute
episode of care. In the absence of these IHCPs these patients would have remained in hospital
as a delayed discharge or had to go to long term nursing home care.
Home help (HH) and home care package (HCP) services have responded in a flexible manner
throughout 2015 to meet the immediate needs of priority cases within the growing older
population and in a way that supports hospital discharges as a priority. 15,274 people were in
receipt of a HCP at the end of December 2015, 15.7% above target for the year. In addition, 195
Intensive Home Care Packages were provided in 2015 to assist patients with very high levels of
complexity/dependency to return home rather than remain in acute hospitals as delayed
discharges or move to long term care. 10.4 million HH hours were provided in 2015 (1.5% above
target) reflective of the increased demand for the service.
Skill Mix – Reduction in direct care cost per bed
Ongoing discussions are taking place with unions with regard to reducing the direct care cost
per bed in residential care services. No agreement has been reached however it is anticipated
that a consensus on skill mix will be finalised in early 2016.
Elder Abuse
In December 100% of active Elder Abuse cases were reviewed within six months, which is
above the target of 90%.
Health Service Performance Report December 2015 16
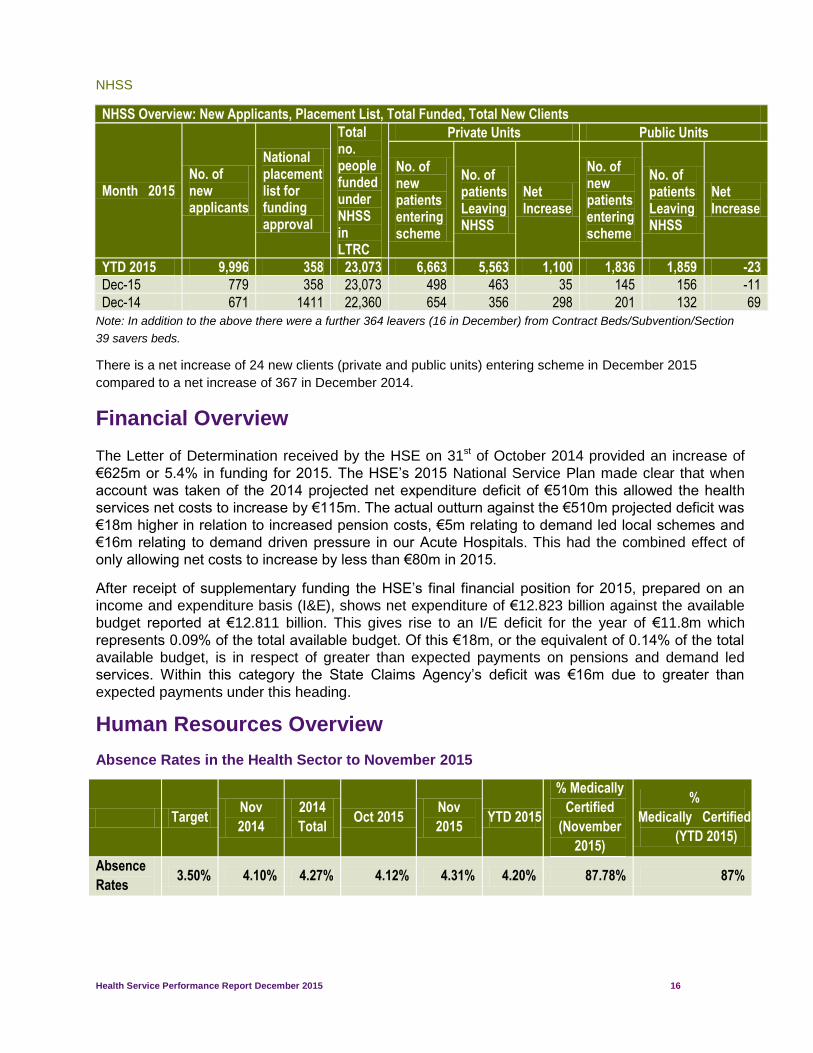
NHSS
NHSS Overview: New Applicants, Placement List, Total Funded, Total New Clients
Month 2015 No. of new applicants
National placement list for funding approval
Total no. people funded under NHSS in LTRC
Private Units Public Units
No. of new patients entering scheme
No. of patients Leaving NHSS
Net Increase
No. of new patients entering scheme
No. of patients Leaving NHSS
Net Increase
YTD 2015 9,996 358 23,073 6,663 5,563 1,100 1,836 1,859 -23
Dec-15 779 358 23,073 498 463 35 145 156 -11
Dec-14 671 1411 22,360 654 356 298 201 132 69
Note: In addition to the above there were a further 364 leavers (16 in December) from Contract Beds/Subvention/Section
39 savers beds.
There is a net increase of 24 new clients (private and public units) entering scheme in December 2015
compared to a net increase of 367 in December 2014.
Financial Overview
The Letter of Determination received by the HSE on 31st of October 2014 provided an increase of
€625m or 5.4% in funding for 2015. The HSE’s 2015 National Service Plan made clear that when
account was taken of the 2014 projected net expenditure deficit of €510m this allowed the health
services net costs to increase by €115m. The actual outturn against the €510m projected deficit was
€18m higher in relation to increased pension costs, €5m relating to demand led local schemes and
€16m relating to demand driven pressure in our Acute Hospitals. This had the combined effect of
only allowing net costs to increase by less than €80m in 2015.
After receipt of supplementary funding the HSE’s final financial position for 2015, prepared on an
income and expenditure basis (I&E), shows net expenditure of €12.823 billion against the available
budget reported at €12.811 billion. This gives rise to an I/E deficit for the year of €11.8m which
represents 0.09% of the total available budget. Of this €18m, or the equivalent of 0.14% of the total
available budget, is in respect of greater than expected payments on pensions and demand led
services. Within this category the State Claims Agency’s deficit was €16m due to greater than
expected payments under this heading.
Human Resources Overview
Absence Rates in the Health Sector to November 2015
Target Nov
2014
2014
Total Oct 2015
Nov
2015 YTD 2015
% Medically
Certified
(November
2015)
%
Medically Certified
(YTD 2015)
Absence
Rates 3.50% 4.10% 4.27% 4.12% 4.31% 4.20% 87.78% 87%

Health Service Performance Report December 2015 17
Latest monthly figures (November 2015)
The November rate at 4.31% is up on the October rate and is the second lowest November
rate. Previous November rates were 5.37% (2008), 5.45% (2009), 4.61% (2010), 5.01% (2011),
4.66% (2012), 4.55% (2013) and 4.10% (2014).
Annual Rate for 2015 and Trend Analysis from 2008
Absence rates have been collected centrally since 2008 and in overall terms, there has been a
general downward trend seen over that time.
November 2015 absence rate stands at 4.31% marginally up from a rate of 4.10% for November
2014.
The 2015 YTD rate is 4.20%, and puts the Health Services generally in‐ line with the rates
reported by ISME for large organisations in the private sector and available information for other
large public sector organisations both in Ireland and internationally. Latest NHS England
absence rates for year to July 2015 recorded an overall rate of 4.25%. Scotland’s NHS absence
rate for similar period was 5.04% while in Wales the rate recorded was 5.0%
Annual rates; 2008 – 5.76%, 2009 – 5.05%, 2010 – 4.70%, 2011 – 4.90%, 2012 – 4.79%, 2013
– 4.73%, 2014 – 4.37% and YTD 2015 – 4.20%
The notional/opportunity cost of absenteeism for the health services for 2014, using DPER
methodology, was assessed as being of the order of €150 million.
European Working Time Directive
Compliance with a maximum 48 hour week is at 77% as of end December, unchanged since
November 2015.
Compliance with a maximum 24 hour shift (not an EWTD target) is at 96% - up 2% since
November. This represents a return to standard figures and likely reflects inclusion of amended
St Vincent’s data.

Health Service Performance Report December 2015 18
Quality & Safety

Health Service Performance Report December 2015 19
Quality & Safety Quality Assurance and Verification
Some key developments across the Division during December 2015 include:
Serious Reportable Events
Progress on reporting and investigation of SREs continues to be monitored on a monthly basis. The
total number of SREs recorded for the period March 2014 to December 2015 was 288.
Division Total Sept
2015
Total Oct
2015
Total Nov 2015 Additions
Dec 2015
Total
Acute Hospitals 174 191 197 9 206
Mental Health 28 30 34 3 37
Social Care 30 35 38 5 43
Other 1 1 1 1 2
Health and Wellbeing 0 0 0 0 0
Total 233 257 270 18 288
Guidelines for Systems Analysis Investigation of Incidents
A revision of the HSE’s approach to Systems Analysis Investigation of Incidents (2012) was
completed and a revised manual for investigation of incidents has been developed. The HSE
Guidelines for conducting Look-back Reviews were also updated during December 2015.
Safety Incident Management
The National Incident Management and Learning Team continue to deliver training in Safety
Incident Management and System Analysis Investigations. During December 2015, 37 staff
received training in System Analysis Investigation and a total of 296 staff received Incident
Management Training during 2015.
Complaints
Complaints Management Module
The Complaints Management Module of the National Incident Management System (NIMS)
provides a comprehensive database on all issues relating to the recording and investigation of
complaints. In December 2015 the early adopters of the module continue to be assessed and it is
planned to roll out the module nationally in 2016.
Your Service Your Say
The National Steering Group tasked with the revision of HSE policy and procedures for Complaints
Management ‘Your Service Your Say’ was established during December 2015.
Confidential Recipient Service
A client satisfaction survey on the Confidential Recipient Service was carried out. The purpose of
this survey will be to give service users an opportunity to express their views on how they found the

Health Service Performance Report December 2015 20
service, while also identifying areas that are working well or that could be improved within the
service. All service users were sent out a questionnaire in December and were given a deadline of
mid-December to return their questionnaires. The survey report resulting from this questionnaire will
be completed Q1 2016.
Appeals Service
The Appeals Service provides an internal, independent and impartial review of decisions taken by
personnel of the HSE relating to applications by members of the public for specified services and
entitlements, where applicants are dissatisfied with the outcome of their application.
During 2015 a total of 3,362 notifications of appeal were received by the Appeals Service. 3,839
appeals were processed during this time period (these include appeals carried forward from 2014)
leaving a current balance of 258 open appeals.
Appeal Type Received Processed
Medical / GP Card (General Scheme) 2,438 2,681
Medical / GP Visit Card (Over 70s scheme) 203 403
Nursing Home Support Scheme 369 384
CSAR 48 47
Home Care Package 140 137
Home Help 33 47
Other 131 140
Total 3,362 3,839
Medical Cards (General Scheme and over 70s) made up the majority of Notifications of Appeal
received by the Appeals Service, with 79% of appeals relating to medical card eligibility. The next
largest group of appeals relate to statutory NHSS appeals which make up nearly 11% of all appeals
received.
Health Care Audit
The Healthcare Audit team continued the programme of audit for 2015, with 51 audits completed
during 2015. Audits have been undertaken in Acute Hospitals, Clinical Programmes, Social Care
and the National Ambulance Service. A further 25 audits are in progress.
A review of the implementation of recommendations of audits completed in the period June 2014 to
July 2015 was completed during December 2015.

Health Service Performance Report December 2015 21
Accountability Framework

Health Service Performance Report December 2015 22
In implementing the HSE’s Accountability Framework 2015 the National Performance Oversight
Group seeks assurance, on behalf of the Director General, that the National Directors of the
Divisions are delivering against priorities and targets set out in the Service Plan and in the
Performance Agreements 2015.
The performance indicators against which Divisional performance is monitored are set out in the
Balance Score Cards grouped under Access, Quality, Finance and People. The key performance
indicators are also included in the individual Performance Agreements between the Director General
and the National Director.
Performance against the Balanced Scorecards is reported in the monthly published Performance
Report. Where the data indicates underperformance in service delivery against targets and planned
levels of activity, the National Performance Oversight Group explores this with the relevant National
Director at the monthly performance meeting and seeks explanations and remedial actions where
appropriate to resolve the issue.
As part of the Accountability Framework an Escalation and Intervention process has been
developed and implemented. In the context of the Escalation Framework underperformance
includes performance that:
Places patients or service users at risk
Fails to meet the required standards for that service
Departs from what is considered normal practice
The Escalation and Intervention Framework sets clear thresholds for intervention for a number of
priority Key Performance Indicators and a rules-based process for escalation at a number of
different levels. Two of these levels are discussed in this report:
Level 4 (Black) is at Director General level.
Level 3 (Red) is at National Performance Oversight Group level
Level 3 (Red-Amber) indicates performance improvement from Red Escalation
During the month of November a number of service issues have been escalated or remain in
escalation. The actions taken and the progress made has also been set out in the attached table
below at a summary level.

Health Service Performance Report December 2015 23
Areas of Black Escalation (Director General) Escalation & Intervention Framework 2015
Key Performance
Indicators
Division Balanced Scorecard
Escalation
Threshold/
Tolerance
Reason for
BLACK
Escalation
Actions to address and mitigate
underperformance PR December Results/ Trend
Serious Reportable Events (SRE)
Acute Hospitals
Quality & Safety
Not
provided to
the NPOG
within Q1
Escalated
based on the
need to
supply a ‘No
Event
Declaration’
The National Director
Acute Hospitals will
revert to the NPOG with
a definitive set of
actions at HG level for
improving the reporting
of SREs. These
actions are to include
(1) processes to be put
in place at HG level and
(2) wider
communication to the
hospital system.
The National Director
QAV indicated he would
consider de-escalating
to Red on the basis of
new and concrete
actions being identified
and implemented.
An audit by the QAV
Division of the SRE
process within hospitals
has commenced.
The results of the
review of SREs in
Bantry hospital is to be
provided to the NPOG.

Health Service Performance Report December 2015 24
Key Performance
Indicators
Division Balanced Scorecard
Escalation
Threshold/
Tolerance
Reason for
BLACK
Escalation
Actions to address and mitigate
underperformance PR December Results/ Trend
Patients waiting in ED for > 24 hours
Acute Hospitals
Quality & Safety
0 Escalated based on continued poor performance during the month of December 2,565 patients waited > 24 hours in ED during December and 661 (25.8%) were aged over 75 years.
Clear differentiated actions are being identified for those ED sites showing improvement versus those showing deterioration in performance.
NPOG and National Director to review the threshold for escalation purposes if there is a plan with a clear trajectory for improvement that is demonstrated over an agreed timeframe.
3,668 3,499 3,514
2,565
869 925 843 661
0
500
1,000
1,500
2,000
2,500
3,000
3,500
4,000
Sept Oct Nov Dec
Patients in ED for > 24 hours
Total >75 years

Health Service Performance Report December 2015 25
Key Performance
Indicators
Division Balanced Scorecard
Escalation
Threshold/
Tolerance
Reason for
BLACK
Escalation
Actions to address and mitigate
underperformance PR December Results/ Trend
% of people waiting < 13 weeks for a routine colonoscopy/ OGD.
Acute Hospitals
Access
80% of
patients
received
their
procedure
within 13
weeks
Escalated
based on
continued
poor
performance
in relation to
performance
threshold.
In December there were 15,961 patients on the GI waiting list and 6,877 (43.9%) were waiting in excess of 13 weeks, a slight increase over November.
Demand-Capacity
Analysis to be
completed by the end of
February to include a
specific focus on
Beaumont, Naas and
other underperforming
hospitals.
The National Director
Acute Hospitals to
determine what
additional activity the
NTPF will undertake in
2016 to reduce waiting
times for those waiting
> 13 weeks.
16,311 16,839 16,891 16,038 15,961
7,959 8,000 8,020 6,783 6,877
0
5,000
10,000
15,000
20,000
Aug Sept Oct Nov Dec
Routine GI Waiting List
Total Waiting List >13 weeks

Health Service Performance Report December 2015 26
Key Performance
Indicators
Division Balanced Scorecard
Escalation
Threshold/
Tolerance
Reason for
BLACK
Escalation
Actions to address and mitigate
underperformance PR December Results/ Trend
Service Level Arrangements 2015
Social Care and Mental Health
Access Quality & Safety Finance HR
Escalated on
the basis of
continued
poor
performance
There is ongoing
engagement with S38
Agencies in relation to
the completion of
Service Arrangements.
Social Care completion
rates have improved
from 57% in November
to 79% in December.
Mental Health
completion rates have
improved from 65% in
November to 75% in
December.
79.0%
75.0%
82.6%
70.0%
75.0%
80.0%
85.0%
Social Care Mental Health
National
Completion - Service Arrangements (As at 26th Jan 2016)
Funding completed

Health Service Performance Report December 2015 27
Key Performance
Indicators
Division Balanced Scorecard
Escalation
Threshold/
Tolerance
Reason for
BLACK
Escalation
Actions to address and mitigate
underperformance PR December Results/ Trend
Prostate Cancer - patients to be seen within 20 working days
Acute Hospitals
Access
If the
hospital or
HG falls
below <80%
for 3
consecutive
months or
has missing
data for 2
consecutive
months
Escalated
due to
continued
poor
performance.
Cork,
Waterford,
Limerick , St.
James’s and
Beaumont
have
performed
below the
80%
threshold for
3 months
Waterford Regional: Two
new urology surgeons will
be assisting with the Rapid
Access Clinics for Prostate
Cancer in Waterford from
early 2016 with a Prostate
Clinic starting the week
beginning 8th February
2016.
St. James’s: As an
immediate solution, St.
James’s Hospital is
outsourcing a number of
patients to the private
sector and has tendered to
two hospitals as an interim
arrangement. The National
Director NCCP will continue
to work with the HG CEO to
put in place a longer term
solution for this service.
Beaumont: The hospital
has recently interviewed for
a consultant urologist
59.5%
53.8% 55.1%
0%
8.3%
33.3%
21.1%
12.5% 11%
4.5%
16.7%
10%
40.0%
24.1% 21.4%
0%
10%
20%
30%
40%
50%
60%
70%
Oct Nov Dec
National CUH WRH UL James's Beaumont

Health Service Performance Report December 2015 28
Areas of Red Escalation (National Performance Oversight Group)
Key Performance
Indicators
Division Balanced Scorecard
Escalation
Threshold/
Tolerance
Reason for
RED
Escalation
Actions to address and mitigate
underperformance
PR December Results/ Trend
Projected net expenditure to year end
Acute
Hospital
Finance Breakeven
to 0.75%
deficit
De-escalated
from Black to
Red
escalation
during
December as
a result of
significant
reduction in
year end
deficit due to
the application
of
supplementary
funding
Year to date
deficit
€12.58m.
Differentiated engagement
continues including
restrictions on recruitment.
The Director General
issued an instruction to
National Directors
requesting that they seek
formal written assurance
from each Chief Officer/
HG CEO, that the
community services/
hospitals under their remit
relevant to each Division,
have in place from 1st
February 2016 the interim
control arrangements in
relation to pay bill staffing
and control for 2016.
.
€122.4 €137.3
€153.9 €172.5
€12.6
€0.0
€50.0
€100.0
€150.0
€200.0
Aug Sept Oct Nov Dec
Year to date deficit, Acute Hospitals
€'000

Health Service Performance Report December 2015 29
Key Performance
Indicators
Division Balanced Scorecard
Escalation
Threshold/
Tolerance
Reason for
RED
Escalation
Actions to address and mitigate
underperformance
PR December Results/ Trend
Projected net expenditure to year end
Social Care
Finance Breakeven
to 0.75%
deficit
De-escalated
from Black to
Red
escalation
during
December as
a result of
significant
reduction in
year end
deficit due to
the application
of
supplementary
funding
Year to date
deficit €3.86m
The Director General has
issued a directive to
National Directors
requesting that they seek
formal written assurance
from each Chief Officer/
HG CEO, that the
community services/
hospitals under their remit
relevant to each Division,
have in place from 1st
February 2016 the interim
control arrangements in
relation to pay bill staffing
and control for 2016.
Urgent
colonoscopy -
% of people
waiting < 4
weeks
Acute
Hospitals
Access
0
During
December
there were no
breaches of
the target
however
remains in
escalation due
to a number of
breaches
during
January and 9
prospective
breaches for
Based on continuing
breaches for urgent
colonoscopies the
National Directors for
Acute Hospital will
issue a written
instruction to HG CEOs
reminding that this is a
‘zero tolerance’ target
which needs to be
reinforced with each
hospital in their group.
€29.20
€61.20 €75.98
€94.64
€3.86 €0.00
€20.00
€40.00
€60.00
€80.00
€100.00
Aug Sep Oct Nov Dec
Year to date deficit, Social Care
€'000
47
9
1 0 0 1 1 0 2
0 0
5
10
15
20
25
30
35
40
45
50

Health Service Performance Report December 2015 30
Key Performance
Indicators
Division Balanced Scorecard
Escalation
Threshold/
Tolerance
Reason for
RED
Escalation
Actions to address and mitigate
underperformance
PR December Results/ Trend
week
beginning 1st
February 2016
Lung Service -
patients to be
seen within 10
working days
Acute
Hospitals
Access
Hospital or
HG <80%
for 3
consecutive
months or
missing data
for 2
consecutive
months
Escalated
based on
continued
poor
performance
for Limerick
University
Hospital (64%)
which is below
the 80%
threshold
Limerick Hospital is
working with the HG
CEO to distinguish
between lung cancer
and other respiratory
referrals and this will
have an impact on the
data
NCCP to meet with
Beaumont on this issue
who showed a dip in
performance during
December compared to
previous months.
National Director
NCCP to set out clear
actions taken and to be
taken to improve
performance across
underperforming sites.
85% 85% 86% 85%
96%
64%
79.5% 81.5%
43%
32%
51%
64%
0%
20%
40%
60%
80%
100%
120%
Sept Oct Nov Dec
National CUH UL

Health Service Performance Report December 2015 31
Key Performance
Indicators
Division Balanced Scorecard
Escalation
Threshold/
Tolerance
Reason for
RED
Escalation
Actions to address and mitigate
underperformance
PR December Results/ Trend
Number of
discharges
delayed by
more than 90
days
Acute
Hospitals
& Social
Care
Access
No delayed discharges > 90 days
During
December
there were
126 breaches
over 90 days,
an
improvement
in
performance
over the
previous
month when
142 were
delayed by
over 90 days.
The total number of delayed discharges continues to fall and is now at 509 for December.
A cross divisional group, established to examine this issue has met and will continue to meet. Some patients have been successfully discharged as a result.
An exercise is underway to determine the total volume and total cost required to address this issue in full.
European
Working Time
Directive
Acute
Hospitals
Human
Resources
100% of
NCHDs
have a
working
week of 48
hours or
less
Compliance
remains low at
76% which is
below the
European
standards
The Acute Hospital Division has worked with National HR and Hospital Groups to develop a comprehensive framework plan to achieve compliance. The plan is now in the final stages of development and will be submitted to the Department of Health once finalised.
The National EWTD Verification and Implementation Group met during January to
577 609 570 558
509
132 131 167 142 126
0
100
200
300
400
500
600
700
Aug Sept Oct Nov Dec
Total Delayed Discharges > 90 Days
74% 79% 77%
0
73% 76% 76%
0%
25%
50%
75%
100%
Sept Oct Nov Dec
National Acute Hospitals

Health Service Performance Report December 2015 32
Key Performance
Indicators
Division Balanced Scorecard
Escalation
Threshold/
Tolerance
Reason for
RED
Escalation
Actions to address and mitigate
underperformance
PR December Results/ Trend
progress this issue and continue to refine assessment in relation to the resource gap.
Bi-monthly meetings continue to take place with the IMO
Verification visits to hospitals continue.
Properly completed Medical and GP Visit Cards not processed > 3 months
Primary
Care
Access/
Quality
>3 months Escalated
based on
continued
poor
performance
616 main over
the 3 month
threshold
down from
1,111 in
October
Continued progress is being made to clear the backlog of applications and it is expected that all applications will be cleared by the end of Q1 2016.
948 908
1,167 1,111
686 616
0
400
800
1200
1600
July Aug Sept Oct Nov Dec
> 3 months

Health Service Performance Report December 2015 33
Key Performance
Indicators
Division Balanced Scorecard
Escalation
Threshold/
Tolerance
Reason for
RED
Escalation
Actions to address and mitigate
underperformance
PR December Results/ Trend
Disability Act Compliance: % of assessments comppleted within the timelines as provided for in the regulations
Social
Care
Access/
Quality
Escalated
based on
continued
poor
performance.
Four CHOs
show a
significant
drop in
performance
over the year.
Expert National Group to be established and implementation plan to be developed.
39%
31% 33%
23% 20%
30%
40%
50%
Q1 Q2 Q3 Q4
Compliance
Health Service Performance Report December 2015 34
Areas of Red-Amber Status (National Performance Oversight Group)
Key Performance
Indicators
Division Balanced Scorecard
Escalation
Threshold/
Tolerance
Reason for
RED
Escalation
Actions to address and mitigate
underperformance
PR December Results/ Trend
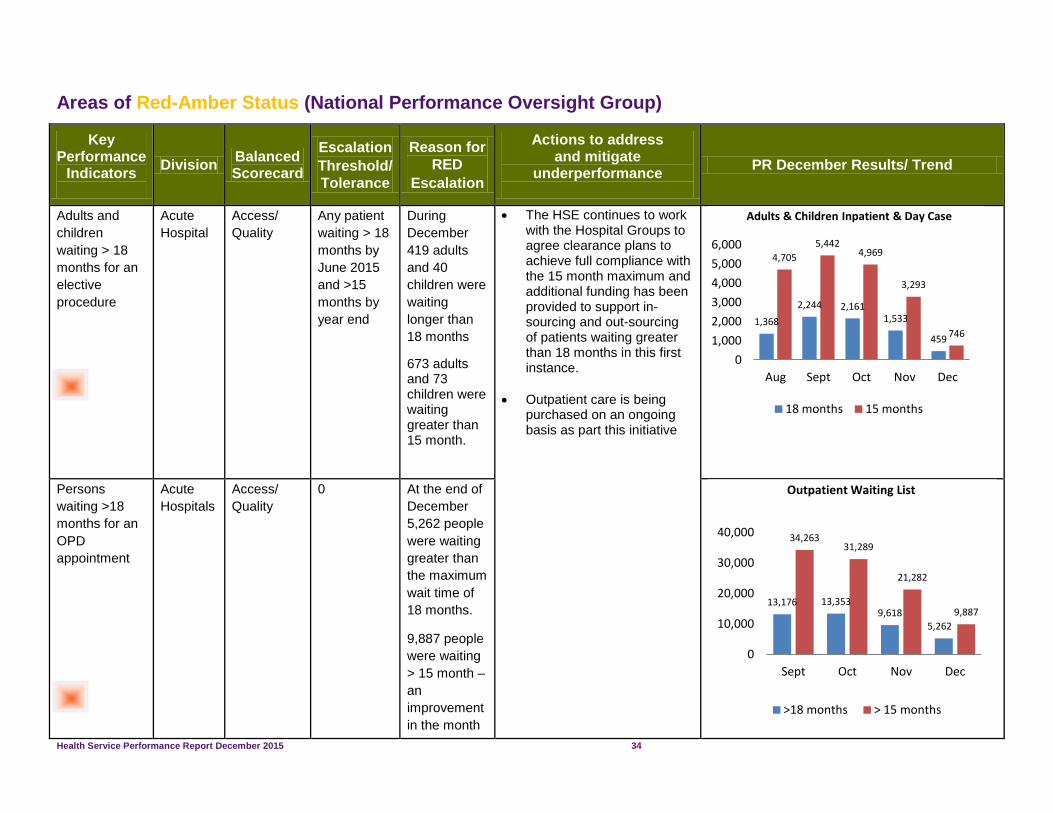
Adults and
children
waiting > 18
months for an
elective
procedure
Acute
Hospital
Access/
Quality
Any patient
waiting > 18
months by
June 2015
and >15
months by
year end
During
December
419 adults
and 40
children were
waiting
longer than
18 months
673 adults and 73 children were waiting greater than 15 month.
The HSE continues to work with the Hospital Groups to agree clearance plans to achieve full compliance with the 15 month maximum and additional funding has been provided to support in-sourcing and out-sourcing of patients waiting greater than 18 months in this first instance.
Outpatient care is being purchased on an ongoing basis as part this initiative
Persons
waiting >18
months for an
OPD
appointment
Acute
Hospitals
Access/
Quality
0
At the end of
December
5,262 people
were waiting
greater than
the maximum
wait time of
18 months.
9,887 people
were waiting
> 15 month –
an
improvement
in the month
1,368
2,244 2,161 1,533
459
4,705
5,442 4,969
3,293
746
0
1,000
2,000
3,000
4,000
5,000
6,000
Aug Sept Oct Nov Dec
Adults & Children Inpatient & Day Case
18 months 15 months
13,176 13,353 9,618
5,262
34,263 31,289
21,282
9,887
0
10,000
20,000
30,000
40,000
Sept Oct Nov Dec
Outpatient Waiting List
>18 months > 15 months

Health Service Performance Report December 2015 35
Key Performance
Indicators
Division Balanced Scorecard
Escalation
Threshold/
Tolerance
Reason for
RED
Escalation
Actions to address and mitigate
underperformance
PR December Results/ Trend
of over
11,395
waiting > 15
months

Health Service Performance Report December 2015 36
Performance Overview by Service Provider
Performance RAG Rating Red > 10% of target
Amber > 5% ≤ 10% of target
Green ≤ 5% of target
Grey No result expected
Finance RAG Rating Red 0.5% > of target
Amber ≥ 0.25% <0.5% of target
Green < 0.25% of target
HR – Absence Red ≥ 4.73%
Amber ≥ 4.02% < 4.73%
Green < 4.02%
HR – Indicative workforce Red ≥ 1.5% of target
Amber ≥ 0.5% < 1.5% of target
Green < 0.5% of target
Health Service Performance Report December 2015 37
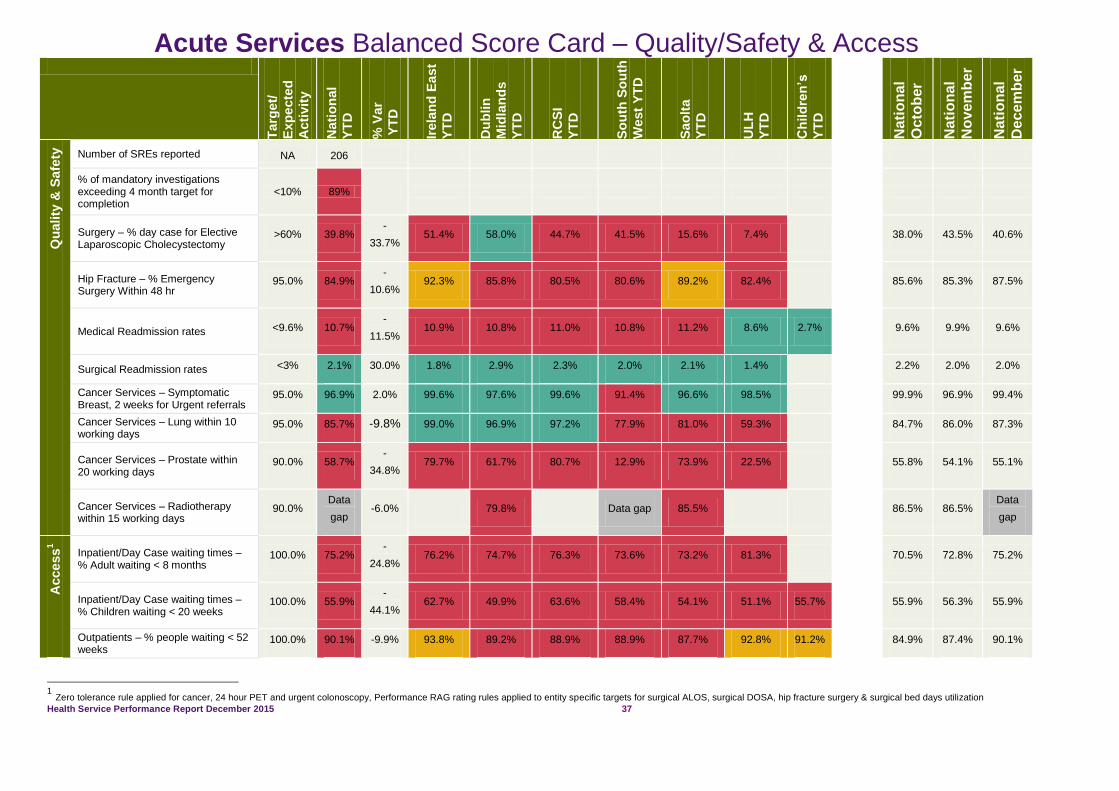
Acute Services Balanced Score Card – Quality/Safety & Access
Targ
et/
Exp
ecte
d
Acti
vit
y
Nati
on
al
YT
D
% V
ar
YT
D
Irela
nd
Ea
st
YT
D
Du
blin
Mid
lan
ds
YT
D
RC
SI
YT
D
So
uth
So
uth
West
YT
D
Sao
lta
YT
D
UL
H
YT
D
Ch
ild
ren
’s
YT
D
Na
tio
na
l
Oc
tob
er
Na
tio
na
l
No
ve
mb
er
Na
tio
na
l
De
ce
mb
er
Qu
ality
& S
afe
ty
Number of SREs reported NA 206
% of mandatory investigations exceeding 4 month target for completion
<10% 89%
Surgery – % day case for Elective Laparoscopic Cholecystectomy
>60% 39.8% -
33.7% 51.4% 58.0% 44.7% 41.5% 15.6% 7.4% 38.0% 43.5% 40.6%
Hip Fracture – % Emergency Surgery Within 48 hr
95.0% 84.9% -
10.6% 92.3% 85.8% 80.5% 80.6% 89.2% 82.4% 85.6% 85.3% 87.5%
Medical Readmission rates <9.6% 10.7% -
11.5% 10.9% 10.8% 11.0% 10.8% 11.2% 8.6% 2.7% 9.6% 9.9% 9.6%
Surgical Readmission rates <3% 2.1% 30.0% 1.8% 2.9% 2.3% 2.0% 2.1% 1.4% 2.2% 2.0% 2.0%
Cancer Services – Symptomatic Breast, 2 weeks for Urgent referrals
95.0% 96.9% 2.0% 99.6% 97.6% 99.6% 91.4% 96.6% 98.5% 99.9% 96.9% 99.4%
Cancer Services – Lung within 10 working days
95.0% 85.7% -9.8% 99.0% 96.9% 97.2% 77.9% 81.0% 59.3% 84.7% 86.0% 87.3%
Cancer Services – Prostate within 20 working days
90.0% 58.7% -
34.8% 79.7% 61.7% 80.7% 12.9% 73.9% 22.5% 55.8% 54.1% 55.1%
Cancer Services – Radiotherapy within 15 working days
90.0% Data
gap -6.0% 79.8% Data gap 85.5% 86.5% 86.5%
Data
gap
Acce
ss
1
Inpatient/Day Case waiting times – % Adult waiting < 8 months
100.0% 75.2% -
24.8% 76.2% 74.7% 76.3% 73.6% 73.2% 81.3% 70.5% 72.8% 75.2%
Inpatient/Day Case waiting times – % Children waiting < 20 weeks
100.0% 55.9% -
44.1% 62.7% 49.9% 63.6% 58.4% 54.1% 51.1% 55.7% 55.9% 56.3% 55.9%
Outpatients – % people waiting < 52 weeks
100.0% 90.1% -9.9% 93.8% 89.2% 88.9% 88.9% 87.7% 92.8% 91.2% 84.9% 87.4% 90.1%
1 Zero tolerance rule applied for cancer, 24 hour PET and urgent colonoscopy, Performance RAG rating rules applied to entity specific targets for surgical ALOS, surgical DOSA, hip fracture surgery & surgical bed days utilization

Health Service Performance Report December 2015 38
Targ
et/
Exp
ecte
d
Acti
vit
y
Nati
on
al
YT
D
% V
ar
YT
D
Irela
nd
Ea
st
YT
D
Du
blin
Mid
lan
ds
YT
D
RC
SI
YT
D
So
uth
So
uth
West
YT
D
Sao
lta
YT
D
UL
H
YT
D
Ch
ild
ren
’s
YT
D
Na
tio
na
l
Oc
tob
er
Na
tio
na
l
No
ve
mb
er
Na
tio
na
l
De
ce
mb
er
Outpatients – New: Return ratio 1 : 2 1 : 2.6 -
30.0% 1 : 2.3 1 : 2.9 1 : 2.7 1 : 2.7 1 : 2.3 1 : 3.3 1 : 2.6 1 : 2.6 1 : 2.6 1 : 2.6
Emergency Care – 6 hour PET 95.0% 68.2% -
28.2% 68.7% 61.4% 61.1% 68.8% 70.1% 56.9% 89.0% 68.8% 69.1% 68.6%
Emergency Care – 9 hour PET 100.0% 81.7% -
18.3% 81.6% 77.4% 75.5% 81.8% 85.0% 72.0% 96.9% 82.2% 82.7% 83.0%
Emergency Care – patients in ED GT 24 hours
0.0% 3.9% -3.9% 4.9% 3.7% 6.6% 3.3% 2.5% 7.2% 0.3% 3.7% 3.5% 2.7%
Surgical DOSA 70.0% 68.8% -1.7% 80.4% 58.0% 56.7% 72.7% 60.3% 79.3% 67.2% 68.2% 66.6%
Surgical – Reduction in bed days utilization
6.8% 10.5% -
54.4% 10.0% 8.0% 9.3% 9.9% 14.0% 16.8% 11.8% 11.4% 10.1%
GI – % waiting < 13 weeks routine colonoscopy/OGD
100.0% 56.9% -
43.1% 47.9% 42.5% 47.8% 66.7% 77.0% 82.4% 58.0% 52.5% 57.7% 56.9%
Colonoscopy – % waiting < 4 weeks urgent colonoscopy
100.0% 100% 0 100% 100% 100% 100% 100% 100% 100% 100.0% 99.9% 100.0%
Delayed Discharges
15%
reduction 16.7% 16.7% 21.6% 9.2% 2.4% 3.1% -44.8% 44.0% 6.7% 8.7% 16.7%
Ambulance Turnaround times – 60 minutes
100% 95.1% 0.2%
ALOS – Medical 5.8 7.0 0.2% 7.2 8.6 7.6 6.1 6.4 5.5 6.5 6.3 6.2
ALOS – Surgical 5.1 5.4 -4.9% 6.1 5.4 6 4.6 4.7 4.6 5.4 5.4 5.8

Health Service Performance Report December 2015 39
Acute Services Balanced Score Card Finance & HR
Bu
dg
et
YT
D
€’0
00/
Targ
et
Actu
al
YT
D €
’000
Vari
an
ce
YT
D
%
Vari
an
ce
YT
D
Irela
nd
East
YT
D
Du
blin
Mid
lan
ds
YT
D
RC
SI
YT
D
So
uth
So
uth
West
YT
D
UL
H Y
TD
Sao
lta Y
TD
Ch
ild
ren
’s
YT
D
Fin
an
ce
Net Expenditure variance from plan (excluding Regional
and National Services) €4,173,099 €4,199,974 €26,875 0.64% -0.25% 0.81% 1.14% -0.78% 0.39% 3.42% -1.28%
Pay (excl Superannuation Pay) €3,346,606 €3,403,741 €57,135 1.71% 0.81% 0.98% 2.29% 1.65% 3.18% 3.27% -0.01%
Pay (Agency) €151,029 €207,519 €56,490 37.40% 8.47% 66.77% 17.53% 62.88% 23.18% 65.36% 169.31%
Pay (Overtime) €151,163 €165,569 €14,405 9.53% 11.84% 20.46% 7.16% 2.32% 27.70% 1.50% 6.25%
Non Pay (incl procurement savings) €1,596,414 €1,626,108 €29,694 1.86% 2.62% 1.98% -1.74% 3.84% 3.55% 2.70% -2.65%
Income -€883,667 -€945,183 -€61,517 6.96% 8.08% 3.38% 1.27% 17.20% 16.71% 0.66% 1.68%
Regional and National Services €39,683 €25,665 -€14,018 -35.32%
Net Expenditure variance from plan (including Regional
and National Services) €4,212,782 €4,225,639 €12,857 0.31%
NCCP €2,504 €2,723 €219 8.74%
% and number of 2015 Service Arrangements signed 100% 82.4%
14 17.6%
€ value of 2015 Service Arrangements signed 100% €4,438,383
83.9% 16.1%
HR
Absence Rates - Medical/Dental 3.5% 0.84% 2.66% -76.00% 0.80% 0.86% 0.80% 0.87% 0.70% 0.79% 1.34%
Absence Rates– Nursing 3.5% 4.35% -0.85% 24.29% 3.78% 3.89% 4.75% 4.46% 5.29% 4.61% 4.42%
Absence Rates- Health and Social Care Professional 3.5% 2.91% 0.59% -16.86% 2.83% 2.40% 2.86% 3.32% 3.53% 2.97% 3.28%
Absence Rates - Management/Admin 3.5% 3.71% -0.21% 6.00% 3.55% 3.76% 4.00% 3.30% 4.24% 3.75% 3.72%
Absence Rates - General Support staff 3.5% 5.09% -1.59% 45.43% 5.33% 4.46% 4.60% 5.02% 6.45% 5.06% 7.42%
Absence Rates - Other Patient and Client staff 3.5% 5.71% -2.21% 63.14% 5.07% 5.95% 5.74% 4.25% 8.26% 5.51% 5.91%
Absence Rates- Total 3.5% 3.79% -0.29% 8.29% 3.52% 3.53% 3.81% 3.78% 4.92% 3.88% 3.98%
Variance from Indicative workforce 49,631 52,539 2,908 5.86% 6.7% 3.7% 8.1% 5.1% 11.2% 5.0% 2.6%
EDWT2 - <24 hour shift 100% 97% 4% 97% 98% 95% 99% 92% *95% 91%
EDWT - <48 hour working week 100% 76% 24% 75% 63% 60% 89% 97% 86% 70%
2 EWTD compliance is calculated on returns from 39 out of 40 hospitals

Health Service Performance Report December 2015 40
National Ambulance Services Balanced Score Card
Targ
et/
Exp
ecte
d
Acti
vit
y
Nati
on
al
YT
D
% V
ari
an
ce
YT
D
No
rth
Lein
ste
r
YT
D
Du
blin
Fir
e
Bri
gad
e Y
TD
So
uth
YT
D
West
YT
D
Na
tio
na
l
Oc
tob
er
Na
tio
na
l
No
ve
mb
er
Na
tio
na
l
De
ce
mb
er
Qu
ality
&S
afe
ty
Number of SREs reported NA 1
% of mandatory investigations exceeding 4 month target for completion
<10% 100%
% of control centres that carry out Advanced Quality Assurance Audits
100% 100% 0%
Return of spontaneous circulation (ROSC) at hospital in bystander witnessed out of hospital cardiac arrest with initial shockable rhythm, using the Utstein comparator group calculation
40% 42% 4%
Acce
ss
Emergency Response - % of Clinical Status 1 ECHO responded to by a patient carrying vehicle in 18 minutes 59 seconds or less
80% 77% -4% 78% 82% 74% 70%
Emergency Response - % of Clinical Status 1 DELTA responded to by a patient carrying vehicle in 18 minutes 59 seconds or less
80% 65% -18% 67% 67% 63% 63%
Intermediate Care Services 70% 86% 16%
% delays escalated where ambulance crews were not cleared nationally in 60 in line with the process / flow path in the ambulance turnaround framework
100% 79% -21%
B
ud
get
YT
D
€’0
00/
Targ
et
Actu
al
YT
D
€’0
00
Vari
an
c
e Y
TD
%
Vari
an
c
e Y
TD
No
rth
Lein
ste
r
YT
D
Du
blin
Fir
e
Bri
gad
e
YT
D
So
uth
YT
D
West
YT
D
Fin
an
ce
Net Expenditure variance from plan (budget) – YTD and
Projected to year end €144,139 €145,537 €1,399 0.97%
Pay (excl superannuation pay) €106,470 €106,931 €461 0.43%
Pay – Agency €0 €528 €528 100%
Pay – Overtime €5,916 €16,184 €10,268 173.57%
Non-pay (incl procurement savings) €37,893 €38,833 €940 2.48%
Income -€225 -€226 -€2 0.77%
HR
Absence Rates - Management/Admin 3.5% 2.60% 0.90% -25.71% 1.56% 5.82% 2.70%
Absence Rates - General Support staff 3.5% 3.80% -0.30% 8.57% 4.20% 0.53% 4.60%
Absence Rates - Other Patient and Client staff 3.5% 5.63% -2.13% 60.86% 6.14% 4.44% 5.51%
Absence Rates - Total 3.5% 5.34% -1.84% 52.57% 5.78% 4.11% 5.39%
Variance from Indicative workforce 1,611 1,694 83 5.17%

Health Service Performance Report December 2015 41
Community Healthcare Balanced Score Card – Absenteeism
Targ
et
YT
D
Ac
tua
l Y
TD
Va
ria
nc
e Y
TD
% V
ari
an
ce Y
TD
Cav
an, M
on
agh
an
Slig
o, L
eitr
im, D
on
egal
(1)
Gal
way
, May
o
Ro
sco
mm
on
(2)
Cla
re, L
imer
ick
N T
ipp
, E L
imer
ick
(3)
No
rth
& W
est
Co
rk
No
rth
& S
ou
th L
ee
Ker
ry (
4)
Wat
erfo
rd, W
exfo
rd
Car
low
, Kilk
enn
y
Tip
per
ary
So
uth
(5)
Du
blin
So
uth
Eas
t
Du
n L
aog
hai
re
Wic
klo
w (
6)
Du
blin
So
uth
Cit
y
Du
blin
Wes
t
Du
blin
So
uth
Wes
t
Kild
are,
Wes
t W
ickl
ow
(7)
Lao
is, O
ffal
y
Lo
ng
ford
, Wes
tmea
th
Lo
uth
, M
eath
(8)
Du
blin
No
rth
Cen
tral
Du
blin
No
rth
Wes
t
Du
blin
No
rth
(9)
HR
3
Absence Rates - Medical/Dental
3.50% 2.20% 1.30% -37.14% 1.61% 1.86% 1.68% 2.03% 1.42% 4.60% 2.66% 1.60% 2.74%
Absence Rates – Nursing 3.50% 4.86% -1.36% 38.86% 5.63% 5.18% 6.00% 3.86% 5.08% 4.03% 4.82% 5.60% 4.07%
Absence Rates - Health and Social Care Professional
3.50% 3.65% -0.15% 4.29% 4.86% 3.40% 3.83% 3.59% 3.98% 3.50% 3.29% 3.87% 3.36%
Absence Rates - Management/Admin
3.50% 4.24% -0.74% 21.14% 4.41% 4.20% 4.02% 3.67% 3.50% 3.59% 4.40% 5.02% 4.23%
Absence Rates - General Support staff
3.50% 5.04% -1.54% 44.00% 6.55% 4.68% 4.28% 3.84% 5.80% 3.61% 5.83% 5.59% 4.81%
Absence Rates - Other Patient and Client staff
3.50% 5.23% -1.73% 49.43% 6.89% 4.89% 5.59% 4.18% 4.85% 3.85% 5.15% 6.11% 5.20%
Absence Rates- Total 3.50% 4.63% -1.13% 32.29% 5.75% 4.48% 5.02% 3.85% 4.66% 3.84% 4.76% 5.28% 4.18%
3 Absenteeism results provided include Primary Care, Mental Health and Social Care divisions

Health Service Performance Report December 2015 42
Health & Wellbeing Balanced Score Card
Targ
et/
Exp
ecte
d
Acti
vit
y
Nati
on
al
YT
D
% V
ari
an
ce Y
TD
Cavan
, M
on
ag
han
Slig
o,
Leit
rim
,
Do
ne
gal
(1)
Galw
ay, M
ayo
Ro
sco
mm
on
(2)
Cla
re,
Lim
eri
ck
N T
ipp
, E
Lim
eri
ck
(3)
No
rth
& W
est
Co
rk
No
rth
& S
ou
th L
ee
Kerr
y (
4)
Wate
rfo
rd,
Wexfo
rd
Carl
ow
, K
ilken
ny
Tip
pe
rary
So
uth
(5)
Du
blin
So
uth
East
Du
n L
ao
gh
air
e
Wic
klo
w (
6)
Du
blin
So
uth
Cit
y
Du
blin
West
Du
blin
So
uth
West
Kil
da
re, W
est
Wic
klo
w (
7)
La
ois
, O
ffaly
Lo
ng
ford
,
Westm
eath
L
ou
th , M
eath
(8)
Du
blin
No
rth
Cen
tral
Du
blin
No
rth
West
Du
blin
No
rth
(9)
Na
tio
na
l
Oc
tob
er
Na
tio
na
l
No
ve
mb
er
Na
tio
na
l
De
ce
mb
er
Qu
ality
&S
afe
ty Number of SREs
reported NA 0
% of mandatory investigations exceeding 4 month target for completion
<10% 0
% of healthcare workers (flu vaccine) 40%
40%
23.4% Acute 25.7% comm
-41.5% -35.8%
Environmental Health - No. of planned surveillance inspections of food business
33,000 36,304 10%
Acce
ss
Child Health - development at 10 months
95% 93.7% -1.4% 96.2% 95.3% 91.8% 94.7% 94.1% 90.4% 92.4% 92.7% 95.5% 94.8% 94.8% 94.1%
Child Health – PHN visit in 72 hours
97% 97.5% 0.5% 96.8% 99.5% 94.1% 99.6% 100.7% 96.8% 97.6% 95.7% 96.3% 96.9%
Child health - % of children aged 12 months who receive the 6 in 1 vaccine
95% 91.4% -3.8% 93.2% 94.8% 91.3% 89.9% 91.9% 91.2% 91.1% 93.2% 88.4% 91.4%
BreastCheck screening
140,000 144,701 3.4% 13,003 13,659 9,312
CervicalCheck screening
271,000 249,908 -7.8% 20,065 19,743 12,859
Diabetic Retina Screening
78,300 76,248 -2.6% 6,929 6,375 5,535
Tobacco Control (intensive cessation support)
4
9,000 11,949 32.8% 2,136 0 394 849 246 825 1,878 1,065 1,719 1,344 944 635
4 National figures include the National Quitline result of 2,837
Health Service Performance Report December 2015 43
Health & Wellbeing Balanced Score Card – Finance & HR
Bu
dg
et
YT
D €’0
00/
Targ
et
Actu
al
YT
D €
’000
Vari
an
ce
YT
D
% V
ari
an
ce Y
TD
Cavan
, M
on
ag
han
Slig
o,
Leit
rim
, D
on
eg
al
(1)
Galw
ay, M
ayo
Ro
sco
mm
on
(2)
Cla
re,
Lim
eri
ck
N T
ipp
, E
Lim
eri
ck (
3)
No
rth
& W
est
Co
rk
No
rth
& S
ou
th L
ee
Kerr
y (
4)
Wate
rfo
rd,
Wexfo
rd
Carl
ow
, K
ilken
ny
Tip
pe
rary
So
uth
(5)
Du
blin
So
uth
East
Du
n L
ao
gh
air
e
Wic
klo
w (
6)
Du
blin
So
uth
Cit
y
Du
blin
West
Du
blin
So
uth
West
Kil
da
re, W
est
Wic
klo
w (
7)
La
ois
, O
ffaly
Lo
ng
ford
, W
estm
eath
L
ou
th , M
eath
(8)
Du
blin
No
rth
Cen
tral
Du
blin
No
rth
West
Du
blin
No
rth
(9)
Fin
an
ce
Net Expenditure variance from plan (budget) – YTD and Projected to year end
€192,390 €179,058 -€13,332 -6.93%
Pay (excl superannuation pay)
€93,450 €89,480 -€3,970 -4.25%
Pay – Agency €1,231 €1,296 €65 5.27%
Pay – Overtime €291 €290 -€1 -0.34%
Non-pay (incl procurement savings)
€105,097 €95,737 -€9,360 -8.91%
Income -€6,157 -€6,159 -€1 0.02%
% and number of 2015 Service Arrangements signed
100% 95.4%
144 4.6%
€ value of 2015 Service Arrangements signed
100% 96.2% €9,611
3.8%
HR
Variance from Indicative workforce
1,279 1,283 4 0.30%
Health Service Performance Report December 2015 44
Primary Care Balanced Score Card – Quality/Safety & Access
Targ
et/
Ex
pe
cte
d A
cti
vit
y
Na
tio
na
l Y
TD
% V
ari
an
ce Y
TD
Cavan
, M
on
ag
han
Slig
o,
Leit
rim
, D
on
eg
al
(1)
Galw
ay, M
ayo
Ro
sco
mm
on
(2)
Cla
re,
Lim
eri
ck
N T
ipp
, E
Lim
eri
ck (
3)
No
rth
& W
est
Co
rk
No
rth
& S
ou
th L
ee
Kerr
y (
4)
Wate
rfo
rd,
Wexfo
rd
Carl
ow
, K
ilken
ny
Tip
pe
rary
So
uth
(5)
Du
blin
So
uth
East
Du
n L
ao
gh
air
e
Wic
klo
w (
6)
Du
blin
So
uth
Cit
y
Du
blin
West
Du
blin
So
uth
West
Kil
da
re, W
est
Wic
klo
w
(7)
La
ois
, O
ffaly
L
on
gfo
rd, W
estm
eath
Lo
uth
, M
eath
(8)
Du
blin
No
rth
Cen
tral
Du
blin
No
rth
West
Du
blin
No
rth
(9)
Na
tio
na
l
Oc
tob
er
Na
tio
na
l
No
ve
mb
er
Na
tio
na
l
De
ce
mb
er
Qu
ality
& S
afe
ty
Number of SREs reported NA 1
% of mandatory investigations exceeding 4 month target for completion
< 10% 0%
Physiotherapy within 12 weeks 80%
Data Gap
85.8% 76.4% 82.2% 90.0% Data Gap
82.2% 81.8% 92.1% 61.1% Data Gap
Data Gap
Data Gap
Occupational Therapy within 12 weeks 80%
Data Gap
88.6% 84.8% 87.9% 62.3% Data Gap
88.5% 70.7% 86.7% 67.3% Data Gap
Data Gap
Data Gap
% of properly completed Medical/GP Visit Card applications processed within the 15 day turnaround
90% 99.8% 10.9% 99.5% 99.3% 99.8%
% of Medical Cards/GP Visit Card applications, assigned for medical Officer review, processed within 5 days
90% 99.7% 10.8% 78.7% 94.7% 99.7%
Acce
ss
Opioid substitution treatment (outside prisons) 9,400 9,497 1.0%
Opioid substitution treatment (prisons) 490
CIT - Overall Activity 26,355 19,675 -25.3% 553 3,707 1,524 1,527 1,234 6,412 485 4,233 1,867 1,870 2,142
CIT - Admission Avoidance (includes OPAT) 1,196 668 -44.1% 81 104 101 64 62 34 45 177 74 61 60
CIT - Hospital Avoidance 14,134 11,792 -16.6% 5 2,044 571 1074 897 5,676 0 1,525 1,118 1,180 1,362
CIT - Early Discharge (includes OPAT) 6,375 3,989 -37.4% 451 773 291 360 236 702 408 768 373 357 427
CIT Activity – Other 4,650 3,226 -30.6% 16 786 561 29 39 0 32 1,763 302 272 293
Number of contacts with GP OOH 959,455 980,917 2.2% 84,024 81,058 105,322

Health Service Performance Report December 2015 45
Primary Care Balanced Score Card – Finance & HR
Bu
dg
et
YT
D
€’0
00/
Targ
et
Ac
tua
l
YT
D €
’00
0
Va
ria
nc
e Y
TD
% V
ari
an
ce Y
TD
Cavan
, M
on
ag
han
Slig
o,
Leit
rim
, D
on
eg
al
(1)
Galw
ay, M
ayo
Ro
sco
mm
on
(2)
Cla
re,
Lim
eri
ck
N T
ipp
, E
Lim
eri
ck (
3)
No
rth
& W
est
Co
rk
No
rth
& S
ou
th L
ee
Kerr
y (
4)
Wate
rfo
rd,
Wexfo
rd
Carl
ow
, K
ilken
ny
Tip
pe
rary
So
uth
(5)
Du
blin
So
uth
East
Du
n L
ao
gh
air
e
Wic
klo
w (
6)
Du
blin
So
uth
Cit
y
Du
blin
West
Du
blin
So
uth
West
Kil
da
re, W
est
Wic
klo
w
(7)
La
ois
, O
ffaly
Lo
ng
ford
, W
estm
eath
L
ou
th , M
eath
(8)
Du
blin
No
rth
Cen
tral
Du
blin
No
rth
West
Du
blin
No
rth
(9)
Fin
an
ce
Net Expenditure variance from plan (budget) – YTD and Projected to year end
€3,583,769 €3,575,333 -€8,437 -0.24% 3.33% 3.73% 1.53% 1.52% -0.36% 1.07% -1.11% 3.98% 1.27%
Pay (excl superannuation) €603,935 €595,630 -€8,305 -1.38%
Pay – Agency €11,631 €17,780 €6,149 52.87%
Pay – Overtime €2,964 €3,274 €309 10.43%
Non-pay (incl procurement savings)
€3,131,927 €3,131,007 -€920 -0.03%
Income -€154,317 -€153,870 €448 -0.29%
Net Expenditure variance from plan - Primary Care
€752,573 €744,021 -€8,552 -1.14%
Net Expenditure variance from plan – Social Inclusion
€128,892 €130,558 €1,666 1.29% 2.56% -1.04% 2.74% 1.78% -0.17% 5.06% 0.33% -0.62% 1.60%
Net Expenditure variance from plan – PCRS
€2,397,239 €2,393,130 -€4,109 -0.17%
Net Expenditure variance from plan - Demand Led Schemes
€233,080 €235,204 €2,124 0.91%
% and number of 2015 Service Arrangements signed – Primary Care
100% 87.7%
278 12.3%
€ value of 2015 Service Arrangements signed – Primary Care
100% 97.1%
€32,559
2.9%
% and number of 2015 Service Arrangements signed – Social Inclusion
100% 94.3% 575
5.7%
€ value of 2015 Service Arrangements signed – Social Inclusion
100% 95.4% €82,904
4.6%
HR
Variance from Indicative workforce
10,344 10,442 98 0.95%

Health Service Performance Report December 2015 46
Palliative Care Balanced Score Card
Targ
et/
Ex
pe
cte
d
Ac
tiv
ity
Na
tio
na
l
YT
D
% V
ari
an
ce
YT
D
Cava
n,
Mo
nag
han
Slig
o,
Leit
rim
,
Do
neg
al
(1)
Galw
ay
, M
ay
o
Ro
sco
mm
on
(2
)
Cla
re,
Lim
eri
ck
N T
ipp
, E
Lim
eri
ck
(3)
No
rth
& W
est
Co
rk
No
rth
& S
ou
th L
ee
Kerr
y (
4)
Wate
rfo
rd, W
exfo
rd
Carl
ow
, K
ilke
nn
y
Tip
pera
ry S
ou
th (
5)
Du
blin
So
uth
Ea
st
Du
n L
ao
gh
air
e
Wic
klo
w (
6)
Du
blin
So
uth
Cit
y
Du
blin
We
st
Du
blin
So
uth
West
Kild
are
, W
es
t
Wic
klo
w (
7)
La
ois
, O
ffa
ly
Lo
ng
ford
,
Westm
ea
th
Lo
uth
, M
ea
th (
8)
Du
blin
No
rth
Cen
tral
Du
blin
No
rth
Wes
t
Du
blin
No
rth
(9
)
Na
tio
na
l
Oc
tob
er
Na
tio
na
l
No
ve
mb
er
Na
tio
na
l
De
ce
mb
er
Acce
ss
Community Home Care - % of patients provided with a service in their place of residence within 7 days
95% 88.5% -6.9% 92.1% 90.8% 95.5% 90.6% 98.2% 77.2% 77.2% 90.5% 78.6% 90.7% 88.5% 90.1%
Community Home Care - No of patients in receipt of specialist palliative care in the community
3,250
3,270 -2.5% 342 386 406 503 339 239 261 425 274 3,143 3,245 3,270
Inpatient waiting times - % of patients admitted within 7 days of referral
98% 98.0% 0% 97.8% 95.9% 100.0% 100.0% 100.0% 91.5% 97.9% 95.4% 98.7% 98.6% 97.5%
Day Care - No of patients in receipt of specialists palliative day care services
349 329 -4.4% 9 27 38 112 40 39 64 314 337 329
Paediatric Services - No of children in care of the Children's Palliative Care Services
320 411 28.4% 12 29 34 29 41 15 176 49 26 390 420 411
Bu
dg
et
YT
D
€’0
00
/
Targ
et
Ac
tua
l
YT
D €
’00
0
Va
ria
nc
e
YT
D
%
Va
ria
nc
e
YT
D
Cav
an, M
on
agh
an
Slig
o, L
eitr
im,
Do
neg
al (
1)
Gal
way
, May
o
Ro
sco
mm
on
(2)
Cla
re, L
imer
ick
N
Tip
p, E
Lim
eric
k
(3)
No
rth
& W
est
Co
rk
No
rth
& S
ou
th L
ee
Ker
ry (
4)
Wat
erfo
rd, W
exfo
rd
Car
low
, Kilk
enn
y
Tip
per
ary
So
uth
(5)
Du
blin
So
uth
Eas
t
Du
n L
aog
hai
re
Wic
klo
w (
6)
Du
blin
So
uth
Cit
y
Du
blin
Wes
t D
ub
lin S
ou
th W
est
Kild
are,
Wes
t
Wic
klo
w (
7)
Lao
is, O
ffal
y
Lo
ng
ford
, W
estm
eath
Lo
uth
, M
eath
(8)
Du
blin
No
rth
Cen
tral
Du
blin
No
rth
Wes
t
Du
blin
No
rth
(9)
Fin
an
ce
Net Expenditure variance from plan (budget) – YTD and Projected to year end €71,986 €72,421 €435 0.60% 6.69% 9.41% 0.21% 0.78% -2.15% -17.19% -3.28% 4.54% -0.01%
Pay (excl superannuation pay) €35,927 €36,641 €714 1.99%
Pay – Agency €1,096 €1,198 €102 9.28%
Pay – Overtime €719 €782 €63 8.77%
Non Pay (including procurement savings) €44,247 €44,980 €733 1.66%
Income -€9,488 -€10,648 -€1,161 12.23%
% of 2015 Service Arrangements signed 100% 78.3%
18 21.7%
€ value of 2015 Service Arrangements signed
100% 59.1%
€36,020 40.9%
HR
Variance from indicative workforce

Finance
Health Service Performance Report December 2015 47
Mental Health Balanced Score Card – Quality/Safety & Access
Targ
et/
Ex
pe
cte
d
Ac
tiv
ity
Na
tio
na
l Y
TD
% V
ari
an
ce
YT
D
Cavan
, M
on
ag
han
Slig
o,
Leit
rim
,
Do
ne
gal
(1)
Galw
ay, M
ayo
Ro
sco
mm
on
(2)
Cla
re,
Lim
eri
ck
N T
ipp
, E
Lim
eri
ck
(3)
No
rth
& W
est
Co
rk
No
rth
& S
ou
th L
ee
Kerr
y (
4)
Wate
rfo
rd,
Wexfo
rd
Carl
ow
, K
ilken
ny
Tip
pe
rary
So
uth
(5)
Du
blin
So
uth
East
Du
n L
ao
gh
air
e
Wic
klo
w (
6)
Du
blin
So
uth
Cit
y
Du
blin
West
Du
blin
So
uth
West
Kil
da
re, W
est
Wic
klo
w (
7)
La
ois
, O
ffaly
L
on
gfo
rd,
Westm
eath
Lo
uth
, M
eath
(8)
Du
blin
No
rth
Cen
tral
Du
blin
No
rth
West
Du
blin
No
rth
(9)
Na
tio
na
l
Oc
tob
er
Na
tio
na
l
No
ve
mb
er
Na
tio
na
l
De
ce
mb
er
Qu
ality
&S
afe
ty Number of SREs reported NA 37
% of mandatory investigations exceeding 4 month target for completion
< 10% 68%
Admissions of children to Child and Adolescent Acute Inpatient Units as a % of the total number of admissions of children to mental health acute inpatient units
95% 73.3% -
22.8% 71.4% 78.6% 80.8%
% of accepted referrals/re-referrals offered first appointment within 12 weeks/3 months by:
General Adult Teams 90% 92.6% 2.9% 86.9% 96.8% 96.6% 92.9% 97.4% 98.5% 88.0% 93.9% 81.3% 93.3% 92.5% 94.6%
Psychiatry of Old Age Teams 99% 97.9% -1.1% 92.6% 100% 100% 85.5% 100% 98.2% 97.8% 98.0% 98.8% 98.2% 97.2% 95.8%
Child and Adolescent Community mental Health Teams
78% Data
Gap 57.5% 96.0% 87.0% 67.7% 80.5% 69.9% Data Gap 76.6% 66.2% 75.9% 80.3%
Data
gap
% of accepted referrals/re-referrals offered first appointment and seen within 12 weeks/3 months by:
General Adult Teams 75% 73.6% -1.9% 72.5% 86.0% 70.7% 67.8% 90.0% 79.3% 71.7% 67.7% 56.2% 74.5% 74% 74.9%
Psychiatry of Old Age Teams 95% 95.4% 0.5% 91.8% 95.6% 99.4% 68.7% 99.2% 97.7% 97.1% 92.4% 96.1% 95.8% 95.2% 94.2%
Child and Adolescent Community Mental Health Teams
72% Data
Gap 54.2% 88.8% 86.8% 60.0% 67.5% 50.7% Data Gap 62.2% 56.7% 69.1% 65.5%
Data
gap
Acce
ss
Total no. to be seen 2,632 2,298 -
12.7% 402 38 279 522 127 376 134 219 201 2,252 2,273 2,298
Total no. to be seen (0-3 months) 1,153 1,166 1.1% 146 33 99 200 90 259 108 142 89 1,001 1,096 1,166
Wait List (i.e. those waiting >3 months)
1,479 1,132 -
23.5% 256 5 180 322 37 117 26 77 112 1,251 1,177 1,132
No. on waiting list for first appointment at end of each month by wait time:
3-6 months 534 387 -
27.6% 76 3 45 83 22 53 9 52 44 464 412 387
6-9 months 331 321 -3% 69 0 61 75 13 51 3 21 28 374 363 321
9-12 months 614 243 -
60.4% 83 0 52 70 2 13 5 4 14 191 195 243
>12 months 0 181 >100
% 28 2 22 94 0 0 9 0 26 222 207 181

Finance
Health Service Performance Report December 2015 48
Mental Health Balanced Score Card – Finance & HR
Bu
dg
et
YT
D
€’0
00/
Targ
et
Ac
tua
l
YT
D €
’00
0
Va
ria
nc
e Y
TD
% V
ari
an
ce
YT
D
Cava
n,
Mo
nag
han
Slig
o,
Leit
rim
,
Do
neg
al
(1)
Galw
ay
, M
ay
o
Ro
sco
mm
on
(2
)
Cla
re,
Lim
eri
ck
N T
ipp
, E
Lim
eri
ck (
3)
No
rth
& W
est
Co
rk
No
rth
& S
ou
th L
ee
K
err
y (
4)
Wate
rfo
rd, W
exfo
rd
Carl
ow
, K
ilke
nn
y
Tip
pera
ry S
ou
th (
5)
Du
blin
So
uth
Ea
st
Du
n L
ao
gh
air
e
Wic
klo
w (
6)
Du
blin
So
uth
Cit
y
Du
blin
We
st
Du
blin
So
uth
West
Kild
are
, W
es
t
Wic
klo
w (
7)
La
ois
, O
ffa
ly
Lo
ng
ford
,
Westm
ea
th
Lo
uth
, M
ea
th (
8)
Du
blin
No
rth
Ce
ntr
al
Du
blin
No
rth
Wes
t
Du
blin
No
rth
(9
)
Fin
an
ce
Net Expenditure variance from plan (budget) – YTD and Projected to year end
€787,385 €780,294 -€7,091 -0.90% 2.97% 1.74% 1.95% 2.06% 2.20% 0.37% 0.86% 5.58% 0.02%
Pay (excl superannuation pay)
€622,098 €610,812 -€11,287 -1.81%
Pay – Agency €14,603 €33,992 €19,388 132.77%
Pay – Overtime €15,095 €19,589 €4,494 29.77%
Non-pay (incl procurement savings)
€184,035 €187,089 €3,054 1.66%
Income -€19,700 -€18,493 €1,206 -6.12%
% and number of 2015 Service Arrangements signed
100% 80% 164
20%
€ value of 2015 Service Arrangements signed
100% 72.4%
€46,991 27.6%
HR
Variance from Indicative workforce
9,262 9,404 142 1.53%
EWTD - <24 hour shift5 100% 90% 10%
EWTD - <48 hour working week 100% 94% 6%
5 EWTD results are based on returns from 19 of 29 service providers

Finance
Health Service Performance Report December 2015 49
Social Care Balanced Score Card – Quality/Safety & Access
Targ
et/
Ex
pe
cte
d
Ac
tiv
ity
Na
tio
nal
YT
D
%
Va
ria
nce
YT
D
Cavan
,
Mo
na
g
ha
n
Slig
o,
Le
itri
m
,
Do
ne
g
al
(1)
Galw
ay
, M
ayo
Ro
sco
mm
on
(2
) C
lare
,
Lim
eri
ck
N T
ipp
,
E
Lim
eri
ck (
3)
No
rth
& W
est
Co
rk
No
rth
&
So
uth
Le
e
Kerr
y
(4)
Wate
rf
ord
,
Wexfo
r
d
Carl
ow
,
Kil
ken
ny
Tip
pe
r
ary
So
uth
(5
)
Du
blin
So
uth
E
ast
Du
n
La
og
hair
e
Wic
klo
w (
6)
Du
blin
So
uth
Cit
y
Du
blin
West
Du
blin
So
uth
W
est
Kil
da
re
, W
est
Wic
klo
w (
7)
La
ois
,
Off
aly
Lo
ng
fo
rd,
Westm
eath
Lo
uth
,
Me
ath
(8
)
Du
blin
N
ort
h
Cen
tral
Du
blin
No
rth
W
est
Du
blin
No
rth
(9)
Na
tio
nal
Oc
to
ber
Na
tio
nal
No
ve
mb
er
Na
tio
nal
De
ce
mb
er
Qu
ality
&S
afe
ty
Number of SREs reported
NA 43
% of mandatory investigations exceeding 4 month target for completion
< 10% 82%
Disability Act Assessment completed
100% 31.2% -
68.8% 68.3% 87.2% 53.7% 18.9% 26.8% 57.3% 18.9% 39.4% 9.9%
31% (Q2)
32.9% (Q3)
23% (Q4)
Congregated Settings 150
100%
137 -8.6% 12 5 1 30 8 35 10 28 8 11
(Q2) 46
(Q3) 53
(Q4)
Quality 100% Data Gap
Elder abuse cases - % of active cases reviewed within 6 month timeframe
90% 90% 0% 94.7% 95.9% 89.0% 90.6% 72.7% 96.7% 88.2% 97.0% 86.4% 75.4% 90.6% 100%
Acce
ss
0-18s 100% 24/24
8/24 -
66.6% 2/3 2/3 1/1 2/4 0/4 0/2 Data Gap 1/3 0/1
5/24 (Q2)
5/24 (Q3)
Data Gap
Day Services 100% 98% -2%
HCP – Total no. of persons in receipt of a HCP
13,200 15,274 15.7% 1,274 1,160 950 1,395 887 1,558 2,049 2,091 3,910 14,997 15,142 15,274
HCP – No. of persons in receipt of an Intensive HCP at a point in time (capacity)
190 195 -2.6% 165 183 195
Home Help Hours – No. of hours provided (excluding provision of hours from HCP’s)
10,300,000
10,456,801
1.5% 1,409,92
9 1,295,62
8 949,074
2,105,580
1,204,980
385,570
710,151 1,250,65
6 1,145,23
3
880,89
0 864,598
890,59
5
NHSS Beds - no of people funded
22,361 23,073 3.2% 23,142 23,065 23,073
No of NHSS Beds in Public Long Stay Units
5,287 5,222 -1.2% 562 597 346 1,041 556 386 651 613 470 5,258 5,244 5,222

Finance
Health Service Performance Report December 2015 50
Social Care (Disabilities) Balanced Score Card – Finance & HR
Bu
dg
et
YT
D
€’0
00/
Targ
et
Actu
al
YT
D
€’0
00
Vari
an
ce
YT
D
%
Vari
an
ce
YT
D
Cav
an
,
Mo
nag
ha
n
Sli
go
, L
eit
rim
,
Do
ne
ga
l (1
)
Ga
lwa
y,
Ma
yo
Ro
sc
om
mo
n (
2)
Cla
re,
Lim
eri
ck
N T
ipp
, E
Lim
eri
ck
(3
)
No
rth
& W
es
t
Co
rk
No
rth
& S
ou
th
Le
e
Kerr
y (
4)
Wa
terf
ord
,
We
xfo
rd
Carl
ow
,
Kilk
en
ny
Tip
pe
rary
So
uth
(5
)
Du
bli
n S
ou
th
Ea
st
Du
n L
ao
gh
air
e
Wic
klo
w (
6)
Du
bli
n S
ou
th
Cit
y
Du
bli
n W
es
t
Du
bli
n S
ou
th
We
st
Kild
are
, W
es
t
Wic
klo
w (
7)
La
ois
, O
ffa
ly
Lo
ng
ford
,
We
stm
ea
th
Lo
uth
, M
eath
(8)
Du
bli
n N
ort
h
Cen
tra
l
Du
bli
n N
ort
h
We
st
Du
bli
n N
ort
h (
9)
Fin
an
ce
Net Expenditure variance from plan (budget) – YTD and Projected to year end
€1,526,243 €1,529,914 €3,671 0.24% 3.49% 2.09% 3.38% 1.11% 3.76% 2.41% 4.56% 2.84% 1.76%
Pay (excl superannuation pay) €586,688 €590,630 €3,942 0.67%
Pay – Agency €22,310 €37,161 €14,851 66.56%
Pay – Overtime €4,801 €8,221 €3,421 71.25%
Non-pay (incl procurement savings)
€1,012,673 €1,011,096 -€1,577 -0.16%
Income -€100,311 -€99,825 €486 -0.48%
% and number of 2015 Service Arrangements signed
100% 70.3%
557 29.7%
€ value of 2015 Service Arrangements signed
100% 59.1%
€669,722 40.9%
HR
Variance from Indicative workforce
24,816 25,786 970 3.91%
Social Care (Older Persons) Balanced Score Card – Finance & HR
Bu
dg
et
YT
D
€’0
00/
Targ
et
Actu
al
YT
D
€’0
00
Vari
an
ce
YT
D
%
Vari
an
ce
YT
D
Cav
an
,
Mo
nag
ha
n
Sli
go
, L
eit
rim
,
Do
ne
ga
l (1
)
Ga
lwa
y,
Ma
yo
Ro
sc
om
mo
n (
2)
Cla
re,
Lim
eri
ck
N T
ipp
, E
Lim
eri
ck
(3
)
No
rth
& W
es
t
Co
rk
No
rth
& S
ou
th
Le
e
Kerr
y (
4)
Wa
terf
ord
,
We
xfo
rd
Carl
ow
,
Kilk
en
ny
Tip
pe
rary
So
uth
(5)
Du
bli
n S
ou
th
Ea
st
Du
n L
ao
gh
air
e
Wic
klo
w (
6)
Du
bli
n S
ou
th
Cit
y
Du
bli
n W
es
t
Du
bli
n S
ou
th
We
st
Kild
are
, W
es
t
Wic
klo
w (
7)
La
ois
, O
ffa
ly
Lo
ng
ford
,
We
stm
ea
th
Lo
uth
, M
eath
(8)
Du
bli
n N
ort
h
Cen
tra
l
Du
bli
n N
ort
h
We
st
Du
bli
n N
ort
h (
9)
Fin
an
ce
Net Expenditure variance from plan (budget) – YTD and Projected to year end
€737,122 €736,648 -€474 -0.06% 7.59% 13.91% 6.30% 5.25% 5.18% 0.92% 1.27% 15.31% -0.16%
Pay (excl superannuation pay) €649,900 €662,412 €12,512 1.93%
Pay – Agency €20,851 €31,715 €10,864 52.10%
Pay – Overtime €5,441 €6,333 €892 16.39%
Non-pay (incl procurement savings)
€461,181 €442,639 -€18,542 -4.02%
Income -€378,348 -€373,469 €4,879 -1.29%
% and number of 2015 Service Arrangements signed
100% 84.8%
975 15.2%
€ value of 2015 Service Arrangements signed
100% 52.3%
€80,501 47.7%
HR
Variance from Indicative workforce
24,816 25,786 970 3.91%

Finance
Health Service Performance Report December 2015 51
Corporate
Finance

Finance
Health Service Performance Report December 2015 52
Detailed Financial overview
The Letter of Determination received by the HSE on 31st of October 2014 provided an increase
of €625m or 5.4% in funding for 2015. The HSE’s 2015 National Service Plan made clear that
when account was taken of the 2014 projected net expenditure deficit of €510m this allowed the
health services net costs to increase by €115m. The actual outturn against the €510m projected
deficit was €18m higher in relation to increased pension costs, €5m relating to demand led local
schemes and €16m relating to demand driven pressure in our Acute Hospitals. This had the
combined effect of only allowing net costs to increase by less than €80m in 2015.
Expenditure by Category and Division
Approved Allocation
before Supplementary
Estimate €'000
Approved Allocation
After Supplementary Estimate
€'000
YTD
% Var Act v Tar
€'000
Actual €'000
Variance after
Supplementary
Estimate €'000
Acute Division 4,025,782 4,212,782 4,225,639 12,857 0.31%
National Ambulance Service 144,139 144,139 145,537 1,398 0.97%
Health & Wellbeing Division 192,390 192,390 179,058 (13,332) -6.93%
Primary Care Division 948,451 953,451 946,999 (6,452) -0.68%
Mental Health Division 787,385 787,385 780,294 (7,091) -0.90%
Social Care Division 3,012,283 3,117,283 3,121,139 3,856 0.12%
Other Direct Services 44,935 44,935 42,635 (2,300) -5.12%
Other National Divisions / Services 281,469 281,469 286,142 4,673 1.66%
Accelerated Income (50,000) 0 0 0
Total Direct Services Provision 9,386,834 9,733,834 9,727,443 (6,391) -0.07%
Pensions 192,172 244,172 247,563 3,391 1.39%
Demand Led Services 2,591,948 2,833,948 2,848,800 14,852 0.52%
Total Pensions & Demand Led Services 2,784,120 3,078,120 3,096,363 18,243 0.59%
Total 12,170,954 12,811,954 12,823,80
6 11,852 0.09%
After receipt of supplementary funding the HSE’s final financial position for 2015, prepared on an
income and expenditure basis6 (I&E), shows net expenditure of €12.823 billion against the
available budget reported at €12.811 billion. This gives rise to an I/E deficit for the year of
€11.8m which represents 0.09% of the total available budget. Of this €18m, or the equivalent of
0.14% of the total available budget, is in respect of greater than expected payments on pensions
and demand led services. Within this category the State Claims Agency’s deficit was €16m due
to greater than expected payments under this heading
6 Up to 31
st December 2014 the HSE is required to prepare financial information on both an income and
expenditure basis (I&E - accruals based accounting) and also a vote accounting basis (largely cash based government accounting). With effect from 1
st January 2015 the HSE Vote has been disestablished and
transferred to the Department of Health and the HSE is no longer required to prepare vote based statutory accounts.

Finance
Health Service Performance Report December 2015 53
The supplementary estimate for 2015 needed to encompass the core deficit as well as an
expected over run on costs incurred in demand led areas including the State Claims Agency,
pension provision and local community demand led schemes. The arrival at this 2015 level of
deficit indicates that our net costs will have risen 5.5% between 2014 and 2015 or by 3.7% if we
look at the direct provision only (excluding agreed additional expenditure on waiting list, delayed
discharges and winter plans of €68m as agreed with Government in April 2015). This increase
should be considered in conjunction with increased population growth particularly specific elderly
age groups which have experienced much higher growth.
It is important to stress that €312m of the 2015 total deficit or 47% relates to demand led areas
such as pension payments, state claims agency payments, local demand led schemes and the
Primary Care Reimbursement Service.
2015 FINANCIAL RESULTS AND PERFORMANCE
The financial outturn reported above is shown after receipt of supplementary allocation for 2015.
A supplementary estimate of €665m was approved by Cabinet on 8th December 2015. A total of
€642m revenue funding was issued to the HSE to fund deficits in pensions and other demand-
led areas, expenditure on additional initiatives approved in-year and overspend in operational
services.
Description
Full Year 2015
Budget €000s
YTD Spend €000s
YTD Budget €000s
YTD Variance
€000s
YTD Variance %
% of Total
Variance %
Acute Hospitals Division 4,212,782 4,225,639 4,212,782 12,857 0.31% 108.47%
National Ambulance Service 144,139 145,537 144,139 1,399 0.97% 11.80%
Health & Wellbeing Division 192,390 179,058 192,390 (13,332) -6.93% -112.48%
Primary Care 752,573 744,021 752,573 (8,552) -1.14% -72.15%
Social Inclusion 128,892 130,558 128,892 1,666 1.29% 14.06%
Palliative Care 71,986 72,421 71,986 435 0.60% 3.67%
Primary Care Division (Note 1) 953,451 946,999 953,451 (6,452) -0.68% -54.43%
Mental Health Division
787,385 780,294 787,385 (7,091) -0.90% -59.83%
Older Persons Services
737,122 736,648 737,122 (474) -0.06% -4.00%
Nursing Home Support Scheme ("Fair Deal")
853,918 854,576 853,918 658 0.08% 5.55%
Disability Services 1,526,243 1,529,914 1,526,243 3,671 0.24% 30.97%
Social Care Division
3,117,283 3,121,139 3,117,283 3,856 0.12% 32.53%
CHO Corporate Community 4,411 4,556 4,411 145 3.29% 1.22%
National Cancer Control Programme (NCCP) 2,504 2,723 2,504 219 8.74% 1.85%

Finance
Health Service Performance Report December 2015 54
Description
Full Year 2015
Budget €000s
YTD Spend €000s
YTD Budget €000s
YTD Variance
€000s
YTD Variance %
% of Total
Variance %
Clinical Strategy & Programmes Division 30,444 28,852 30,444 (1,591) -5.23% -13.43%
Quality Assurance & Verification
607 272 607 (336) -55.27% -2.83%
Quality Improvement Division 6,969 6,232 6,969 (737) -10.57% -6.22%
Other National Divisions/Services 281,469 286,142 281,469 4,672 1.66% 39.42%
Total Direct Service Provision
9,733,834 9,727,443 9,733,834 (6,391) -0.07% -53.92%
Statutory Pensions 465,973 461,331 465,973 (4,642) -1.00% -39.17%
Pension Levy (221,801) (213,768) (221,801) 8,034 -3.62% 67.78%
Pensions 244,172 247,563 244,172 3,391 1.39% 28.61%
State Claims Agency 189,000 205,228 189,000 16,228 8.59% 136.91%
Primary Care Reimbursement Scheme (Note 1) 2,397,239 2,393,130 2,397,239 (4,109) -0.17% -34.67%
Demand Led Local Schemes (Note 1) 233,080 235,204 233,080 2,124 0.91% 17.92%
Overseas Treatment 14,629 15,239 14,629 610 4.17% 5.14%
Demand Led Services 2,833,948 2,848,800 2,833,948 14,852 0.52% 125.30%
Total Pensions & Demand Led Services
3,078,120 3,096,363 3,078,120 18,244 0.59% 153.92%
Overall Total 12,811,954 12,823,807 12,811,954 11,853 0.09% 100% Note 1: PCRS and Demand Led Schemes form part of the Primary Care Division but are reported under Non Core Services
HSE Direct Provision S.38 Funded Providers
Description
Full Year 2015
Budget €000s
YTD Variance
€000s
YTD Variance
%
Variance €000s
Variance %
Acute Hospitals Division 4,212,782 23,756 0.99% (10,899) -60%
National Ambulance Service 144,139 1,399 0.97%
0.00%
Health & Wellbeing Division 192,390 (13,332) -6.93%
0.00%
Primary Care 752,573 (9,344) -1.25% 792 10.75%
Social Inclusion 128,892 1,666 1.29% 0 0.00%
Palliative Care 71,986 1,199 2.32% (765) -3.79%
Primary Care Division (Note 1) 953,451 (6,479) -0.70% 27 0.10%
Mental Health Division 787,385 (7,699) -1.02% 608 1.69%
Older Persons Services 737,122 (998) -0.14% 525 1.31%

Finance
Health Service Performance Report December 2015 55
HSE Direct Provision S.38 Funded Providers
Description
Full Year 2015
Budget €000s
YTD Variance
€000s
YTD Variance
%
Variance €000s
Variance %
Nursing Home Support Scheme ("Fair Deal")
853,918 658 0.08% 0 0.00%
Disability Services 1,526,243 (2,508) -0.22% 6,179 1.57%
Social Care Division 3,117,283 (2,848) -0.11% 6,704 1.54%
CHO Corporate Community 4,411 145 3.29% 0 0.00%
Note: The "S.38 Funded Providers" figures relate to a subset of the larger voluntary providers
funded by the HSE under S.38 of the Health Act 2004 including all 16 voluntary hospitals. The
HSE's monthly performance assurance report incorporates pay, non pay and income detail as
reported by these providers to the HSE. Expenditure related to the remainder of the voluntary
providers funded by the HSE under S.38 and S.39 of the Health Act 2004 is shown under non
pay based on the amounts paid out by the HSE.
The 2015 deficit before the supplementary allocation includes cost overruns in the following
areas which the HSE had previously identified:
Demand-Led Areas
State Claims Agency (SCA) Cost of Historic Claims (managed by the SCA – deficit
before supplementary €109m) – the I/E overrun in respect of these claims reflects the fact
that the budget available to the HSE for these costs (€96m) has not increased in recent years
albeit the SCA has outlined its predictions in relation to cost growth. Precise cost prediction in
this area has proven to be extremely challenging and deficits in recent years have been met
each year by way of supplementary funding at year end.
Primary Care Reimbursement Service (deficit before supplementary €142m – PCRS €125m & €17m Local Demand Led Schemes) – The PCRS is primarily a demand-driven
service and expenditure increased by €106m in 2015 compared to 2014. Of this increase €127m represented growth in four specific areas, GP Fees & Allowances €32m, High Tech Drugs €54m, Long Term Illness scheme €52m, Hep C Scheme €21m with offsetting reductions in other areas such as GMS pharmacy drugs (€67m) and low growth in a number of other areas / schemes of €14m. A deficit position had been projected in the region of €145m early in 2015 with a final outturn achieved being €20m less than anticipated. The PCRS final deficit included a savings target of €40m for IPHA/AMPI price savings with only €2.8m saved in this area due to a dependency on a new agreement being negotiated in 2015.
Local Demand Led Schemes had a final deficit of €17m, €2m more than had been anticipated by
the Primary Care Division. It is typically difficult to estimate demand growth in this area.
Pension including pension levy (deficit before supplementary €55m) - The HSE projected
a 2015 deficit of €52m pensions based on expected retirements in year. The scale and number of retirements in any financial period is difficult to predict with certainty.

Finance
Health Service Performance Report December 2015 56
Acute Hospitals (deficit before supplementary €199m) – the acute Hospital system was
projected to be approximately €187m in deficit by the end of 2015. This represented a core deficit of €149m plus €28m and €10m of approved additional expenditure on waiting lists and winter planning respectively. The deficit position after supplementary estimate is €12.8m which represents cost growth beyond the anticipated levels of 0.3% of total acute budget. In 2015, the biggest single increase in spend has occurred in basic pay of €88m. It represents a 3.7% increase on 2014. This has been partially offset by a decrease in acute agency spend of €23m or 10.1%. Clinical non-pay costs have increased by €82m, or 8% year on year. The main growth drivers within clinical non-pay have been drugs & medicines ie €43m (12.7%) and medical & surgical supplies ie €22m (6.5%)
Agency Services - HSE 2015 agency costs were €332m versus €341m in 2014, a decrease of
€8.2m (2.4%) year on year. Agency costs incurred in acute hospital services were €208m and this compares to €231m for last year. The 2015 agency costs for hospitals include €93m in respect of the medical/dental pay category. This represents a decrease of €7m compared to 2014. Acute paramedical agency costs have fallen by €9m. Hospital agency costs overall have decreased by €23m (10.1%) compared to the same period last year.
Agency Costs by Division - 2015 versus 2014
Acute Hospitals
Health & Wellbeing
National Ambulance
Service
Primary Care
Social Care
Mental Health
Other Services
incl NCCP & QID
Total
€000s €000s €000s €000s €000s €000s €000s €000s
Jan-15 17,868 127 83 1,542 5,144 2,426 208 27,398
Feb-15 18,923 99 21 1,575 4,907 2,386 465 28,376
Mar-15 17,929 160 71 1,518 5,195 2,531 270 27,672
Apr-15 17,841 113 62 1,724 5,592 2,389 372 28,093
May-15 16,699 77 32 1,600 5,331 2,528 398 26,665
Jun-15 16,466 192 63 1,687 5,470 2,609 756 27,243
Jul-15 16,777 163 38 1,318 6,089 3,025 383 27,793
Aug-15 17,118 93 42 1,310 5,996 2,993 353 27,905
Sep-15 16,794 62 41 1,196 6,958 3,016 338 28,404
Oct-15 16,895 61 29 1,487 5,863 3,205 360 27,900
Nov-15 15,769 54 24 1,204 6,182 2,900 545 26,677
Dec-15 18,634 97 22 1,620 6,148 3,983 (2,205) 28,299
Total 2015 YTD
207,713 1,296 528 17,780 68,874 33,992 2,242 332,424
Average monthly cost 2015 to date
17,309 108 44 1,482 5,740 2,833 187 27,702
Jan-14 17,005 143 147 1,245 4,632 1,447 323 24,943
Feb-14 17,601 149 195 1,327 4,173 1,757 49 25,252
Mar-14 18,867 87 77 1,283 5,292 1,954 227 27,787
Apr-14 18,826 141 163 1,301 4,916 2,102 299 27,746
May-14 19,562 156 174 1,330 5,395 2,415 314 29,345
Jun-14 19,956 119 131 1,470 4,705 2,042 322 28,746
Jul-14 20,467 112 154 1,445 5,676 2,487 193 30,535

Finance
Health Service Performance Report December 2015 57
Aug-14 18,655 123 153 1,339 5,405 2,570 442 28,687
Sep-14 19,177 111 168 992 5,600 2,653 268 28,969
Oct-14 19,447 40 119 1,441 5,010 2,421 409 28,888
Nov-14 19,053 110 106 1,628 3,784 2,289 3,449 30,421
Dec-14 22,340 123 93 1,700 5,413 2,682 (3,066) 29,285
Total 2014 YTD
230,956 1,414 1,681 16,502 60,001 26,819 3,230 340,604
Average monthly cost 2014 to date
19,246 118 140 1,375 5,000 2,235 269 28,384
Change - YTD 2015 vrs 2014
(23,244) (118) (1,154) 1,278 8,873 7,173 (988) (8,179)
Social Care Services (deficit before supplementary €115m) – the final deficit before
supplementary funding of €115m includes €59m approved additional expenditure on delayed discharge initiatives in Older Persons Services and the Nursing Home Support Scheme (NHSS). Key cost pressures and financial risks during 2015 included significant pay cost pressures in respect of overnight residential staff. Additionally, environmental factors were also an ongoing issue with deployment of staff driving agency costs. Allied to this were significant staffing and capital / once-off pressures, arising from the enhanced regulatory focus on disability residential services, which will require a significant multi-annual investment programme over the coming years.
Conclusion
The direct service provision HSE deficit came in at (0.07)% or €6.3m below the anticipated level of expenditure for 2015 with pensions and demand led services exceeding expected levels by €18.2m or 0.59%.
Of this €18.2m, or the equivalent of 0.14% of the total available budget, is in respect of greater
than expected payments on pensions and demand led services. The State Claims Agency’s
deficit representing €16m of this total which is due to greater than expected payments under this
heading. The supplementary estimate for 2015 encompassed the direct services deficit as well
as the expected over run on costs incurred in demand led areas including the State Claims
Agency.
The arrival at this 2015 level of deficit indicates that our net costs will have risen 5.5% between 2014 and 2015 or by 3.7% if we look at the direct provision only (excluding agreed additional expenditure on waiting list, delayed discharges and winter plans of €68m as agreed with Government in April 2015). This increase should be considered in conjunction with increased population growth particularly specific elderly age groups which have experienced much higher growth. It is also important to stress that €312m of the 2015 total deficit or 47% relates to demand-led areas outwith the direct control of the HSE such as pension payments, state claims agency payments, local demand-led schemes and the Primary Care Reimbursement Service.

Human Resources
Health Service Performance Report December 2015 58
Human Resources

Appendix
Health Service Performance Report December 2015 59
Human Resources
People Strategy 2015 – 2018 Leaders in People Services
People Strategy 2015- 2018 Leaders in People Services was communicated across the health
system in January, 2016. The Strategy Framework gathers the interrelated and inter dependent
elements of the Strategy – it is only by working together on all of these elements that we can
really bring about significant cultural change in the way we approach people management
across the system. The combined outcomes from each of the priority areas in the People
Strategy will result in improved performance, workforce optimisation and a learning Organisation
delivering the overall goal of Safer Better Healthcare. The People Strategy and Workplan are
available on the following link:
http://hse.ie/eng/staff/Resources/hrstrategiesreports/peoplestrategy201518.html
Health Service Excellence Awards 2015 – 2016
A total of 426 applications were received by closing date of 13th January. Shortlisting process
has commenced. The presentation ceremony for the Awards will take place on Wednesday, 27th
April, 2016. Details of all applications are attached at Appendix 1. The response rate and quality
of submissions highlights the requirement to recognise the excellence in practice in our health
service and the significant opportunity to share and replicate said practice.
HR Help Desk
National HR Employee Helpdesk went live on 4th January, 2016. The focus of the HR HelpDesk
is on providing individual employee support in conjunction with the local HR Offices and
CERS/ERAS.
The HR Help Desk can be contacted on Tel: 1850 444 925 each day from 8.00 am to 5 pm,
Email: [email protected] or like the Facebook Page: Ask HR HSE.
European Working Time Directive
The data deals with 5,314 NCHDs (as compared to 5,175 previously);
Compliance with a maximum 48 hour week is at 77% as of end December – unchanged
since November;
Compliance with 30 minute breaks is at 99% - unchanged from November;
Compliance with weekly / fortnightly rest is at 99% - unchanged from November;
Compliance with a maximum 24 hour shift (not an EWTD target) is at 96% - up 2% since
November. This represents a return to standard figures and likely reflects inclusion of
amended St Vincent’s data.
Compliance with a daily 11 hour rest period is at 96% - unchanged from November. This is
closely linked to the 24 hour shift compliance above.

Appendix
Health Service Performance Report December 2015 60
HR User Group
Inaugural meeting held on Tuesday 18th January with a review of HR suggestions received
through the Inspire hub.
LRA Adjudication – Dentists
An arbitration process, under the provisions of LRA was conducted in respect of weekly hours to
be worked by Public Health Dentists, post July 2015. The outcome of the process upheld the
HSE position.
HR Masterclasses 2016
Four very successful HR Masterclasses were held in 2015. For the year ahead the events are an
important opportunity to support and advance key themes in the People Strategy whilst also
supporting each of the Division’s priorities and improving our staff engagement. To ensure
strategic alignment with other Divisions, HR hosted a teleconference with organisation Partners
to agree and approach for 2016. A Masterclass on the Health Service People Strategy will be
held on 1st February whilst Dr.Michael Leiter will deliver the second HR Masterclass on 14th
April on “Engagement – Resilience& Avoiding Burnout” Workplace health.
NDTP Update
Extension of NCHD Flexible Training Scheme
The HSE-NDTP funded Flexible Training Scheme has been in existence since 2004 and
currently funds up to a maximum of 24 senior trainees to work on a 50% of full-time equivalent
basis. These posts are fully funded by NDTP and are additional to a clinical site’s complement of
NCHDs. This scheme is very popular with trainees and facilitates a number of young Doctors to
continue training whilst balancing life issues. Flexible Training is also a key recommendation of
the strategic review of medical training and career structure (MacCraith) report. The Minister for
Health has recently requested that the scheme be extended on a phased basis over a three year
period to result in a doubling of the number of places available. With effect from the next NCHD
rotation in July 2016 NDTP are funding an increase of an additional 8 flexible training places. In
addition NDTP is now extending the scheme to junior trainees from BST Year 2/ST2 training
onwards.
Absence Rates in the Health Sector to November 2015
Target Nov
2014
2014
Total
Oct
2015
Nov
2015
YTD
2015
% Medically
Certified
(November
2015)
% Medically
Certified
(YTD 2015)
Absence
Rates 3.50% 4.10% 4.27% 4.12% 4.31% 4.20% 87.78% 87%
Latest monthly figures (November 2015)
The November rate at 4.31% is up on the October rate and is the second lowest November
rate. Previous November rates were 5.37% (2008), 5.45% (2009), 4.61% (2010), 5.01%
(2011), 4.66% (2012), 4.55% (2013) and 4.10% (2014).

Appendix
Health Service Performance Report December 2015 61
Annual Rate for 2015 and Trend Analysis from 2008
Absence rates have been collected centrally since 2008 and in overall terms, there has been
a general downward trend seen over that time.
November 2015 absence rate stands at 4.31% marginally up from a rate of 4.10% for
November 2014.
The 2015 YTD rate is 4.20%, and puts the Health Services generally in‐ line with the rates
reported by ISME for large organisations in the private sector and available information for
other large public sector organisations both in Ireland and internationally. Latest NHS
England absence rates for year to July 2015 recorded an overall rate of 4.25%. Scotland’s
NHS absence rate for similar period was 5.04% while in Wales the rate recorded was 5.0%
Annual rates; 2008 – 5.76%, 2009 – 5.05%, 2010 – 4.70%, 2011 – 4.90%, 2012 – 4.79%,
2013 – 4.73%, 2014 – 4.37% and YTD 2015 – 4.20%
The notional/opportunity cost of absenteeism for the health services for 2014, using DPER
methodology, was assessed as being of the order of €150 million.

Appendix
Health Service Performance Report December 2015 62
Appendices

Appendix
Health Service Performance Report December 2015 63
Appendix 1: Hospital Groups
Hospital Hospital
Irela
nd
East
Ho
sp
ital
Gro
up
Cappagh National Orthopaedic Hospital
Du
blin
Mid
lan
ds H
os
pit
al
Gro
up
Coombe Women and Infants University Hospital
Mater Misericordiae University Hospital Midland Regional Hospital – Portlaoise
Midland Regional Hospital – Mullingar Midland Regional Hospital – Tullamore
National Maternity Hospital Holles Street Naas General Hospital
Our Lady’s Hospital – Navan St James Hospital
Royal Victoria Eye and Ear Hospital Dublin Tallaght Hospital
St. Columcille's Hospital Loughlinstown
So
uth
/ S
ou
th W
est
Ho
sp
ital G
rou
p
Bantry General Hospital
St. Luke's Hospital Kilkenny Cork University Hospital
St Michael's Hospital Dun Laoghaire Kerry General Hospital
St Vincent’s University Hospital Elm Park Lourdes Orthopaedic Hospital Kilcreene
Wexford General Hospital Mallow General Hospital
RC
SI
Ho
sp
ital G
rou
p
Beaumont Hospital including St Josephs Mercy University Hospital Cork
Cavan General Hospital South Tipperary General Hospital
Connolly Hospital South Infirmary University Hospital Cork
Our Lady of Lourdes Hospital Drogheda Waterford Regional Hospital
Rotunda Hospital
Sao
lta H
os
pit
al G
rou
p
Galway University Hospitals
Un
ivers
ity o
f L
imeri
ck H
os
pit
al
Gro
up
Croom Hospital Letterkenny General Hospital
Ennis Hospital Portiuncula Hospital General & Maternity Ballinasloe
Nenagh Hospital Mayo General Hospital
St John's Hospital Roscommon County Hospital
University Hospital, Limerick Sligo General Hospital
University Maternity Hospital
Ch
ild
ren
's
Ho
sp
ital
Gro
up
Children's University Hospital Temple Street
Our Lady's Hospital for Sick Children Crumlin
National Children’s Hospital, Tallaght

Appendix
Health Service Performance Report December 2015 64
Appendix 2: Community Health Organisations Community Health Organisations
Areas included CHO’s Areas included CHO’s
CH
O 1
Cavan
CH
O 6
Dublin South East
Monaghan Dun Laoghaire
Donegal Wicklow
Sligo
CH
O 7
Dublin South City
Leitrim Dublin West
CH
O 2
Galway Dublin South West
Roscommon Kildare
Mayo West Wicklow
CH
O 3
Clare
CH
O 8
Laois
Limerick Offaly
North Tipperary Longford
East Limerick Westmeath
CH
O 4
North Cork Louth
North Lee Meath
South Lee
CH
O 9
Dublin North Central
West Cork Dublin North West
Kerry Dublin North
CH
O 5
Waterford
Wexford
Carlow
Kilkenny
Tipperary South