Embed Size (px)
Citation preview

Modeling Entrained Flow Gasifiers
Mike BockelieMartin Denison, Dave Swensen, Connie Senior, Adel Sarofim
Reaction Engineering International
2010 Workshop on Multiphase Flow ScienceMay 4-6, 2010, Pittsburgh, PA USA
2
Acknowledgement“This material is based upon work supported by the Department of Energy under
award number DE-FC26-00FNT41047 and DE-FC26-05NT42444”
Vision 21 Program“Computational Workbench Environment for Virtual Power Plant Simulation”DOE NETL (COR=John Wimer, Bill Rogers, DE-FC26-00FNT41047)
Clean Coal R+D Project“A Virtual Engineering Framework for Simulating Advanced Power Systems”DOE NETL (COR=Ron Breault, DE-FC26-05NT42444 )
"This report was prepared as an account of work sponsored by an agency of the United States Government. Neither the United States Government nor any agency thereof, nor any of their employees, makes any warranty, express or implied, or assumes any legal liability or responsibility for the accuracy, completeness, or usefulness of any information, apparatus, product, or process disclosed, or represents that its use would not infringe privately owned rights. Reference herein to any specific commercial product, process, or service by trade name, trademark, manufacturer, or otherwise does not necessarily constitute or imply its endorsement, recommendation, or favoring by the United States Government or any agency thereof. The views and opinions of authors expressed herein do not necessarily state or reflect those of the United States Government or any agency thereof.“
3
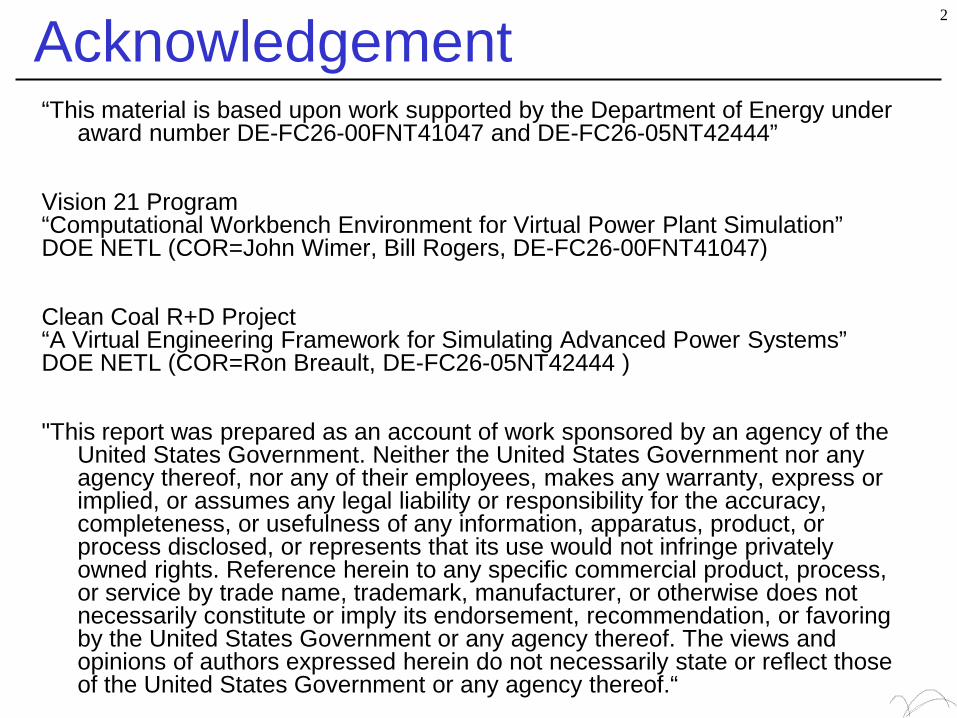
Advanced Power Systems
[J. Phillips, “IGCC 101”, GTC 2009] http://www.gasification.org/library/overview.aspx
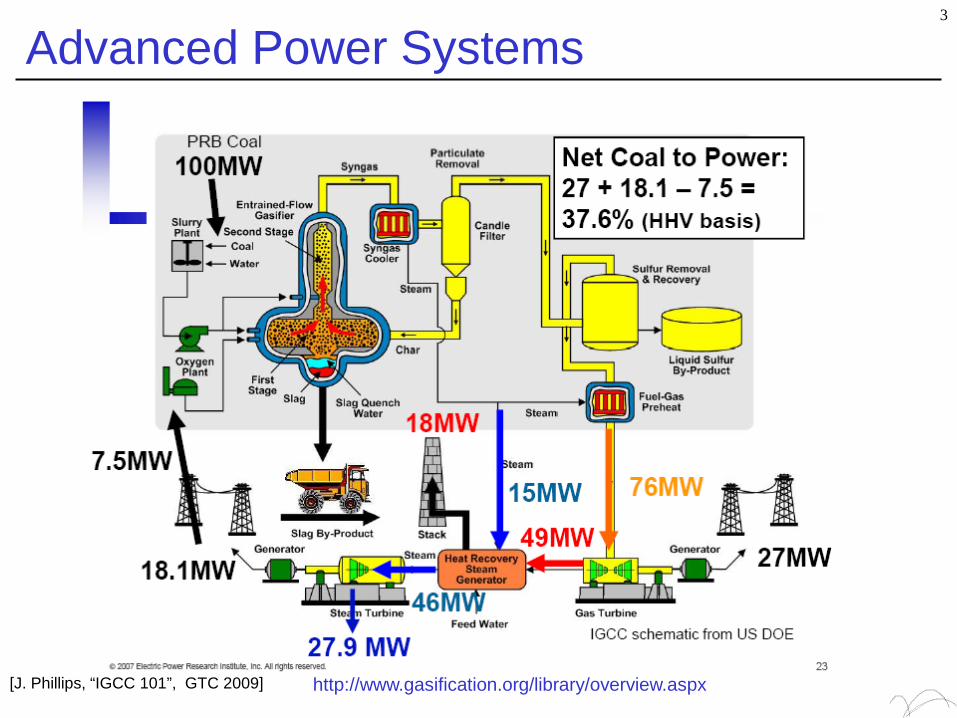
Why Use Modeling?
Cost effective approach for evaluating performance, operational impacts & emissions
Improve understanding
Estimate performance
Assist with conceptual design
Identify operational problems
Cheaper than testing
More detailed information than testing
Helps engineers make better, more informed decisions
4
5
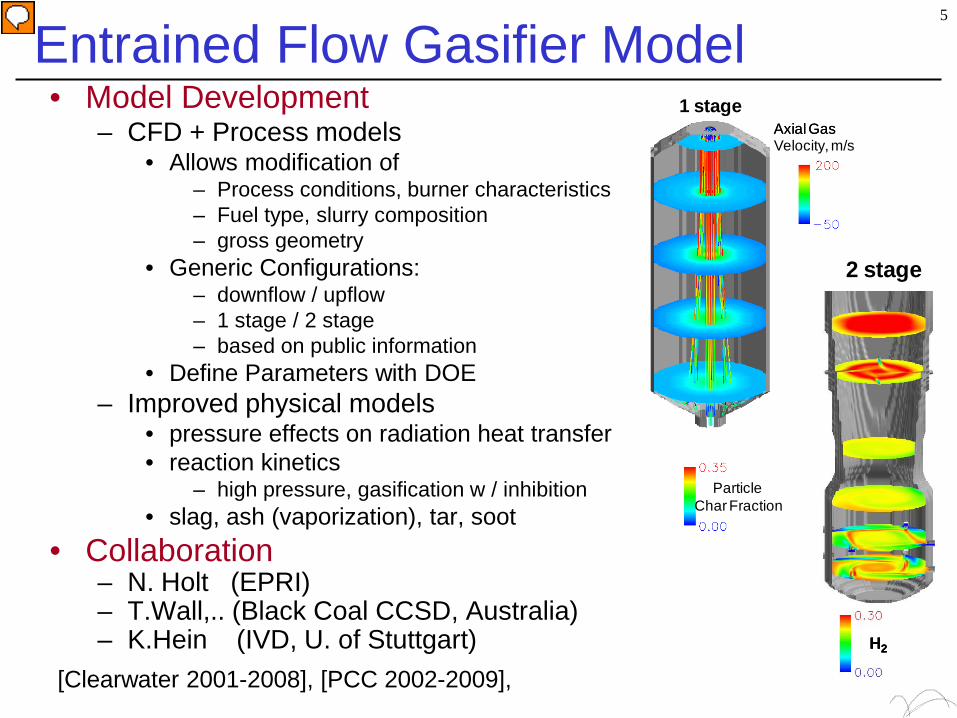
Entrained Flow Gasifier Model• Model Development
– CFD + Process models• Allows modification of
– Process conditions, burner characteristics– Fuel type, slurry composition– gross geometry
• Generic Configurations: – downflow / upflow– 1 stage / 2 stage – based on public information
• Define Parameters with DOE– Improved physical models
• pressure effects on radiation heat transfer • reaction kinetics
– high pressure, gasification w / inhibition • slag, ash (vaporization), tar, soot
• Collaboration– N. Holt (EPRI)– T.Wall,.. (Black Coal CCSD, Australia) – K.Hein (IVD, U. of Stuttgart)
[Clearwater 2001-2008], [PCC 2002-2009],
Axial Gas Velocity, m/sAxial Gas
Particle Char Fraction
1 stage
H2H2H2
2 stage
Glacier Software
• Glacier is REI’s in-house, CFD-based combustion simulation software
• Over 30 years of development• Over 15 years of industrial application• Designed to handle “real-world” applications
– Judicious choice of sub-models & numerics– Qualified modelers
6
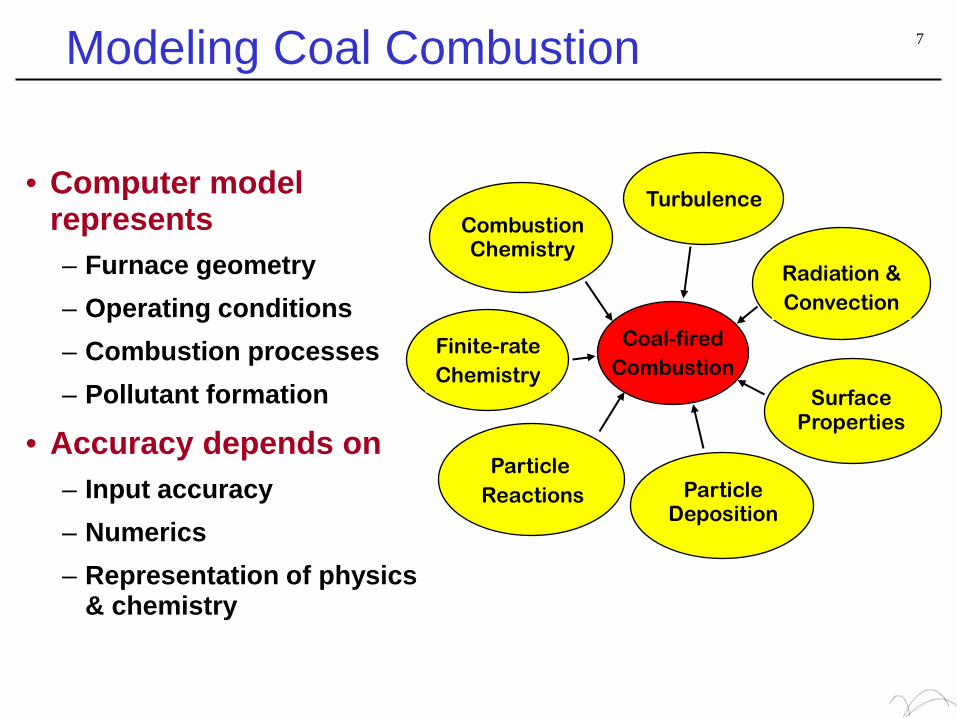
Modeling Coal Combustion
• Computer model represents– Furnace geometry – Operating conditions– Combustion processes– Pollutant formation
• Accuracy depends on– Input accuracy– Numerics– Representation of physics
& chemistry
Turbulence
Radiation &Convection
Surface Properties
Particle Deposition
Combustion Chemistry
Coal-firedCombustion
Finite-rateChemistry
Particle Reactions
7
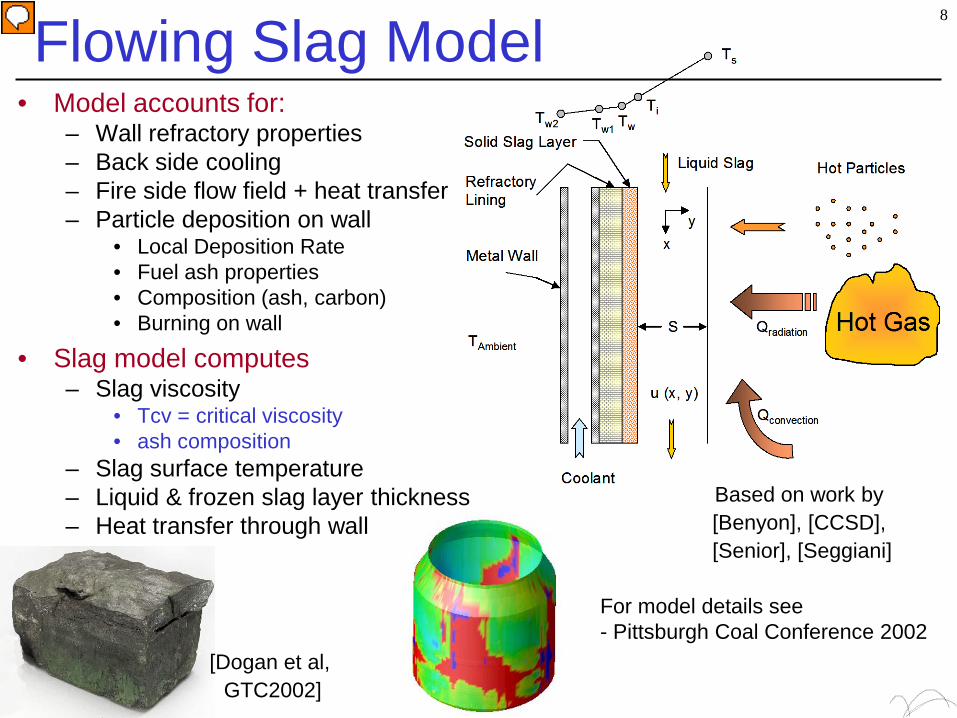
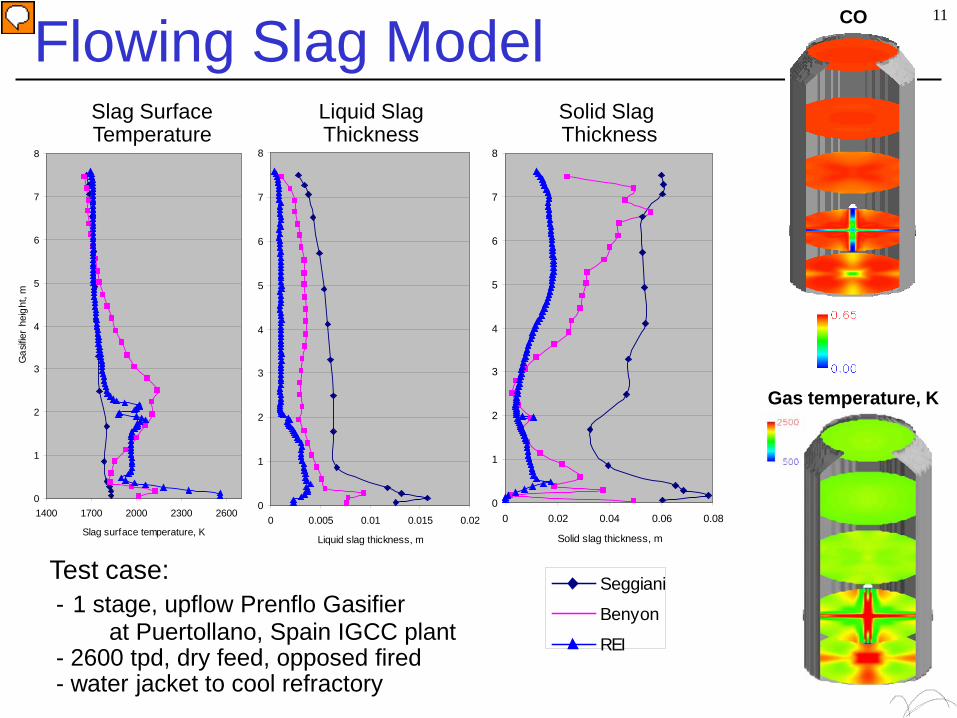
Flowing Slag Model• Model accounts for:
– Wall refractory properties– Back side cooling– Fire side flow field + heat transfer– Particle deposition on wall
• Local Deposition Rate• Fuel ash properties• Composition (ash, carbon)• Burning on wall
• Slag model computes– Slag viscosity
• Tcv = critical viscosity• ash composition
– Slag surface temperature– Liquid & frozen slag layer thickness– Heat transfer through wall
Based on work by [Benyon], [CCSD], [Senior], [Seggiani]
[Dogan et al, GTC2002]
For model details see - Pittsburgh Coal Conference 2002
8
9
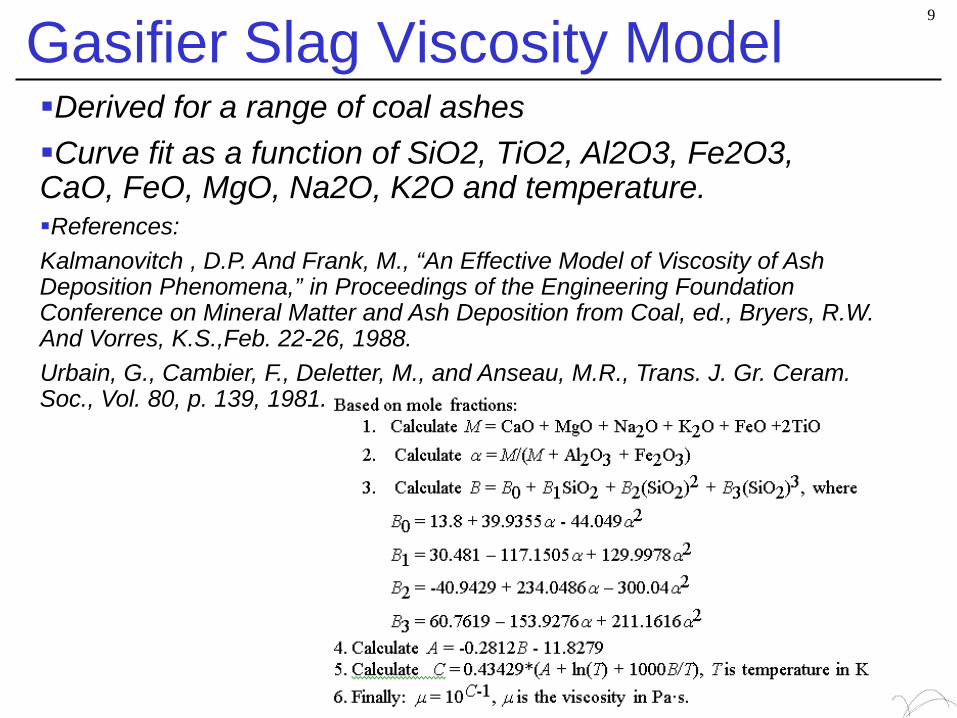
Gasifier Slag Viscosity ModelDerived for a range of coal ashesCurve fit as a function of SiO2, TiO2, Al2O3, Fe2O3, CaO, FeO, MgO, Na2O, K2O and temperature.References:Kalmanovitch , D.P. And Frank, M., “An Effective Model of Viscosity of Ash Deposition Phenomena,” in Proceedings of the Engineering Foundation Conference on Mineral Matter and Ash Deposition from Coal, ed., Bryers, R.W. And Vorres, K.S.,Feb. 22-26, 1988.Urbain, G., Cambier, F., Deletter, M., and Anseau, M.R., Trans. J. Gr. Ceram. Soc., Vol. 80, p. 139, 1981.
10
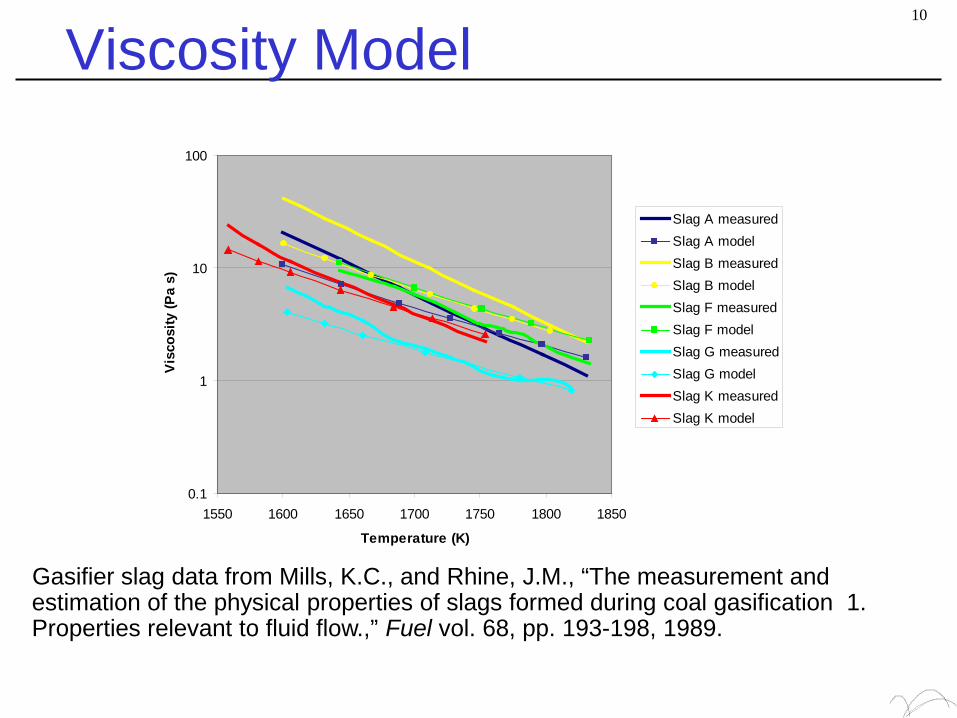
Viscosity Model
Gasifier slag data from Mills, K.C., and Rhine, J.M., “The measurement and estimation of the physical properties of slags formed during coal gasification 1. Properties relevant to fluid flow.,” Fuel vol. 68, pp. 193-198, 1989.
0.1
1
10
100
1550 1600 1650 1700 1750 1800 1850
Temperature (K)
Visc
osity
(Pa
s)
Slag A measuredSlag A modelSlag B measuredSlag B modelSlag F measuredSlag F modelSlag G measuredSlag G modelSlag K measuredSlag K model
Flowing Slag Model
0
1
2
3
4
5
6
7
8
1400 1700 2000 2300 2600
Slag surface temperature, K
Gas
ifier
heig
ht, m
0
1
2
3
4
5
6
7
8
0 0.005 0.01 0.015 0.02
Liquid slag thickness, m
0
1
2
3
4
5
6
7
8
0 0.02 0.04 0.06 0.08
Solid slag thickness, m
Seggiani
Benyon
REI
Test case: - 1 stage, upflow Prenflo Gasifier
at Puertollano, Spain IGCC plant- 2600 tpd, dry feed, opposed fired- water jacket to cool refractory
Slag SurfaceTemperature
Liquid SlagThickness
Solid Slag Thickness
Gas temperature, K
CO 11
12
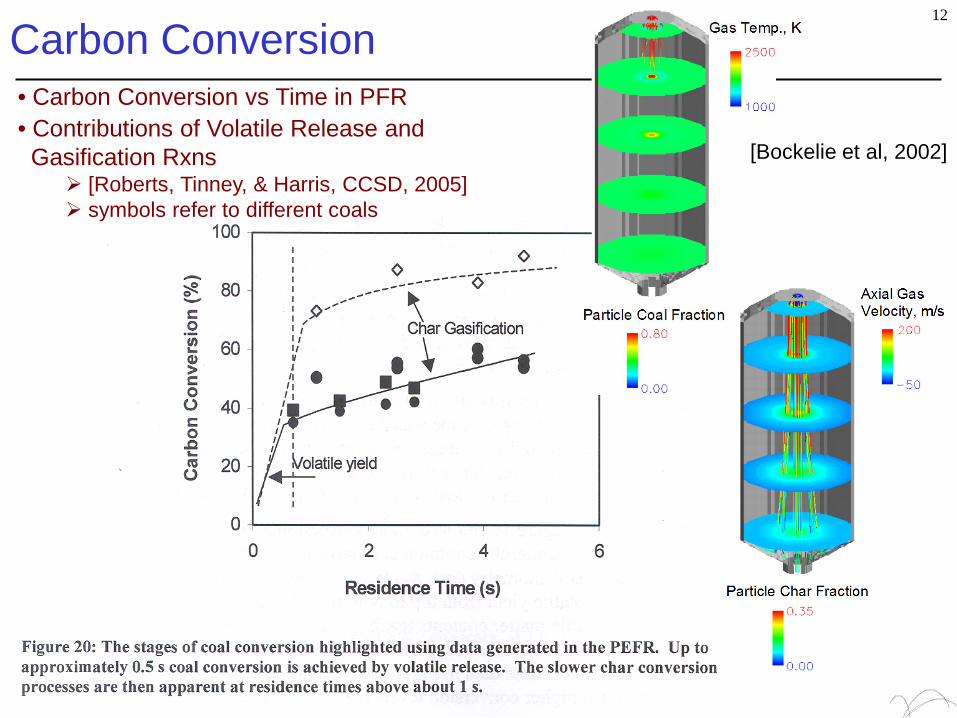
Carbon Conversion• Carbon Conversion vs Time in PFR• Contributions of Volatile Release and Gasification Rxns [Roberts, Tinney, & Harris, CCSD, 2005] symbols refer to different coals
[Bockelie et al, 2002]
13
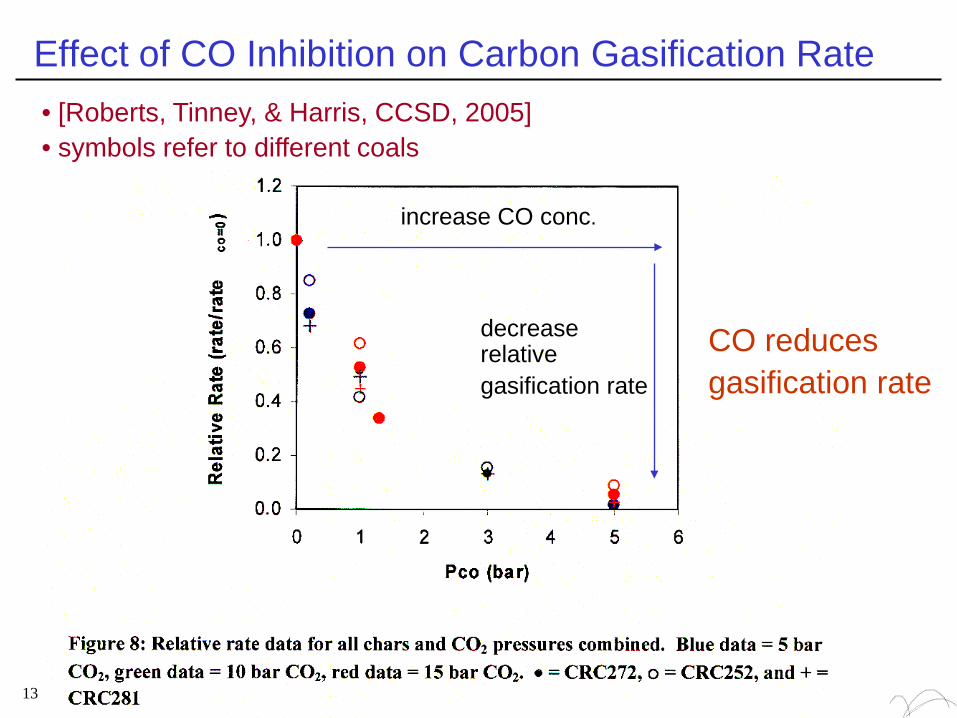
Effect of CO Inhibition on Carbon Gasification Rate• [Roberts, Tinney, & Harris, CCSD, 2005]• symbols refer to different coals
CO reduces gasification rate
increase CO conc.
decrease relative gasification rate
14
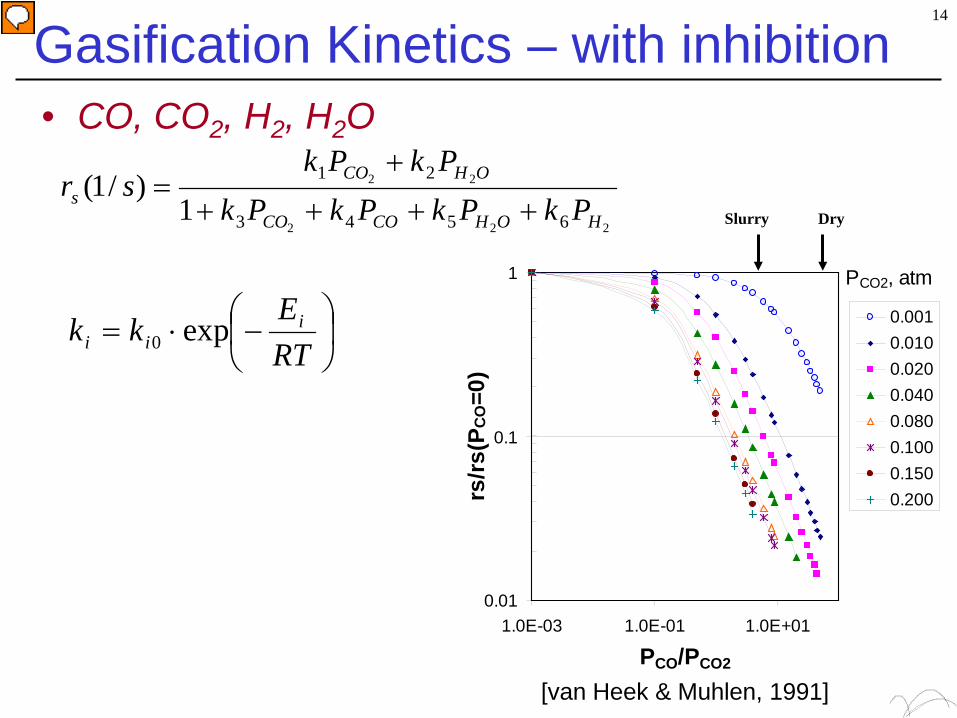
Gasification Kinetics – with inhibition• CO, CO2, H2, H2O
0.01
0.1
1
1.0E-03 1.0E-01 1.0E+01
PCO/PCO2
rs/rs
(PC
O=0
)
0.0010.0100.0200.0400.0800.1000.1500.200
PCO2, atm
1600K, 60 atm
DrySlurry
[van Heek & Muhlen, 1991]
222
22
6543
21
1)/1(
HOHCOCO
OHCOs PkPkPkPk
PkPksr
++++
+=
−⋅=
RTEkk i
ii exp0
15
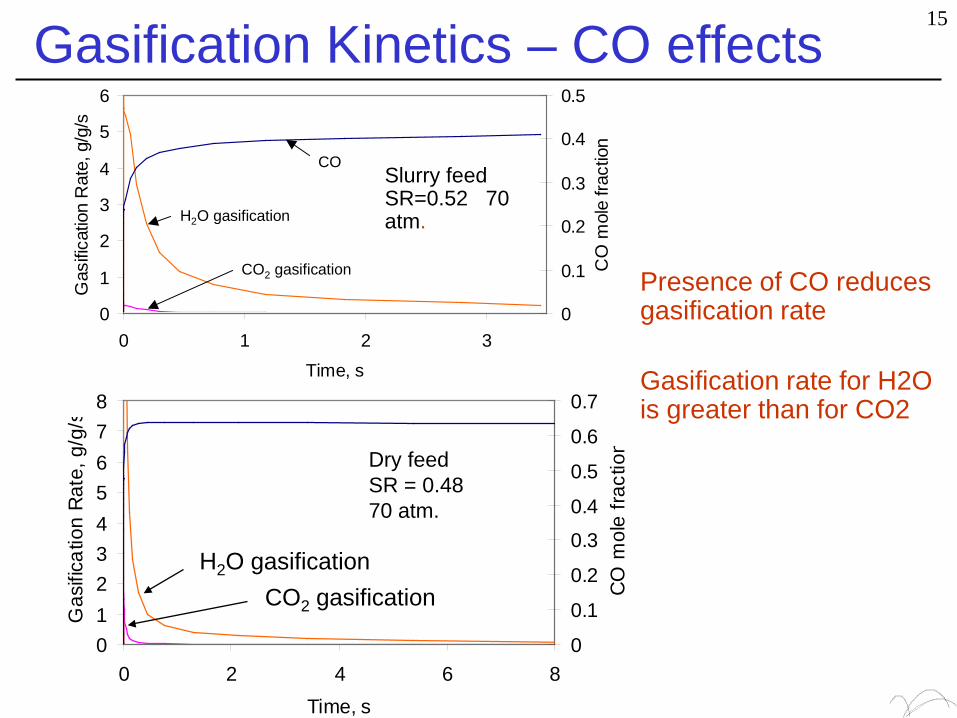
Gasification Kinetics – CO effects
0
1
2
3
4
5
6
0 1 2 3Time, s
Gas
ifica
tion
Rat
e, g
/g/s
0
0.1
0.2
0.3
0.4
0.5
CO
mol
e fra
ctio
n
H2O gasification
CO2 gasification
CO
0
1
2
3
4
5
6
0 1 2 3Time, s
Gas
ifica
tion
Rat
e, g
/g/s
0
0.1
0.2
0.3
0.4
0.5
CO
mol
e fra
ctio
n
H2O gasification
CO2 gasification
COSlurry feed SR=0.52 70 atm.
012345678
0 2 4 6 8Time, s
Gas
ifica
tion
Rat
e, g
/g/s
0
0.1
0.2
0.3
0.4
0.5
0.6
0.7
CO
mol
e fra
ctio
n
H2O gasificationCO2 gasification
Dry feedSR = 0.4870 atm.
Presence of CO reduces gasification rate
Gasification rate for H2O is greater than for CO2
16
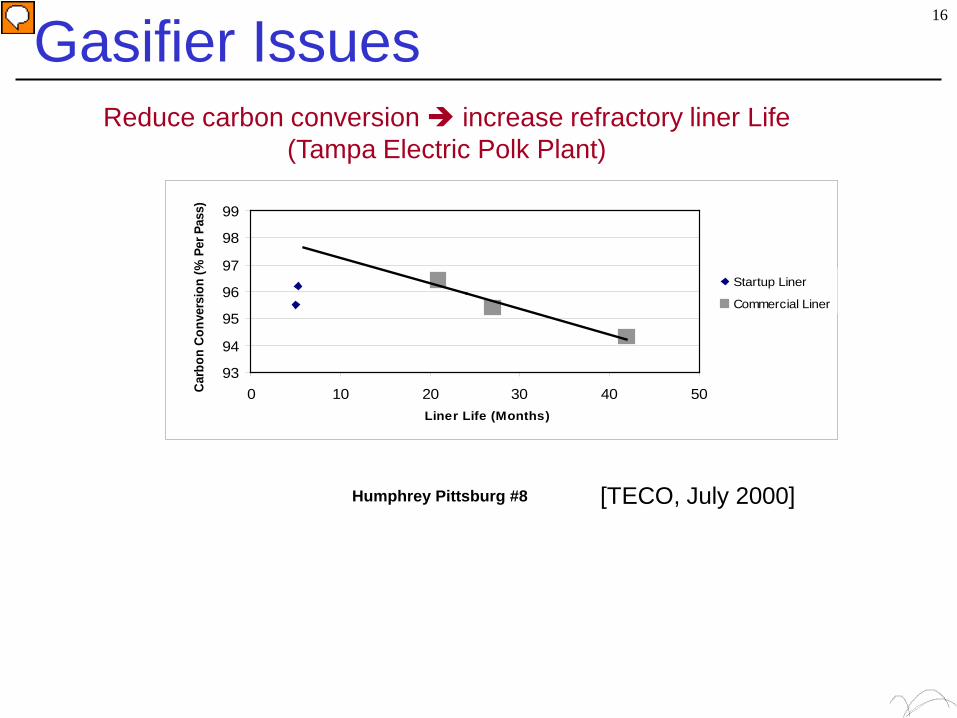
Humphrey Pittsburg #8
93
94
95
96
97
98
99
0 10 20 30 40 50Liner Life (Months)
Carb
on C
onve
rsio
n (%
Per
Pas
s)
Startup Liner
Commercial Liner
Reduce carbon conversion increase refractory liner Life (Tampa Electric Polk Plant)
[TECO, July 2000]
Gasifier Issues
17
70
75
80
85
90
95
100
0 1 2 3 4
Residence time, s
Carb
on C
onve
rsio
n, %
1531 K, SR = 0.451707 K, SR = 0.521797 K, SR = 0.57
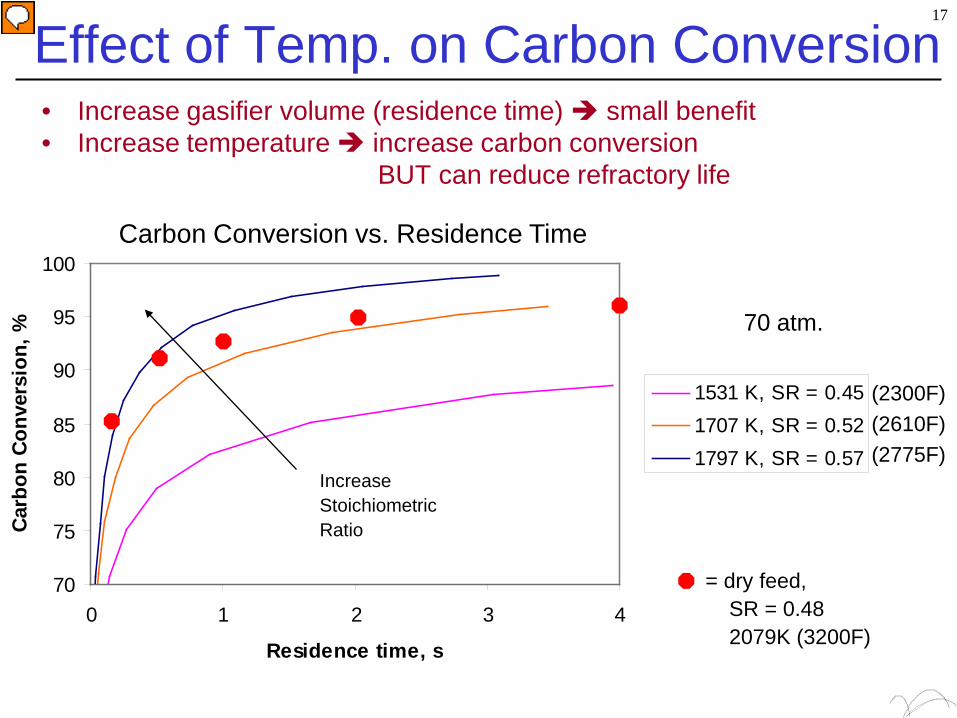
Effect of Temp. on Carbon Conversion• Increase gasifier volume (residence time) small benefit• Increase temperature increase carbon conversion
BUT can reduce refractory life
(2300F)(2610F)(2775F)
70 atm.
Carbon Conversion vs. Residence Time
Increase StoichiometricRatio
= dry feed, SR = 0.482079K (3200F)
Tar & Soot Model
• Semiempirical model*– Coal-derived soot is assumed to form from only tar.– Tar yields is calculated by CPD model† based on
measured coal characteristics.– Three equations for conservation of the mass of soot
and tar, and the number of soot particles.
* Brown, A.L.; Fletcher, T.H. Energy Fuels 1998, 12, 745-757.† Fletcher, T.H.; Kerstein, A. R.; Pugmire, R. J.; Solum, M. S.; Grant, D. M. Energy Fuels 1992, 6, 414-431.
18

19
Assumed Soot Formation Mechanism
Coal Tar
Light Gas
Char
Soot AgglomeratesPrimary Soot
Light GasDevolatilization
Formation
Gasification
Agglomeration
Brown, A.L.; Fletcher, T.H. Energy Fuels 1998, 12, 745-757.
CPD Soot Model
Motivation:1. Coal-derived soot undergoes different mechanism than
gaseous fuel (limited acetylene involvement)2. The sum of soot and tar is relatively constant during
pyrolysis.
20
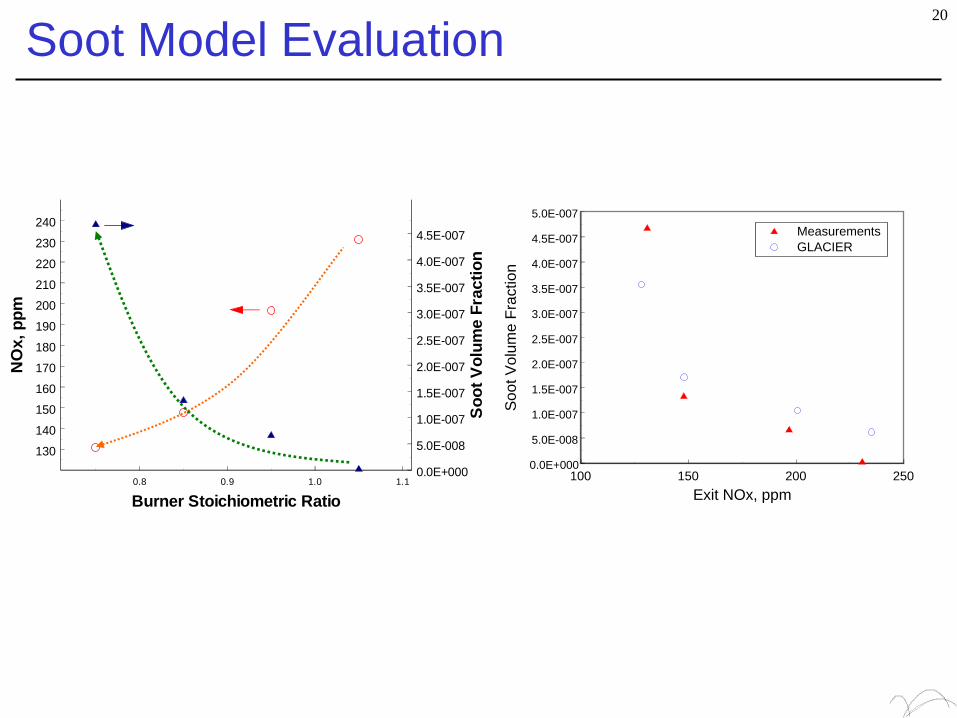
Soot Model Evaluation
0.8 0.9 1.0 1.1
Burner Stoichiometric Ratio
130
140
150
160
170
180
190
200
210
220
230
240
NO
x, p
pm
0.0E+000
5.0E-008
1.0E-007
1.5E-007
2.0E-007
2.5E-007
3.0E-007
3.5E-007
4.0E-007
4.5E-007
Soot
Vol
ume
Frac
tion
100 150 200 250Exit NOx, ppm
0.0E+000
5.0E-008
1.0E-007
1.5E-007
2.0E-007
2.5E-007
3.0E-007
3.5E-007
4.0E-007
4.5E-007
5.0E-007
Soot
Vol
ume
Frac
tion
MeasurementsGLACIER
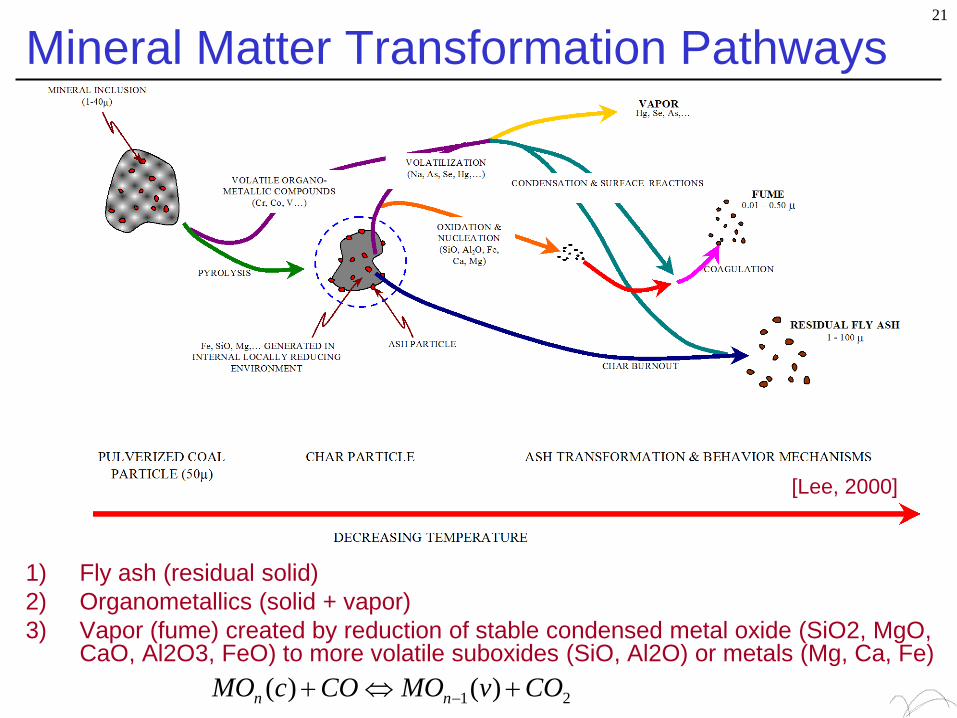
Mineral Matter Transformation Pathways
1) Fly ash (residual solid)2) Organometallics (solid + vapor)3) Vapor (fume) created by reduction of stable condensed metal oxide (SiO2, MgO,
CaO, Al2O3, FeO) to more volatile suboxides (SiO, Al2O) or metals (Mg, Ca, Fe)
21 )()( COvMOCOcMO nn +⇔+ −
21
[Lee, 2000]
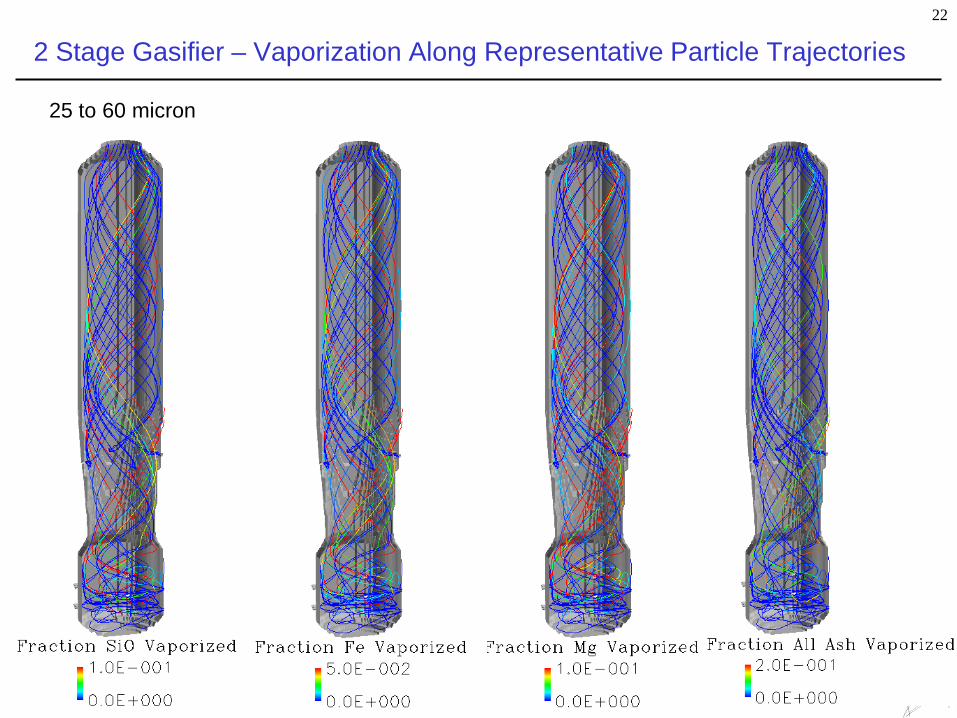
2 Stage Gasifier – Vaporization Along Representative Particle Trajectories
25 to 60 micron
22

Ash Vaporization SummaryMass Fraction of Inlet Ash Vaporized
(relative to initial total ash mass)
23
0.00E+00
5.00E-03
1.00E-02
1.50E-02
2.00E-02
2.50E-02
3.00E-02
SiO2 Al2O3 FeO CaO MgO Total
Slurry Feed
Dry Feed
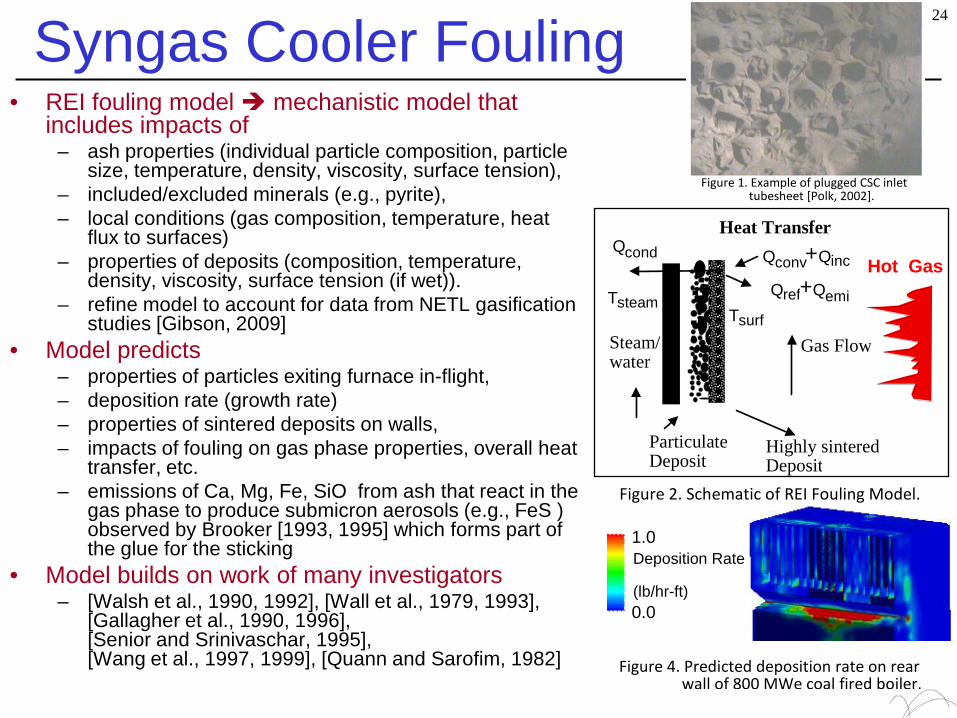
Syngas Cooler Fouling24
• REI fouling model mechanistic model that includes impacts of
– ash properties (individual particle composition, particle size, temperature, density, viscosity, surface tension),
– included/excluded minerals (e.g., pyrite),– local conditions (gas composition, temperature, heat
flux to surfaces)– properties of deposits (composition, temperature,
density, viscosity, surface tension (if wet)). – refine model to account for data from NETL gasification
studies [Gibson, 2009] • Model predicts
– properties of particles exiting furnace in-flight, – deposition rate (growth rate) – properties of sintered deposits on walls, – impacts of fouling on gas phase properties, overall heat
transfer, etc. – emissions of Ca, Mg, Fe, SiO from ash that react in the
gas phase to produce submicron aerosols (e.g., FeS ) observed by Brooker [1993, 1995] which forms part of the glue for the sticking
• Model builds on work of many investigators– [Walsh et al., 1990, 1992], [Wall et al., 1979, 1993],
[Gallagher et al., 1990, 1996], [Senior and Srinivaschar, 1995], [Wang et al., 1997, 1999], [Quann and Sarofim, 1982]
1.0
0.0
Deposition Rate
(lb/hr-ft)
Figure 4. Predicted deposition rate on rear wall of 800 MWe coal fired boiler.
Hot Gas
Gas Flow
Particulate Deposit
Highly sintered Deposit
Steam/ water
Heat Transfer
Q conv + Q inc
Q ref + Q emi
Q cond
T surf T steam
Figure 2. Schematic of REI Fouling Model.
Figure 1. Example of plugged CSC inlet tubesheet [Polk, 2002].
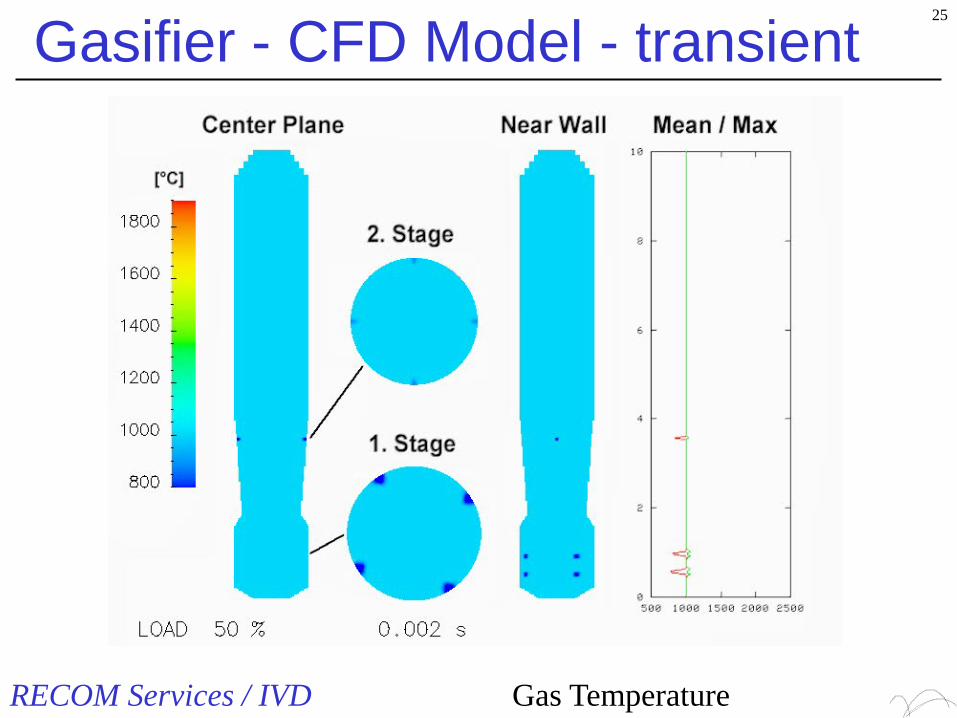
Gasifier - CFD Model - transient
RECOM Services / IVD Gas Temperature
25
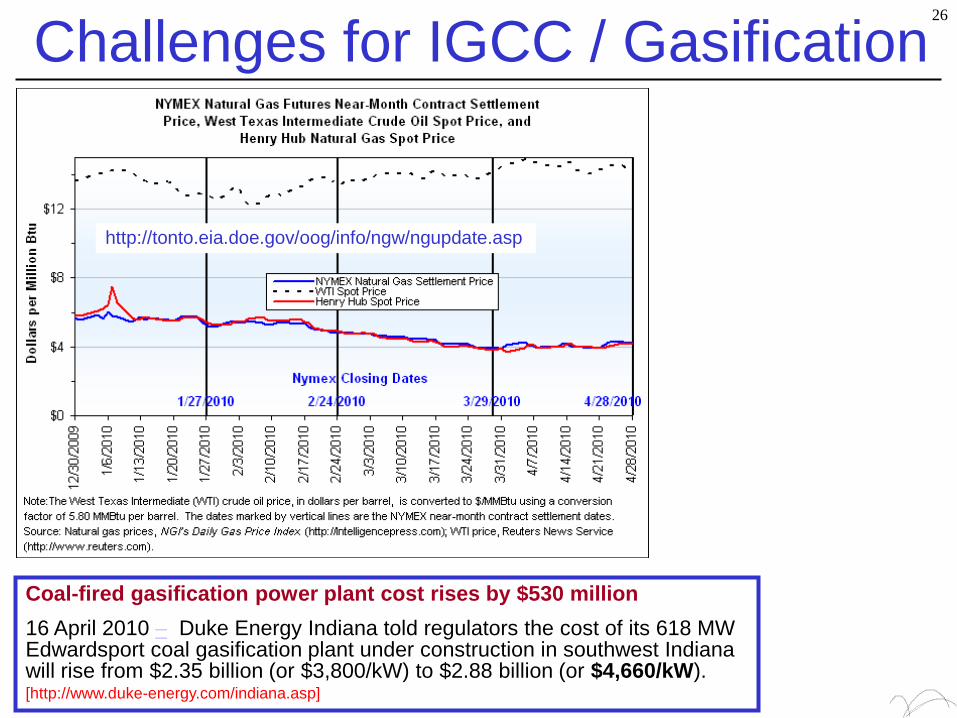
Challenges for IGCC / Gasification26
http://tonto.eia.doe.gov/oog/info/ngw/ngupdate.asp
Coal-fired gasification power plant cost rises by $530 million16 April 2010 – Duke Energy Indiana told regulators the cost of its 618 MW Edwardsport coal gasification plant under construction in southwest Indiana will rise from $2.35 billion (or $3,800/kW) to $2.88 billion (or $4,660/kW).[http://www.duke-energy.com/indiana.asp]