Embed Size (px)
Citation preview
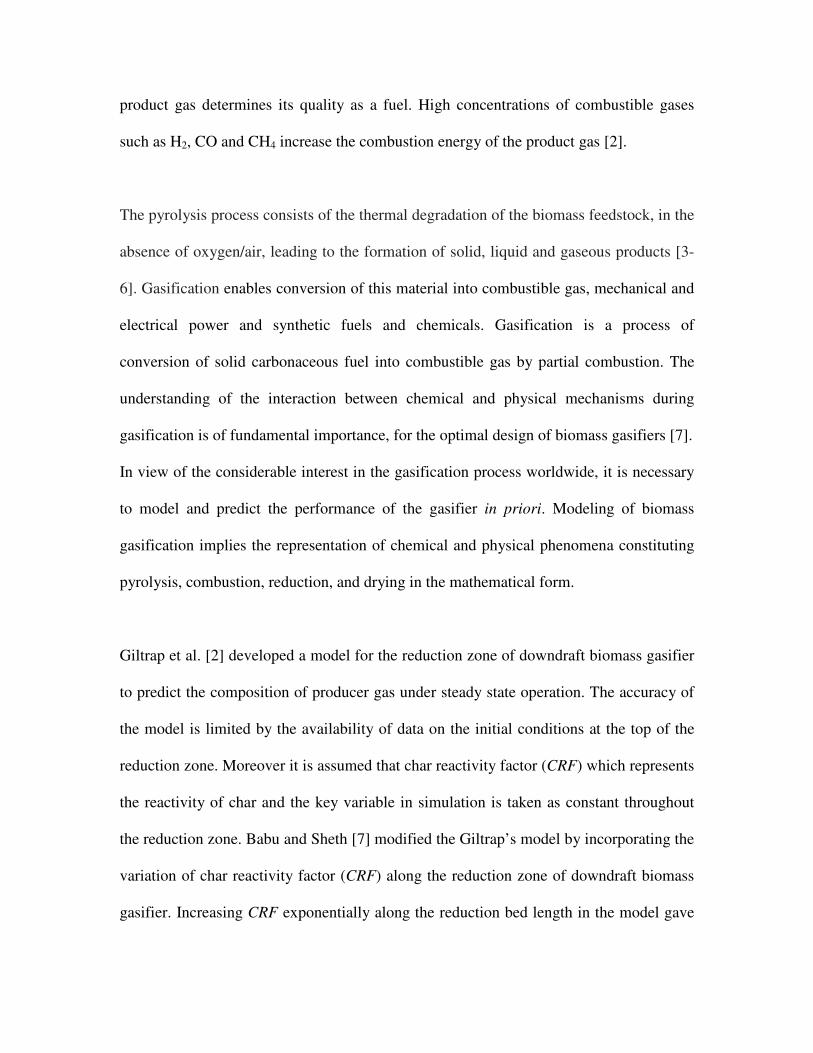
Modeling and Simulation of Reduction Zone of
Downdraft Biomass Gasifier: Effect of Air to Fuel Ratio
B.V. Babu* and Pratik N. Sheth
Department of Chemical Engineering
Birla Institute of Technology & Science
Pilani 333031 (Rajasthan) India
Abstract
Biomass mainly in the form of wood is the oldest form of energy used by humans. Biomass
generally means a relatively dry solid of natural matter that has been specifically grown or has originated as
waste or residue from handling such materials. The thermochemical conversion of biomass (pyrolysis,
gasification, combustion) is one of the most promising non-nuclear forms of future energy.
In the present study, the model reported in literature is simulated to study the effects of pyrolysis
fraction on the outlet gas concentration in a downdraft biomass gasifier. It is found that the air to fuel ratio
is one of the key parameters in the reduction zone of downdraft biomass gasifier. It effects the value of
pyrolysis fraction in the model, and indirectly proportional to the pyrolysis fraction. Steady state
composition and temperature profiles for the reduction zone of the downdraft biomass gasifier are also
predicted for various values of air to fuel ratio.
Keywords: Char Reactivity Factor; Biomass Gasification; Downdraft Gasifier; Modeling; Simulation;
Reaction Kinetics; Pyrolysis Fraction.
1. Introduction
Biomass and waste are recognized to be the major potential sources for energy
production. It is a renewable source of energy and has many advantages from an
ecological point of view [1]. Thermochemical gasification is a process for converting
solid fuels into gaseous form. The chemical energy of the solid fuel is converted into both
the thermal and chemical energy of gas. The chemical energy contained within the gas is
a function of its chemical composition. Thus the chemical composition of the
* Corresponding Author: Dean – Educational Hardware Division & Professor – Chemical Engineering
Department, B.I.T.S., PILANI-333031 (Rajasthan) INDIA.
Email: [email protected];
Home Page: http://discovery.bits-pilani.ac.in/discipline/chemical/BVb/index.html;
Phone: +91-01596-245073;
Fax: +91-01596-244183;
product gas determines its quality as a fuel. High concentrations of combustible gases
such as H2, CO and CH4 increase the combustion energy of the product gas [2].
The pyrolysis process consists of the thermal degradation of the biomass feedstock, in the
absence of oxygen/air, leading to the formation of solid, liquid and gaseous products [3-
6]. Gasification enables conversion of this material into combustible gas, mechanical and
electrical power and synthetic fuels and chemicals. Gasification is a process of
conversion of solid carbonaceous fuel into combustible gas by partial combustion. The
understanding of the interaction between chemical and physical mechanisms during
gasification is of fundamental importance, for the optimal design of biomass gasifiers [7].
In view of the considerable interest in the gasification process worldwide, it is necessary
to model and predict the performance of the gasifier in priori. Modeling of biomass
gasification implies the representation of chemical and physical phenomena constituting
pyrolysis, combustion, reduction, and drying in the mathematical form.
Giltrap et al. [2] developed a model for the reduction zone of downdraft biomass gasifier
to predict the composition of producer gas under steady state operation. The accuracy of
the model is limited by the availability of data on the initial conditions at the top of the
reduction zone. Moreover it is assumed that char reactivity factor (CRF) which represents
the reactivity of char and the key variable in simulation is taken as constant throughout
the reduction zone. Babu and Sheth [7] modified the Giltrap’s model by incorporating the
variation of char reactivity factor (CRF) along the reduction zone of downdraft biomass
gasifier. Increasing CRF exponentially along the reduction bed length in the model gave
better prediction of temperature and composition profiles when compared with the
experimental data and earlier models reported in literature. Dogru et al. [8] performed the
gasification of hazelnut shells in a pilot scale (5 kWe) downdraft gasifier with different air to
fuel ratio. In the present study, steady state model modified by Babu and Sheth [7] is
simulated with finite difference method to predict the temperature and composition
profiles in the reduction zone. The model predictions are compared with the experimental
data reported by Dogru et al. [8].
Nomenclature
A Cylindrical bed area (m2)
Ai Frequency Factor for reaction i (sec-1)
cx Molar heat capacity ( J/mol K)
CRF Char reactivity factor
Ei Activation Energy of reaction i (Joules /mol K)
fp Fraction of pyrolysis
Ki Equilibrium constant of reaction I
Ln Normalized Length
Lin Initial normalized length at which 85 % of the total composition change
nx Molar density of species x ( mol/m3)
n Summation of nx of all species
Px Partial pressure of gaseous species x (Pa)
ri Rate of reaction i (mol/m3sec)
Rx Rate of formation of species x (mol/m3sec)
R Gas constant (J/mol K)
T Temperature (K)
v Superficial gas velocity (m/sec)
z Axial distance (m)
Greek Letters ρ Density (kg/m
3)
Subscript x Species N2,CO2,CO,CH4,H2O,H2
i Reaction number
2. Model
Giltrap et al. [2] proposed a phenomenological model of downdraft gasification under
steady state operation for reduction zone of the biomass gasifier. The pyrolysis and
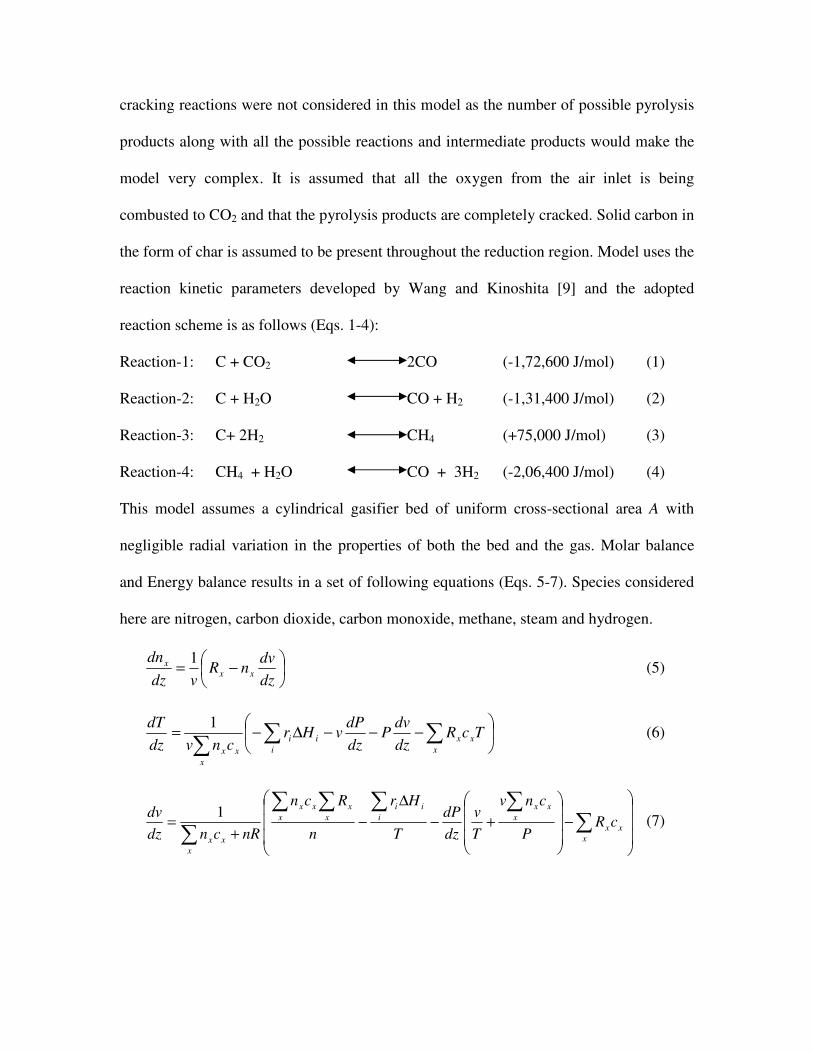
cracking reactions were not considered in this model as the number of possible pyrolysis
products along with all the possible reactions and intermediate products would make the
model very complex. It is assumed that all the oxygen from the air inlet is being
combusted to CO2 and that the pyrolysis products are completely cracked. Solid carbon in
the form of char is assumed to be present throughout the reduction region. Model uses the
reaction kinetic parameters developed by Wang and Kinoshita [9] and the adopted
reaction scheme is as follows (Eqs. 1-4):
Reaction-1: C + CO2 2CO (-1,72,600 J/mol) (1)
Reaction-2: C + H2O CO + H2 (-1,31,400 J/mol) (2)
Reaction-3: C+ 2H2 CH4 (+75,000 J/mol) (3)
Reaction-4: CH4 + H2O CO + 3H2 (-2,06,400 J/mol) (4)
This model assumes a cylindrical gasifier bed of uniform cross-sectional area A with
negligible radial variation in the properties of both the bed and the gas. Molar balance
and Energy balance results in a set of following equations (Eqs. 5-7). Species considered
here are nitrogen, carbon dioxide, carbon monoxide, methane, steam and hydrogen.
−=
dz
dvnR
vdz
dnxx
x 1 (5)
−−−∆−= ∑∑
∑ x
xx
i
ii
x
xx
TcRdz
dvP
dz
dPvHr
cnvdz
dT 1
(6)
−
+−
∆
−+
= ∑∑∑∑∑
∑ x
xx
x
xx
i
ii
x
x
x
xx
x
xx
cRP
cnv
T
v
dz
dP
T
Hr
n
Rcn
nRcndz
dv 1 (7)
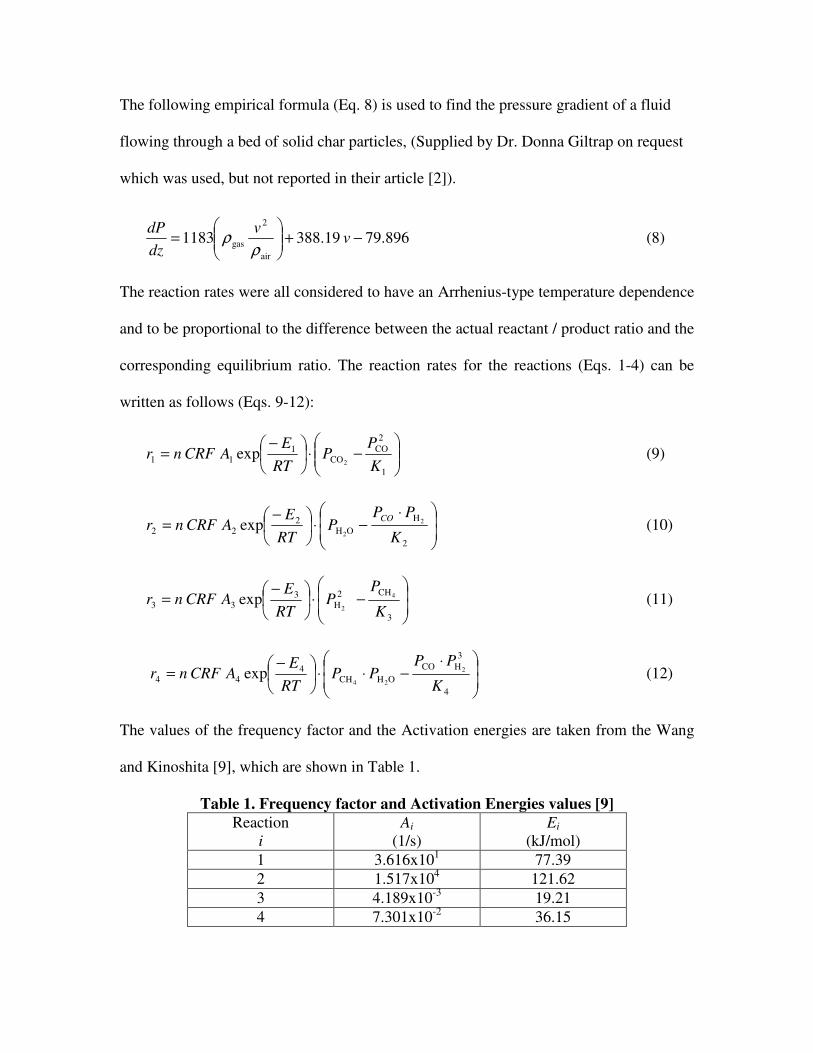
The following empirical formula (Eq. 8) is used to find the pressure gradient of a fluid
flowing through a bed of solid char particles, (Supplied by Dr. Donna Giltrap on request
which was used, but not reported in their article [2]).
896.79 19.3881183air
2
gas −+
= v
v
dz
dP
ρρ (8)
The reaction rates were all considered to have an Arrhenius-type temperature dependence
and to be proportional to the difference between the actual reactant / product ratio and the
corresponding equilibrium ratio. The reaction rates for the reactions (Eqs. 1-4) can be
written as follows (Eqs. 9-12):
exp 1
2
CO
CO1
11 2
−⋅
−=
K
PP
RT
EACRFnr (9)
⋅−⋅
−=
2
H
OH2
222
2exp
K
PPP
RT
EACRFnr
CO (10)
exp 3
CH2
H3
334
2
−⋅
−=
K
PP
RT
EACRFnr (11)
⋅−⋅⋅
−=
4
3
HCO
OHCH4
442
24exp
K
PPPP
RT
EACRFnr (12)
The values of the frequency factor and the Activation energies are taken from the Wang
and Kinoshita [9], which are shown in Table 1.
Table 1. Frequency factor and Activation Energies values [9]
Reaction
i
Ai
(1/s)
Ei
(kJ/mol)
1 3.616x101
77.39
2 1.517x10⁴ 121.62
3 4.189x10⁻³
19.21
4 7.301x10⁻²
36.15

In the reduction zone, endothermic reactions are carried out and the degree of
temperature drop depends upon the extent of reactions. The extent of reaction depends
upon the reactivity of char, which is represented by Char Reactivity Factor (CRF) value.
CRF in turn depends upon thermal history, degree of burn-off, and number of active sites
on char and its particle size. As char moves downwards in the reduction zone, the degree
of burn-off increases. Due to char-gas reactions and shrinking of particles, char size
decreases and porosity increases so gases would come across more active sites and extent
of reaction increases. For higher CRF value, reduction zone temperature drops faster and
reaction completion occurs rapidly. Due to this, the gas compositions predicted by the
model are changed in the initial length of reduction zone only. Above understanding
leads to the fact that CRF value must be increased along the length of the reduction zone.
Quantitative increment in CRF value depends upon the type of biomass and its physical
characteristics. Giltrap et al. [2] simulated for constant CRF value for the entire reduction
zone. In their work, they varied the CRF value of 1 to 10000 and the results of simulation
are compared with the final composition of the producer gas with the data reported in
literature. But temperature and composition profiles are not compared.
Babu and Sheth [7] varied the CRF value of 1 to 10000 linearly and exponentially and
their effects on composition and temperature profiles are observed. When exponential
increment in CRF value is used in the simulation, it predicted the temperature and
composition profiles better when compared with the experimental data reported by Jayah
et al. [10]. The results of exponentially varying CRF are quite satisfactory and realistic.

In addition, the composition profile changes over the entire length of the bed of reduction
zone [7].
3. Method of solution and simulation of model equations
Eq. (5) to (8) gives a set of nine first order differential equations in the system variables
nx (where x denotes the six different gas species considered), P, v, and T that is solved by
explicit finite difference method [11, 12].
3.1 Initial Conditions
The initial position in this model is the top of reduction region and the end of oxidation
zone. Gases coming from the oxidation zone are a mixture of pyrolysed gas,
incombustible CO2 and inert N2. The exact proportion of each of these components
depends upon the rate of air flowing into the gasifier relative to the rates of combustion,
pyrolysis and cracking reactions. Instead of calculating this directly, Giltrap et al. [2]
introduced a variable ‘pyrolysis fraction’ (fp), which can vary from 0 (no pyrolysis
products) to 1 (pyrolysis products only). The air flowing into the gasifier is a mixture of
N2 and O2. It is assumed that all O2 from air inlet had been consumed by combustion
reactions with the char while N2 remains inert. The pyrolysis products are assumed to
crack into an equivalent amount of CO, CH4 and H2O for a typical biomass.
Initial velocity, pressure and temperature for the model would be of gas coming out of the
oxidation zone. The velocity has been approximated from the airflow rate and the throat
dimensions reported by Dogru et al. [8]. The operating pressure does not affect the
gasification efficiency significantly. Increase of the pressure is limited on two counts: (1)
due to the amount of entrained dust (the gas, being denser, exerts a higher thrust on the
dust particles), and (2) by the increased cost of manufacturing [13]. Due to these
limitations and to overcome the pressure drop offered by the bed, operating pressure
should be above the atmospheric pressure. The value has to be found out by
approximating the pressure drop in the bed. The value of 1.005 atm is used in simulations
and check has been made that pressure at the outlet remains above atmospheric [7].
Table 2 shows the values of the parameters used in two different model simulations. In
Table 2, bed length, velocity, temperature, moisture content, and air-to-fuel ratio (S.Nos.
1-5) are taken to be the same as reported by Dogru et al. [8]. Other parameters (CRF and
fp) are new ones that are incorporated in the present proposed model.
Table 2. Parameters used in the model simulation [8]
S No Parameters Values (Run 7) Values (Run 11)
1 Bed Length 11.5 cm 11.5 cm
2 v initial 0.426963 m/sec 0.579471 m/sec
3 T initial 1293 K 1293 K
4 Moisture Content 12 % (wet basis) 12 % (wet basis)
5 Air-to-Fuel ratio 1.47 1.5
6 CRF Exponentially varying Exponentially varying
7 fp 0.25 0.2 & 0.25
4. Results and Discussion
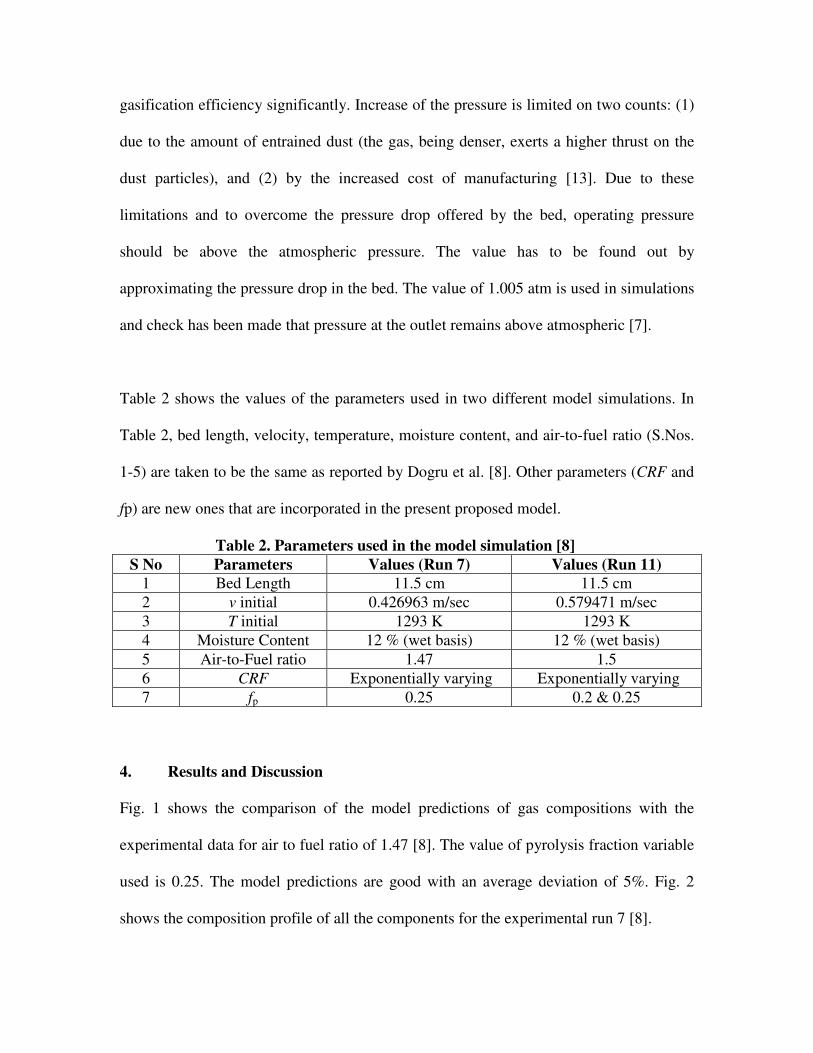
Fig. 1 shows the comparison of the model predictions of gas compositions with the
experimental data for air to fuel ratio of 1.47 [8]. The value of pyrolysis fraction variable
used is 0.25. The model predictions are good with an average deviation of 5%. Fig. 2
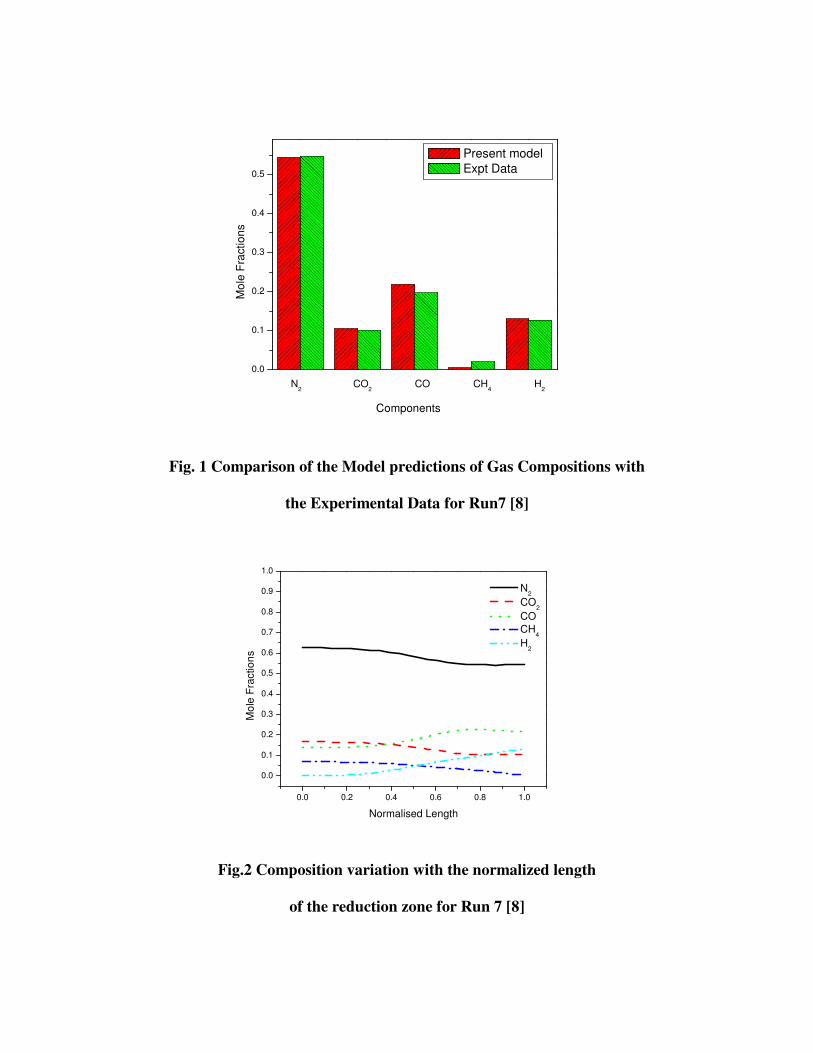
shows the composition profile of all the components for the experimental run 7 [8].
0.0
0.1
0.2
0.3
0.4
0.5
N2 CO
2 CO CH
4 H
2
Mo
le F
ractio
ns
Components
Present model
Expt Data
Fig. 1 Comparison of the Model predictions of Gas Compositions with
the Experimental Data for Run7 [8]
0.0 0.2 0.4 0.6 0.8 1.0
0.0
0.1
0.2
0.3
0.4
0.5
0.6
0.7
0.8
0.9
1.0
Mo
le F
ractio
ns
Normalised Length
N2
CO2
CO
CH4
H2
Fig.2 Composition variation with the normalized length
of the reduction zone for Run 7 [8]

0.0
0.1
0.2
0.3
0.4
0.5
0.6
N2 CO
2 CO CH
4 H
2
Mo
le F
ractio
ns
Components
fp = 0.2
expt data
fp = 0.25
Fig. 3 Comparison of the Model predictions of Gas Compositions with
the Experimental Data for Run 11 [8]
0.0 0.2 0.4 0.6 0.8 1.0
0.0
0.1
0.2
0.3
0.4
0.5
0.6
0.7
0.8
0.9
1.0
Mo
le F
ractio
n
Normailsed Length
N2
CO2
CO
CH4
H2
Fig.4 Composition variation with the normalized length
of the reduction zone for Run 11 [8]

The amount of CO and H2 increases, while that of CO2, CH4, and N2 decreases across the
length of the reduction zone. N2 content remains same as it is an inert gas, but its
composition decreases as the content of other components change across the lengh.
Dogru et al. [8] performed the run 11 with an air-to-fuel ratio of 1.5 which is significantly
higher than that of run 7. It indicates that the amount of N2 and CO2 at the entrance of
reduction zone, is higher for run 11 compared to those values of run 7. Pyrolysis fraction
variable accounts for the percentage of pyrolysed gas at the entrance of the reduction
zone. For run 7 simulations, fp = 0.25 is used (table-2) and for run 11, simulations are
carried out with fp of 0.2 and 0.25. Fig. 3 shows the comparison of the model predictions
of gas compositions with the pyrolysis fraction values of 0.2 and 0.25 for run 11 [8].
Model simulation with pyrolysis fraction, fp = 0.2, predicts better compared to those with
fp = 0.25 for run 11 [8] due to the higher value of air-to-fuel ratio (1.5).
Fig. 4 shows the composition profile of all the components for the experimental run 11
[8]. The qualitative trends of all the profiles are similar to those obtained with run 7 (Fig.
2), though quantitatively they are different.
Conclusions
The steady state model discussed here predicts the composition and temperature profiles
across the length of the reduction zone. Char reactivity factor and the pyrolysis fraction
variable are the key parameter in modeling of downdraft gasifier and it directly represents

the reactivity of char in the reduction zone. Based on the results obtained and the
discussions carried out in the earlier section, the following conclusions are drawn:
• It is found that air to fuel ratio is one of the key parameter in the simulation. And
its effect can be incorporated by varying the value of pyrolysis fraction variable.
• For higher value of air to fuel ratio, the lower value of pyrolysis fraction variable
has to be used.
• Model simulation with fp = 0.2 predicts better compared to the simulated results
of the fp = 0.25 for run 11 [8].
References
[1] B. V. Babu, A. S. Chaurasia, “Modeling for Pyrolysis of Solid Particle: Kinetics
and Heat Transfer Effects”, Energy Conversion and Management, 44 (2003) 2251-
2275.
[2] D. L. Giltrap, R. McKibbin, G. R. G. Barnes, ” A steady state model of gas-char
reactions in a downdraft biomass gasifier”, Solar Energy, 74 (2003) 85-91.
[3] B. V. Babu, A. S. Chaurasia, “Modeling, Simulation, and Estimation of Optimum
Parameters in Pyrolysis of Biomass”, Energy Conversion and Management, 44,
(2003), 2135-2158.
[4] B. V. Babu, A. S. Chaurasia, “Parametric Study of Thermal and Thermodynamic
Properties on Pyrolysis of Biomass in Thermally Thick Regime”, Energy
Conversion and Management, 45 (2004) 53-72.
[5] B. V. Babu, A. S. Chaurasia, “Dominant Design Variables in Pyrolysis of Biomass
Particles of Different Geometries in Thermally Thick Regime”, Chemical
Engineering Science, 59 (2004) 611-622.
[6] B. V. Babu, A. S. Chaurasia, “Pyrolysis of Biomass: Improved Models for
Simultaneous Kinetics & Transport of Heat, Mass, and Momentum”, Energy
Conversion and Management, 45 (2004) 1297-1327.
[7] B. V. Babu, P. N. Sheth, “Modeling and Simulation of Reduction Zone of
Downdraft Biomass Gasifier: Effect of Char Reactivity Factor”, Energy Conversion
and Management, 47 (2006) 2602-2611.
[8] M. Dogru, C. R. Howrath, G. Akay, B. Keskinler, A. A. Malik, “Gasification of
hazelnut shells in a downdraft gasifier”, Energy, 27 (2002) 415-427.
[9] Y. Wang, C. M. Kinoshita, “Kinetic modle of Biomass Gasification”, Solar Energy,
51 (1993)19-25.
[10] T. H. Jayah, Lu Aye, R. J. Fuller, D. F. Stewart, “Computer simulation of a
downdraft wood gasifier for tea drying”, Biomass and Bioenergy, 25 (2003) 459-
469.
[11] B. V. Babu, Process Plant Simulation, Oxford University Press India (2004).
[12] P. S. Ghoshdastidar, Computer Simulation of Flow and Heat Transfer, Tata
McGraw Hill Publishing Company Limited, New Delhi (1998).
[13] P. Mathieu, R. Dubuisson, “Performance analysis of a biomass gasifier”, Energy
Conversion and Management, 43 (2002) 1291-1299.
Profiles of Authors:
1. Prof B V Babu
Dr B V Babu is Professor of Chemical Engineering and Dean of Educational Hardware Division (EHD) at
Birla Institute of Technology and Science (BITS), Pilani. He did his PhD from IIT-Bombay. His
biography is included in 2005, 2006 & 2007 editions of Marquis Who’s Who in the World, in Thirty-Third
Edition of the Dictionary of International Biography in September 2006, in 2000 Outstanding Intellectuals
of the 21st Century in 2006, and in First Edition of Marquis Who’s Who in Asia in 2007. He is the
Coordinator for PETROTECH Society at BITS-Pilani. He is on various academic and administrative
committees at BITS Pilani. He is the member of project planning & implementation committees of BITS-
Pilani Dubai Campus, BITS-Pilani Goa Campus, and BITS-Pilani Hyderabad Campus.
He has 21 years of Teaching, Research, Consultancy, and Administrative experience. He guided 3 PhD
students, 32 ME Dissertation students and 26 Thesis students and around 170 Project students. He is
currently guiding 6 PhD candidates, 2 Dissertation students, 2 Thesis students and 9 Project students. He
currently has 3 research projects from UGC, DST, and KK Birla Academy. His research interests include
Evolutionary Computation (Population-based search algorithms for optimization of highly complex and
non-linear engineering problems), Environmental Engineering, Biomass Gasification, Energy Integration,
Artificial Neural Networks, Nano Technology, and Modeling & Simulation.
He is the recipient of National Technology Day (11th
May, 2003) Award given by CSIR, obtained in
recognition of the research work done in the area of ‘A New Concept in Differential Evolution (DE) –
Nested DE’. One of his papers earned the Kuloor Memorial Award, 2006 awarded for the Best Technical
Paper published in the Institute’s Journal “Indian Chemical Engineer” in its issues for 2005.
He is Life member of many professional bodies such as IIChE, ISTE, IE (I), IEA, SOM, Fellow of ICCE,
Associate Member of ISSMO, IIIS, and IAENG. Nine of his technical papers have been included as
successful applications of Differential Evolution (DE: a population based search algorithm for
optimization) on their Homepage at http://www.icsi.berkeley.edu/~storn/code.html#appl. He has around
120 research publications (International & National Journals & Conference Proceedings) to his credit. He
completed three consultancy projects successfully. He has published five books, and wrote several chapters
in various books and lecture notes of different intensive courses.
He was the Invited Chief Guest and delivered the Keynote addresses at three international conferences and
workshops (Desert Technology–7, Jodhpur; Life Cycle Assessment, Kaula Lumpur; Indo-US Workshop,
IIT-Kanpur) and three national seminars. He organized many Seminars & Conferences at BITS-Pilani. He
also chaired 10 Technical Sessions at various International & National Conferences. He delivered 27
invited lectures at various IITs and Universities abroad.

He is Editorial Board Member of three International Journals ‘Energy Education Science & Technology’,
‘Research Journal of Chemistry and Environment’, and ‘International Journal of Computer, Mathematical
Sciences and Applications’. He is the referee & expert reviewer of 24 International Journals. He reviewed
three books of McGraw Hill, Oxford University Press, and Tata McGraw Hill publishers. He is PhD
Examiner for one candidate and PhD Thesis Reviewer for 3 Candidates. He is the Organizing Secretary for
“National Conference on Environmental Conservation (NCEC-2006)” held at BITS-Pilani during
September 1-3, 2006.
2. Pratik N Sheth
Mr. Pratik N Sheth is a Lecturer in Chemical Engineering Department at BITS-Pilani, and currently
pursuing his PhD under the supervision of Prof B V Babu. His research areas include Biomass
Gasification, Modeling & Simulation, and Computational Transport Phenomena. He has 6 research
publications to his credit. He is associate life member of IIChE.