Embed Size (px)
Citation preview

Louisiana State UniversityLSU Digital Commons
LSU Master's Theses Graduate School
7-3-2018
Modeling and Analysis of Thermal Effects on AFractured Wellbore During Lost Circulation andWellbore Strengthening ProcessesZe WangLouisiana State University and Agricultural and Mechanical College, [email protected]
Follow this and additional works at: https://digitalcommons.lsu.edu/gradschool_theses
Part of the Engineering Commons
This Thesis is brought to you for free and open access by the Graduate School at LSU Digital Commons. It has been accepted for inclusion in LSUMaster's Theses by an authorized graduate school editor of LSU Digital Commons. For more information, please contact [email protected].
Recommended CitationWang, Ze, "Modeling and Analysis of Thermal Effects on A Fractured Wellbore During Lost Circulation and Wellbore StrengtheningProcesses" (2018). LSU Master's Theses. 4766.https://digitalcommons.lsu.edu/gradschool_theses/4766

MODELING AND ANALYSIS OF THERMAL EFFECTS ON A
FRACTURED WELLBORE DURING LOST CIRCULATION
AND WELLBORE STRENGTHENING PROCESSES
A Thesis
Submitted to the Graduate Faculty of the
Louisiana State University and
Agricultural and Mechanical College
in partial fulfillment of the
requirements for the degree of
Master of Science in Petroleum Engineering
in
The Department of Petroleum Engineering
by
Ze Wang
B.S., China University of Petroleum (Beijing), 2015
August 2018

ii
Acknowledgments
This thesis is built up based on the simulations and experimental works I have been working
on for the last two years. I won’t be able to complete my research without the valuable instruction
of my major advisor, Prof. Yuanhang Chen. Dr. Chen offered both general methodologies and
specific knowledge that prove to be essential support during my whole academic study. When it
comes to obstacles that seem difficult to overcome, he was always willing to offer precious life
lessons that motivate us through challenging tasks. His attitude and determination will be constant
inspirations in my future path to go.
I also want to thank my committee member and our graduate advisor Prof. Andrew K.
Wojtanowicz. Prof. Wojtanowicz is the most conscientious advisor and experienced professor I
have ever met. He encourages us to research in a way that agrees to the physical logic and
engineering practice, which I believe is the true essence of engineering study. Though harsh and
rigid, he can always make a conversation interesting and thought-provoking by his great
knowledge and humor.
Prof. Shengli Chen, who is an expert in the are of my study, also kindly shared his wisdom and
provided useful suggestions to help me complete my thesis
I want to express deep appreciation to my parents, which is the fundamental reason of my
existence. Through disagreements and fights, there might be, they are always on my side no matter
what happened. Every step of my life, good or bad, won’t be complete without their love and
encouragements.
My friends here, they are amazing. Their spirits to enjoy the moment and confront life choices
impacted my way of living and thinking in many different ways. My life here in LSU was such a
wonderful adventure and fun exploration only because of them.

iii
Table of Contents
Acknowledgements ......................................................................................................................... ii
List of Symbols ............................................................................................................................... v
Abstract ........................................................................................................................................ viii
Chapter 1. Introduction ................................................................................................................... 1
Chapter 2. Literature Review .......................................................................................................... 4
Chapter 3. Problem Definition and Important Assumptions ........................................................ 10 3.1 Problem definition and scope of work ................................................................................ 10 3.2 Important assumptions ........................................................................................................ 12
Chapter 4. Theoretical Background .............................................................................................. 14 4.1 Basics of linear elasticity: stress surround wellbore and effect of thermoelasticity. .......... 14 4.2 Introduction of fracture mechanics in petroleum engineering. ........................................... 21 4.3 Fundamental equations for multi-physic coupling of thermoporoelasticity processes. ...... 27
Chapter 5. Methodology ............................................................................................................... 30 5.1 General description of finite element method ..................................................................... 30 5.2 Finite element modelling of a fractured wellbore with thermoporoelasticity ..................... 31 5.3 Boundary conditions and input data .................................................................................... 34
Chapter 6. Preliminary Model Verification .................................................................................. 40 6.1 Unbridged fracture: SIF at fracture tip under isothermal condition .................................... 40 6.2 Unbridged fracture: Induced thermal stress at fracture tip .................................................. 41 6.3 Fracture with perfect bridge: WBS implementation at different positions ......................... 42
Chapter 7. Results and Discussions .............................................................................................. 46 7.1 Thermal stress induced along wellbore wall during lost circulation with unbridged
fractures ..................................................................................................................................... 46 7.2 Statistical analysis: contribution of individual parameter to thermal effect with unbridged
fractures ..................................................................................................................................... 56 7.3 Thermal effect on pre-existing fractures with WBS implementation ................................. 63
Chapter 8. Laboratory Experiments to Explore Wellbore Temperature Control Using Thermal
Insulating Materials ...................................................................................................................... 68 8.1 Preliminary experiments of drilling fluid and filter cake properties after adding special
fluid additives ............................................................................................................................ 71 8.2 Modelling temperature profile in the wellbore and surrounding formation. ....................... 77 8.3 Discussion of the simulation results. ................................................................................... 83
Chapter 9. Conclusions and Recommendations. ........................................................................... 85

iv
References ..................................................................................................................................... 89
Vita ................................................................................................................................................ 93

v
List of Symbols
αT : Thermal expansion coefficient.
α: Biot constant.
σ: Stress tensors
Cp: Heat capacity at constant pressure
Cr : Rock specific heat (Heat capacity)
C: Elastic tensor
ε: Strain tensors
εT : Thermal strain
εv : Volumetric strain
E: Young's modulus
Φ: Rock Porosity
K: Rock Permeability
Keq: Equivalent thermal conductivity of the solid-liquid system
Kr ∶ Rock thermal conductivity
L: Model length
Lf ∶ Fracture length
ρ: Density
vi
(ρCp)eq
: The equivalent volumetric heat capacity of the solid-liquid system.
μ: Fluid viscosity
ν: Poisson's ratio
pf: pore pressure
ppore : Initial pore pressure
pw: Wellbore pressure
Q: Heat source
Qf: Fluid source in/out of certain porous space
Qm : Mass source in/out of porous space
q : Darcy velocity field
ρr : Rock density
ρr ∶ Drilling fluid density
Rw: Wellbore radius
s0, s: original and changed stress state of porous media
Shmin : Minimum horizontal stress
Shmax : Maximum horizontal stress
T − Tref, temperature increase/decrease in the rock matrix.
Tr : Initial reservoir temperature

vii
Twf: Wellbore temperature
u : Velocity field of fluid flow in porous media
vin : Fluid leak-off rate

viii
Abstract
To successfully prevent fracture propagation and combat lost circulation, a thorough
understanding of the stress state in the near-wellbore region with fractures is imperative. One
important factor that is not yet fully understood is how temperature variation during lost circulation
affects pre-existing or newly initiated fractures. To address this problem, a 3D finite element
analysis was conducted in this study to simulate the transport processes and state of stresses in the
near-wellbore region during mud invasion into fractures. To take the thermal effects into account,
a thermo-poro-elasticity model was coupled with flow and heat transfer processes. This study
included a series of sensitivity analyses based on different formation properties and mud loss
conditions to delineate the relative importance of different parameters on induced thermal stresses.
The results demonstrate how the stresses redistribute as non-isothermal mud invasion takes place
in fractures. They show that a temperature difference between the formation rock and the
circulating muds can facilitate fracture propagation during mud invasion. The thermal effect can
also diminish the enhanced hoop stress, which is the tangential stress acts to close the fracture,
provided by Wellbore Strengthening and other lost circulation prevention methods. Such
information is important to successful management of lost circulation by taking into account
thermal effects from different lost circulation prevention approaches. The conclusions of this study
are particularly relevant when a large temperature difference exists between circulating fluids and
surrounding rock as commonly seen in high-pressure high temperature (HPHT) and deepwater
wells.

1
Chapter 1. Introduction
A severe lost circulation event is usually associated with the emanation and propagation of pre-
existing or drilling induced fractures from oil/gas wells. During drilling operations, one of the
essential tasks is to maintain hydraulic pressure caused by mud volume in the wellbore between
appropriate pressure windows. The high fluid pressure in the wellbore can sustain pore pressure in
underground formations, like an aquifer, and support the wellbore wall to keep it from collapse in.
The collapse pressure or pore pressure decides the lower boundary of the mud weight. On the other
hand, if the downhole hydraulic pressure exceeds the tensile strength of formation rock, formation
rock will break and fractures can occur and start to propagate from the wellbore wall. Downhole
fluid pressure at this point is called fracture pressure. Fractures emanating from the wellbore wall
provide a convenient channel for the mud to escape into the near wellbore region.
Lost circulations events can be especially threatening when drilling into formations with
abnormal pressure distribution. Drilling operations can be another reason for pressure fluctuation
in a wellbore. Swab or trip in/out of drill pipe can also cause abnormal pressure surges in a wellbore
and increase pressure until fracture pressure is exceeded. Lost circulation has been identified as
one of the major causes of non-productive time (NPT) and an increase of drilling cost.
To combat lost circulation problems, the primary considerations are to clog fluid loss channel
and prevent fractures from further propagation. Lost circulation materials (LCM) such as particle
and fibrous materials are wildly applied to seal the fluid loss channel and mitigate lost circulation
events. Among the wild selection of LCM, one category is carefully engineered particle materials
that aim to bridge fractures and protect fractures from further initiation and propagation and
strengthen the pressure-bearing capacity of the wellbore. The implementations of these well-
engineered materials are called wellbore strengthening (WBS) and the carefully designed particles

2
are sometimes referred more specifically as wellbore strengthening materials (WSM). Most
common WBS involves using lost circulation materials (LCM) in drilling fluid to prop, bridge, or
seal the fractures by use of particle additives. During last decade, successful WBS operations have
been reported in many drill sites. Regretfully, there is still no consensus on the fundamental
mechanisms to explain how WBS works.
Regarding stress state of underground formation rocks during WBS, the effect of temperature
and thermal stress is an indispensable parameter that is usually neglected in the study of WBS.
Due to the geothermal gradient, formations or reservoirs at the location thousands of feet
underground bear much higher temperature than the temperature at the surface. During circulation
of drilling fluid within the wellbore, fluid is gradually heated up and the surrounding hot rocks are
cooled down at the bottom of the wellbore. Though wellbore heating is possible when drilling into
frozen formations or at a shallow section of the wellbore, it is goes beyond the discussion of this
study. While formation cooling takes place, thermal contraction of formation rock can induce
significant thermal stresses around the wellbore. The thermal effect has been well recognized in
the previous studies about the stress state and stability of an intact wellbore. Many researchers
have also obtained numerical and analytical solutions for the fracture pressure under the thermal
effect. Analytical solutions barely consider the thermal effect or pore pressure due to a lack of
theoretical background in such problems. Numerical solutions face difficulties in doing so mainly
because of the complexity of coupling heat transfer with pore pressure and poroelasticity in the
near wellbore formation.
This thesis uses finite element analysis to simulate the thermally induced stress around a
wellbore using a 3D fully coupled thermo-poro-elasticity model. Heat transfer between the
wellbore fluid and formation was coupled with pore fluid flow in a porous medium to generate a

3
temperature field in the near-wellbore region. Both heat convection dominated by fluid leak-off
and heat conduction within the rock matrix were considered in this process. The thermal expansion
coefficient of the rock matrix and the thermal stress it caused was incorporated into the
poroelasticity model to demonstrate how the stress changed as the formation’s temperature was
affected by the cold mud invasion. We were able to show how much the temperature can impact
the formation through stress analysis of the wellbore and fracture tip, and how it relates to the hoop
stress.
Another particular goal of this work is to discuss how convective and conductive heat transfer
during lost circulation affects the hoop stress of a wellbore with pre-existing or induced fractures.
The findings of this study will be beneficial to evaluate the risk of re-initiating fractures from a
wellbore due to a significant change in the temperature of the formation. Furthermore, based on
these findings, important recommendations were suggested to help determine proper fracture
gradients and wellbore pressures in various field operations.
This study includes four major chapters other than the introduction. The second chapter reviews
previous studies regarding the thermal effect on wellbore stability and fracture initiation. The third
chapter presents the methodology and boundary conditions to simulate the local stress state under
wellbore cooling. Chapter four display results from case studies to discuss the application of this
model in different scenarios such as lost circulation and WBS. At last, Chapter five discusses the
variation of wellbore temperature due to the fluid additives.

4
Chapter 2. Literature Review
Lost circulation has been identified as one of the major causes of NPT and increase of drilling
cost (Cook et al., 2011, Carpenter et al. 2014). A certain amount of mud can be sacrificed during
slightly lost circulations to continue the drilling process before wellbore is cemented and casings
are implemented. But when a severe lost circulation event occurs, the operation has to be stopped.
Reports showed that 12% of the non-productive time in shelf drilling of Gulf Mexico was related
to lost circulation events. There’re also reports showing that lost circulation events were
responsible to 10% to 20 % of the cost during the whole drilling circle (Growcock, 2009).
To combat lost circulation problems, the primary considerations are to clog fluid loss channel
and prevent fractures from further propagation. Wellbore strengthening (WBS) refers to a
collection of techniques applied to serve such purposes by strengthening the pressure-bearing
capacity of the wellbore. Wellbore strengthening techniques are categorized into preventative and
remedial approaches depending on whether they are applied before or after a fluid loss is detected
(Feng, 2017). Preventative approaches raise the fracture pressure of the formation being drilled by
facilitating the establishment of a filter cake on the wellbore wall. Functions of filter cake are
twofold. Filter cake usually has low permeability and high ductility. By forming this low permeable
layer on wellbore wall, pressure communication from the wellbore to formation porous media is
interrupted. Thus, the negative impact of high wellbore pressure or abnormally low pore pressure
is mitigated by the isolation effect of the filter cake. Meanwhile, filter cake also helps to plastering
the micro fracks or pre-existing natural fractures on wellbore wall. Our emphasis of study is
remedial approaches that are applied after lost circulations occur and fractures are identified.
Most common remedial WBS involves using LCMs in drilling fluid to prop, bridge, or seal the
fractures by use of lost circulation materials in drilling fluid. (Feng, 2016). The initial concept of

5
strengthening the wellbore mechanically was first brought up decades ago. When researchers
creatively applied particle materials with a range of sizes into drilling fluid, they found out that
lost circulation can be mitigated effectively (Fuh et al, 1992). During last decade, successful WBS
operations have been reported in many drill sites. But regretfully there is still no consensus on the
fundamental mechanisms to explain how WBS works. WBS techniques are generally theorized to
work by either of the three mechanisms (Alberty et al., 2004, Saeed, 2012, van Oort et al.,2011,
Mehrabian et al., 2015, Feng et al., 2017).
(a) Stress cage: LCM prop and widen the near wellbore fractures open against the in-situ stress
and develop a sufficient supplementary hoop stress around the wellbore to considerably increase
its fracturing limit. For stress cage theory to work, it’s of the highest priority to engineer the LCM
so the it has sufficient strength and proper size to fit in the fracture and support the fracture wall
perfectly. It also requires formation to have high hardness so the particles materials are not
embedding into the formation. This explanation is limited due to its demanding requirements to be
effective.
(b) Fracture closure pressure: LCM type is not of prime consideration for this hypothesis to
take effect. Instead, it is aimed to deposit LCM materials at some distance inside the fracture, while
clogging the fracture and maintaining enough fracture width and allows fluid to increase its closure
pressure. The essential mechanism of this hypothesis also includes isolating fracture tip from high
fluid pressure in the wellbore by allowing fluid in fracture beyond fracture bridge to leak off into
formation, as showed in the Figure 2.1.b) The fluid trapped behind the plug diffuses into the pore
space of surrounding rocks, leaving the fracture tip with significant reduced pressure. The reduced
pressure will make the fracture less likely to propagate farther into the formation. High fluid loss,
and consequently a permeable formation, is important to the success of this method. Carefully

6
designed particle size distribution (PSD) of LCM plays the key role to create impermeable bridging
inside the fracture.
(c) Fracture propagation resistance (FPR): FPR theory is proposed most commonly in oil-
based mud (OBM) and synthetic-based mud (SBM). Likewise, it is reliant on the tip-isolation
concept, but does not require high fluid loss. Contrary to the fracture bridging and plugging,
pressure communication from wellbore to fracture tip is not interrupted in FPR. Fracture tip in
FPR is protected in this case by generating a thin layer of filter cake along fracture surface and
cover fracture tip. The build-up inner filter cake changed the permeability distribution around
fractures and restricts fluid invasion through the fracture tip. Theoretically it could also keep
fracture tip from the impact of high fluid loss. Meanwhile, particle materials accumulated around
fracture tip also provided certain degree of mechanical strength and resist the fracture from fracture
propagation.
Figure 2.1. Three different mechanism to explain WBS: (a) stress cage (Mehrahian et al., 2015)
(b) fracture closure pressure (c) fracture propagation resistance (Morita et al., 1990, van Oort,
2011).
In WBS practice during drilling, either of the three mechanisms mentioned above could be the
major drive behind the increased wellbore fracture gradient, or they could have combined effects.
For example, the plug inside the fracture could increase the hoop stress around wellbore while at
the same time isolating the fracture tip. In porous media, stress state is affected by pore pressure.
As shown previously, fracture plugging not only provide hoop stress enhancement around the
wellbore, it also restricts fluid flow into fractures during lost circulation and alter pore pressure
(a) (b) (c)

7
and therefore stress state around the fracture.
Based on these mechanisms, several important analytical studies are proposed to study the
WBS effect. These studies try to determine fracture pressure and fracture geometry when WBS is
applied. Earlier researchers extend the concept of the penny-shaped fractures from hydraulic
fracturing to study the effect of LCMs on near wellbore fractures (Ito et al., 2001). In their study,
the effect of LCMs on fracture pressure was determined when particle materials located in different
locations inside the fracture. They assumed relatively long fractures so the wellbore can be ignored.
This becomes a shortcoming of their studies for they failed to consider the state of the wellbore
during WBS operations. Their studies are also not applicable when fractures are short, which is
the most common case in lost circulation.
By linear elastic fracture mechanics and principles of superposition, later researchers proposed
other analytical solutions (Guo et al., 2011; Morita 2012; Shahri et al., 2014; Feng et al, 2016).
Most of these studies adopted a wellbore with two short fractures emanating from the wellbore
symmetrically. These studies developed appropriate solutions to calculate the fracture width and
fracture pressure before and after the fractures are plugged by LCMs. They have also investigated
some major parameters that affect the performance of LCMs like Young’s Modulus, wellbore size,
and in-situ stresses. These models are already very comprehensive by involving more realistic
fracture geometry and drilling parameters. However, they still didn’t take pore pressure into
consideration because of the linear elasticity theory they were based on. Meanwhile, their studies
also consider a perfect bridge meaning that fluid invasion into fractures is completely prevented
by the particle materials, which is also very rare in real life situation.
In previous studies to assess the effectiveness of lost circulation prevention methods, many
indispensable factors were neglected to simplify the proposed models, one of them is the thermal

8
effect due to the invasion of mud with a temperature different from that of the surrounding rocks.
The extent to which the relatively cold drilling fluids affect the warm formations is now being
recognized as having a significant effect on the wellbore’s fracture gradient. Analysis of field data
from deep-water wells shows that lost circulation events are closely associated with a significant
variation between the formation temperature and fluid temperature during drilling (Chen et al.
2015 & 2016, Hettema et al., 2004, Pepin., 2004). To investigate the effect of fluid temperature on
wellbore fracturing, leak-off tests conducted in South Texas also emphasized a reduced fracture
gradient as a result of this temperature drop (Gonzalez et al., 2004). A simplified solution of the
wellbore fracture gradient under thermal effect while drilling was also proposed in this study by
assuming a pure thermoelasticity without considering the pore pressure.
Further studies emphasizing the thermal effect during drilling provided comprehensive
analytical solutions to the wellbore stress state under cooling or heating processes. Their studies
managed to consider pore pressure and pore fluid flow when calculating near wellbore temperature
and thermal stress redistribution (Chen et al., 2005, Fjær et al., 2008, Maury et al., 1995, Yan et
al., 2013). Furthermore, they offered important references for the determination of fracture and
collapse pressure of an intact wellbore under the thermal effect. In these previous studies, the effect
of pre-existing or induced fractures is usually not considered when predicting the fracture gradient.
However, in practice, severe losses occur not just from fracturing a perfect wellbore, but also from
a re-initiation of pre-existing fractures from the wellbore.
Previous studies on fracturing behavior mainly investigated such effects by considering hot,
dry reservoirs (Maury, 1995, Zhou et al., 2010). A study has been conducted in hydraulic fracturing
to analyze fracture initiation and propagation (Rinne, 2012). This study only illustrated the fracture
propagation behavior under particular mechanical and thermal loading. A detailed analysis of how

9
stress distribution around the fractured zone reacts to temperature change was not specified.
Moreover, these studies fail to give sufficient consideration to different lost circulation prevention
or WBS scenarios.
The success of current methods used to prevent lost circulation has been strongly related to the
elevation of hoop stress, the stress acting to close the fracture, in the near-wellbore region. When
there is a large temperature gradient between the fluid and the formation, the hoop stress decreases,
allowing a fracture to propagate. A consequence of reducing the hoop stress is that WBS and other
lost prevention methods will perform less effectively than they are expected to. By far, the extent
to which the thermal effect on lost circulation events and mitigation methods during drilling is not
well understood and quantified yet, especially in the context of an imperfect wellbore.

10
Chapter 3. Problem Definition and Important Assumptions
3.1 Problem definition and scope of work
The problem is defined in this section followed by a generally explained methodology. This
work mainly discusses the effect of temperature change on a fractured wellbore when drilling fluid
lost into the formation. Study of temperature and stress variation during lost circulation inevitably
involves the coupling of multiple physical processes. Heat transfer and temperature change in near
wellbore area are controlled by the fluid flow in porous media induced by fluid invasion. This
process generated thermal stress and altered the stress state of rock matrix in near wellbore region.
Such stress redistribution leads to the change of pore space volume and pore pressure, thus
influence the fluid flow through the matrix, conversely.
The following graph in Figure 3.1. shows the simplified 2D representation of the 3D model
established in this study, which is characterized by a circular wellbore and pre-existing fractures.
The geometry describes an intersection of a vertical wellbore that subjects to a minimum and
maximum horizontal stress from X and Y direction. Two short fractures are pre-set symmetrically
on the wellbore perpendicular to minimum horizontal stress.
Figure 3.1. Simplified 2D representation of the 3D model established in this study
Shmin
Shmin
Shmax Shmax
Y-direction
X-direction

11
This study uses the law of Darcy’s flow to control the fluid flow and pore pressure distribution
in the rock matrix. To simulate fluid loss through fractures, fluid inlet is set up on both wellbore
wall and fracture surface. Together with the fluid pressure exerted on the outer boundary, fluid
inlet setting could control the pore pressure distribution, as well as the convective heat exchange
through fluid inflow. In-situ stresses and fluid pressure on wellbore wall and fracture surface
contribute to the mechanical balance of this model. The fluid pressure that supports the fractures
would be higher than minimum horizontal stress to maintain the fractures in a certain width.
Follow the natural path from theoretical study to practical application, this thesis categorizes
the scope of work in two part: a) study the stress state of a fractured wellbore during the cooling
process of formation due to fluid invasion; b) explore the possibility of using improved drilling
fluid to protect the formation rock surrounding the wellbore from stress variation due to the decline
of temperature.
The first part of the study aimed to answer how does stress variation around wellbore due to
formation cooling would affect fracture re-initiation. A large quantity of fluid loss into the
formation through induced fractures is one major problem during drilling. Further development of
fracture due to thermal stress could deteriorate the situation and counteract the efforts to mitigate
fluid loss. This thesis uses finite element method to simulate stress field around a fractured
wellbore with lost circulation implementation, given its inherent capability and convenience to
adopt complicated geometries. Many factors would be involved when discussing fluid invasion
and induced thermal stress. Parametric studies and statistical techniques are adopted to discover
their individual effect and relative importance. Then, most importantly, WBS component is
implemented into the numerical modeling to determine how much WBS should be weakened by

12
the formation cooling.
The second part of this study explores the potential of wellbore temperature control by
manipulating the thermal properties drilling fluid. Changing the heat transfer process in the
wellbore is extremely difficult. Efforts to reduce or increase wellbore temperature are strongly
limited by complicated downhole requirement such as wellbore size, wellbore pressure window,
equipment temperature range, circulating fluid properties, economic reasons and so on. This study
proposes to use special additives into drilling fluid to mitigate the heat exchange between wellbore
fluid and surrounding formations. There are two ways for these additives to intercept the heat
transmission process in the wellbore. Adding thermal insulating materials could reduce the thermal
conductivity of the drilling fluid and affect heat exchange between circulating fluid and formation
rock. These additives could also potentially be helpful to protect formation from heat loss by
altering the composition of the filter cake that covers a certain section of the wellbore. Models and
methods to evaluate the effect of these additives will be given in detail in the chapter of
Methodology.
3.2 Important assumptions
This study investigates how the near wellbore stress around a fractured zone will react as the
formation’s temperature drops. The following assumptions are made in the modeling of a fractured
wellbore.
• Isotropic and homogeneous formation rock is assumed in this thesis for the simplification
of the modeling.
• The modeling assumes a circular-shaped vertical wellbore with two short fractures
generates perpendicular to the minimum horizontal stress.
• This thesis assumes that the formation rock has sufficient tensile strength that prevents the

13
pre-existing fracture from further propagation. Failure criteria of formation rock at fracture
tip and fracture propagation are not considered in the modelling.
• Uniform pressure and temperature values are pre-set on wellbore and fracture surface in
the fluid invaded zone. The limitation of FEM software unable the simulation of fluid and
heat flow inside void space of fracture. When fluid invasion happens through fracture
surface, the temperature and pressure gradient along the short distance from fracture mouth
to fracture tip would be negligible. This justified using uniform fluid and temperature
boundary to be an effective supplement of fluid and heat flow inside fracture during lost
circulation.

14
Chapter 4. Theoretical Background
Chapter 4 covers the fundamental theories underlying the study in this thesis. Some important
terminologies useful to later discussions are also introduced in this chapter. The first part of this
section reviews the basic concepts in linear elasticity and introduces the stress state around a
perfect wellbore. Part one also covers the thermal effect on stress state around wellbore with
consideration of linear elasticity and poroelasticity. Then in the second part, fundamentals of
fracture mechanics are introduced, and basic theories of stress intensity factor (SIF) is built,
including the extension of fracture mechanics in wellbore breakdown. The last part of theory
background explains fundamental equations that control the stress redistribution around a fractured
wellbore during drilling fluid invasion. These equations adopted in the finite element study
presents coupling nature of this multi-physic process of thermoporoelasticity.
4.1 Basics of linear elasticity: stress surround wellbore and effect of thermoelasticity.
4.1.1 Stress and strain
Elasticity is the ability of a material to recover to the initial state after the deformation caused
by external forces. In the simplest case, the external forces are related to the consequential
deformation of materials in a linear way, which called linear elasticity. When the forces and
deformation are infinitely small, most of the solid materials present a linear elasticity. Thus linear
elasticity is the foundation of all other elasticity and non-elasticity studies.
4.1.2 Rock stresses surround a wellbore
Drilling into underground formation requires a thorough understanding of its mechanical
behavior, present stress state and the geological structure creating the stress. This initial stress state
of a geological point underground is called in-situ stress, as showed in Figure 4.1. From a rock
mechanic point of view, in situ stress is a major factor to maintain the mechanical stability of a

15
drilled wellbore. In situ stress also dominate the initiation and development of fractures. In the
convention of rock mechanics study, a rock block is assumed to bear three principle stresses,
orthogonal to each other. The direction of principle stresses is organized so that they act purely to
compress the rock block without any shearing. Direction and magnitude of principle stresses vary
depending on the depth of the rock, materials, and structure of overlying formation and special
geological structures or activities such as fault, salt dome, erosion and tectonic movement.
Commonly, vertical stress is assumed to be the maximum principle stress, and two horizontal
stresses are intermediate and minimum principle stresses, as shown in Figure. The assumption is
valid in a large range of depth and homogeneous earth materials, also when the block is not
exposed to the stress from current or previous geological activities.
Figure 4.1. In-situ stress around a block of the underground earth (Smith et al. 2015)
Vertical stress comes from the weight of the overburden formation that the rock carries. It’s
convenient and reasonable to assume it as principle stress since it’s caused by gravity and it acts
vertically to the earth center. Consider a varying density of rock along a certain depth; vertical
stress can be calculated by the following equation: σv = ∫ ρ(z)gdzD
0, whereas D is the current

16
depth. Typical density measurement of overburden formation gives a value of 1 – 1.05 psi/ft or
0.0225 MPa/m of the gradient of vertical stress (Smith et al., 2015). Of course, offshore formation
or abnormal pressurized zone will need extra corrections for water depths or extra pressure source.
Horizontal stress can come from two sources: 1) overburden weight that compact formations and
create horizontal stress; 2) tectonic forces from local geological activities. Based on the linear
elasticity of rock and idea of uniaxial compaction, horizontal stress is expressed in σh =ν
1−νσv =
Kσv , ν is Poisson’s Ratio of rock and K can be treated like a rock parameter. For most rock
materials, ν is closed to 0.25, which gives σh =1
3 σv . This is a reasonable approximation of
minimum horizontal stress in most cases.
The true stress act to compress the rock is not the total stress, but the net stress that takes into
account the reservoir pore pressure. Fluid in overburden formation and connection to other fluid
sources all contribute to the magnitude of pore pressure. Pore pressure acts normally on the inner
surface of a porous rock saturated by reservoir fluid regardless of the direction. This introduced
the idea of effective stress or Terzaghi’s effective stress: σ′ = σ − p which expresses the
relationship: effective stress = total stress – pore fluid pressure (Knappett et al., 2012). Plugging
this into σh′ = Kσv
′ gives: σh − p = K(σv − p). Thus, the basic estimation of minimum horizontal
stress can be written as and σh = K(σv − p) + p . In this equation, K is a rock property
approximately equals 1/3, σv is overburden pressure with a gradient that usually varies from 1 -
1.05 psi/ft. p is the reservoir pressure.
The underground formation is constantly under a balanced compressive state due to overburden
stress and tectonic forces. In mining or petroleum engineering, when a hole is drilling in a
formation, a certain amount of solid is removed, and only fluid pressure inside will support the
compacting forces from surrounding rock. When the fluid pressure inside does not provide the

17
equivalent stress as original earth, stresses around borehole wall, or wellbore wall in petroleum
engineering, redistribute to regain the balance. If newly established stress state exceeds the failure
criteria of the rock, the wellbore either collapse under compression or fractured under tension.
To study the stress state around the wellbore, it’s more convenient to use the cylindrical
coordinate system. In the cylindrical system, stress Consider a plane perpendicular to the z-axis,
as showed in the Figure 4.2., stress in cylindrical coordination can be expressed by radial stress σr
and tangential stress σθ in the following relationships (Salehi, 2012):
σr =1
2(σx + σy) +
1
2(σx + σy)cos2θ + τxysin2θ (4-1)
σθ =1
2(σx + σy) −
1
2(σx − σy)cos2θ − τxysin2θ (4-2)
σz = σz (4-3)
Figure 4.2. Rock stress in cylindrical coordinate. (Salehi, 2012)
The cylindrical expression of the stress state around a wellbore is illustrated in Figure 4.3.
Under the linear elastic theory, the general solution of the stress state around a wellbore is first
achieved by Kirsh in 1898 and then modified by others. Assuming a vertical wellbore and set
σθ0 (stress at 0 degrees from X-axis) to be σh (horizontal stress perpendicular to X-axis) and
consider the fluid pressure inside the wellbore pw , stress around a circular wellbore can be
expressed using following equations (Salehi, 2012):

18
σrr =σH−σh
2(1 −
Rw2
r2) +
(σH−σh)
2(1 + 3
Rw2
r2− 4
Rw2
r2) cos2θ +
Rw2
r2pw (4-4)
σθθ =σH−σh
2(1 +
Rw2
r2 ) −(σH−σh)
2(1 + 3
Rw2
r2 ) cos2θ + Rw
2
r2 pw (4-5)
σzz = σv − 2ν(σH − σh) Rw
2
r2cos2θ (4-6)
in which:
σrr, σθθ is the radial and tangential stress in cylindrical coordinate.
σH, σh are the horizontal stress perpendicular to Y-axis and X-axis, assume the minimum
horizontal stress act perpendicular to X-axis.
pw is the wellbore pressure or wellbore fluid pressure.
Rw is the wellbore radius
r is the radial distance from the point of interest to the center of the wellbore. (r ≥ Rw)
Figure 4.3. An arbitrarily oriented wellbore under in-situ stress system (Salehi 2012)
It is necessary to emphasize the concept of hoop stress. Here and in most cases in the following
text, hoop stress is used more often to refer the tangential stress σθθ. Hoop stress is named to
express the compressive or tensile stress state at a point specifically in a cylindrical coordinate.

19
Wellbore stability is maintained by a highly compressive stress state offered by the overburden
formation and weigh of drilling fluid or mud. In overbalance and underbalanced drilling, the mud
weight that pressurizes the wellbore changes the hoop stress at wellbore wall. The wellbore will
either fail in tension or collapse in compression when the hoop stress at wellbore wall exceeds the
tensile or compressive strength of the rock. In this thesis, wellbore fracturing is more of interest.
After the point of fracture initiation, hoop stress is still exerted perpendicular to fracture surface
and counteract the width expansion of the fracture. It is so called closure pressure in many
literatures regarding the induced fractures in drilling or hydraulic fracturing. Therefore,
enhancement of hoop stress is a key to prevent initiation or further development of fractures
resulting from a lost circulation event. At the wellbore wall, the equation above are reduced to:
σrr = pw (4-7)
σθθ = σH + σh − 2(σH − σh)cos2θ − pw (4-8)
σzz = σv − 2ν(σH − σh)cos2θ (4-9)
This gives the minimum and maximum hoop stress along the wellbore at the direction of maximum
and minimum horizontal stress, respectively, as showed in the Figure below.
σθθmin = 3σh − σH − pw (4-10)
σθθmax = 3σH − σh − pw (4-11)

20
Figure 4.4. Maximum and minimum hoop stress along wellbore wall
4.1.3 Thermal effect and thermal stress
Thermal effect on wellbore, especially a fractured wellbore, is the primary task of this thesis.
This problem results from the temperature difference between formation rock and reservoir fluid
due to the geothermal gradient. In basic thermoelasticity, with the linearity of governing equations,
thermal stresses can be combined with stress around the wellbore directly according to the
superposition principle (Fjaer et al., 2008). Therefore, stress around wellbore wall can be modified
as following equations:
σrr = pw (4-12)
σθθ = σH + σh − 2(σH − σh)cos2θ − pw +E
1−ναT(Twf − Tr) (4-13)
σzz = σv − 2ν(σH − σh)cos2θ +E
1−ναT(Twf − Tr) (4-14)
In which,
E and ν are Young’s Modulus and Poisson’s ratio.
0o 180
o 90
o
0o
90o
σH
σh
8000 psi
2000 psi
5000 psi

21
αT is volumetric thermal expansion coefficient.
Twf, Tr are the temperature in the wellbore and initial reservoir temperature.
These relationships only represent the thermal stress created only by conductive heat transfer in a
simplest stationary process. However, the study of temperature change and thermal stress, in reality,
should be conducted together with fluid flux and pore pressure in porous media of formation rock.
The transient solution that couples the heat transfer with pore pressure and poroelasticity has been
derived with the perfect wellbore.
4.2 Introduction of fracture mechanics in petroleum engineering.
Linear elastic fracture mechanics is fundamental to understand the basic fracturing behavior.
Knowledge of materials fracturing start to build-up as early as the age of Renaissance, when
Leonardo da Vinci started to investigate the cause underlying the fracturing of different materials
(Salehi, 2012). Rock fracturing stems from an earlier study of other fragile materials like glass,
metals, and ceramics. However, the inherent heterogeneity properties of formation rock and the
complex anisotropy stress environment of underground formations all make the rock fracturing
behave differently from other materials.
In ideal flat and sharp cracking, happening of fracture can be categorized into different modes
according to the relative displacement of fracture surface and the strain type the fracture surfaces
are subjects too, as showed in Figure 4.5. (Salehi, 2012).

22
Figure 4.5. Fracture tip displacement mode. (Salehi, 2012)
As showed in Figure 4.5., Mode I is called opening mode for the reason that the fracture is
created due to the normal stress exerted perpendicular to both of the fracture surfaces. Fracture tip
is subjected to tensile failure in the opening mode. In Mode II, in-plane shearing fracturing, the
shear stresses generate a fracture along the direction of shear stress. The fracture surfaces move or
slide in the same plane relatively to each other. Mode III or out-of-plane shearing mode is the case
when the direction of fracture propagation is perpendicular to the shear stresses.
Assuming vertical stress is the maximum principle stress, the fluid pressure in wellbore would
first overcome the minimum horizontal stress and generate a fracture in the direction of maximum
horizontal stress. Figure 4.6. shows the simplified intersection of a vertical wellbore that is
fractured by the fluid pressure.

23
Figure 4.6. The intersection of a vertical wellbore with fracture generated perpendicular to the
minimum horizontal stress.
For each of the fracturing mode, the energy required to initiate the fracture tip is different. In
drilling or hydraulic fracturing, fractures in most cases are created in Mode I, in which the
formation wall is rapture by high fluid pressure in the wellbore due to tensile failure. Griffith
established the criteria for fracture initiation of material in as early as 1920. He formulated stress
required to crack a material by considering materials properties and fracture shape. (Anderson,
1995)
σf = (πEγs
2(1−ν2)a)
1
2 (4-15)
With E and ν, this equation takes into account material mechanical properties. It also considers
fracture shape by using "a" as fracture radius. γs in the equations refers to surface energy per unit.
On the basis of this equation, Irwin (1954) gives the amount of energy needed for cracking to
happen:
G =πσ2a
E (4-16)
His equation is almost equivalent to the initial one but using energy release rate G at fracture tip
to replace stress. Here, the criteria for the fracture to happen becomes G = Gc, in which Gc is the
pwf
Shmax
Shmin

24
critical energy release rate, also refers to fracture toughness. Gc is the critical strain energy release
rate of a brittle material itself that indicates the resistance of the crack to further fracturing. In
fracture mechanics, stress intensity factor (SIF) is used to refer to energy release rate for fracture
under different fracture displace mode. KI denotes the stress intensity factor under Mode I. KI is
related to strain energy release rate G with the equation G =KI
2
E . What the SIF refers to critical
strain energy Gc is usually referred to as fracture toughness, KIC. SIF and fracture toughness is
wildly adopted in fracture mechanics and petroleum engineering to evaluate the fracturing
behavior. Measurement of fracture toughness, which is an inherent properties of the brittle
materials, have been conducted extensively in previous studies (Clifton et al., 1976).
The stress intensity factor (SIF) is a commonly used concept in fracture mechanics caused by
a remote load or residual stresses to predict the stress state ("stress intensity") near the tip of a
crack. The magnitude of SIF depends on the geometry, size, location of the crack, and load
distributions on the material and crack. According to the linear elasticity theory, a tensile fracture
will start to extend when the value of the SIF approaches that of the fracture toughness KIC.
Earlier equations for SIF mentioned in previous sections clearly cannot be applied for fractures
with complicate geometry and loading conditions. Calculation of strain energy release rate is then
developed into a path independent integral, denoted J, around the fracture tip in a two-dimensional
elastic deformation problem (Dokhani et al., 2016, Feng et al. 2016, Rui et al., 2017), as shown in
Equation 4-17. It can also be used as an approximation for simple three-dimensional problems
with isotropic materials like in this study by selecting a cross section vertical to the wellbore.
G = J = limΓ→0
∫ [W ∗ n1 − σijnj(∂ui
∂x1)]ds
Γ (4-17)

25
where W is the strain energy density of the material, σij and ui are the Cartesian components of
the first stress tensor and displacement vector, respectively, nj represents the Cartesian
components of the outward unit vector normal to the contour Γ, and s is the arc length of the
contour Γ, as is shown in Figure 4.7.
When the fracture face is subjected to surface traction, 𝐭𝐜 , integrations along C1 and C2 are
included (Chang et al. 1992), that is,
J = limΓ→0
∫ [W ∗ n1 − σijnj(∂ui
∂x1)]ds
Γ− ∫ (
∂ui
∂x1) ds − ∫ (
∂ui
∂x1) ds
C2
C1 (4-18)
Figure 4.7. The line contour for j. Γ is shrinking onto 0 by definition (not shown in the plot) (Rice
et al. 1968)
These calculations of J-integral can still be related to SIF by J = G =KI
2
E.
Feng et al. also provided the analytical solution of the SIF for an unbridged and bridged fracture
generated at the wellbore surface undergoing in-situ stresses and wellbore pressure using the
geometry below (Feng, 2016 (a)). The SIF is calculated by using Equation 4-19 and the geometry
illustrated in Figure 4.8. Shmax, Shmin are interchangeable with σH, σh , representing the maximum
and minimum horizontal stress, respectively

26
Figure 4.8. Geometry used to calculate stress intensity factor (Feng et al. 2016 (a))
KI = (F1 + F2) ∗ [2 ∗ pw − (Shmax + Shmin)] + (F1 + 3 ∗ F2) ∗ (Shmax − Shmin) − 2 ∗ F4 ∗
(pw − pp) (4-19)
F1 =1
√πa ∫ G(r)dr
L
R
F2 =1
√πa ∫
R2
r4G(r)dr
L
R
F3 =1
√πa ∫
R4
r4G(r)dr
L
R
F4 =1
√πa ∫ G(r)dr
L
D
G(r) =1.3 − 0.3 ∗ (
r − Ra )
54
√1 − (r − R
a )2

27
where pw and pp are wellbore pressure and pore pressure behind the fracture, respectively. D is
the radial distance from the bridge location to the wellbore center. When there is no bridge in the
fracture, D and F4 will all become zero.
4.3 Fundamental equations for multi-physic coupling of thermoporoelasticity processes.
Thermal stress induced during lost circulation is controlled by three primary processes:
temperature change of the formation, redistribution of pore pressure as fluid invades, and thermal
stress generated within the rock matrix. Pore fluid flow within the formation leads to a
redistribution of the formation’s temperature due to its convective and conductive effects.
Poroelasticity with a combined mechanical and hydraulic processes during lost circulation
accounts for the pore pressure and stress variation near the wellbore region. Thermal expansion of
the solid/fluid system connects temperature redistribution with poroelasticity and generated
thermal stress.
The three mechanisms are combined in this finite element (FE) analysis. In this study, the
following fundamental equation is adopted to govern the heat transfer process within the formation
matrix (COMSOL, CFD Module User Guide):
(ρCp)eq
∂T
∂t+ ρCp𝐮 ⋅ ∇T = ∇ ⋅ (keq∇T) + Q (4-20)
This equation is a general description of the heat transfer process in porous media. Both heat
conduction and convection caused by the invasion of mud into the formation are considered in this
system. (ρCp)eq
and keq in Equation 4-20. represents the equivalent volumetric heat capacity and
the equivalent thermal conductivity of the fluid-solid system, respectively. They are calculated in
FE process using the thermal conductivity and thermal capacity of both the rock matrix material
and porous fluid. The rock matrix is considered to be fully saturated and that both the invasion

28
fluid (mud) and original fluid (reservoir fluid) properties are equal. Thus both (ρCp)eq
and keq
mentioned above can be obtained by using the porosity of the formation. 𝐮 refers to the velocity
field of pore fluid, which controls the heat convection caused by fluid leak-off (invasion of mud)
through wellbore and fracture boundaries. This FE simulation uses Darcy’s flow as the main
mechanism to determine the velocity field. This can be expressed in the following format:
𝐪 = −k
μ ∇p (4-21)
The local pore pressure distribution (hydraulic part of the model) and stress fields (mechanical
part of the model) are also combined in the model using the following thermo-poroelasticity
principles (4-22) - (4-24) (Holzbecher, 2013).
s − so = C ⋅ (ε − εo − εT) − αp (4-22)
εT = αT (T − Tref) (4-23)
ρfS ∂pf
∂t+ ∇ ⋅ (ρ𝐪) = Qf − ρfα
∂εv
∂t (4-24)
The definition of this stress-strain relationship mentioned above considers both the thermally
induced strain and pore pressure, as shown in Equation (4-22). Thermal stress is incorporated into
the modeling by induced thermal strain, denoted by εT, of rock matrix, as shown in Equation (4-
23). Pore pressure in this study is found by coupling the velocity field q from Darcy’s law with
the following continuity equation (COMSOL, Subsurface Flow User Guide).
∂
∂t(ρϕ) + ∇ ∙ (ρ𝐪) = Qm (4-25)
ϕ is defined as the porosity of the porous media. Qm is the mass going in or out of the pore
space. By considering density and porosity, both as functions of pressure, ∂
∂t(ρϕ) can be
transformed into ρfS ∂pf
∂t. S is a storage coefficient with the unit 1/Pa and can be interpreted as the
weighted compressibility of bulk materials and fluid within the pore space. At the same time, we
need to consider the change of porous space volume when we calculate the flow of pore fluid.

29
Therefore Qm can be expanded to Qf − ρfα∂εv
∂t to involve the deformation of the rock matrix with
εv t o denote the volumetric strain of the solid phase in a porous media. Thus, the continuity
equation transforms into the following generalized equation that gives us the pore pressure
distribution:
ρfS ∂pf
∂t+ ∇ ⋅ (ρ𝐪) = Qf − ρfα
∂εv
∂t (4-26)
Biot’s coefficient α appears in this part of the equation as a weighting factor for the impact of
pore pressure. It is also included in Equation (4-24) to compute the pore pressure. Pore pressure in
this model affects the stress-strain variation and deformation of the porous media. Meanwhile, the
change of the stress/strain state in porous media will also influence the pore pressure distribution
conversely, as implied in the poroelasticity Equation (4-26). In the transient FE study utilized this
study, the effects of hydraulic and mechanical modeling need to be taken in to account
simultaneously.

30
Chapter 5. Methodology
5.1 General description of finite element method
Due to the inherent complexity of lost circulation problems, we choose the finite element
method (FEM) as our tool to study the stress state of a fractured wellbore. Unlike analytical
solution that seeks the exact answers, FEM is one of the numerical methods that seeks for
approximate solutions of mathematical problems. The laws of physics for space- or time-
dependent problems are usually described in a partial differential equation. Analytically solutions
of these equations can be extremely difficult to achieve, sometimes impossible, when real-life
problems are encountered. Instead, an approximation of the initial solution can be constructed. A
simple explanation of FEM is to represent real objectives by a simplified geometry, discrete it into
elements, describe the behavior of each element individually, and reconnect these elements at
nodes, which is called meshing in finite element [Salehi, 2012]. The meshed geometry of a
fractured wellbore is showed as an example in Figure 5.1. In-situ stresses, initial temperature, and
pore pressure distribution, are pre-set on the domain of formation rock as initial conditions.
Pressure, fluid invasion rate, and temperature are presumed as boundary conditions on wellbore
and fracture surface. Stress field, displacement of the whole geometry can be deducted from outer
boundary to inner nodes and elements according to the basic law of physics predefined within the
objective model.
31
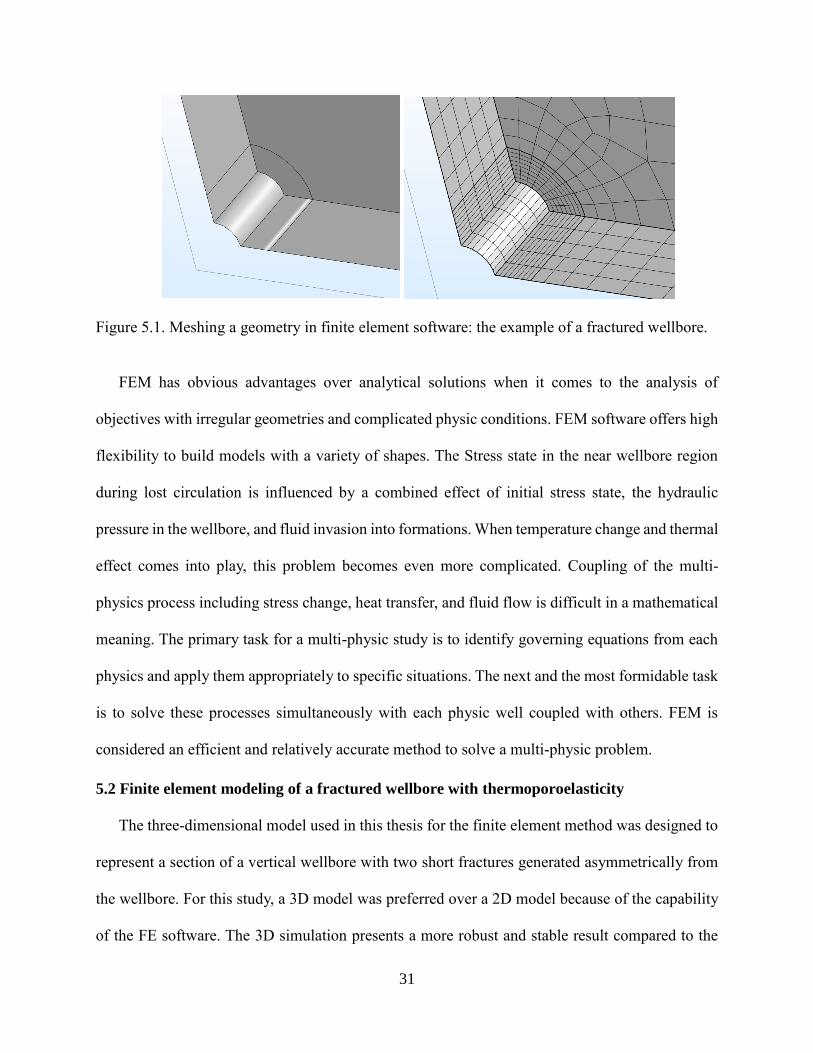
Figure 5.1. Meshing a geometry in finite element software: the example of a fractured wellbore.
FEM has obvious advantages over analytical solutions when it comes to the analysis of
objectives with irregular geometries and complicated physic conditions. FEM software offers high
flexibility to build models with a variety of shapes. The Stress state in the near wellbore region
during lost circulation is influenced by a combined effect of initial stress state, the hydraulic
pressure in the wellbore, and fluid invasion into formations. When temperature change and thermal
effect comes into play, this problem becomes even more complicated. Coupling of the multi-
physics process including stress change, heat transfer, and fluid flow is difficult in a mathematical
meaning. The primary task for a multi-physic study is to identify governing equations from each
physics and apply them appropriately to specific situations. The next and the most formidable task
is to solve these processes simultaneously with each physic well coupled with others. FEM is
considered an efficient and relatively accurate method to solve a multi-physic problem.
5.2 Finite element modeling of a fractured wellbore with thermoporoelasticity
The three-dimensional model used in this thesis for the finite element method was designed to
represent a section of a vertical wellbore with two short fractures generated asymmetrically from
the wellbore. For this study, a 3D model was preferred over a 2D model because of the capability
of the FE software. The 3D simulation presents a more robust and stable result compared to the

32
2D model when coupling the heat transfer and poroelasticity processes. Figure. 5.2(a). Illustrates
the cross-sectional area of the entire fractured wellbore’s geometry. To consider pre-existing
fractures in lost circulation and WBS, two narrow eclipse-shaped voids were established on the
wall symmetrically in the x-direction. The length of the model is much larger than the wellbore
diameter and fracture length so that the boundary effect on the stress around the wellbore and
fracture is negligible. In situ minimum and maximum horizontal stresses, Shmin and Shmax were
applied to the whole domain of the model as the initial stress state. The same wellbore pressures
were implemented on both the inner wall of the wellbore and fracture surface. Owing to the
asymmetrical feature of this problem in the horizontal direction (X-Y Plane), only a quarter of the
entire geometry is needed in the finite element study. Two symmetrical boundaries extending in
the Z direction are then established, as is displayed in Figure. 5.2(b). Uniformed pressure
boundaries were set up along wellbore wall and fracture surface. This study utilizes four nodes
quadrilateral meshes on an upper plane that sit on an x-y plane and sweep the geometry along z
direction to generate 8-nodes hexahedral elements for the 3D model, as showed in Figure 5.2(b).
Figure 5.2. Simplified diagram of (a) the cross-section of the whole wellbore and (b) 3D geometry
established in the finite element study (a quarter of the entire model with asymmetrical boundaries).
Shmin
Shmin
Shmax Shmax
Y-direction
X-direction
(a)
Symmetry boundaries
Fracture surface
Wellbore wall
(b)
33
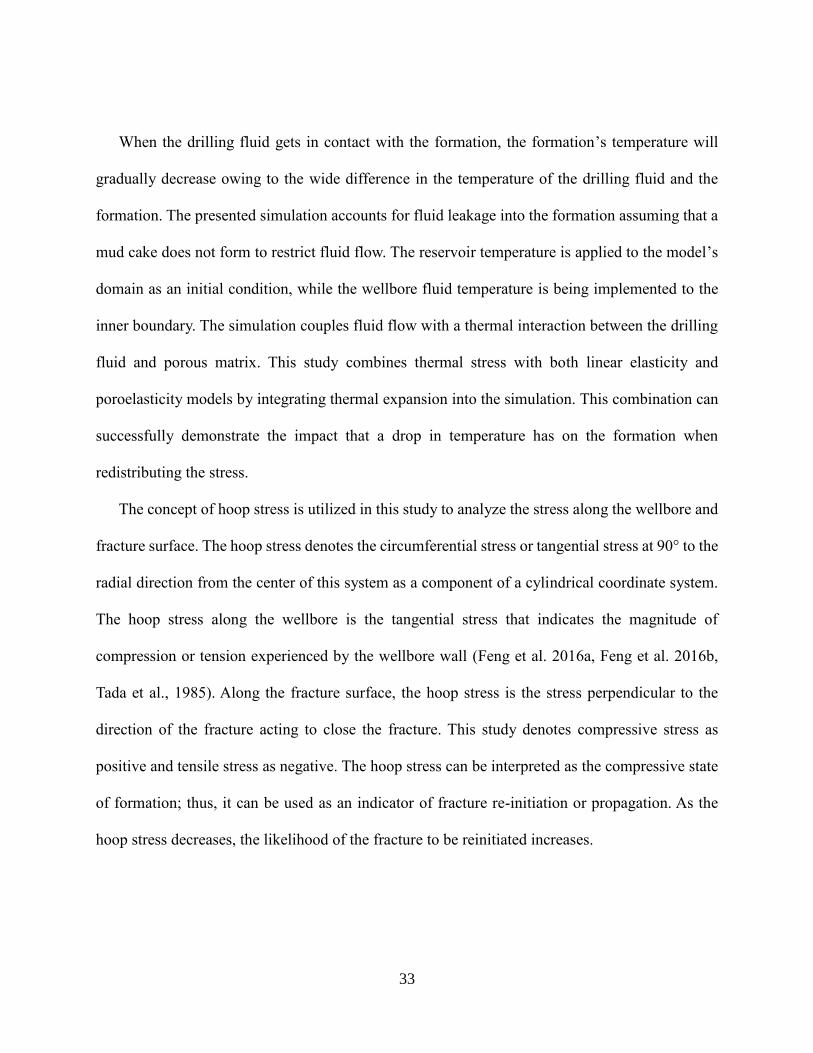
When the drilling fluid gets in contact with the formation, the formation’s temperature will
gradually decrease owing to the wide difference in the temperature of the drilling fluid and the
formation. The presented simulation accounts for fluid leakage into the formation assuming that a
mud cake does not form to restrict fluid flow. The reservoir temperature is applied to the model’s
domain as an initial condition, while the wellbore fluid temperature is being implemented to the
inner boundary. The simulation couples fluid flow with a thermal interaction between the drilling
fluid and porous matrix. This study combines thermal stress with both linear elasticity and
poroelasticity models by integrating thermal expansion into the simulation. This combination can
successfully demonstrate the impact that a drop in temperature has on the formation when
redistributing the stress.
The concept of hoop stress is utilized in this study to analyze the stress along the wellbore and
fracture surface. The hoop stress denotes the circumferential stress or tangential stress at 90° to the
radial direction from the center of this system as a component of a cylindrical coordinate system.
The hoop stress along the wellbore is the tangential stress that indicates the magnitude of
compression or tension experienced by the wellbore wall (Feng et al. 2016a, Feng et al. 2016b,
Tada et al., 1985). Along the fracture surface, the hoop stress is the stress perpendicular to the
direction of the fracture acting to close the fracture. This study denotes compressive stress as
positive and tensile stress as negative. The hoop stress can be interpreted as the compressive state
of formation; thus, it can be used as an indicator of fracture re-initiation or propagation. As the
hoop stress decreases, the likelihood of the fracture to be reinitiated increases.

34
5.3 Boundary conditions and input data
This section specifies boundary conditions and input data adopted to develop the 3D finite
element model. The model’s geometry and physical input data are established based on the data
used by Feng in his 2016 paper with some adjustments (Feng et al. 2016b). The original 3D
wellbore geometry of the model is comprised of a 160-inch long block with a 4.25-inch radius
circle subtracted from the center of the square. A bi-wing eclipse-shaped fracture with 6-inch half-
lengths emanates symmetrically from the wellbore wall in the x-direction. In situ stress consists of
maximum horizontal stress Shmax = 3,600 psi along the fracture direction, and a minimum
horizontal stress Shmin = 3000 psi perpendicular to the fracture direction. The initial formation
pore pressure was set at 1,800 psi.
5.3.1 Boundary conditions set up for lost circulation scenarios
In lost circulation scenarios with no fluid restrictions in the fracture, a 4,000psi wellbore fluid
pressure (pwf) was applied to the wellbore surface boundary and along the fracture surface to
support its opening and provide overbalanced fluid pressure. The fluid flow was controlled by
specifying the inlet flow velocity through the wellbore and fracture surface.
The thermal conditions for different initial states and boundary conditions of this model, which
drives the redistribution of wellbore stress, will be specified in this subsection. The formation’s
initial temperature was set at 180°F, and a variety of fluid temperatures were applied to the
wellbore and fracture surface to compare the changing stress redistribution. The transmission of
heat between the relatively cold wellbore fluid and the warm formation was coupled with the fluid
leakage mentioned above. The necessary parameters that are known to affect the thermal stress are
listed in Table 5.1., together with other input data used in this model. This data was compiled from
previous research about WBS and wellbore temperature discussion (Feng et al. 2016b, Kabir et al.

35
1996). Mechanical related data like Young’s modulus and in situ stress and so on in Feng’s paper
are manipulated according to standard ranges of these parameters of formation in certain depth.
Thermal properties of drilling-related materials are from tests in the field according to Kabir’s
work ( Kabir et al. 1996).
Table 5-1. Model input data
Parameters Symbol Value
Model length L 160[in]
Wellbore radius Rw 4.5[in]
Young's modulus E 1,000,000[psi]
Poison's ratio ν 0.2
Minimum horizontal stress Shmin 3,000[psi]
Maximum horizontal stress Shmax 3,600[psi]
Initial pore pressure ppore 1,800[psi]
Wellbore pressure pwf 4,000[psi]
Fracture length Lf 6[in]
Fluid leak-off rate vin 1[in/min]
Rock Permeability K 100[mD]
Rock Porosity Φ 0.3
Rock density ρr 22[lbm/gal]
Rock thermal conductivity Kr 0.87[Btu ft/ h/
ft2/°F]
Rock thermal expansion coefficient 𝛼𝑇 3E-4[1/°F]
(table cont'd.)

36
Parameters Symbol Value
Rock specific heat (Heat capacity) Cr 0.19[Btu /lbm/°F]
Drilling fluid density ρr 12[lbm/gal]
Initial reservoir temperature Tr 180°F
Wellbore fluid temperature Twf 120℉
5.3.2 Boundary conditions set-up for WBS implementation: fracture plugging and the inner filter
cake
Implementation and effectiveness of WBS are closely associated with wellbore cooling effect
and induced thermal stress. A temperature drop of formation due to cold mud invasion leads to the
thermal contraction of formation rock and pore pressure redistribution, all contributing to the stress
state in near wellbore area. Short fractures generated on the wellbore as a result of overbalance
drilling provide a much more convenient channel for fluid leak-off into the formation. This
intensifies the cooling process of formation and dramatically increased the magnitude of thermal
stress. WBS operations prevent fracture propagation through bridging and plugging fractures and
elevate hoop stress state around wellbore wall. This also intercepts the processes of fluid invasion
and heat transfer. Thermal effect on fracture stability and the risk of fracture re-initiation when
WBS is applied could differ from the simply lost circulation scenario. This study takes a step
further to study the thermal effect on fractures to evaluate whether WBS effectiveness would be
affected or weakened when a large temperature difference exists between reservoir to be drilled
and the wellbore fluid.
Though those three mechanisms of WBS mentioned above might take effect simultaneously in
practice, they are studied separately in this study to clarify their individual effect. Stress cage
theory is not examined in this study for several reasons. Stress cage explanation of WBS involves

37
hoop stress enhancement of near-wellbore area as a whole, the result on fracture tip or fracture
propagation resistance is barely discussed. Other factors related to cooling process and thermal
stress such as pore pressure and fluid leak-off are also not out of considerations. Stress change
around wellbore under stress cage theory can be studied together with closure pressure.
Extending previous finite element simulations for lost circulation, this thesis implements WBS
in two scenarios: 1) fracture bridging/plugging to test thermal effect under fracture tip isolation
and fluid restriction in the wellbore; 2) Inner filter cake buildup on fracture surface to test the
thermal effect with permeability redistribution in near-wellbore area.
In WBS implementation through fracture bridging/plugging, the fracture is plugged with lost
circulation materials (LCMs) as shown below in Figure 5.3. In this work, the plug formed inside
the fracture by LCMs across the fracture width is called an LCM bridge. For the simplification of
the model, it is assumed that LCM would form a “perfect” bridge that represents a rigid body with
zero permeability, which allows no fluid flows across the bridge. The essential function of LCM
bridge is a fluid restriction or fracture tip isolation. Drilling fluid invasion into fracture will be
restricted or prevented by the LCM bridge. And with the permeability of formation rock, fluid
inside fracture between the LCM bridge and fracture tip will still dissipate naturally into
surrounding formations. Fluid pressure and temperature in this part of fracture space behind the
bridge are thus released and maintained at the same pore pressure as in the porous media that
neighboring fracture tip. Such effect is created by setting zero fluid leak-off rate along the fracture
surface behind the LCM bridge. Fluid pressure acting on fracture surface will be specified as the
same with surround pore pressure. While wellbore pressure, fluid leak-off and wellbore fluid
temperature remain consistent on the fracture surface in front of the bridge, convective heat
transfer strengthened by fluid loss is thus restricted within this region. The LCM bridge protects

38
fracture tip from the direct contact with high wellbore pressure and low wellbore temperature.
However, temperature variation could still play an important role in the stress change in near
wellbore area. By setting up the LCM bridge in the fractured wellbore model, the author would be
able to evaluate how temperature effect could possibly undermine the WBS implementation by
bridging and plugging the fractures, especially when the fracture is plugged in varies positions.
Figure 5.3. a) WBS strengthening with different plugging positions b) Boundary loading
conditions at fracture surface when LCM plug is applied.
WBS implementation through FPR assumes finer materials would first infiltrate into the
formation through fracture surface and create a thin layer of the zone with sufficient low
permeability. Since this hypothesis allows pressure communication from the wellbore to fracture
tip, it is necessary to adjust the boundary set-up to evaluate the fluid restriction and formation
cooling effect considering different inner filter cake permeability. Previous sections regarding
fracture plugging control the fluid leak-off through one section of fracture surface to be consistent
and uniform throughout the simulation, when this section contains the same wellbore pressure
boundary. As long as formation properties remain unchanged, fluid leak-off into the formation is
Wellbore pressure/
Temperature Pore pressure
LCM bridge
(b) (a)

39
only related to wellbore fluid pressure. However, with internal filter cake build-up, fluid leak-off
would vary, even with the same wellbore pressure. Therefore, the simulation to evaluate the effect
of internal filter cake by using constant inlet pressure rather than constant leak off rate to control
fluid flow. Pressure and temperature boundaries in this section of the simulation are illustrated in
Figure 5.4a). Internal filter cake is fulfilled in the FE modeling with a thin 1mm thick layer that
covers fracture surface and fracture tip, as showed in Figure 5.4b).
Figure 5.4. a) Boundary loading conditions for WBS implementation through internal filter
cake build up and b) Internal filter cake build up inside the fracture surface, represented by a
thin layer of material with different permeability.
Wellbore temperature/pressure
Fluid leak-off (constant inlet pressure)
Internal filter cake: fluid
Internal filter cake
(a) (b)

40
Chapter 6. Preliminary Model Verification
6.1 Unbridged fracture: SIF at fracture tip under isothermal condition
One of the primary objectives of this study is to investigate the effects of induced thermal stress
on the fractures generated during lost circulation. Hoop stresses along the fracture surface, in this
case, could be an excellent reference to test the possibility of fracture re-initiation and propagation.
Unlike the breakdown pressure of an intact wellbore, the stress state at the fracture tip cannot be
translated directly into the fracturing pressure. Thus, general criteria for fracture initiation at the
fracture tip need to be utilized to evaluate the stress state at the fracture tip. However, analytical
solutions that express the stress state at the fracture tip are rare. Several analytical solutions for the
stress intensity factor at the fracture tip with two small pre-existing fractures symmetrically
emanating from an elastic wellbore have been proposed in the past. The detailed calculation can
be found in the theoretical background of this thesis.
For the unbridged fracture in this study, the SIF can serve as a useful parameter to verify the
accuracy of the presented finite element study. In this thesis, SIF was first obtained from the finite
element analysis using increasing maximum horizontal stress, under isothermal condition. The
results are validated by the comparison with an analytical solution with pure linear elasticity, also
under isothermal condition. To stay consistent with the assumptions in analytical solution, no fluid
invasion will be set up through the wellbore and fracture surface. Detailed calculation methods
used in the finite element study can be found in Chapter 4. The results were compared with SIFs
obtained from the analytical solution (Feng et al., 2015). The minimum horizontal stress, Shmin,
was set to 3000 psi; the maximum horizontal stress, Shmax, increase from 1*Shmin to 2*Shmin; and
the wellbore pressure pwf was set to 4000 psi. The comparison showed in Figure 6.1. partially

41
demonstrates the validity of the finite element study presented in this work because of how close
they match.
Figure 6.1. Comparison of the SIF obtained in this study and that obtained from the analytical
solution. Fluid leak-off is not considered.
6.2 Unbridged fracture: Induced thermal stress at fracture tip
Simulation results of this thesis can also be partially validated by hoop stress change at fracture
tip due to thermal effect. Although the SIF has been defined to measure the stress at the fracture
tip, compelling solutions for the stress state at the fracture tip under a thermal effect are rare.
However, changes in the hoop stress due to the thermal effect along an intact wellbore has long
been proposed analytically and adopted as the variation in fracture pressure, as shown in Equation
(6-1), based on the thermoelasticity theory (Fjær et al., 2008).
Δσθ =E
1−ναT(Tr − Twf) (6-1)
Δσθ is the hoop stress variation along wellbore due to temperature change; E and ν are Young’s
modulus and Poisson’s ratio, respectively; αT is the thermal compressibility, and (Twf − Tr)
represents the difference in temperature between the drilling mud contained in the wellbore and
the initial reservoir temperature. Figure 6.2. shows the induced thermal stress on an intact wellbore.
0
5,000
10,000
3,000 3,500 4,000 4,500 5,000 5,500 6,000
SIF
(p
si*
in1
/2)
Shmax (psi)
Numerical solution (results from this
study)
Analytical solution(Feng et al. 2016)

42
Its agreement with analytical solution also provided a partial verification of induced thermal
stresses calculated from the numerical soliton in this work.
Figure 6.2. Comparison between hoop stress change on intact wellbore obtained in this study and
the fracture gradient change under the cooling effect obtained from the analytical solution
6.3 Fracture with perfect bridge: WBS implementation at different positions
The difference in fracture plugging position could considerably influence the temperature and
loading conditions on fracture surface, as shown in Figure 6.3. below. When the fracture is
completely plugged at fracture mouth, the fracture contains only pore pressure and the temperature
remains the same with surrounding formations. Fracture tip, in this case, is well isolated from
lower temperature and high wellbore pressure in the wellbore. As the plugging position moves
closer to fracture tip, fracture starts to undertake higher tensile stress stemming from the wellbore
pressure/temperature inside fracture space that leads to the possible fracture propagation.
0
500
1000
1500
2000
0 20 40 60 80Hoop s
tres
s var
iati
on,
psi
Tr - Twf, oF
Numerical(From this study)
Analytical
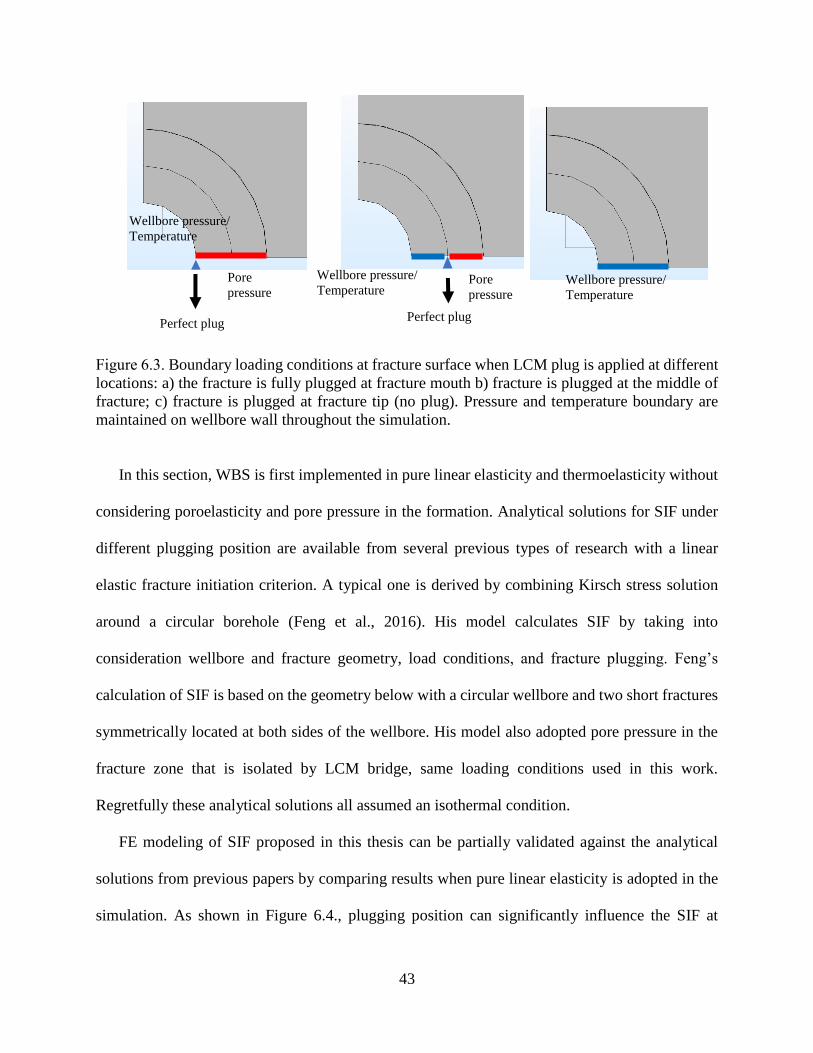
43
Figure 6.3. Boundary loading conditions at fracture surface when LCM plug is applied at different
locations: a) the fracture is fully plugged at fracture mouth b) fracture is plugged at the middle of
fracture; c) fracture is plugged at fracture tip (no plug). Pressure and temperature boundary are
maintained on wellbore wall throughout the simulation.
In this section, WBS is first implemented in pure linear elasticity and thermoelasticity without
considering poroelasticity and pore pressure in the formation. Analytical solutions for SIF under
different plugging position are available from several previous types of research with a linear
elastic fracture initiation criterion. A typical one is derived by combining Kirsch stress solution
around a circular borehole (Feng et al., 2016). His model calculates SIF by taking into
consideration wellbore and fracture geometry, load conditions, and fracture plugging. Feng’s
calculation of SIF is based on the geometry below with a circular wellbore and two short fractures
symmetrically located at both sides of the wellbore. His model also adopted pore pressure in the
fracture zone that is isolated by LCM bridge, same loading conditions used in this work.
Regretfully these analytical solutions all assumed an isothermal condition.
FE modeling of SIF proposed in this thesis can be partially validated against the analytical
solutions from previous papers by comparing results when pure linear elasticity is adopted in the
simulation. As shown in Figure 6.4., plugging position can significantly influence the SIF at
Wellbore pressure/
Temperature
Pore
pressure
Perfect plug
Wellbore pressure/
Temperature Pore
pressure
Perfect plug
Wellbore pressure/
Temperature

44
fracture tip. When the perfect plug is set-up near fracture tip, SIF is still rather high, meaning a
strong tendency of fracture initiation. As LCM bridge build up closer to fracture mouth, SIF
gradually decreases from positive to negative, showing that the stress state at fracture tip is
changing from tensile stress to compressive stress. The decreasing SIF as the fracture is plugged
by LCM bridge clearly presents that bridging the fracture reduces the risk of fracture initiation.
When SIF is lower than KIC, the critical SIF for fracture initiation, the fracture will no longer be
able to propagate under current conditions. The good accordance between the results from
numerical simulation in this thesis and analytical solution under linear elasticity validated the
effectiveness of this model.
Formation cooling effect, according to Fig. 6.4., increases SIF and strengthen the tendency of
fracture initiation. In isothermal condition, the SIF’s decline with plugging position close to
fracture mouth showed an approximately linear relationship. SIF’s change under cooling effect,
however, showed less linearity. SIF maintains a relative flattened change when LCM bridge plugs
in the middle of the fracture. This leads to a gradually enlarged SIF difference between an
isothermal condition and cooling condition as the bridge moves away from fracture tip. While
fracture tip under isothermal condition reaches to compressive stress state Such tendency means
the influence of formation cooling is relatively stronger when the plugging happens around at the
middle position of fractures. As the fracture becoming filled up by LCM completely when the
fracture is plugged near the mouth, SIF under cooling effect starts to drop in a steeper slope and
the cooling effect become less important. This also conform with our experiences that when
fracture tip is isolated from wellbore temperature, the influence of cooling effect is reduced to a
minimum.
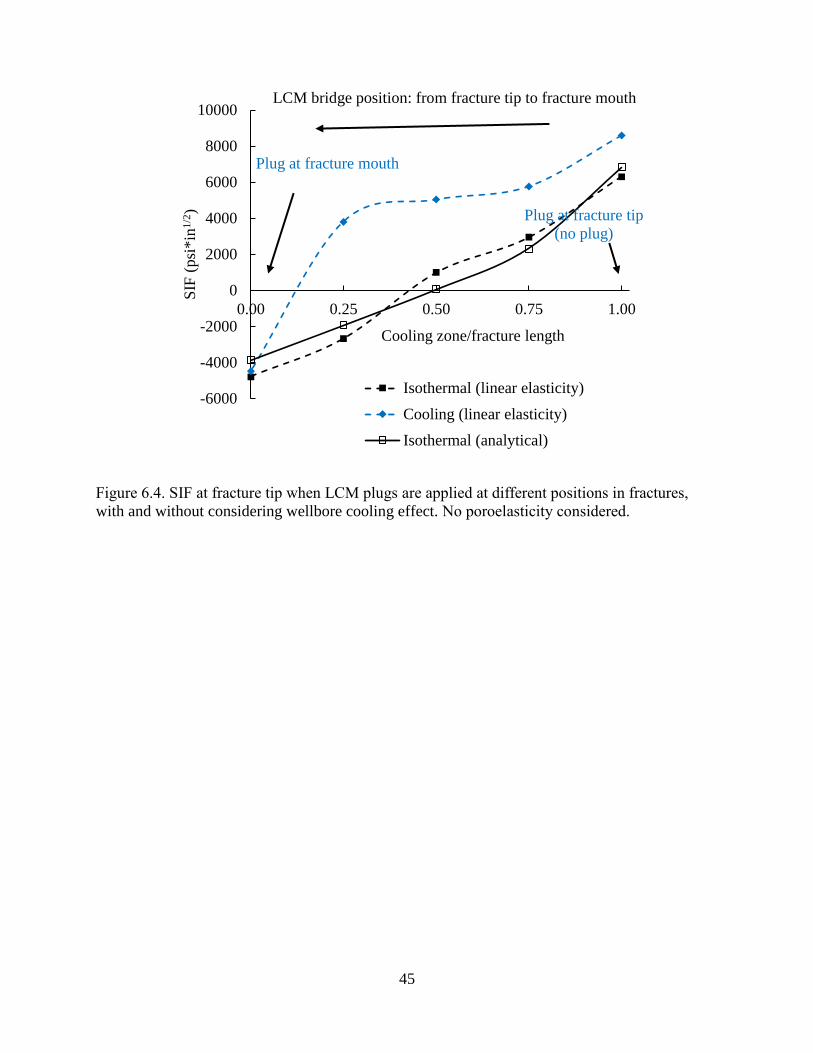
45
Figure 6.4. SIF at fracture tip when LCM plugs are applied at different positions in fractures,
with and without considering wellbore cooling effect. No poroelasticity considered.
-6000
-4000
-2000
0
2000
4000
6000
8000
10000
0.00 0.25 0.50 0.75 1.00
SIF
(psi
*in
1/2
)
Cooling zone/fracture length
Isothermal (linear elasticity)
Cooling (linear elasticity)
Isothermal (analytical)
Plug at fracture mouth
Plug at fracture tip
(no plug)
LCM bridge position: from fracture tip to fracture mouth

46
Chapter 7. Results and Discussions
7.1 Thermal stress induced along wellbore wall during lost circulation with unbridged
fractures
7.1.1 Comparison between thermoelasticity and thermoporoelasticity (with and without pore
pressure)
Stress redistribution as the formation cools was first analyzed in a thermoelasticity model
without any consideration of pore pressure. The establishment of the linear elasticity model
provides a demonstration of how the stress state changes along the fracture. The hoop stress along
the wellbore and fracture surface were obtained using a cylindrical coordinate system. The results
were then compared with the thermo-poroelasticity simulation. As the high-temperature reservoir
(180°F) interacts with relatively cold mud (120°F) at the wellbore and fracture surface, heat
transmission in these two cases occurs only in the form of conductive heat transfer. To better plot
the results, the hoop stress along wellbore wall is plotted by the clockwise rotation angle to the
maximum horizontal stress. The range is from 0° to 90°, taking the angle at the fracture mouth to
be 0°. The hoop stress along the fracture surface is plotted along the distance away from the
wellbore wall. These two types of plotting were also adopted in the following section. Hoop stress
was first generated without considering any thermal effects (refer to “isothermal condition” in the
following figures). The result was then compared with the hoop stress while the formation was
cooled by using a lower temperature along the wellbore and fracture face (refer to “cooling” in the
following figures).
The previous section is applicable only when drilling is done into a formation with very low
permeability, such as shale. However, when a lost circulation process is the emphasis of the model,
the fluid leakage rate will become the dominant parameter controlling the heat exchange and
thermal stress. Therefore, a poroelasticity model is adopted in this section to present more

47
representative results. The initial reservoir pore pressure ppore was set at 1800 psi, and a relatively
small leak-off velocity vin = 0.1 inches/minute was predefined at the wellbore formation interface
in the poroelasticity domain. The initial reservoir and wellbore temperature, in this case, are 180°F
and 120°F, respectively.
In both the thermoelasticity model with no pore pressure and thermo-poroelasticity model, the
hoop stress decreases dramatically along the wellbore when the wellbore is cooled down,
especially at 90° to the maximum stress direction (Figure 7.1.). It could be observed that the hoop
stress reduction due to wellbore cooling remains constant. The hoop stress, however, in the
poroelasticity model was seen to be lower than that in the linear elasticity model due to pore
pressure.
Figure 7.1. Thermal impact on hoop stress along the wellbore wall.
Figure 7.2. shows that the hoop stress along the fracture face is also reduced considerably near
the tip when considering the effects of cooling. This variation in stress indicates decreasing
compressive stress during the cooling process of the formation rock. Such a phenomenon reveals
0
2,000
4,000
6,000
0 10 20 30 40 50 60 70 80 90
Hoop s
tres
s (p
si)
θ(o)
Linear elasticity (isothermal) Poroelasticity(isothermal)
Thermoelasticity(cooling) Thermo-poro-elasticity(cooling)

48
that the tensile stress is more likely to occur in the fractured area, which will increase the chance
of reinitiating the fracture.
Figure 7.2. a) Thermal impact on hoop stress along the fracture surface and b) SIF at fracture tip.
Both the linear elasticity model and poroelasticity model with constant pore pressure were
considered.
Here, the SIF for both cases was collected and compared to analyze the effect of thermal stress
on the initiation of pre-existing fractures. The simulation results showed both the elasticity model
and poroelasticity model with pore pressure had similar SIF increases, indicating the variation in
-5,000
0
5,000
0 2 4 6
Hoops
stre
ss (
psi
)
Distance from wellbore (in)
Linear elasticity (isothermal)
Poroelasticity(Isothermal)
Thermoelasticity(cooling)
Thermo-poro-elasticity(cooling)
9,732
6,968
9,857
7,108
0 4,000 8,000 12,000
Thermo-poro-elasticity
(cooling)
Poroelasticity
(isothermal)
Thermoelasticity
(cooling)
Linear elasticity
(isothermal)
SIF (psi*in1/2)
(b)
(a)

49
pore pressure. Cooling the formation did not have a significant effect on the initiation of the
fracture under the thermal effect even though it does have an impact on the stress state around the
fracture tip. Additional interpretations of the role of the pore pressure during wellbore cooling are
provided in the sections that follow.
7.1.2 Parametric Study on Wellbore Temperature
One of the major forces that drive the redistribution of near wellbore thermal stress is the
temperature difference between the wellbore fluid and the formation. In this section, a sensitivity
analysis of the stress redistribution of the formation with different wellbore fluid temperatures was
compiled. The initial fluid temperatures were 80°F, 115°F, and 150°F, while the initial reservoir
temperature was set at 180°F. The initial pore pressure of the reservoir pporewas set at 1800 psi.
As shown in Figure 7.3a), the difference between the initial temperature of the reservoir and
the drilling fluid has a significant impact on the final hoop stress. This phenomenon suggests that
an enormous risk of re-initiating the fracture once the high-temperature reservoir is in contact with
the drilling fluid exists. Such an occurrence would undoubtedly jeopardize the wellbore’s stability.
Conversely, ignoring the thermal effects during the drilling design process will lead to an
overestimation of wellbore stability. The maximum decrease in the hoop stress on the wellbore
wall caused by thermal shock can also be observed in Fig. 6b.The results show an excellent
agreement with the analytical solution obtained from Equation Δσθ =E
1−ναT(Twf − Tr), as is
illustrated in Figure 7.3b). Unlike an intact wellbore, a wellbore with existing fractures does not
undergo uniform stress reduction owing to the temperature change. The maximum hoop stress
variation occurs at the wellbore along the same direction as Shmax, as is shown in Figure 7.3b).,
while the hoop stress at the fracture mouth would remain almost the same. These results imply
that, in such a situation, when the fracture has already been generated, it is very likely for the

50
wellbore failure to occur in the same direction as the minimum horizontal stress direction when a
large temperature difference exists.
Fig. 7.3. (a) Hoop stress variation along the wellbore wall under the thermal effect. (b) Maximum
stress change (90o to the fracture mouth) are compared with the analytical model.
The results plotted in Figure 7.4. show that, under the thermal effect, the hoop stress does not
change along the fracture face, but it drops at the fracture tip. The change in hoop stress indicates
that the fracture tip is subjected to a higher tensile stress when the formation confronts the lower
temperature drilling fluid. The SIF at the fracture tip confirmed this observation.
0
500
1000
1500
2000
2500
3000
0 10 20 30 40 50 60 70 80 90
Hoop s
tres
s (p
si)
θ(o)
Isothermal Twf = 80ºFTwf = 115ºF Twf = 150ºF
0
500
1000
1500
2000
2500
0 50 100
Hoop s
tres
var
iati
on (
psi
)Formation temperature reduction
(ºF)
Numerical model
(Thermo-poro-elasticity)
Analyticle solution
(a) (b)

51
Figure 7.4. (a) Hoop stress along the fracture face and (b) SIF under the formation cooling effect.
7.1.3 Parametric Study on Maximum Horizontal Stress
In this study, simulations of different maximum horizontal stresses were conducted while
maintaining the same minimum horizontal stress. The minimum horizontal stress Shmin was set at
3000 psi with increasing maximum horizontal stresses Shmax/Shmin= 1, 1.3, 1.6 and 2. Figure 7.5.
below shows that an increase in the hoop stress occurs when the maximum horizontal stress
increases. When a strong anisotropy exists in the formation, strong compressive stress will occur
in the wellbore at 90° to the maximum horizontal stress. Such an increase indicates growing
compressive stress, and relatively high wellbore stability of the wellbore when there is high
maximum horizontal stress. The results in Figure 7.5. show that, for the same pore pressure state,
stress reduction due to the formation cooling process remains the same for different horizontal
stress constants.
-6000
-4000
-2000
0
2000
4000
0 1 2 3 4 5 6
Hoops
stre
ss (
psi
)
Distance from wellbore (in)
IsothermalTwf = 80ºFTwf = 115ºFTwf = 150ºF
6,000
7,000
8,000
9,000
10,000
11,000
12,000
50 100 150 200
SIF
(psi
*in
1/2
)
Twf (ºF)
(a) (b)

52
Figure 7.5. Hoop stress along the wellbore wall under the thermal effect (thermo-poroelasticity
model).
From Figure 7.6., one can observe a noticeable increase in SIF at the fracture tip when the
horizontal stress anisotropy is stronger, which means it is more likely for the fracture to initiate
further. In this case, the difference in the SIF under the thermal effect remains the same, as we did
not change the temperature condition under the cooling effect.
-2000
0
2000
4000
6000
8000
10000
0 10 20 30 40 50 60 70 80 90
Hoop s
tres
s (p
si)
θ(o)
1 (cooling) 1.3 (cooling) 1.6 (cooling)
2 (cooling) 1 (isothermal) 1.3 (isothermal)
1.6 (isothermal) 2 (isothermal)Shmax/Shmin
Shmin = 3000 psi

53
Figure 7.6. SIF under the thermal effect; poroelasticity model with different horizontal stress
anisotropies. Minimum horizontal stress is set to 3000 psi.
7.1.4 Parametric Study on Rock Properties (Young’s Modulus and Poisson’s Ratio)
Young’s modulus and Poisson’s ratio are two important formation properties. These two
parameters also appear in the analytical solution used to determine the fracture pressure under
thermal effect. A sensitivity analysis was conducted in this section to investigate the effect of a
variety of combinations of Young’s moduli and Poisson’s ratios of the hoop stress along the
wellbore and fracture face. A sensitivity study on Young’s modulus was conducted by using the
various values of E (E1 = 1x10⁶ psi, E2 = 1.5 x10⁶ psi, and E3 = 2 x10⁶ psi) while maintaining a
constant Poisson’s ratio. The same was done for Poisson’s ratio by using a different value of ν (ν1
= 0.2, ν2 = 0.25, and ν3 = 0.3) as Young’s modulus remained constant. The results displayed in
Fig.10 show that thermal stress induced along the wellbore is strongly influenced by Young’s
modulus but is less affected by Poisson’s ratio. The results are shown in Figure 7.7a). also display
that tensile stress might occur on the wellbore when Young’s modulus is high, which indicates a
high probability of further instability on the wellbore, besides the risk of fracture re-initiation.
0
2,000
4,000
6,000
8,000
10,000
12,000
3,000 4,000 5,000 6,000
SIF
(psi
*in
1/2
)
Shmax (psi)
Cooling
Isothermal

54
Figure 7.7. Hoop stress along the wellbore wall under the cooling effect with different a) Young’s
moduli and b) Poisson’s ratios.
In previous studies, to find the analytical solution of the SIF at the fracture tip for a fracture
that extends from the wellbore, Young’s modulus and Poisson’s ratio were not included in the
calculation. Owing to the consideration of the thermal stress, the two parameters need to be taken
into account. The results displayed below in Figure 7-8 indicate an apparent increase in the tensile
-1000
-500
0
500
1000
1500
2000
2500
3000
0 10 20 30 40 50 60 70 80 90
Hoop s
tres
s (p
si)
θ(o)
E = 1E6(cooling) E = 1.5E6(cooling) E = 2E6(cooling)E = 1E6(isothermal) E = 1.5E6( isothermal) E = 2E6(isothermal)
ν = 0.2
0
500
1000
1500
2000
2500
3000
0 10 20 30 40 50 60 70 80 90
Hoop s
tres
s (p
si)
θ(o)
v = 0.2(cooling) v = 0.25(cooling) v = 0.3(cooling)v = 0.2(isothermal) v = 0.25(isothermal) v = 0.3(isothermal)
E = 1E6 psi
(a)
(b)

55
stress at the fracture tip when Young’s modulus is increased. The effect of Poisson’s ratio, however,
is minimal.
Figure 7.8. SIF under the formation cooling effect for (a) changing Young’s moduli (constant
Poisson’s ration of 0.2), and (b) changing Poisson’s ratio (constant Young’s modulus of 1E6
psi), thermo-poroelasticity model.
7.1.5 Parametric Study on Fluid leak-off (formation permeability)
Severe lost circulation can occur when drilling through a formation with a narrow mud window.
The rate of drilling fluid loss into the formation depends on a variety of parameters, including the
permeability of the rock, filter cake building-ups, differential pressure, and the presence of
fractures on the wellbore. Depending on different fluid leak-off rates, convective heat transfer
induced by cold fluid invasion is also strongly altered. This study uses a predetermined formation
permeability to control the fluid leak-off through wellbore wall and fracture surface to study the
degree of fluid loss on thermal stress.
As illustrated in Figure 7.9a)., an increase in the rock permeability did not result in a
considerable change in the hoop stress along the wellbore under either isothermal conditions or
4,000
6,000
8,000
10,000
12,000
14,000
16,000
1.0E+6 1.5E+6 2.0E+6
SIF
(psi
*in
1/2
)
Young's modulus(E, psi)
With thermal effect
Isothermal condition
4,000
6,000
8,000
10,000
12,000
14,000
16,000
0.2 0.25 0.3S
IF (
psi
*in
1/2
)
Poisson's ratio (ν)
With thermal effect
Isothermal condition
(a) (b)

56
the cooling process of the wellbore. Under the isothermal condition, hoop stress is not changed
with formation permeability.
Analysis of the SIF confirmed the previous observation that fluid leak-off does not have a high
impact when the thermal effect is not considered. When the cooling process comes into play, the
fluid leak-off rate can have a significant effect on the fracture tip stress state. According to Figure
7-9b), the SIF can be continuously elevated by an increase in the fluid leak-off rate.
Figure 7.9. a) Hoop stress along the wellbore wall under the cooling effect and b) SIF with different
formation permeability
7.2 Statistical analysis: contribution of the individual parameter to thermal effect with
unbridged fractures
Four main parameters related to the induced thermal stress and cooling effect on fracture tip
are studied in the last section, including formation permeability, Young’s modulus, Poisson’s ratio,
and wellbore temperature. Besides the individual effect of these parameters on SIF, another aspect
that interest the author is to measure and compare their overall contribution to SIF and the
possibility of fracture re-initiation during formation cooling process. Analysis of Variance
(ANOVA) Test is a statistical technique that can be used to quantitatively assess the influences of
0
1000
2000
3000
0 15 30 45 60 75 90
Hoop s
tres
s, p
si
θ(o)
10mD 50mD100mD 300mDIsothermal
0
5000
10000
15000
20000
25000
0 100 200 300
SIF
(psi
1/2
)
Permeability, mD
Isothermal
Cooling
(a) (b)

57
the independent parameter on a consequential change of a dependent variable, SIF, in our case.
This method is originally used to compare the potential difference among group means by
calculating the variances of dependent variable caused by individual parameters. ANOVA Test
has different purposes of usage depending on the number of independent variables that could
potentially explain the variance of the dependent variable. One-way ANOVA test can be used to
test whether different groups of data have similar distribution based on their means according to
only one variable. Two or N-way ANOVA study the variance of a data-set related to multiple
variables. N-way ANOVA Test can be used to determine whether a group of data differs
concerning each of the several targeted variables.
In this study, the author uses N-way ANOVA Test to examine whether a change of each
parameter can cause severe variance in SIF value, in another word, can be most influential. N-way
ANOVA Test was conducted with the input data from Table 7-1, which collects simulation results
of SIF of different lost circulation scenarios in the last section. Effect of wellbore pressure is also
included here as another principle factor that controls the SIF and fractures re-initiation. The value
range of wellbore pressure is set to be 1*Smin to 2*Smin, which is 3000psi to 6000psi. The
primary condition to conduct an effective ANOVA Test is to involve all major parameter that is
relevant to the change of SIF. The omission of essential factors can mislead the application of
ANOVA Test in practical work. A majority of downhole drilling-related parameters and formation
conditions can be accounted for by the parameters selected for the ANOVA Test in this study.
Wellbore pressure is an indication of the downhole mechanical conditions caused by ECD, drill
string movement, and other abnormal drilling activity. Formation permeability is the major
consideration of formation that controls fluid loss into the formation. It is also a major cause of
formation temperature due to convective heat transfer. Young’s Modulus and Poisson’s ratio

58
decides the formation mechanical properties, and wellbore temperature specifies the difference
between wellbore temperature and initial reservoir temperature. In conduction of ANOVA test,
one important process is to determine a reasonable range of value for each parameter. Rock
properties in this section are chosen to represent a regular sandstone. Rock permeability changes
from 10 mD to 300 mD, Young’s Modulus changes from 1.45E5 psi to 3E6 psi, Poisson’s ration
from 0.1 to 0.3.
Table 7.1. Inputs for N-way ANOVA test: parameters and SIF.
Wellbore
pressure
Rock
permeability
Young’s
Modulus
Poisson’s
ration
Wellbore
temperature
SIF
4000 100 1.00E+06 0.10 120 1.61E+04
4000 100 1.00E+06 0.20 120 1.62E+04
4000 100 1.00E+06 0.30 120 1.62E+04
4000 100 1.45E+05 0.2 120 8.91E+03
4000 100 1.00E+06 0.2 120 1.62E+04
4000 100 2.00E+06 0.2 120 2.08E+04
4000 100 3.00E+06 0.2 120 2.38E+04
4000 100 1.00E+06 0.2 120 1.62E+04
4000 100 1.00E+06 0.2 80 1.89E+04
4000 100 1.00E+06 0.2 150 1.21E+04
4000 10 1.00E+06 0.2 120 1.00E+04
4000 50 1.00E+06 0.2 120 1.39E+04
4000 100 1.00E+06 0.2 120 1.62E+04
4000 200 1.00E+06 0.2 120 1.89E+04
(table cont'd.)

59
Wellbore
pressure
Rock
permeability
Young’s
Modulus
Poisson’s
ration
Wellbore
temperature
SIF
4000 300 1.00E+06 0.2 120 2.08E+04
4000 0 1.00E+06 0.2 80 1.19E+04
4000 0 1.00E+06 0.2 115 9.97E+03
4000 0 1.00E+06 0.2 150 8.49E+03
3000 0 1.00E+06 0.2 120 4.80E+03
4000 0 1.00E+06 0.2 120 9.50E+03
5000 0 1.00E+06 0.2 120 1.40E+04
6000 0 1.00E+06 0.2 120 1.86E+04
Table 7.2. summarizes the P-value report from N-way ANOVA test. P-value of each variable
indicates the significance of individual parameters within their chosen range to the overall variance
of SIF. The smaller P-value a parameter gives the more severe SIF response to the change of this
parameter, the more important it is. Generally, when P-value of a variable is less than 0.05,
engineers consider this variable as having a substantial influence on SIF. As shown in Table 7.2.,
wellbore pressure, rock permeability and Young’s Modulus gives the P-value far less than the 0.05
threshold. This indicates that wellbore pressure alone can contribute dramatically to the change of
SIF. Fluid leak-off into formation controlled by formation permeability is also significant due to
formation cooling effect. The increase of fluid loss should thus be a primary consideration that
poses the risk of fracture instability when a large temperature difference exists between wellbore
and reservoir. Young’s Modulus is another major contributor to SIF fluctuates. With a normal
range of value from 1.45E5 to 3E6 psi, Young’s Modulus has a P-value of less than 0.0001 that
signals a sufficient influence. On the other hand, wellbore temperature surely affects thermal

60
stresses around fracture tip with P-value of 0.0031. This means the temperature contrast between
wellbore and reservoir, varies from low to high, has a certain degree of influence, yet not
significantly, on SIF change due to thermal stress. However, the importance of wellbore
temperature should not be underestimated since it is the source of thermal stress and the reason
why other factors can affect SIF so much. Among the parameters tested in this study, Poisson’s
ratio has the least effect on the thermal effect induced around fracture tip.
Table 7.2. The output of the N-way ANOVA Test
Source DF
Sum of
Squares Mean Square F Value Pr > F
Model 5 446098930.7 89219786.1 42.54 <.0001
Error 16 33553845.6 2097115.4
Corrected Total 21 479652776.3
Source DF Type I SS Mean Square F Value Pr > F
Wellbore pressure 1 5.06E+07 5.06E+07 24.14 0.0002
Rock permeability 1 2.29E+08 2.29E+08 109.26 <.0001
Young’s Modulus 1 1.41E+08 1.41E+08 67.22 <.0001
Poisson’s ration 1 4.13E+03 4.13E+03 0 0.9651
Wellbore temperature 1 2.54E+07 2.54E+07 12.1 0.0031
Sum of Squares in the output gives the squares of deviation of an actual value from the means
of predicted value when the current parameters as a predictor. It explains the contribution of each
parameter to the variance of the dependent variable, SIF. The higher sum of the square a parameter

61
has, the more relevant this parameter will be to the SIF. Sum of Square can be expressed in
percentage of the total sum of the square as showed in Figure 7.10. Formation permeability
accounts for the 51% of the total SIF change when formation cooling is under consideration, which
is the highest among all parameters included in the test. Wellbore pressure is also significant with
11% of the contribution. Change of wellbore temperature contributes to 6% of the SIF change.
Young’s Modulus is responsible for 32% of the SIF change. Poisson’s Ration has the lowest
percentage, less than 1%. The results in this section can be especially useful when engineers
prioritize the consideration of varies parameters to assess the deterioration of lost circulation,
especially when high fluid leak-off rate and temperature difference exists simultaneously.
Figure 7.10. The individual contribution of each parameter in percentage
Regression analysis is then conducted subsequently to obtain a predicting model of SIF with
the normal rage of parameters. From the plot of the earlier lost circulation simulation, between SIF
and each of the important parameters, approximately linear relationships can be observed, leading
Wellbore
pressure
11%
Rock
permeability
51%
Young’s
Modulus
32%
Poisson’s ration
0%
Wellbore temperature
6%

62
to the linear model as our primary consideration. The ANOVA test implies that formation
mechanical properties have negligible influence on the variance of SIF under formation cooling
process. The linear model is only tested between SIF and leak-off rate, wellbore pressure, and
wellbore temperature. The results of linear regression are shown in Table 7.3.
Table7.3. The output of the linear regression test
Source DF Sum of Squares Mean Squares F Value Pr > F
Model 5 446098930.7 89219786.1 42.54 <.0001
Error 16 33553845.6 2097115.4
Corrected Total 21 479652776.3
Root MSE 1448.142 R-Square 0.93
Dependent Mean 14657 Adj R-Sq 0.9082
Parameter Estimate Standard Error t Value Pr > |t|
Intercept -3303.74 4127.2612 -0.8 0.4352
Wellbore pressure 4.274083 0.61093 7 <.0001
Rock permeability 43.40158 4.31083 10.07 <.0001
Young’s Modulus 0.005092 0.00062 8.24 <.0001
Wellbore temperature -71.328 20.50648 -3.48 0.0031
The general prediction model of SIF is provided by the following equations:
SIF = −3303 + 4.27 ∗ Pwf + 43.40 ∗ ρ + 0.005 ∗ E − 71.38 ∗ Twf (7-1)

63
The test for the overall linear regression analysis outputs F-value = 54.93 and Pr > F less than
0.0001, confirms that the selected model predictor have a significant response on SIF. The value
of R-Square is used to evaluate how much of the actual calculated SIF can be explained by the
predicted SIF from the linear model. It measures the goodness-of-fit for linear regression, but it
can be misleading for multivariate analysis. Adjusted R-Square is used to compensate for this error,
and it gives a value of 0.90, showing a strong predicting power of this linear model.
7.3 Thermal effect on pre-existing fractures with WBS implementation
7.3.1 Comparison between thermoelasticity and thermoporoelasticity (with and without pore
pressure)
This section Influences of WBS implementation on thermal effect induced during fluid invasion
have been explained in detail in Chapter 5 and Chapter 6. Figure 7.11 gives the trend of SIF change
during WBS when poroelasticity and thermoporoelasticity model is adopted into FE study. Fluid
leak-off rate is pre-set to be zero in Chapter 6 for the preliminary validation with the analytical
solution, which has no fluid leak-off consideration. The figure shows that when poroelasticity is
taken into accounts, SIF is overall higher than the result from pure linear elasticity. The decline of
SIF as plugging position moves to fracture mouth shows similar trend showed in
thermoporoelasticity. It also has a gentle decline followed by a more dramatic falling. If we
consider linear elasticity model to represent low permeability formations and poroelasticity model
for formations with considerable permeability and porosity. This observation implies that WBS
implementation in permeable formation is less effective than low permeability formations when
similar fracture geometry and loading condition is under consideration. Comparing to linear
elasticity and thermoelasticity simulation, thermal effect on SIF in this section is rather uniform,
nor differing much with plugging position.

64
Figure 7.11. SIF at fracture tip with LCM bridging the fracture at different positions, with and
without considering wellbore cooling effect. Consider poroelasticity and pore pressure in the
formation.
7.3.2 Thermal effect on SIF with WBS implementation with different fluid leak-off rate
Zero fluid leak-off rate set-up utilized in Section 7.3.1 benefits the simplification of the
simulation for the preliminary discussion, but it doesn’t comply with the assumption of uniform
temperature boundary inside fracture space. When inside fluid fracture remains static, fluid
temperature yields to the temperature of surrounding formation. It can hardly maintain at the
constant wellbore temperature during simulation, as assumed in modeling methodology of this
study. The constant wellbore temperature assumption is most effective when fracture fluid keeps
being fed by wellbore fluid as fluid loss happens. Thus, in this section, a sensitivity analysis on
-8000
-6000
-4000
-2000
0
2000
4000
6000
8000
10000
12000
0.00 0.25 0.50 0.75 1.00
SIF
(psi
*in
1/2
)
Isolated zone/fracture length
Isothermal(with pore pressure)Cooling (with pore pressure)Isothermal (without pore pressure)Cooling (without pore pressure)
Plug at fracture tip
(No plug)
Plug at fracture mouth
LCM bridge position: from fracture tip to fracture mouth

65
fluid leak-off rate is carried out to further clarity the cooling effect on thermal stress and fracture
re-initiation.
Figure 7.12., summarizes the SIF under cooling effect at different plugging position, with
different fluid leak-off rate applied. As suggested by the case of simply lost circulation earlier
without fracture plugging, fluid leak-off can dramatically elevate the SIF under cooling effect. The
quantitative difference between SIF under isothermal and cooling condition remain relatively
stable, despite the different plugging position. The general trend of SIF with a series of fluid leak-
off rate presents the same observation as in Section 6.3: formation cooling effect can increase the
SIF and weaken the WBS implementation. Another interesting observation is that higher leak-off
rate leads to lower SIF when the fracture is plugged at the mouth. This indicates that when a
fracture is fully plugged, cooling effect act to reinforce the compressive stress state at fracture tip.

66
Figure 7.12. SIF at fracture tip with LCM bridging the fracture at different positions, with and
without considering wellbore cooling effect. Consider poroelasticity and pore pressure in the
formation.
7.3.3 Thermal effect on pre-existing fractures during WBS with inner filter cake build-up
Figure 7.13. summarizes the simulation results of SIF at fracture tip with different inner filter
cake permeability. When inner filter cake permeability equals the formation permeability (100
mD), it is the equivalent of the state when no filter cake is formed, and fluid can leak through
fracture surface with no restriction. This yields the maximum cooling effect on SIF due to high
fluid leak-off rate. As showed in Figure 7.13., despite the minimal thickness of inner filter cake
layer, fluid leak-off and influence of the cooling effect of fracture initiation can still be strongly
undermined when sufficiently low permeability created in this layer. However, without
considering the mechanical strength of the inner filter cake, this mechanism can only protect
-15,000
-10,000
-5,000
0
5,000
10,000
15,000
20,000
0.00 0.25 0.50 0.75 1.00
SIF
(p
si*
in1
/2)
Plugging position to fracture mouth/fracture length
Vin=0in/min(isothermal) Vin=0in/min (cooling)
Vin=0.1in/min(isothermal) Vin=0.1in/min(isothermal)
Vin=0.2in/min(isothermal) Vin=0.2in/min (cooling)
Vin=0.3in/min(isothermal) Vin=0.3in/min (cooling)
Vin=0.4in/min(isothermal) Vin=0.4in/min (cooling)
Cooling condition
Isothermal condition
LCM bridge position: from fracture tip to fracture mouth
Plug at fracture mouth

67
fracture tip from the influence of high fluid leak-off rate. Fracture tip is still exposed to high
wellbore pressure and low fluid temperature.
Figure 7.13. SIF with different inner filter cake permeability, with and without considering
wellbore cooling effect.
6,000
8,000
10,000
12,000
14,000
16,000
0.00010.0010.010.1110100
SIF
(psi
*in
1/2
)
Inner filter cake permeability, mD
Isothermal Cooling

68
Chapter 8. Laboratory Experiments to Explore Wellbore Temperature
Control Using Thermal Insulating Materials
Besides the thermal property data presented in the Methodology section, this study also designs
a series of experiments to explore the reasonable range of those properties and temperature set-ups
of formation and wellbore fluid. The author considers the necessity of such experiment in two
ways. Simulation of thermal stresses in near wellbore formation relies on the input of temperature
parameters and thermal properties of all relevant materials including thermal conductivities and
specific heat. Among those, thermal properties of drilling fluid are directly related to the
temperature distribution in wellbore besides drilling operations. Filter cake formed on wellbore by
drilling fluid of different type can also have a positive or negative side effect on heat exchange
process in the wellbore (Teodoriu et al., 2016, Ichim et al. 2017). Thermal conductivities and
specific heat, especially for drilling fluid, varies with different drilling fluid additives. More
importantly, the variation of fluid properties due to change in its component can have an overall
influence on the temperature distribution in the wellbore. During drilling practices, large quantities
of fluid additives are added into a fluid such as light weight material for underbalanced drilling,
LCMs et al. These materials can have a significant influence on the properties, especially the
thermal properties, of drilling fluid. Fluctuation of wellbore temperature caused by the use of these
materials is also worth studying. These are all important factor to consider when it comes to the
input of thermoporoelasticity modeling established in this study. Thus, although thermal properties
in the simulation are fixed as the same as earlier studies, it’s still strongly recommended to explore
the range of possible thermal properties values according to specific drilling fluid types.
Secondly, the efforts to study the thermal properties of one leads to the possibility to control
wellbore temperature with either physical or chemical methods. Engineers have striven to mitigate
the negative effect of temperature on both reservoir rock and wellbore fluid. Other than induced

69
thermal stress induced in near wellbore region, fluid properties change during temperature
fluctuation also concerns the petroleum engineers. Unlikely to control heat loss of formation, most
works in this area were conducted to improve fluid endurance to high temperature. Other
researchers managed to identify factors that influence temperature increase in the wellbore,
including drilling-related parameters like circulation rate and wellbore dimensions (Maury et al.
1995, Gonzalez et al. 2005). A preliminary experiment was also performed trying to heat up the
bottom hole by adding chemical composition in drilling fluid (Hoxha, 2016). Despite these efforts,
potentials of managing fluid properties, thermal properties especially, have not been fully
recognized yet.
Given these two considerations, a series of experiments are conducted in Chapter 8 at the end
of this thesis to explore the possibility of wellbore and reservoir rock temperature control by using
drilling fluid additives with specialized thermal properties. Preliminary experiments were
performed firstly, and the results were implemented in mathematical modeling to examine the
wellbore and formation temperature. The logic is to reduce the thermal exchange between the
wellbore and circulating fluid to a minimum so their temperature won’t be influenced by each
other. Fluid additives are of interest mostly because some of them have already been applied during
drilling for purposes such as mud weight control or fracture plugging. Another advantage regards
the convenience of their implementation that needs no interruption of the current drilling process.
Chapter 8 aims to identify the additive that alters the fluid thermal properties most effectively,
referred to as thermal insulating additives (TIA). The effect of TIA is in three-fold. First of all, a
variation of mud weight will change the mass flow and heat flow process during drilling. Secondly,
these additives are expected to change thermal conductivity and heat capacity of drilling fluid.
Most importantly, when the relatively high concentration of TIA is used in drilling fluid,

70
components of filter cake generated during this process could be altered considerably. With the
existence of low thermal conductivity components, thermal properties of mud cake will be
decreased. These three effects all contribute to the overall temperature profile of wellbore and
formation in near wellbore region. Three types of additives are identified for preliminary tests due
to their low thermal conductivity: hollow glass bubble or hollow glass sphere (HGS), magma fiber
lost circulations materials (LCM), fiberglass, and glass beads. Hollow glass bubble is the most
promising materials among them. And applied it into analytical and numerical models to examine
its effectiveness in wellbore temperature control.
HGS is small-sized glass bubble with hollow space inside filled with air. With considerably
low density, it has been utilized by the industry as a weight reducer during drilling depleted
reservoirs with low fracture pressure. Despite its excellent thermal insulating properties, its
thermal effect on the drilling process is rarely studied. Other selected materials can also have low
thermal conductivities. Magma fiber is a coarse material consist of minerals and other fibrous
materials that can be applied to plug the fractures and mitigate lost circulation. It is fully soluble
in water or water-based drilling fluid. Fiber glass with shorter length can also be added into drilling
fluid for the same purpose. Glass beads are solid glass sphere that is not soluble in water and with
much higher density and strength. It is only used in a small amount as a lubricant in drill strings
and other bottomhole facilities.
For the first step in this report, a thermal property analyzer was utilized to characterize the
effect of these materials on the thermal properties of drilling fluids and filter cakes. This step was
specially designed to compare the performance of different materials and identified the additives
that could alter the thermal properties of drilling fluid and filter cake most effectively. Thermal
properties test results of drilling fluid and filter cake were then collected to be used in the second

71
step as input to simulate the downhole temperature profiles in the wellbore and surrounding
formations. Finally, the most optimized performance of the TIAs on temperature control is
evaluated, both as whole mud treatment and locally applied thermal barrier with filter cake.
8.1 Preliminary experiments of drilling fluid and filter cake properties after adding special
fluid additives
Experiments were first conducted to characterize the effect of these materials on the thermal
properties of drilling fluids and filter cakes. Filter cakes were generated using OFITE filter press
(as shown in Figure 8.1a).), Thermal conductivity and specific heat of drilling fluids and filter
cakes were tested – samples with and without HGS using TPS500S thermal conductivity analyzer
(as shown in Figure 8-1b)). Here drilling fluids were prepared with water and 8% bentonite.
Figure 8.1. (a) OFITE Filter Press used for generating filter cakes and (b) thermal conductivity
analyzer – HotDisk TPS500S
(a) (b)

72
8.1.1 Thermal properties test with HGS
In this test, HGS is added into drilling fluid with gradually increasing concentrations up to a
maximum value of 42% in volume. Filter cakes samples generated with and without HGS are
shown in Figure 8.2. Table 8.1. and 8.2. shows thermal properties of drilling fluids and filter cakes
with and without adding HGS. Figure 8.3. and 8.4. summarizes the trend of these properties. The
thickness of thermal insulating filter cakes with HGS was measured as 6 mm, comparing to 2 mm
for regular filter cake with 8% bentonite.
Figure 8.2. Filter cake generated by low gravity solids drilling mud without HGS (sample at left),
and with a high concentration of HGS (right).
Table 8.1. Thermal properties of drilling fluid with and without adding HGS
Sample type regular with 15% HGS with 30% HGS with 42% HGS

73
Density (kg/m3) 1039 960 880 767
Thermal conductivity (W/m. k) 0.69 0.58 0.47 0.40
Specific heat, mass (J/kg. K) 3742 3689 3093 3035
Figure 8.3. Change of thermal properties of drilling fluid by adding HGS
Table 8.2. Thermal properties of filter cake with and without adding HGS
Sample type regular 15% HGS 30% HGS 42% HGS
density (kg/m3) 1772.00 995.00 710.00 700.00
Thermal conductivity (W/m. k) 0.62 0.41 0.36 0.31
Specific heat (J/kg. K) 2579.01 2703.52 2692.00 2757
Specific heat (MJ/m3.K) 3.89 3.54 2.72 2.33
0.00
500.00
1000.00
1500.00
2000.00
2500.00
3000.00
3500.00
4000.00
0.00
0.10
0.20
0.30
0.40
0.50
0.60
0.70
0.80
regular
mud
mud with
15% HGS
mud with
30% HGS
mud with
42% HGS
J/kg.K
W/m
.K
Thermal conductivity W/mk
Specific heat (mass) J/kg.K

74
Figure 8.4. change of thermal properties of filter cake by adding HGS
8.1.2 Thermal properties test with magma fiber LCM
Use of magma fiber in mud is measure by kg/m3 or lb/bbl (1lb/bbl = 2.85 kg/m3). Normal
range of magma fiber concentration is 6-84 kg/m3 (2-30 lb/bbl). Here magma fiber was added
with a relatively high concentration to test its thermal effect when used in a large amount. As
shown in the results Table 8-3 below, magma fiber has negligible effect on thermal properties of
fluid and filter cake.
0.00
500.00
1000.00
1500.00
2000.00
2500.00
3000.00
0.00
0.10
0.20
0.30
0.40
0.50
0.60
0.70
regular mud
cake
mud cake with
15% HGS
mud cake with
30% HGS
mud cake with
42% HGS
Thermal conductivity W/mk Specific heat (mass) J/kg.K

75
Table 8.3. Thermal properties of drilling fluid and filter cake with and without adding magma fiber
Sample type: drilling fluid
Additive concentration 17.5 lb/bbl 35 lb/bbl
Thermal conductivity (W/m. k) 0.69 0.67
Specific heat, mass (J/kg. K) 3789 3850
Sample type: filter cake
Additive concentration 17.5 lb/bbl 35 lb/bbl
Thermal conductivity (W/m. k) 0.61 0.64
Specific heat, mass (J/kg. K) 2611 2701
8.1.3 Thermal properties test with fiberglass
Fiberglass is a commonly used fibrous material that can improve cement strength and
minimize cement loss through fractures on the wellbore. When the size of fiberglass is small
enough, this material can also be applied into drilling fluid in relatively large quantity as an
LCM. 3mm short fiberglass has recently been produced for the application of LCM. The thermal
conductivity of fiberglass can be as low as 0.04 – 0.2W/m. K, which is the reason why it is
selected. Unlike powdered HGS, fiberglass cannot be dissolved into the fluid. Normal use of
fiberglass in cement is only 2 lb/bbl. Here it is used as an additive in the mud with much higher
concentrations: 5% in volume (17.3 lb/bbl) and 10% in volume (34.1 lb/bbl) of fiberglass were
used. Thermal conductivity and specific heat were then tested for both mud and filter cake.
According to the test results in Table 8.4., fiberglass can reduce the thermal conductivity of mud
and filter cake, but the influence is very limited.

76
Table 8.4. Thermal properties of drilling fluid with and without adding fiberglass
Sample type: drilling fluid
Additive concentration 17 lb/bbl 34 lb/bbl
Thermal conductivity (W/m. k) 0.65 0.62
Specific heat, mass (J/kg. K) 3730 3685
Sample type: filter cake
Additive concentration 17 lb/bbl 34 lb/bbl
Thermal conductivity (W/m. k) 0.61 0.58
Specific heat, mass (J/kg. K) 2736 2668
8.1.4 Thermal properties test with glass beads
The concentration of glass beads is also measured by weight. It is usually used in mud system
as a lubricant to reduce friction of downhole equipment. Due to its high strength and density, glass
beads are usually used in a low concentration up to 5.7 lb/bbl. Without that limitation in this study,
we increase the use it to a much higher concentration to test the influence of glass beads in an
extreme situation. From the results in Table 8.5., although used in a very high concentration, glass
beads still have minimal effect on mud and filter cake properties.

77
Table 8.5. Thermal properties of mud
Sample type: drilling fluid
Additive concentration in drilling fluid 80 lb/bbl
Thermal conductivity (W/m. k) 0.67
Specific heat, mass (J/kg. K) 3708
Sample type: filter cake
Additive concentration in drilling fluid 80 lb/bbl (80 g/350mL)
Thermal conductivity (W/m. k) 0.63
Specific heat, mass (J/kg. K) 2705
8.2 Modelling temperature profile in the wellbore and surrounding formation.
Among three candidates with low thermal conductivity, HGS has the strongest effect on
thermal properties of drilling fluid and filter cake. Thus HGS is the optimal candidates of TIA.
The thermal insulating effect of this selected TIA was then evaluated through temperature profile
modeling within the wellbore and formations. Experimental data regarding HGS were
implemented as input parameters. TIA alters overall wellbore temperature when used in the whole
mud treatment. When applied in only a short period, especially when used as an LCM pill,
components of filter cake formed at this period can be significant change. Wellbore temperature
might remain unchanged, but the surrounding formation might be protected by the newly formed
filter cake made by the TIA pill.
8.2.1 TIA used as whole mud treatment
In this scenario, measured densities and thermal properties of drilling fluid were used to
calculate convective heat transfer coefficients during mud circulation. Thermal conductivities of

78
filter cakes were used to obtain the overall heat transfer coefficient through wellbore wall. These
two coefficient are two deciding factors of wellbore temperature distribution. The calculation
assumes cased hole for the upper section of the wellbore (no filter cake buildup and heat transfer
through casing and cement) and openhole for lower sections of the wellbore, as is showed in Figure
8.5. Up,Ua1 Ua2 represents overall heat transfer coefficient through drilling pipe, wellbore wall
with casing, and wellbore wall with filter cake respectively.
Figure 8.5. Mud circulation and heat transfer system while drilling.
Ua1 (upper
annulus
with casing)
Ua2 (lower
annulus open
hole with filter
cake)
Up (drill pipe)
Fluid and heat flow System
Upper wellbore
(2/3 total depth,
with casing)
Lower wellbore
(1/3 total depth,
open hole with
filter cake)

79
Table 8.6. Input parameters for fluid and heat flow simulations taken from previous literature
Parameters Value(field unit) Value (SI)
Model length 400 in 10 m
Wellbore radius 4.25 in 0.1075 m
Rock Permeability 100 mD 9.8692E−14 m²
Rock Porosity 0.3 0.3
Rock density 0.0979 lbm/in3 2709.9 kg/m³
Rock thermal conductivity 1.15 Btu/(ft*F*hour) 2 W/(m*K)
Rock thermal expansion coefficient 1.6E-5 F-1 3 E−5 K-1
Rock specific heat(heat capacity) 0.19 Btu/(lb/F) 790 J/(kg*K)
Fluid viscosity 23 cP 0.023 Pa·s
Mud thermal
conductivity(Kabir ,1996)
1 Btu/(ft*F*hour) 1.7 W/(m*K)
Drilling fluid specific heat(Kabir,
1996)
0.4 Btu/(lb/F) 1673 J/(kg*K)
In Table 8.3. and 8.6., we note differences between thermal properties of drilling fluid from
literature compared to the ones from experiments conducted in this project. The differences are
partially owning to the relatively simple composition of drilling fluids in our experiments. Previous
work has proved the great impact of drilling fluid additives on the thermal properties of drilling
fluid (Teodoriu et al. 2016). As a result, more tests are required in the second half of the project to
further clarify this finding. For fluid system 1 and 2, the authors assumed HGS only affect thermal
properties of filter cakes in each drilling fluid system while thermal properties of whole drilling

80
fluid system remain the same. For fluid system 3, thermal properties of both drilling fluid and
filter cakes follows the measured values in the experiments. Influence of HGS filter cake on
overall heat transfer coefficients is presented in Table 8.7.:
Table 8.7. Overall heat transfer coefficients used for calculation of drilling fluid temperature
profiles during drilling.
Base fluid system
1(data from literature)
Base fluid system 2(data
from experiments)
Fluid system 3(HGS
drilling fluid and
HGS filter cake)
Filter cake type Regular
filter cake
HGS filter
cake
Regular
filter cake
HGS filter
cake HGS filter cake
Thermal
conductivity,
W/(m*K)
1.7 0.634 0.329
Specific heat,
J/(kg*K) 1673 4042 3966
Up, W/(m2K) 319 178 135
Ua1, W/(m2K) 198 133 109
Ua2 , W/(m2K) 131 18 99 16 15
Temperature profiles in annuli are shown in Figure 8.6.; these results were obtained using
Kabir’s model with parameters from Table 8.6. According to the results, drilling fluid temperature
in the annulus is much higher when drilling fluid system one was used, which was anticipated
since mud system one is of considerably higher thermal conductivity and specific heat. The effect
of a thermal insulating filter cake on mud circulating temperature took place mainly through the
decrease in overall heat transfer coefficient in openhole sections. Nevertheless, this reduction of
overall heat transfer in wellbore does not result in a significant change to annular temperatures.
Bottomhole temperature was reduced by around 8 K after the establishment of thermal insulating
filter on open hole section. On the other hand, if one were to compare the bottomhole temperature
with fluid system 1 and fluid system 3, a significant temperature difference- over 20 K reduction

81
can be observed, which indicates significant cooling effect using the thermal properties from mud
sample in this study comparing to the thermal properties in previous literature. Additional tests
will be performed to justify the results, more tests with different concentration of HGS as well
other TIAs candidates will be evaluated.
Figure 8.6. Mud circulating temperature in the annulus with different mud systems and filter cakes
8.2.2 Localized thermal insulating filter cake and implication on thermal wellbore strengthening
The second scenario is the application of locally applied thermal barrier as a pill, ultimately
the thermal wellbore strengthening that can be achieved by this method. This process can result in
the redistribution of formation temperature at a depth of applied thermal barrier while the whole
wellbore temperature remains relatively unchanged. Finite element analysis was used, and a 3D
wellbore model with filter cake layers was established, as showed in Figure 8.7. To simulate the
285
295
305
315
325
335
345
355
365
0 500 1000 1500 2000 2500 3000
Tem
per
ature
, K
Depth, m
mud 1( regular filter cake) mud 1( HGS filter cake)mud 2( regular fiter cake) mud 2 ( HGS filter cake)mud 3 (HGS mud and filter cake) geothermal temprature

82
effect of a local insulating filter cake, the filter cake layer in the middle was preset to be low
thermal conductivity, which neighbors regular filter cakes without HGS.
Temperature distribution in formation rocks at a depth of local thermal barrier was plotted from
the interface between filter cake and formation to the internal formation along path 1 and path 2,
as showed in Figure 8-7. Path 1 represents scenario a): the formation rock is covered by regular
filter cake without the use of HGS. Path 2 represents scenario b): the formation rock is covered by
thermal insulating filter cake with the use of HGS. Scenario c) represents low permeability
formations like shales, where only heat conduction is considered in the porous media; Scenario d)
represents highly permeable formations, heat convection due to fluid leak-off into the formation
cannot be neglected.
Figure 8.7. Schematic of the wellbore and near-wellbore formation. Heat transmission from
wellbore along path 1 and 2. Path one represents the temperature of formation that is covered by
regular filter cake without the use of HGS. Path two represents formation that is covered by thermal
insulating filter cake with HGS.
The results in Figure 8.8. shows that though reduced from 0.61 to 0.31 W/m.K by using HGS,
thermal conductivities of filter cake has minimal effect on formation temperature distribution
1
2
Thermal Insulating
filter cake (with HGS,
5m in length)

83
around the wellbore. The cooling process of formation is dominated by the fluid invasion. As long
as filter cake is built up on wellbore wall as fluid restriction, cooling process can be limited
sufficiently, regardless of the thermal properties of the filter cake.
Figure 8.8. Temperature distribution with a) regular filter cake, b) thermal insulating filter cake
using HGS, c) no filter cake while considering heat conduction only, d) no filter cake while
considering heat convection with fluid invasion and pore fluid flow, in addition to heat conduction.
Assuming low permeability of filter cake, no fluid leak-off into formation was allowed when filter
cake was generated. Simulation time was set to be t = 1h.
8.3 Discussion of the simulation results.
The Effectiveness of HGS containing mud as whole mud treatment in controlling the
temperature inside the wellbore is satisfactory when a high concentration of HGS is used in the
mud. In the case study provided in this research, over 20 K of temperature increase in bottomhole
temperature at steady state condition is observed when a very high concentration (42% volumetric
concentration) of HGS was used. With such as high reduction in mud weight, wells in which this
method can be applied is limited without the addition of weighting material or managed pressure
310
320
330
340
350
360
370
0 1 2 3 4 5
Form
atio
n t
emper
ature
, K
Distance to wellbore, m
a. (regular filter cake): t=1h
b. (HGS filter cake): t=1h
c. (no filter cake, conduction only): t=1h
d. (no filter cake, convection+conduction): t=1h

84
drilling devices. Therefore evaluation should be carefully performed before applying such a
method.
On the other hand, HGS containing drilling fluids is not very effective in achieving localized
thermal wellbore strengthening by creating filter cakes with low thermal conductivity. Based on
case study performed in this investigation, with one hour of circulation after the thermal insulating
filter cake was applied, sand face temperature has no obvious difference with regular filter cake.

85
Chapter 9. Conclusions and Recommendations.
During drilling practices, the temperature change of the surrounding rock, as a consequence of
the invasion of mud, has been identified as a vital factor that can cause wellbore instability and
severe lost circulation. Nevertheless, most of the relevant research has been conducted in the
context of the intact wellbore. There is still a lack of understanding of how the thermal effect
influences a wellbore with pre-existing or induced short fractures, which is commonly encountered
in lost circulation scenarios. This study carried out a 3D finite element model to simulate the stress
redistribution under thermal effect around a wellbore with short fractures. Cold fluid invasion
through wellbore wall and fracture surface were utilized as a primary parameter that dominates the
local temperature and pore pressure change, both of which were included in the thermo-
poroelasticity modeling.
The results of this study lead to the following conclusions:
• As near-fracture formation rock is cooled down by the wellbore fluid, the hoop stress along
the wellbore wall decreases. This leads to a lower compressive stress state and a weakened
wellbore.
• Owing to the thermal effect created by the reduction of formation temperature, the hoop
stress around the tip of a pre-existing fracture also significantly reduces. This indicates that
it is likely that a fracture re-initiation (the initiation of pre-existing or drilling induced
fractures) will occur as a result of the cold invasion of mud, which can lead to a more severe
lost circulation event.
• When a substantial temperature difference exists between the formation rock and wellbore
fluid, stress variation is not uniform along the wellbore. Maximum stress reduction along
the wellbore occurs at the wellbore with the direction perpendicular to the fracture

86
extending direction. This signals an increasing possibility of wellbore instability at those
points.
• The horizontal stress state is an important parameter that controls the stress state in the
near-wellbore region. While the compressive stresses acting on the wellbore wall are
intensified by an elevation of Shmax, the SIF analysis shows that the fracture tip sustains
higher tensile stress and experiences a higher risk of fracture initiation.
• Of the two most prominent rock materials properties, an increase in Young’s modulus
could lead to a more significant elevation in thermal stress induced by wellbore cooling.
Poisson’s ratio, however, has an insufficient impact on the stress state in the near-wellbore
region.
• Under same loading condition, fracture plugging in linear elasticity model is more effective
than in poroelasticity model, regarding the decrease of SIF with same plugging position.
• Inner filer cake build-up effectively diminishes the cooling effect on fracture tip associated
with fluid leak-off. But itself alone cannot protect fracture tip from initiating under high
fluid pressure and low temperature.
According to the results and conclusions of this study, following recommendations can be
suggested to field application of WBS while taking thermal effect into consideration:
• The effectiveness of WBS is strongly weakened as formation temperature decreases due to
cold mud invasion. Plugging at fracture mouth can minimize the thermal effect on fracture
tip the most. This justifies always choosing larger PSD of LCM materials when fracture is
plugging dominate the effectiveness of WBS and fracture reinitiation prevention.
• Fluid leak-off rate, or lost circulation rate, significantly intensifies the negative effect of
formation cooling on fracture re-initiation. Preliminary lost circulation prevention methods

87
are suggested before WBS implementation, especially when high fluid loss rate and a large
temperature drop of formation exist simultaneously during drilling.
In this thesis, some necessary assumptions and simplification are made due to the limitation of
the FEM tool, to avoid an over-complicated simulation, and to maintain a consistent topic of
discussion. Several future works are suggested based on these assumptions.
1. Due to the limitation of the FEM software adopted in this study, the author assumed a
sufficient rock strength, meaning fracture propagation is not allowed in any loading
condition. The analysis of fracture propagation is thus limited within the study of SIF, and
no relation is established to fracture pressure, which is a much more useful parameter in
drilling practice. Therefore, future works are suggested to connect the simulation of stress
state in near wellbore region with the actual fracture re-initiation pressure during lost
circulation. The author suggests establishing the mathematical relationship between the
wellbore fracture pressure and breakdown criteria of pre-existing fractures under thermal
effect, as fracture toughness (or “stress intensity”) in this study.
2. Extending the current work to actual fracture pressure is also beneficial to consider
different rock type and more complicated loading conditions into the analysis of lost
circulation under the formation cooling process.
3. The simulation in this thesis adopted input data from previous literature. Future simulations
based on real operation dataset including temperature measurement are suggested to
provide substantial instructions to specific drilling scenarios in practice with the concerns
of the severe cooling effect of near wellbore formation.
4. This thesis only analyzed a few important factors in ANOVA test. More parametric studies
on fracture geometry, in situ stress state, and thermal properties of related materials are

88
suggested in future simulations and subsequent ANOVA analysis to delineate the
importance of different factors on induced thermal stress and possible fracture propagation
under thermal effect.
5. More experimental works are encouraged to explore the possible range of fluid thermal
properties of mud with different compositions when considering the heat exchange
between circulating fluid and formation in near wellbore region. This will be crucial to the
calculation of temperature drop and thus induced thermal stresses in near wellbore region.

89
References
Anderson, T. L. (1995). Fracture Mechanics: Fundamentals and Applications, Second
edition. CRC Publications, 49-51.
Bhushan, A. et al. (2015). Finite element evaluation of j-integral in 3d for nuclear grade graphite
using COMSOL-Multiphysics. 2015 COMSOL Conference.
Chang, J. H. and Becker, E. B. (1992) Finite element calculation of energy release Rate for 2-d
rubbery material problems with Non-conservative crack surface tractions. International
journal for numerical methods in engineering. 33: 907-927
Chen, G., and Ewy, R. T. (2005). “Thermoporoelastic Effect on Wellbore Stability”. SPE
Journal.10: 121-129. https://doi.org/10.2118/89039-PA.
Chen, Y., Yu, M., Takach, N., Shi, Z., and Gao, C. (2015). Hidden Impact of Mud Loss on
Wellbore State of Stresses Disclosed by Thermal-Poro-Elastic Modeling. 49th U.S. Rock
Mechanics/Geomechanics Symposium.
Chen, Y., Yu, M., Miska, S., Ozbayoglu, E., Zhou, and Al-Khanferi, Nasser. (2017) “Fluid flow
and Heat Transfer Modeling in the Event of Lost Circulation and Its Application in
Locating Loss Zones. Journal of Petroleum Science and Engineering. 148: 1-9,
https://doi.org/10.1016/j.petrol.2016.08.030.
Clifton, R. J., Simonsen, E. R., Jones, A. H., and Green, S. J. (1976). Determination of the critical
stress intensity factor, KIC, from internally pressurized thick-walled vessels. 16: 233-238.
COMSOL, Subsurface Flow Module User Guide (Darcy’s flow)
COMSOL, CFD Module User Guide (Heat Transfer and Non-isothermal flow)
Dokhani, V., Ma, Y., and Yu, M. (2016). Determination of equivalent circulating density of drilling
fluids in deepwater drilling. Journal of Natural Gas Science and Engineering. 34: 1096-
1105, https://doi.org/10.1016/j.jngse.2016.08.009.
Feng, Y., Arlanoglu, C., Podnos, E., Becker, E., & Gray, K. E. (2015). Finite-Element Studies of
Hoop-Stress Enhancement for Wellbore Strengthening. Society of Petroleum
Engineers, https://doi.org/10.2118/168001-PA
Feng, Y., Gray, K. E. (2016) a. A fracture-mechanics-based model for wellbore strengthening
Applications. Journal of Natural Gas Science and Engineering. 29: 392-400.
https://doi.org/10.1016/j.jngse.2016.01.028.
Feng, Y., Gray, K.E. (2016) b. A parametric study for wellbore strengthening,”Journal of
Natural Gas Science and Engineering, 30: 350-363,
https://doi.org/10.1016/j.jngse.2016.02.045.

90
Feng, Y., Gray, K.E., 2017, Review of fundamental studies on lost circulation and wellbore
Strengthening. Journal of Petroleum Science and Engineering. 152: 511-522.
https://doi.org/10.1016/j.petrol.2017.01.052.
Fjær, E. and Holt, R.M. (2008). Stresses around boreholes - Borehole failure criteria. Petroleum
Related Rock mechanics. Elsevier. 4: 135-174
Gonzalez, M. E., Bloys, J. B., Lofton, J. E., Pepin, G. P., Schmidt, J. H., Naquin, C. J., Laursen, P.
E. (2004). Increasing Effective Fracture Gradients by Managing Wellbore Temperatures.
IADC/SPE Drilling Conference.
Guo, Q., Feng, Y. Z., Jin, Z.H. (2011). Fracture Aperture for Wellbore Strengthening Applications.
45th U.S. Rock Mechanics / Geomechanics Symposium. American Rock Mechanics
Association.
Guo, T., Li, Y., et al., (2017). Evaluation of Acid Fracturing Treatments in Shale Formation. Energy
& Fuels 31(10): 10479-10489. https://doi.org/10.1021/acs.energyfuels.7b01398.
Hettema, M. H. H., Bostram, B., Lund, T. (2004). Analysis of Lost Circulation during Drilling in
Cooled Formations. Society of Petroleum Engineers, SPE Annual Technical Conference
and Exhibition.
Holzbecher E., 2013, Poroelasticity Benchmarking for FEM on Analytical Solutions, COMSOL
Conference.
Hoxha, B. B., Incedalip, O., Vajargah, A. K., Hale, A., & Oort, E. van. (2016).
Thermal Wellbore Strengthening: System Design, Testing, and Modeling. SPE Deepwater
Drilling and Completions Conference. https://doi.org/10.2118/180315-MS.
Ito, T., Zoback, M.D., Peska, P. (2001). Utilization of Mud Weights in Excess of the Least Principal
Stress to Stabilize Wellbores: Theory and Practical Examples. SPE Drilling and
Completion. 16: 221–229. https://doi.org/10.2118/57007-PA.
Kabir, C. S., Hasan, A. R., Kouba, G. E., & Ameen, M. (1996). Determining Circulating
Fluid Temperature in Drilling, Workover, and Well Control Operations. Society of
Petroleum Engineers. https://doi.org/10.2118/24581-PA.
Knappett, J. A., and Craig, R. F. (2012). Soil mechanics. Eighth edition. CRC Press. 78-79.
Maury, V. and Guenot, A. (1995). Practical advantages of mud cooling systems for drilling. SPE
Drilling and Completion, 42-48.
Morita, N., and Fuh, G.-F. (2011). Parametric Analysis of Wellbore Strengthening Methods from
Basic Rock mechanics. Society of Petroleum Engineers.
https://doi.org/10.2118/145765-MS.

91
Mehrabian, A., Jamison, D. E., & Teodorescu, S. G. (2015). Geomechanics of Lost-Circulation
Events and Wellbore-Strengthening Operations. SPE Drilling & Completion. 20(06): 1305-
1316.
Nguyen, D. A., Miska, S. Z., Yu, M., & Saasen, A. (2010). Modeling Thermal Effects on Wellbore
Stability. Society of Petroleum Engineers conference. https://doi.org/10.2118/133428-MS.
Pepin, G., Gonzalez, M., Bloys, J. B., Lofton, J., Schmidt, J., Naquin, C., and Ellis, S. (2004).
“Effect of Drilling Fluid Temperature on Fracture Gradient: Field Measurements And
Model Predictions”. American Rock Mechanics Association, the 6th North America Rock
Mechanics Symposium (NARMS).
Perkins, T.K. and Gonzalez, J.A. (1984). Changes in Earth Stresses around a Wellbore Caused by
Radial Symmetrical Pressure and Temperature Gradients. Society of Petroleum Engineers
Journal. 24(02). https://doi.org/10.2118/10080-PA.
Perkins, T. K., & Gonzalez, J. A. (1985). The Effect of Thermoelastic Stresses on Injection Well
Fracturing. Society of Petroleum Engineers Journal. 25(01): 78-88.
https://doi.org/10.2118/11332-PA.
Rinne, M., Shen, B., Stephansson, O. (2012). Fracture Propagation from Mechanical, Thermal and
Hydraulic loadings. Harmonising Rock Engineering and the Environment, Qian & Zhou
(eds) Taylor & Francis Group, London. 511-515.
Rice,J. R. (1968). A Path Independent Integral and the Approximate Analysis of Strain
Concentration by Notches and Cracks. Journal of Applied Mechanics. 35: 379-386.
Salehi, Sale., and Nygaard, R. (2011). Evaluation of New Drilling Approach for Widening
Operational Window: Implications for Wellbore Strengthening. SPE Production and
Operations Symposium. https://doi.org/10.2118/140753-MS.
Salehi, S. (2012). Numerical simulations of fracture propagation and sealing: implications for
wellbore strengthening. Doctoral Dissertations. Missouri University of Science and
Technology.
Smith, M., B. and Montgomery, Carl. (2015) Hydraulic Fracturing. CRC Press. 112-114.
Tang, L., & Luo, P. (1998). The Effect of the Thermal Stress on Wellbore Stability.
SPE India Oil and Gas Conference and Exhibition. https://doi.org/10.2118/39505-MS.
Tada, H., Paris, P.C., Irwin, G.R. (1985). The Stress Analysis of Cracks Handbook. Paris
Productions & (Del Research Corp.).
Van Oort, E., Friedheim, J. E., Pierce, T., & Lee, J. (2011). Avoiding Losses in Depleted
and Weak Zones by Constantly Strengthening Wellbores. SPE Drilling & Completion.

92
26(04). https://doi.org/10.2118/125093-PA.
Van Oort, E., and Razavi, O. S. (2014). Wellbore Strengthening and Casing Smear: The Common
Underlying Mechanism. IADC/SPE Drilling Conference and Exhibition.
https://doi.org/10.2118/168041-MS
Yan, C., Deng, J., Li, D., Chen, Z., Hu, L., Li, Y., (2014), Borehole Stability in High-Temperature
Formations, Rock Mechanics and Rock Engineering. 47(6): 2199–2209,
https://doi.org/10.1007/s00603-013-0496-2.
Rui, Z., Lu, J., Zhang, Z., Guo, R., Ling, K., Zhang, R. and Patil, S. (2017). A quantitative oil and
gas reservoir evaluation system for development. Journal of Natural Gas Science and
Engineering. 42: 31-39. https://doi.org/10.1016/j.jngse.2017.02.026.
Zhong, R., Miska, S., and Yu, M. (2017). Parametric study of controllable parameters in fracture-
based wellbore strengthening. Journal of Natural Gas Science and Engineering. 43: 13-
21. https://doi.org/10.1016/j.jngse.2017.03.018.
Zhong, R., Miska, S. and Yu, M. (2017). Modeling of near-wellbore fracturing for wellbore
strengthening. Journal of Natural Gas Science and Engineering. 38: 475-484
https://doi.org/10.1016/j.jngse.2017.01.009.
Zhou, X., Aydin, A., Liu, F. and Pollard, D. D. (2010). Numerical Modeling of Secondary Thermal
Fractures in Hot Dry Geothermal Reservoirs, 35th Workshop on Geothermal Reservoir
Engineering, Stanford University.

93
Vita
Ze Wang is an international student from Inner Mongolia Autonomous Region in China. Ze
holds his B.S. degree in petroleum engineering from China University of Petroleum (Beijing). He
began his study at Louisiana State University in Spring of 2016. Ze then worked as a research
assistant from August of 2016 in the research group funded by Professor Yuanhang Chen until the
end of his Master’s study.