Embed Size (px)
Citation preview

Australian Journal of Basic and Applied Sciences, 3(4): 3297-3306, 2009
ISSN 1991-8178
Corresponding Author: Hossein Hassani, Assistance professor at Mining, Metallurgy faculty, Amirkabir industrial
university, Tehran, Iran.
Email: [email protected]
Tel: +98(21)64540 Fax: +98(21)66413969
3297
The Fracture Network Modeling in Naturally Fractured Reservoirs Using Artificial
Neural Network Based on Image Loges and Core Measurements
Hamid Sarkheil, Hossein Hassani, Firuz Alinia
Faculty of Mining and Metallurgy Engineering, Amirkabir university of Technology, Tehran, Iran.
Abstract: High gas production from the Dashtak formation of Tabnak hydrocarbon field in Fars
province, Iran, indicates the presence of natural fractured reservoir whose production potential is
dominated by the structural fracture. In this field among 30 wells distributed over the study area, 57
percent have image logs (17 wells) and 3 are core wells with core length of 112m. Observations of
natural fractures in core or image logs typically give limited information on orientation, aperture and
intensity. Because of the sparseness of well bore intersections of fractures, data analysis results in
incomplete statistical characterization of the fracture population, leaving interwell characterization
almost impossible. Using basic fracture mechanics models and a novel core-testing technique, we
propose that the fundamental shape of fracture parameter distributions can be predicted, and that there
is a characteristic, quantifiable relationship between fracture length, spacing and aperture. A nonlinear
simulation and assessment model of reservoir fracturing was established using the artificial neural
network (ANN) technology to simulate the structure and function of the neural network (NN) of the
human brain with engineering technology. The developed nonlinear modeling and forecasting system
was used to assess and forecast the reservoir fracture distribution in Tabnak. The correlation between
observed and predicted fracture density for training, validation and test data were 0.92, 0.86 and 0.88
percent respectively. The results of this study provided useful and essential information for scientific
researches in these areas and production hydrocarbon rates assessment. With this information, fracture
distribution model and reservoir productivity can be estimated for the purpose of flow simulation in
a fractured reservoir.
Key word: Dashtak Formation, Fracture Network, Image Logs, Core, ANN
INTRODUCTION
Orientation and intensity from core or image logs is often difficult. Fractures are infrequently intersected
by wells, and if fractures do intersect the wellbore they are rarely abundant enough to give a good
representation of the fracture geometry (Laubach et al., 2000). Due to sparseness of these data sets, various
predictive schemes, based on geostatistics (La Pointe and Hudson, 1985) or geomechanical models (Olson,
1993 and1997; Olson and Pollard, 1989; Pollard et al., 1982 and 1988; Rives et al., 1992; Lyakhovsky, 2001)
are used to estimate subsurface fracture attributes. There are two types of statistical approaches in modeling
fracture network geometry (Dershowitz and Einstein, 1988). The first approach addresses each fracture
characteristic separately. Data for each attribute are gathered, and distributions are fit to the data. This type
of modeling is particularly useful to estimate the upper and lower bounds on reservoir response. However, lack
of reservoir data often makes selecting a correct distribution difficult, thus leading to the use of outcrop data
rather than wellbore data (Barton and Zoback, 1992), which can sometimes be misleading. Recent advances
in using microcracks as proxies for larger scale fractures have improved the capability of getting pertinent
subsurface data (Laubach, 1997), circumventing some of the problems associated with data sparseness.
The second statistical approach takes the statistical data for individual fracture attributes and also specifies
their interdependence, describing the 3D fracture network as a whole. The simplest model often used in
petroleum applications is a network of three unbounded, mutually orthogonal fractures (Childs, 1957; Warren
and Root, 1963). Choosing among the possible models may require more fracture data than is available, and
it may be difficult to determine a priori whether, for example, a fracture network is clustering or more
uniformly distributed spatially. An alternative to geostatistical characterization is a geomechanics-based
approach, where a physical understanding of the fracturing process is combined with measurements of

Aust. J. Basic & Appl. Sci., 3(4): 3297-3306, 2009
3298
mechanical properties of rock to predict fracture network characteristics. This process-oriented approach can
also provide a theoretical basis for deciding what types of fracture attribute distributions are physically
reasonable, and how attributes such as length, spacing and aperture are inter-related (Rives et al., 1992;
Lyakhovsky, 2001; Olson, 1993; Vermilye and Scholz, 1995).
Natural fracture systems can have a dramatic impact on reservoir performance. They may act as highly
permeable flow conduits or act as baffles and seals. Almost in all of cases, we cannot get some fracture data
information between 2 wells as exact as possible. This paper presents a new system for predicting natural
fracture distributions between 2 wells in a Tabnak field, in Fars province of Iran (Fig. 1). This predicted
system is partially constrained and validated by borehole images. First, we analysis the fracture distribution
in 2 lateral wells using borehole images. This calculation is based on CNLC Report. Second, draw the
architecture of system, Input and output data. Finally, the system applied to real data using the Tabnak Well
No.22 and No. 24 .Uncertainties associated with these predictions are considerably reduced by constraining
and validating the models with borehole images.
Geological Setting and Structural Analysis:
The study area is located in South of Zagros in Fars province of Iran (Fig.1). Tabnak structure has 2
culminations that separated from together with a saddle in situation of wells No. 25. Carbonate evaporites of
Dashtak formation are important seal interval in Zagros basin. The Dashtak formation consists of dolomite,
anhydrite, shale and limestone. It comprises of Aghar shale member, a member, B member, C member, Sepidar
dolomite and D member. Dashtak formation has eight facies deposited in inner middle homocline ramp. Four
sequences distinguished in the Dashtak formation and two surfaces sequence boundaries type I and three
sequence boundaries type II: First sequence begins lowermost disconformity at the base of Aghar shale up to
massive anhydrite A. Lagoon and mid- ramp faces are known a MFS at this sequence and apparently
correlateable to Tr50 of Ladnian stage. Second sequence begins from the base of B member up to the top of
B massive anhydrite. MFS the upper boundary is a sequence boundaries type II with brecciaed dolomite. In
order to predict regional fracture patterns, it is necessary to identify the main processes responsible for
fracturing. No straightforward answer exists as different processes may be dominant in various geological
settings and is highly dependent on the various phases and characteristics of the local geological history
(Sanders et al., 2002), and fracturing also takes place in essentially undeformed regions (Price and Cosgrove,
1990) but this has a much more regional character and is strongly lithology related. With a 3D geological
model we can study the geological history of the structure in an analytical way and identify the highly
deformed regions. Though traditional curvature analysis has often been used for fracture assessment (Price and
Cosgrove, 1990), curvature analysis on the present day geological model gives limited insight for fracture
purposes as it only analyses the geometry on the present day model statically (Lisle, 1994).
Core and Image Loges-based Measurements of Fracture Properties:
In this field among 30 wells distributed over the study area, among 57 percent have image logs (17 wells)
and 3 are core wells with core length of 112m and 12 are EMI well across the field (Fig. 2), more than 2000
fractures have been measured or analyzed using core and EMI well log data.
The EMI is a formation imaging tool which provides excellent definition of electrical images, allowing
user to characterize reservoir rocks based on qualitative micro-resistivity readings around the borehole. A
distinguishing characteristic of the EMI is its six imaging pads. These pads are 60° apart (with respect to
horizontal) and are independently actuated to minimize the loss of pad contact due to hole eccentricity or tool
decentralization. Axial articulation of the imaging pads further reduces pad liftoff. An advantage of using six
arms, as opposed to four arms used in conventional dipmeter computations. The six arms also yield detailed
borehole geometry and accurate hole volumes. In addition to providing imaging data, resistivities (measurement
at the central button of each pad) can be computed to provide quantitative azimuthally-distributed measurements
of the formation in horizontal well bores when invasion zones are shallow or moderate. An integral component
is a triaxial magnetometer and accelerometer orientation sensor which permits conventional dipmeter
computations. A high sampling rate of the tool-axis accelerometer allows tool motion correction for image
enhancement and highlights problems associated with erratic tool motion at the well site. The log service
includes EMI. And service was run by CNLC dated 13-AUG-2003.
Geometrical Parameters:
The following three geometrical parameters are at least required for quantifying a fracture network:
orientation, size and spacing (or frequency, which is 1/spacing).The variation in space of fracture
characteristics, such as size, orientation and description, are so irregular and complicated that the description
of such a reservoir is substantially more difficult than that of a conventional reservoir. Therefore, the study

Aust. J. Basic & Appl. Sci., 3(4): 3297-3306, 2009
3299
of a fractured reservoir must follow a special pattern, beginning with the examination of local basic
characteristics of single fractures, only afterward counting with the examination of a multifracture system. In
establishing the relationship among the various groups of fractures, the local relationships are examined at
reservoir scale by comparison, trends and extrapolation of parameters. The basic parameters and their
relationships are illustrated in Fig. 3.
Orientation:
An overview of the fracture trends identified in well No. 25 of Dashtak formation and the result are shown
in Fig. 4. From the figure we can see the fractures orientations are relatively complex. Two main fracture
trends prevailed: NE and NNW. In addition, the dominant fracture trend almost matches the orientation of the
nearest seismically imaged fault trend namely NE, NNW (Table 1, 2).
Size or Fracture extent:
Deterministic determination of the average size of fractures intersected by a simple core is practically
impossible while it is reasonable in theory, because the probability of a core to intersect a fracture, and the
chance of this intersected fracture to terminate in the core mainly depend on the fracture size and the borehole
size. In order to estimate the fracture extent we used the method supposed by Gauthier et al. (2000). Though
this approach cannot give absolutely accurate estimates of fracture size, the relative size of each fracture set
can be assessed objectively. The result shows that fractures with NE trends are relatively short; those with a
NNW trend show a larger spread in size.)
Fracture density:
In the complete fracture network (comprising various sets) simulation, the estimation of the fracture density
is required. In this study, determining the spacing distribution for each fracture set can be obtained from image
log and core data. Fracture spacing is the distance between the fracture planes. In order to obtain more accurate
fracture density, we used the correction method proposed by Terzaghi (1965) to evaluate the error related to
the orientation of the well trajectory with respect to the fracture set orientation. This method consists of
weighting each directional data as a function of the cosines of the angle between the core axis and the fracture
pole vector (Fig. 5).
From the statistical result combined with well location, it is obvious that fracture spacing is mainly
controlled by lithology and structural position. The fracture density increases with the shorter distance to fault
(Table 3).
Model of Artificial Neural Network:
The Artificial Neural Network (ANN) is based on the modern biological research on the hemopoietic tissue
of the human brain. It attempts to imitate the way in which a human brain works in processes such as
studying, memorizing, reasoning, and inducing with a complex network, which is performed by extensively
connecting various processing units (Nikravesh, 1998 and Jiao 1990). ANN is a dynamic system with mighty
functions in the nonlinear and super-scale-consecutive-temporal processing; at the core of it are the concepts
of nonlinear of consecutive temporal, the global effect of the Internet, the parallel processing ability of super-
scale, and the imaginary ability of study. ANN has the advantage of the common nature of the nonlinear
dynamic system as well, such as unpredictability, attractability, dissipatedness, imbalance, irreversibility, multi-
dimension, broad-interlinkage and self-adaptability. Although there are many kinds of ANNs, Back Propagation
(BP) is one of the most effective and extensively used methods. BP is a mapping network with a multi-layered
structure. Compared to the conventional model, it has the characteristics of a longer duration and better timing
prediction. Therefore, a BP neural network is developed in this paper to cope with the processing of complex
non-linearity in the research of Reservoir fracture modeling (Neural Ware, 1995 and Wei 1990).
Foundation of the BP model:
The BP neural network model is selected in the analysis of Reservoir fracture modeling in Tabnak
anticline, where nodes are organized in input, hidden and output layers. The input and hidden layers have four
nodes each and the output layer has one node. Unlike two-layer networks, the three-layer network has a middle
hidden layer. Every neural unit can divide input-space in a different way. Some hiding characters can be
obtained from the input-layer, and more complex districts can be formed to improve the classifying ability.
The structure of the BP neural network is shown in Fig. 6.

Aust. J. Basic & Appl. Sci., 3(4): 3297-3306, 2009
3300
Fig. 1: Tabnak hydrocarbon field Situation, Iran.
Fig. 2: The EMI and core wells Locations on the study area.
Fig. 3: basic parameters of fracture distribution model.

Aust. J. Basic & Appl. Sci., 3(4): 3297-3306, 2009
3301
Fig. 4: Dip and Dip Azimuth of Conductive Fractures in well No. 25, Tabnak hydrocarbon Field, Iran.
Fig. 5: Effect of well-orientation correction on fracture density. No is the number of observed fracture; N1
is the number of corrected fracture. N1=No /sin (B).
Fig. 6: Architected of BP network (Neural Ware, 1995).

Aust. J. Basic & Appl. Sci., 3(4): 3297-3306, 2009
3302
Table 1: Core distances in well No. 25, Tabnak hydrocarbon Field, Iran.
Well No. Core No. Interval (m.d.d.) Cut (m) Recovery Core size (in) Formation
------------------------------ -----------------------
from to (m) %
TBK-25 1 2641.00 2650.00 9.00 9.00 100.0 4 Kangan Cores from ST-1
2 2650.00 2659.15 9.15 9.15 100.0 4
3 2659.15 2667.05 7.90 7.90 100.0 4
4 2667.05 2682.90 15.85 15.85 100.0 4
5 2755.00 2792.00 7.00 7.00 100.0 2.5/8
6 2762.00 2771.10 9.10 8.50 93.4 2.5/8
7 2771.10 2771.80 0.70 0.38 54.3 2.5/8
Table 2: Specification of fractures in well No. 25, Tabnak hydrocarbon Field, Iran.
Fracture Azimuth Average (Degree) Fracture Dip Average (Degree) Distance of Fractures (meter)
12 80 2542-2547
17 85 2548-2555
10 90 2564-2568
30 80 2622-2623
33 65 2624-2630
Table 3: Fracture spacing variation with fault distance, Well No. 25, Tabnak hydrocarbon field, Iran.
Distance to the nearest fault (meter) fracture spacing (meter)
300 3081.5-3082.5
130 3082.5-3084
310,290,110 3112.5-3115
30-310 3131.5-3133.5
The relationship of input and hidden layers:
Hidden
(1)
The relationship of hidden and output layers:
Out
(2)
here:
–ai is the input node i of the input layer,
–bj is the output node j of the hidden layer,
–Wij is the weight between input and hidden layer,
–Vji is the weight between hidden and output layer.
The outlines of the algorithm are as follows. Firstly, a starting weight value is selected and the output
value obtained according to the above two equations. The error of counting model output and ideal model
output can be obtained. If it is not suitable, it can be adjusted to improve the prediction. The error function
(Ek) is constructed to make the error decrease with the weight adjustment (Neural Ware, 1995).
If the Sigmoid function is used as the responding function f(x) =1/ (1+e-x), then the absolute deviation:
(3)
Then the adjusted weight from the input layer to the hidden layer is:
(4)
(â denotes the studying rate), and the adjusted weight from the hidden layer to the output layer is:

Aust. J. Basic & Appl. Sci., 3(4): 3297-3306, 2009
3303
(a denotes the studying rate). (5)
Validation of the BP model:
The multi-layer network is trained by repeating this process (flowsheet; Fig. 7) many times. The goal of
the training is to reach an optimal solution based on the performance measurement. Firstly, groups of training
samples must be provided and then determinate the number of hidden layer neurons in Tabnak hydrocarbon
field (Fig. 12). In addition, each sample group is made up of an input sample and an ideal output sample. The
ideal output value of this index is 1 among the 39 points in Tabnak hydrocarbon field. According to these
sample data, the learning-ability and self-applicability of ANN can be used. Through iteration of the simple
function it can be a prediction model. With 39 points the training processor can be made. The training is
finished when the output value is equal to the ideal output value. Otherwise, the output value can be made
equal to the ideal output value. At the start of training, the maximum of the studying rate is 0.9. After 4,000,
the learning rate has slowed down to 0.7. Then after 2,784, the error Ek=7.370E-04. When it is acceptable,
the Prediction coefficient could be obtained. An example is shown in Table 4, where the sample input, ideal
output, actual output, and output error are included for some typical points. The computing parameters of the
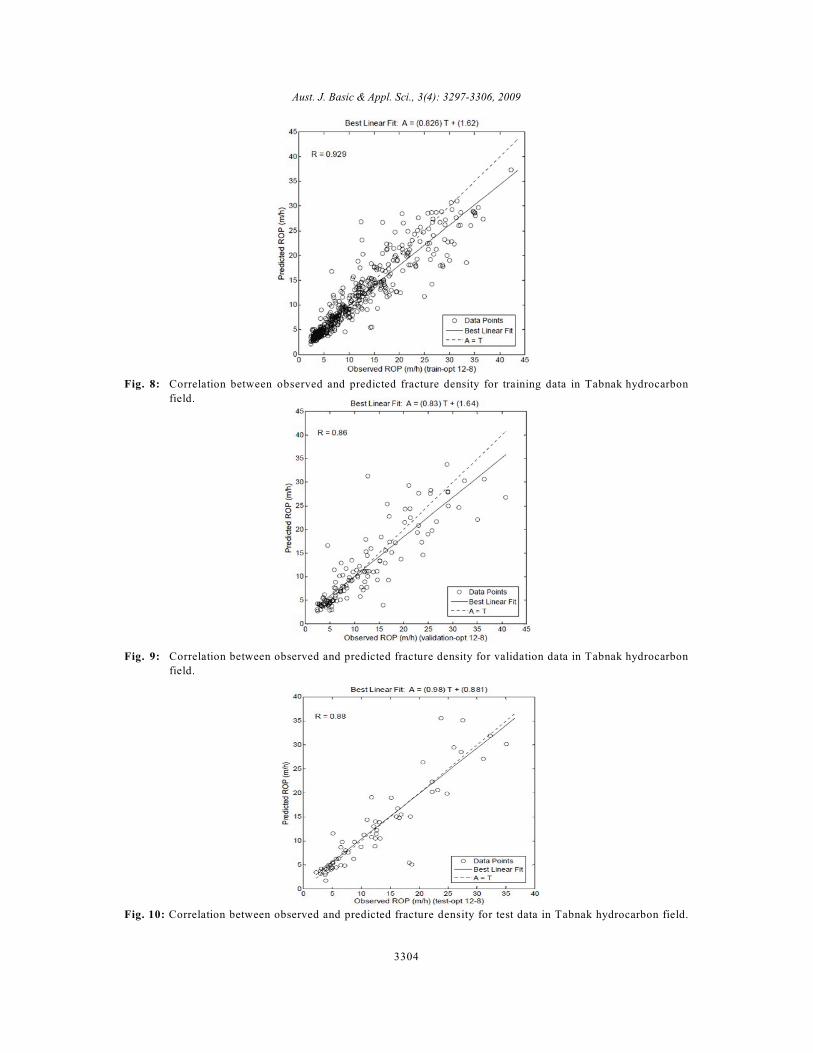
artificial simulating model are listed in Table 4 and this model show the correlation between observed and
predicted fracture density for training, validation and test data in Tabnak hydrocarbon field in Fig. 8,9 and 10.
Fig. 11 show the high match condition in compare between observed and predicted fracture density for
test data in Tabnak hydrocarbon field.
Table 4: Input, output and error of the training samples in BP model, Tabnak hydrocarbon field, Iran
No Dip Azimuth Density Ideal output Actual output Output error
1 30 75 7 1 0.994 0.003
2 30 75 8 1 0.992 0.006
3 45 55 9 1 0.996 0.004
4 45 55 9 1 0.996 0.004
5 45 55 8 1 0.901 0.003
6 40 50 11 1 0.913 0.0057
7 40 50 6 1 0.980 0.008
8 60 70 8 1 0.994 0.009
9 60 70 9 1 0.928 0.007
10 65 60 4 1 0.996 0.004
11 65 60 10 1 0.909 0.0049
12 65 60 9 1 0.987 0.0033
13 65 60 7 1 0.996 0.0038
Fig. 7: Flowsheet of BP Network.
Aust. J. Basic & Appl. Sci., 3(4): 3297-3306, 2009
3304
Fig. 8: Correlation between observed and predicted fracture density for training data in Tabnak hydrocarbon
field.
Fig. 9: Correlation between observed and predicted fracture density for validation data in Tabnak hydrocarbon
field.
Fig. 10: Correlation between observed and predicted fracture density for test data in Tabnak hydrocarbon field.

Aust. J. Basic & Appl. Sci., 3(4): 3297-3306, 2009
3305
Fig. 11: Compare between observed and predicted fracture density for test data in Tabnak hydrocarbon field.
Fig. 12: Diagram for determinate the number of hidden layer neurons in Tabnak hydrocarbon field.
Conclusion:
According to these sample data, the learning-ability and self-applicability of ANN can be used. Through
iteration of the simple function it can be a prediction model. With 39 points the training processor can be
made. The training is finished when the output value is equal to the ideal output value. Otherwise, the output
value can be made equal to the output value. The model of reservoir fracture distribution can integrate the
processing function of image loges analysis and interpretation of this approaching into the system to achieve
model-visualization.
Unknown area of well is detected and classified using image logs, core measurement analysis and neural
network algorithms. This algorithm has good advantages comparing other works that were done in this case.
One of the best advantages is using BP model. By using fracture dip average and fracture density and also
the mean value of the fracture azimuth of the core measurements, we can reduce the information of each group
into only three parameters so the neural network for classification of the images is became very small and the
information are reduced very much by keeping the necessary information of the main images. So the training
is done very fast and with high accuracy.
ACKNOWLEDGEMENTS
The authors would like to acknowledge the financial support provided by Iranian central oil fields
company.

Aust. J. Basic & Appl. Sci., 3(4): 3297-3306, 2009
3306
REFERENCES
Barton, C.A. and M.D. Zoback, 1992. Self-Similar Distribution and Properties of Macroscopic Fractures
at Depth in Crystalline Rock in the Cajon Pass Scientific Hole, Journal of Geophysical Research, 97(B4): 5181-
5200.
Childs, E.C., 1957. The Anisotropic Hydraulic Conductivity of Soil, Journal of Soil Science, 8(1): 42-47.
Dershowitz, W.S. and H.H. Einstein, 1988. Characterizing Rock Joint Geometry with Joint System Models,
in Rock Mechanics and Rock Engineering, Springer-Verlag: Redmond/Cambridge. p: 21- 51.
Gauthier, B.D.M., R.C.W.M. Franssen1, S. Drei, 2000. Fracture networks in Rotliegend gas reservoirs of
the Dutch offshore: implications for reservoir behavior. Netherlands Journal of Geosciences, 79(1): 45-57.
Jiao, L., 1990. ANN theory system. (In Chinese with English abstract). Press of Xi’an University of
Electron Sciences, Xi’an.
La Pointe, P.R. and J.A. Hudson, 1985. Characterization and Interpretation of Rock Mass Joint Patterns,
Geological Society of America Special Paper, 199 -37.
Laubach, S., R. Marrett and J.E. Olson, 2000. New directions in fracture characterization, The Leading
Edge, 704-711.
Laubach, S.E., 1997. A Method to Detect Natural Fracture Strike in Sandstones, AAPG Bulletin, 81(4):
604-62.
Lisle, R.J., 1994. Detection of zones of abnormal strains in structures using Gaussian curvature analysis.
AAPG Bulletin, 78: 1811-1819.
Lyakhovsky, V., 2001. Scaling of Fracture Length and Distributed Damage, Geophysical Journal
International (2001) 144: 114- 122.
Nikravesh, M., 1998. Neural network knowledge-based modeling of rock properties based on well log
databases. Society of Petroleum Engineers Paper 46206, Bakersfield, CA, and 10±13.
Neural Ware, 1995. Neural Computing, Technical Publications Group, A Technology Handbook for
Professional II/PLUS and Neural Works Explorer, Pittsburgh, PA 15275.
Olson, J.E., 1993. Joint Pattern Development: Effects of Subcritical Crack-Growth and Mechanical Crack
Interaction, Journal of Geophysical Research, 98(B7): 12,251-12,265.
Olson, J.E., 1997. Natural fracture pattern characterization using a mechanically-based model constrained
by geologic data – moving closer to a predictive tool, presented at the 36th U. S. Rock Mechanics Symposium,
New York City.
Olson, J. and D.D. Pollard, 1989. Inferring paleostresses from natural fracture patterns: A new method,
Geology, 17: 345-34.
Pollard, D.D. and A. Aydin, 1988. Progress in Understanding Jointing Over the Past Century, Geological
Society of America Bulletin, 100: 1181-1204.
Pollard, D.D., P. Segall and P.T. Delaney, 1982. Formation and Interpretation of Dilatant Echelon Cracks,
Geological Society of America Bulletin, 93: 1291-1303.
Price, N.J., J.W. Cosgrove, 1990. Analysis of Geological Structures. Cambridge University Press,
Cambridge, P.502.
Rives, T., M. Razack, J.P. Petit and K.D. Rawnsley, 1992. Joint Spacing: Analogue and Numerical
Simulations, Journal of Structural Geology, 14(8/9): 925-937.
Sanders, C.A.E., L. Fullarton, S. Calvert, 2002. Modelling Fracture systems in extensional crystalline
basement. Geological Society of London Publications: Hydrocarbons in Crystalline Basement, 147: 145-162.
Terrzagi, R.D., 1965. Source of error in joint surveys.Geo-technique, 15: 287-304.
Vermilye, J.M. and C.H. Scholz, 1995. Relation between Vein Length and Aperture, Journal of Structural
Geology, 17(3): 423-434.
Warren, J.E. and P.J. Root, 1963. The behavior of naturally fractured reservoirs, SPE Journal, 245-255.
Wei, Y., 1990. The ANN-modeling studies on geological hazards and its assessment (in Chinese with
English abstract). Natural Hazards Newsletter, 6: 2.