Embed Size (px)
Citation preview

NREUCP-500-7387
Modal Testing of A: vanced Wind Turbine Systems
Richard M. Osgood
National Wind Technology Center
Presented at
Fourteenth ASME-ETCE
Wind Energy Symposium
Houston, TX
January 29-February 1, 1995
r��·,=· ·-·
-....
National Renewable Energy Laboratory 1617 Cole Boulevard Golden, Colorado 80401-3393 A national laboratory of the U.S. Department of Energy Managed by Midwest Research Institute for the U.S. Department of Energy under contract No. DE-AC36-83CH10093
Work performed under task number WE902350
November 1998

I} -...; Printed on paper containing at least 50% wastepaper, including 20% postconsumer waste
NOTICE
This report was prepared as an account of work sponsored by an agency of the United States government. Neither the United States government nor any agency thereof, nor any of their employees, makes any warranty, express or implied, or assumes any legal liability or responsibility for the accuracy, completeness, or usefulness of any information, apparatus, product, or process disclosed, or represents that its use would not infringe privately owned rights. Reference herein to any specific commercial product, process, or service by trade name, trademark, manufacturer, or otherwise does not necessarily constitute or imply its endorsement, recommendation, or favoring by the United States government or any agency thereof. The views and opinions of authors expressed herein do not necessarily state or reflect those of the United States government or any agency thereof.
Available to DOE and DOE contractors from: Office of Scientific and Technical Information (OSTI) P.O. Box 62 Oak Ridge, TN 37831
Prices available by calling (423) 576-8401
Available to the public from: National Technical Information Service (NTIS) U.S. Department of Commerce 5285 Port Royal Road Springfield, VA 22161 (703) 487-4650

MODAL TESTING OF ADVANCED WIND TURBINE SYSTEMS
Richard M. Osgood National Wind Technology Center
National Renewable Energy Laboratory Golden, Colorado
ABSTRACT The U.S. Department of Energy (DOE), in oozYunction with the
U.S. wind industty, is supporting the development of technology for advanced, higher efficiency wind energy conversion systems. Under the Turbine Development Program (TDP), the DOE, through the National Renewable Energy Laboratory (NREL) will assist U.S. industry in incorporating advanced wind turb� technology into utility-grade wind turbines. As part of the TDP, NREL is conducting a range of activities aimed at assisting the wind industry with systemdesign analysis and testing. One major activiey is NREL's Full System Modal Testing (FSMn task. In 1993 and 1994, NREL'sFSMT team conducted modal surveys on several wind turbine systems developed by the U.S. wind industry, including Atlantic Orient Corporation's AOC 15150, R Lynette and Associates' (RLA) AWT-26 PI, and Carter Wind Turbines Incorporated's CWT-300. This paper describes how these modal surveys were carried out and how industiy and NREL wind researchers used the experimental results to validate their analytical models.
INTRODUCTION AND BACKGROUND The development of a reliable advanced wind turbine requires an
accurate ci).namic model of the structl.n"e. Once a model that correctlypredicts the wind turbine's dynamic response to variable inflow and operating conditions is obtained, researchers can estimate the strength necessary for structural components to resist fatigue. Subsequently, trade-offs in the system's design can be made so that a moreeconomical turbine may be manufactured. However, before prototype hardware is available for testing, the analyst and designer can usually estimate the values of many structural parameters needed as input to their analytical model ( 1 ). Advanced wind turbines are complicated structures composed of flexible elements. Properties of common engineering materials used to manufacture wind turbine subcomponents vary from well-known metals to lesser-known fiber-
glass or wood composites. Also, depending on the fabrication process chosen for the rotor blades, the elastic and geometricproperties needed for the blade's structural model may be hard to determine, which can lead to errors in estimating the blade's mass andstiffuess distribution or the location of the airfoil's principal bending axes. In addition, nonlinear interactions between major wind turbinecomponents such as the nacelle and tower or between the rotor and nacelle finther complicates the analytical model's input data set. Consequently, the ci).namic model is seldom accurate and needs to be updated by the analyst or designer with experimental test results as they become available.
Once a prototype machine is obtained. it is necessary to validate the analytical model of the component or complete structure. The analytical model of the structure may be a finite element model (FEM) or a multi-body dynamics model such as ADAMS (Automatic IAnamic Analysis of Mechanical,S_vstems), developed by Mechanical D}namics Incorporated of Ann Arbor, Michigan. TheADAMS code automatically generates nonlinear equations of motion for the wind turbine by modeling the structure as discrete masses connected by springs and viscous damping elements (2). Specialsubroutines are incorporated into the code to model the unsteady aerodynamics and yaw motion of the turbine. The code calculates the system's dynamic response and reaction forces between the Il!odel'selements. In most situations, NREL researchers work \\ith the industry partner's particular FEM code to model a given advanced wind turbine (A WT) system. The FEM code models the \\ind turbine \\<ith discrete structural elements (3). The finite elements areused to predict deflections and the structural stresses that result fromextemally applied loads or from reaction forces that are transferred to the FEM from the ADAMS model of the \\<ind turbine structure. Both ADAMS and a FEM are capable of predicting the static (nonrotating) modal properties of the "'ind turbine system. The

modal properties include natural system frequencies, damping factors, and mode shapes inherent to the structure or subcomponent.
To support our wind industry researchers in validating their models of �ind turbine structures, NREL's FSMT team conducted se\'eral modal surveys on nonrotating prototypes in situ. This paper brieflydiscusses a few of the �ind systems tested for our industry partners. These systems include the AOC 15/50, AWT-26 PI, and the CWT-300 wind systems (see Figure 1). The modal surveys measured the wind system's nonrotating natural modes of vibration. In some instances, such as the CWT -300, individual components of the �indturbine were tested at the industry partner's request The finiteelement analyst at CWT, Inc. used the modal survey of the CWT-300 blade to validate his estimates of the blade's mass and stiflhessdistributions. Also, NREL's modal test team and industry researchersused the full system modal test results to tune the overall d}namicmodel of the �ind system and . identify potential operating problems (4).
The Campbell diagram is an important result of the modal survey. It can be used as a diagnostic tool to identifY potential resonance conditions that may occur during the wind turbine's operation (see Figure 2). A Campbell diagram (sometimes referred to as a Fan plot) displays the system's natural frequencies against the speed of the rotor (5). The coalescence of a natural :frequency of the system and per-revolution forcing frequency at the rotor's operating speed causes a condition of resonance. For example, Figure 2 highlights the first flap bending mode which occurs at 1.56 Hz. This natural mode isnear the three-per-revolution forcing frequency caused by the 29 rpm rotor speed Sustained operation of the wind turbine exciting a natural mode of the system results in high fatigue loads and can cause a catastrophic failure in the wind turbine structure. The Campbelldiagram is used by the designer to decide whether to change the design of the �ind turbine's structure to alter its dynamic response, or to change the rotor's operating speed so that the resonant condition isavoided.
WIND TURBINES TESTED The NREL FSMT test team conducted modal surveys on the AOC
15/50, AWT-26 Pl, and CWT-300 wind turbine systems shown in Figure 1. The AOC 15/50 machine is designed for use by farms, municipal facilities, and commercial utilities, and in high penetration�ind-diesel hybrid systems. The A WT-26 PI is an advanced, utilityclass �ind turbine designed for use in multi-unit wind power stations. The CWT -300 is the result of an integrated design methodology and
is engineered for use by independent pow-er producers or for power displacement by industrial and utility concerns.
All of the turbines tested were designed for down-wind operation. The AOC 15/50 and AWT-26 PI operated in free-yaw, �hile the CWT -300 utilized free-yaw with dampening. Free-yaw is where the �ind turbine's rotor passes through the wake of the to�-er and is aligned with the predominant �ind direction by a restoring moment acting about the nacelle's yaw axis. The restoring moment is developed by an imbalance of lift and drag forces acting on the �indturbine ·s rotor. The AOC 15/50 �ind machine is a 3-bladed rigid hub design, as compared to the AWT-26 PI and CWT-300 �ind
turbines which have two blades and a teetering hub. The rigid hub design transfers both in-plane and out-of-plane bending moments tothe low-speed shaft. The teetering hub, in contrast, can only transfer in-plane bending moments from the rotor blades. The teeter pin is
placed at the hub so that the out-of-plane bending moments at thelow-speed shaft are canceled.
Each of the �ind systems the modal team tested incorporated adifferent but typical tower configuration. The AOC 15/50 and AWT-26 PI are each mounted on top of a three-legged lattice (trusstype) tower, while the CWT-300 is installed on a tube tower. The AOC 15/50 and A WT -26 PI 25-m towers are free standing, and the 50.2-m CWT-300 tube tower has four supporting guy cables attached near the 600/o level for vertical stability. Table I gives amore detailed description of each wind turbine's configuration forcomparison.
APPROACH The FSMT team plans the modal surveys so that the measurement
grid can be correlated with the analytical model's geometry. \Vhen setting up a modal test to validate a FEM, we attach our sensors tothe wind turbine where key nodes of elastic elements are used to model the wind turbine structure. In validating an ADAMS model,we place our accelerometers at the centers-of-gravity of rigid part elements representing the �ind turbine subcomponents. A small to moderate-size FEM can have 2,000 to 150,000 degrees-of-freedom(OOFs). A typical ADAMS wind turbine model, with a reasonableexecution time, will have on the order of 150 DOFs. With the Experimental Modal Analysis (EMA) method, we measure DOFs in terms of excitation (input) and acceleration responses (output) at discrete locations of the structure under test (6). We use the input and output measurements to compute frequency response functions(FRFs) between each measured acceleration response and excitation input of the structure. The FRF (or transfer function) is calculated inthe frequency domain as the ratio of the output response to the input excitation. The magnitude of the FRF is plotted against frequency: ata frequency value where the function has a sharp nwcimum (peak value), a natural mode of vibration exists. Figure 3 is a FRF plottaken during the AOC 15/50 modal survey.
The mobile data acquisition system used by NREL's modal test team is limited to 48 measurement channels, i.e., we can measure amaximum of 48 DOFs at one time. Therefore, we must judiciously choose the locations on the wind turbine structure to attach the accelerometers so that the modal survey will identify all the modes ofinterest to the analyst. Because we can measure up to 48 OOFs permodal test, a full system modal survey is usually comprised of threesubcomponent tests, including the rotor, nacelle, and tower components.
The map of measurement points we initially select for a modal survey of a particular wind system is based on the particular analytical model's geometry of the �ind turbine. The FEM or ADAMS computer model is used to predict the first several nonrotating system modes of vibration, and the frequency range in which. the modes occur is noted If no errors are present in the modelingprocess, we could use these preliminary anal) tical results to

determine the minimum number of structural points on the wind system that are best used to excite the structure. However, the objective of the modal survey is to validate the analytical modelAlso, we want to choose the excitation locations on the structure so that they are not a node of vibration for any mode of interest For acomplicated and flexible wind turbine, more than one excitation pointis usually required to excite all the modes of interest within aspecified frequency bandwidth. Further, if there are inaccuracies inthe analytical model, some modes may be missed in the computer simulation. Therefore, we need to search for natural system modes by making several driving point measurements on the wind turbinestructure. A driving point measmement is where the excitation measurement is collocated with the response measurement and OOF.We make several driving point measmements on the rotor, nacelle,and tower and then compute FRFs and count the number offrequency peaks observed The driving point measurements with the greatest number of peaks are selected as the locations to excite the wind turbine structure.
Next, we consider the turbine's configuration. Because the modalsurvey is conducted on a nonrotating system, the azimuth position ofthe rotor determines how the rotor modes interact with the nacelle and tower modes of VIbration. The test engineer and analyst decide what azimuth position the wind turbine rotor will have during the fullsystem modal smvey. For three- or two-bladed wind systems, usually two rotor azimuth positions are sufficient to validate the analytical model. Two different rotor configurations means that two separatefull-system modal tests must be conducted on the wind turbine structure. For a three-bladed wind turbine, the rotor azimuth positionis orientated as a proper "Y" or inverted "Y'' for the first configuration. The second configuration is obtained when any singleblade is held horizontal, or parallel to the ground A two-bladed windmachine is tested with the blades horizontal (parallel to the ground)for the first rotor azinruth configuration. For the second azimuth configuration, the blades are rotated to the vertical position, or parallel to the tower.
Another system configuration condition we impose is theapplication of the machine's drive train brake. The brake must be applied during the modal test to hold the chosen azimuth position of the rotor. The wind systems we tested all had a high-speed shaftbrake on the back-end of the generator which was applied during the modal survey. Fortunately, the application of the generator breakapproximates the electrical back-torque seen by the generator and transmitted through the gearbox when the machine is on line andproducing power. The drive train's torsion mode of vibration and interaction with the rotor's in-plane bending modes are affected by the generator's electrical back-torque boundary condition.
The last turbine configuration we must address for a static ornonrotating full system modal smvey is the nacelle's yaw positionwith respect to the tower. A change in the orientation of the nacelle with respect to the tower can change the bending compliance between the nacelle and tower. Therefore., the nacelle's yaw position with respect to the tower must be held constant throughout the modal survey so that the boundary condition between tower and nacelle is time invariant The AOC 15/50 and A WT -26 P l yaw freely in light
wind conditions. To make each wind system's structural response to the applied excitation time invariant, we constrained the AOC 15/50 and A WT -26 PI from yawing. This was acoomplished by installinga soft torsion spring between the nacelle and tower-top for both the AOC 15/50 and AWT-26 PI wind turbines. We fabricated the torsion spring from l -inch-diameter high-pressure rubber tubing. We then adjusted the torsion spring rate so that the first rigid-body rotation mode of the nacelle about the yaw axis was more than an order-of-magnitude below the frequency of the tower's first elastic torsion mode of VIbration. That is, we cormected the torsion springbetween the tower-top and nacelle bed-plate so that the no yawmoments were transferred through the yaw column (a pin connection). We then installed mechanical stops that prohibited the nacelle from yawing more than +/-5 degrees during a moderate wind direction change. Yaw dampers on the CWT -300 were sufficient to keep the machine from yawing for the wind conditions present during its modal test
The system modes that are of most interest to the analyst depend on the particular turbine modeled However, a three-blade rigid rotor machine or a two-blade teetering hub machine have certain modal characteristics in common. Both turbine designs exhibit asymmetricand symmetric rotor modes that couple with nacelle and tower modes.The direction and location in which excitation is applied to the wind turbine structure determines how strongly the asymmetric and symmetric rotor modes are excited For example, Figure 4 shows a two-bladed wind turbine structure excited such that the tower fore-aft and nacelle pitching modes couple with the symmetric rotor out-ofplane and in-plane bending modes of vibration. On the other hand, Figure 5, shows the same turbine excited in the tower side-to-side direction and the asymmetric in-plane and out-of-plane rotor bending modes being driven. Further, two- or three-blade machines will exhibit coupled rotor in-plane and out-of-plane bending modes of vibration if there is a high degree of blade twist, (greater thanapproximately 10 degrees). Figure 6 shows the first in-plane bending mode coupling with the second out-of-plane bending mode of vibration for a typical wind turbine blade with more than twentydegrees of twist from tip to root.
TEST PROCEDURE To excite the tower fore-aft and nacelle pitching modes, we attach
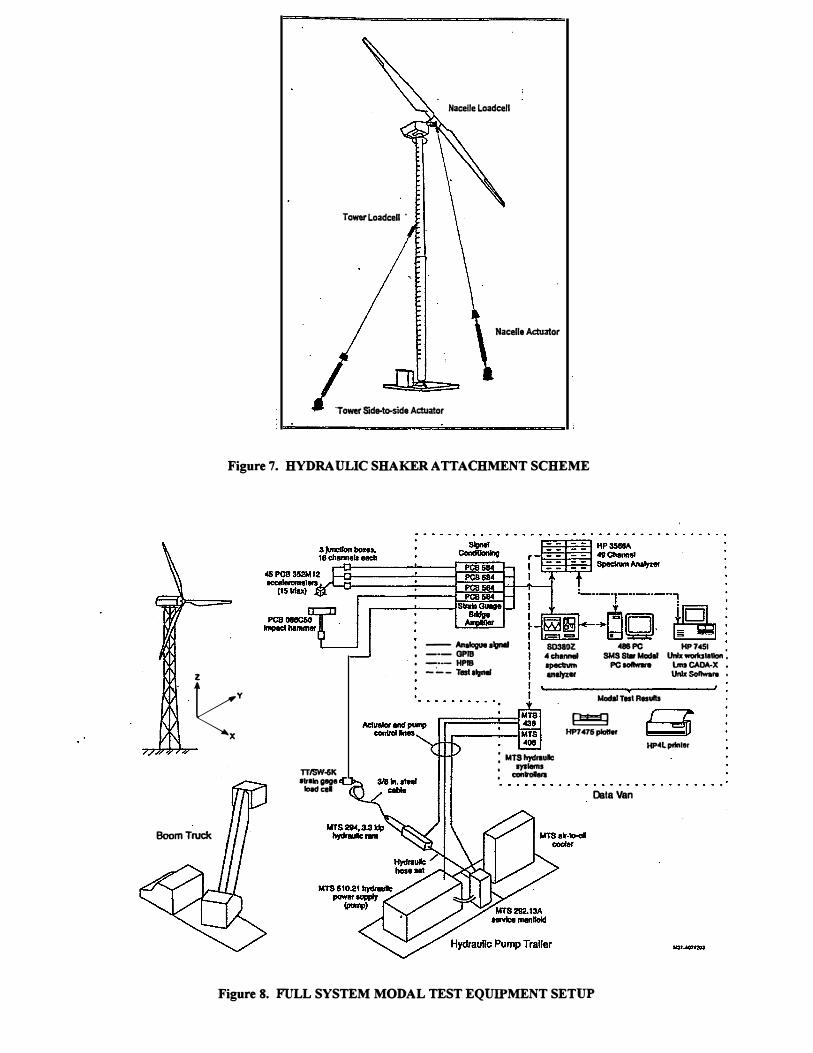
our hydraulic excitation system to the nacelle. A load cell is attached to the nacelle with its line-of-action in a plane parallel to the low speed shaft (LSS) and at a known position ahead or aft of the yawcolumn (see Figure 7). The angle of the load cell with respect to the tower's vertical dimension is between 30 and 60 degrees, depending on the particular test set-up. The other end of the load cell is attachedto a high-strength steel cable. The cable is loaded to a mean tension load of approximately 3000 N by a hydraulic actuator anchored to the ground. A random excitation signal in the range of +/-1000 N peakto-peak is applied to the structure for both rotor configurations tested in the full-system modal SUIVeys. FRFs are measmed between theload cell input signal and output signals of the accelerometers, whichare mounted on the rotor, nacelle, and tower.
We also attach the hydraulic shaker system to the tower and excite the in-plane rotor modes that couple with nacelle yaw motion and

tower side-to-side bending modes of VIbration (see Figure 7). To find the location on the tower to attach the load cell of the hydraulic shaker system, we use the results :from our initial driving point measurements. The load cell is attached to a point near the anti-node of the tower's second side-to-side bending mode. The load cell's lineof-action is perpendicular to the LSS and makes an angle of 30 to 45 degrees (depending on test conditions) to the horizontal ground reference. The same mean 3000 N tensile load with an impressed+/-1 000 N random load is applied to the tower through a steel cable. The cable is connected between the load cell and hydraulic actuator, which is anchored to the ground The tower is excited in the side-toside direction and FRF measurements are made for the two chosen rotor azimuth positions.
We use two different types of excitation signals to drive the hydraulic shaker system attached to the wind turbine structure. The first signal is a truly random signal made up of varying amplitude but limited in frequency range to the bandwidth of the FRF measurement. The second signal type is a pseudo-random signal made up constant amplitude and randomly phased discrete sine waves (tonals). The pseudo-random signal is actually a deterministic signal since it is composed of many sine waves of different frequencies. The number of tonals present in the pseudo-random excitation signal is equal to the number of lines of resolution required by the bandwidth of the FRF measurement. The particular excitation technique we employ for a given modal survey primarily depends on two factors: (1) the degree of nonlinearity observed in the wind turbine structure, and (2) the wind-speed conditions present during the modal test
The truly random signal is useful for characterizing the modal properties of a nonlinear structure. However, a truly random excitation technique is difficult to use in windy test conditions. We found that the wind system's response to the band-limited and variable amplitude random signal was easily overwhelmed by moderate wind speeds of 7 to 10 m/s. Also, a random signal can cause leakage errors that distort the FRF measurement Leakage errors occur because the random signal is not periodic within the measurement time record used to compute the FRF. For test conditions with wind speeds less than 8 m/s, we minimized the leakage errors associated with the random excitation technique by increasing the frequency resolution of the measurement process about the modal peaks found in the FRFs. We also used a Hanning window on the data and overlapped the time records by 500/o. The added signal processing overltead introduced into the measurement process reduced the distortion in the FRF measurements.
We use the pseudo-random excitation technique for moderate windspeed test conditions of 9 to 15 mls. The pseudo-random excitation provides a good signal-to-noise ratio because its amplitude can be adjusted to ovenide the wind noise. Also, because the pseudorandom excitation signal is periodic within the measurement time record, leakage errors that occur in the computed FRFs are minimized. However, due to its deterministic nature, pseudo-random excitation can cause errors in the computed FRFs of nonlinear structures. In addition, several hundred averages must be taken to reduce the effects of wind noise. Also, the wind system must be in a steady-state of VIbration for an accurate FRF measurement using
pseudo-random excitation. Therefore, to judge when the system has reached a steady-state of vibration, we observed real-time spectrums of key accelerometer responses. When the spectrums of key structural responses settled down to a characteristic shape; then steady-state vibration was achieved, and we would start the averaging process.
We use the coherence function to judge the quality of each FRF measurement. The coherence function indicates how much energy applied to the structure by the hydraulic shaker system is associated with the energy measured in the response of the wind turbine. The coherence function also indicates how well the input and output data fit a linear model in the frequency region of the modal peaks found in each FRF measurement (7). The coherence function has a value between zero and one when plotted against frequency. At frequencies where modal peaks occur, the coherence function will be near unity(greater than 0.9). However, if signal processing errors such asleakage occur, the coherence function can be much less than unity atthe modal peak frequencies. In addition, if the structure is nonlinear, the coherence function can be much less than unity. Also, at frequencies where an anti-resonance occurs, the coherence function will be much less than one. Anti-resonances occur in a FRF atfrequencies where the structure absorbs energy. The coherence function is also sensitive to wind noise induced into the measurement. A poor signal-to-noise ratio during the measurement process will canse an overall drop in the coherence function. The effects of wind noise are minimized by taking ·several hundred averages of the FRF measurement. The coherence function is a useful data qualification tool if care is used in making the measurements and proper signal processing methods are employed for the given excitation signal implemented (8).
EQUIPMENT SETUP AND INSTRUMENTATION Our mobile hydraulic test system consists of a data van with
computerized data acquisition instrumentation and a hydraulic pump trailer (see Figure 8). The data van carries all of the signal conditioning for 48 channels of acceleration and load measurements. The signals are digitized and processed with a 48-channel HP3566A spectrum analyzer. The HP analyzer computes FRFs between the input signal (a force transducer) and response signals from the accelerometers. The analyzer transfers the FRF measurements to one of two computer systems. A PC-based computer is used for initial impact measurements and a HP/UX workstation is used for full system modal surveys. A four-channel SD-380Z signal analyzer is used to monitor real-time key excitation and accelerometer signals.
The hydraulic trailer houses a MTS hydraulic pump and service manifold The hydraulic pump energizes two hydraulic actuators that excite the wind turbine structure. The hydraulic pump and actuators are controlled by a MTS closed-loop servo system inside the data van, which receives its programming from the HP/UX data acquisition system LMS CADA-X software nmning on the HP/UX workstation controls the hydraulics and data acquisition system (HP3566A Spectrum analyzer). Alternatively, the hydraulic system may be controlled by the PC-based data acquisition system through the SD-380Z signal analyzer for special purposes tests.

Processed data are transferred to the particular computer system via an IEEE 488.2 parallel interface. LMS CADA-X software runon the HP/UX workstation (or SMS Star Modal Software on the PC) extracts the modal parameters including natural frequencies, damping values, and mode shape vectors. Both software packages are capable of plotting the data and animating the mode shapes. Each software system builds a computer model of the wind turbine structure or subcomponent tested Once the modal parameters have been ascertained :from the data, an equivalent experimental dynamic model of the structure is available for comparison with analytical models.
TEST RESULTS AND PREDICTIONS The discussion below presents the modal tests for the full-system
modal SUIVeys of the AOC I5/50 and AWT-26 PI and compares them to an ALGOR finite-element analysis as well as an ADAMS model. The CWT -300 blade subcomponent test results are compared to an ANSYS finite element analysis performed by Carter Wind Turbines Inc.
AOC15/50 Table 2 compares the measured natural :frequencies with the
predicted :frequencies :from an ALGOR FEM and an ADAMS model.The first column lists the mode shapes, and the second column shows the measured nomotating frequencies. The third column lists the :frequencies predicted by the ALGOR FEM. The fourth column shows natural :frequencies predicted . by an ADAMS model after adjusting the model with experimental results (9). The results of the experimental test and analytical models are for the rotor azimuth position in the proper "Y' configuration. Figure 9 shows the first three significant out-of-plane (flap) bending modes of the rotor listed in Table 2.
AWT-26P1 The AWT-26 PI was tested and analyzed for two rotor azimuth
positions: vertical and horizontal. A comparison of the experimental results and ADAMS model predictions of the natural :frequencies is given in Table 3 (1 0). It is interesting to note that the first synnnetric rotor in-plane (edge) bending mode's natural :frequency value is significantly affected by the azimuth position of the rotor. Figure I 0 shows the first three significant natural bending modes of the rotor that correspond to Table 3 for the rotor blades in the horizontal position.
CWT 300 BLADE The CWT -300 blade subcomponent was tested in a blade test stand
at Carter Wind Turbines' manufacturing faci.licy. A detailed ANSYS FEM of the blade was developed by CWT's chief structural. engineer as a preliminmy step in developing a detailed ADAMS model of theblade. The modal survey's measured natural :frequencies, damping factors and mode shapes were used to adjust an ANSYS FEM's mass and stiffuess distributions of the blade. The FEM' s mass and st:iffiless information were then imported into an ADAMS model ofthe highly flexible wind turbine structure. Table 4 shows a comparison of measured natural :frequencies of the blade with the ANSYS FEM predictions. Figure II shows the corresponding measured modes shapes for Table 4.
DISCUSSION Changes were made in the stiflhess estimates of the ALGOR
FEM of the AOC 15/50 so that the predicted natural frequencies agreed with modal test results to within 4% for modes below 5.2 Hz. The last mode, first rotor asymmetric edge bending, could only be tuned to within 16% of the experimental results. However, all of the predicted ADAMS frequencies of the tuned model are within 0.4%. The ALGOR finite element model is stiffer than the ADAMS model or than what the measured nonrotating natural frequencies indicate.
The overall agreement between the modal test results and the ADAMS model predictions of the AWT-26 Pl natural frequencies are good for both the horizontal and vertical blade positions. Experimental data and analytical results varied by only 4%, except for the case of first-tower side-to-side bending with blades vertical. Here, the analytical model could only be tuned to within 10% of the measured natural frequency. Reference 4 shows that when the tower-top stiffi:less is adjusted, the simulated dynamic response of the operating wind system agrees better with measured loads of the operating turbine as well as with the measured static natural frequency of the first symmetric edge rotor mode. The modal test results indicate the importance of modeling the tower-top stiffi:less accurately so that natural modes of VIbration are properly interpreted with operating machine loads data. Also, the change in the rotor's first symmetric in-plane bending frequency as a fimction of the rotor's azimuth position, points out the importance of using two rotor positions for the wind system's modal test
The ANSYS FEM of the CWT-300 wind turbine blade contained several thousand DOFs as compared to the relatively few 48 DOFs of the experimental modal model. However, there was sufficient resolution in the experimental results to accurately measure the first four bending modes of vibration The CWT-300 composite blade is manufactured from hand lay-ups of glass cloth and epoxy resins. The distribution of mass as a fimction of blade radius was harder for the analyst to determine than was the stiflhess distribution Information on the blade-skin thickness and shear-web geometly was more easily obtained from the blade molds, and therefore made the stiffi:less distribution less complicated to calculate. The analyst was able to adjust the densities of the materials used to model the blade subcomponent and achieve agreement with the experimental results to within 6% for the first four modes of vibration
CONCLUSIONS The pmpose of NREL's mobile vibration testing system is to
support the TDP and the U.S. wind industly. We use our modal testing experience and equipment primarily in three areas. The first is to diagnose VIbration problems (such as resonances) of operating wind turbines using standard rotating machineiy test methods. The second is to obtain modal test data with which to validate the wind researcher's analytical modeL The third main use of our modal test

results is to help sort out the operating loads data in terms of natural response and forced response of the structure.
ACKNOWLEDGMENTS The author would like to thank his test support team for help with
the instrumentation and equipment. NREL's modal test team includes Jack Allread, Jeny Bianchi, Darren DeShay, Dave Jager, and Mike Jenks. Without their support and perseverance, these modal tests would not have been possible. Also, special thanks is given to our wind energy researchers, including Bruce Johnson of AOC, David Malcolm with R Lynette and Associates, and Alan Wright and Marshall Buhl of NREL: The author appreciates the analytical results with which they provided him to compare the modal test results.
REFERENCES 1. Data Preparation Requirements for Modeling Wind Turbines withADAMS, M.L. Buhl, NREUTP-442-7228, UC Category: 1213, DE95000266, December 1994. 2. ADAMSIWT User's Guide, July 1994, Version 1.20, MechanicalDynamics, Inc., Ann Arbor, Michigan. 3. The Finite Element Method in Machine Design, Eliohu Zohavi,Prentice Hall, Inc., 1992, IBBN 0-13-3182398. 4. Analysis of a Two-Bladed Teetering-Hub Turbine Using the ADAMS Software, A Wright, R Osgood, D.J. Malcolm, May 1994, NREUTP-442-6477. UC Categocy: 261, DE94006922 5. Helicopter D}nami.cs, p. 308, A.RS. Bramwell, Edward ArnoldCompany, 1976, ISBN 0-7131-3353-8. 6. Modal Testing: Theory and Practice, D.J. Ewins, ResearchStudies Press, LTD., John Wiley and Sons, Inc., 1984 ISBN 0-471-90472-4. 7. An Introduction to Random vibrations and Spectral Analysis,Second Edition, D.E. Newland, Longman Group Limited, 1984, ISBN 0-582-30530-6. 8. Techniques for Reducing Noise in Frequency-Response-FunctionMeasurements, RJ. Allemang, D.L. Brown, and RD. Zinnnerman, University of Cincinnati, College of Engineering, Research Annalo, Vol. 82, No. MIE-112, 1982. 9. NREL's Annual Wind Program's, Subcontractor Review MeetingProceedings, October 1993, "ADAMS Modeling of AOC 15/50 Wind Turbine," Bruce A Johnson, Atlantic Orient Corporation, Norwick, VT. 10. NREL Subcontractors Report, "Advanced Wind Turbine NearTerm Product Development, Final Technical Report," September 1994, Subcontract ZA-2-11295-1, R Lynette and Associates, Inc., Redmond, Washington.

R. Lynette & Associates AWT-26 P1
j \
Carter Wind Turbines Inc. CWT-300
Figure 1. ADVANCED WINO TURBINE SYSTEMS
Atlantic Orient Corp. AOC 15/50
11.76 12.0
11.0
10.06 , .0
i 9.0
� .. i3- 8.0 � ii a 7.0 .. = .. "" ..
6.0 =
4.57 5.0
3.51 4.0
3.0
2.:0 1.S6
2nd edge + 3ld flaj) .
3rd- +2nd edge
2nd flap+ 1st edge
1st flap
,�
13P
12P
11P
10P
9P
8P .:
7P
6P .
SP ·
�
3P
2P
1.0 1P
a.o.LJ. �::t=======-s w d � � � � � & � � � 0
29 Rot31fonal speed (rpm)
Figure 2. CAMPBELL DIAGRAM (FAN PLOT)

Configuration AOC 15/50 AWf-26 P1 CWf-300
Rotor 3-bladed, 15-m diameter 2-bladed, 26.2-m diameter 2-bladed, 24-m diameter
Blade Materia!
Hub
Wood/epoxy laminate
Rigid & Down-wind
Wood/epoxy laminate
Teetering & Down-wind
Glass'epoxy composite
Teetering & Down-wind
Hub Height 2.5-m 25.3-m 50.3-m
Rotor Speed 65rpm 57 rpm 65rpm
Rotor Overspeed Control Air Brakes at Blade Tip Air Brakes at Blade Tip Stall with Blade pitch-up
Nacelle Free Yaw . Free Yaw Free Yaw with dampening
Drive Train Design Integrated Gearbox/Generator Discrete Gearbox & Generator Integrated Gearbox/Generator
Rated Power 50 kW @ 1l.Omls 275 kW@ 16.7 m/s 276 kW@ 17.5 mls
Tower Top Weight
Tower Type
2,404kg
3-legged lattice
6,356kg
3-legged lattice
4,431 kg
Guyed Tube
Tower Weight 3,007kg 5,836kg 8,023 kg
TABLE 1. Awr MACHINE CONAGURA.TION
A:2 XL:O.OO YL:-500.00 XH:lO.SO YH:-90.05 -30.00
Log Mag
-110.00
o.oo Freq (Hz)
Figure 3. AOC 15/50 FREQUENCY RESPONSE FUNCTION
10.50

Figure 4. TOWER FORE-AFT & NACELLE PITCH EXCITATION DRIVING THE FIRST OUT-OF-PLANE SYMMETRIC ROTOR BENDJNG MODE
Figure 5. TOWER SIDE-TO-SIDE EXCITATION DRIVING THE SECOND OUT-OF-PLANE ASYMMETRIC ROTOR BENDlNG MODE
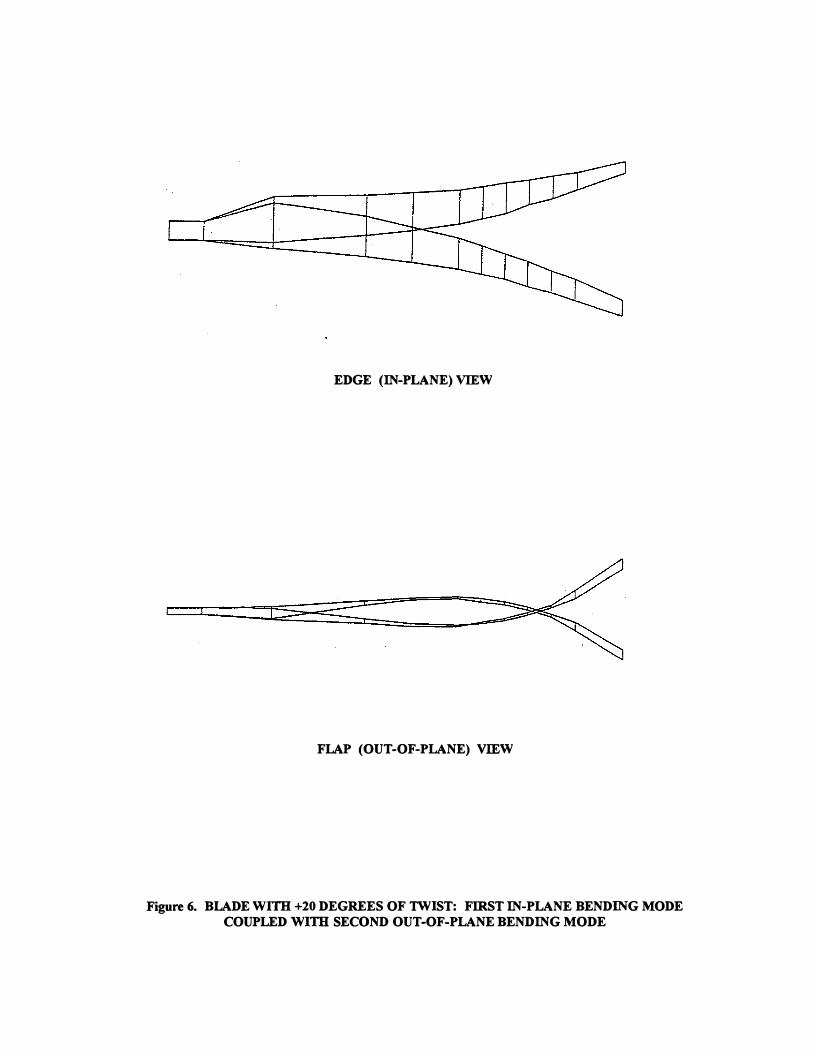
EDGE (IN-PLANE) VIEW
FLAP (OUT-OF-PLANE) VIEW
Figure 6. BLADE WITH +20 DEGREES OF TWIST: FIRST IN-PLANE BENDING MODE COUPLED Wim SECOND OUT-OF-PLANE BENDING MODE
Nacelle Loadcell
Tower Load cell ·
Nacelle Actuator
·rower Side-�ide Actuator
Figure 7. HYDRAULIC SHAKER ATTACHMENT SCHEME
z
, -- Analogue algnll , -·- GPIB • -··- HPIB • _:__ TeatalgMI
SD380Z <I channel � analyzer
�86PC HP7�51 , SMS Sw Modal Unix woolcslallon ,
PC IOIIwlnt lms CAOA·X Unix Software •
l(y X
Modal Tnt Rnulb
� HP7 475 ploller
Boom Truck
TTISW-&K atralngage
load eel
: MTS hydraulic , IJIIemS , conlrO!Iera
Data Van
Figure 8. FULL SYSTEM MODAL TEST EQUIPMENT SETUP
HP�l plfnler

TABLE 2. AOC 15/50 MEASURED AND PREDICTED NATURAL FREQUENCIES
MODE Shape Description Meas. Freq. (Hz) ALGOR Freq. (Hz) ADAMS(Hz)
1st Tower Fore-aft Bending 1.65 1.71 1.65
1st Tower Side-to-Side Bending 1.70 1.76 1.70
1st Rotor Asyrn Flap Bending 3.25 3.35 3.26
1st Rotor Symm. Flap Bending 3.75 3.79 3.74
2nd Rotor Asym. Flap Bending 5.14 5.18
9.60
5.12
8.28 1st Rotor Asym. Edge Bending 8.29
TABLE 3. COMPARISON OF AWf-26 P1 MODAL TEST RESULTS
AND ADAMS NATURAL FREQUENCIES PREDICTIONS
Rotor Configuration Blades Horizontal Blades Vertical
Mode Shape Description Modal Test ADAMS Modal Test ADAMS
lst Tower Fore-aft Bending 1.12Hz 1.09Hz l.l2Hz 1.09Hz
1st Tower Side-to-Side Bending 1.18Hz l.l2Hz l.25Hz l.l2Hz
1st Symm. Rotor Flap 2.44Hz 235Hz 2.44Hz 235Hz
1st Symm. Rotor Edge 430Hz 4.08Hz 6.56Hz 6.58Hz
2ndSynun.RotorFlap 7.23Hz 7.25Hz 7.23Hz 7.26Hz
TABLE 4. CWT-300 BLADE SUB COMPONENT NATURAL FREQUENCIES COMPARISON
Mode Shape Description
I st Flap Bending
Modal Test (Hz)
0.62
ANYSY FEM {Hz)
0.63
2nd Flap Bending 2.26 2.38
1st Edge Bending 2.81 2.64
Jrd Flap Bending 5.66 5.63
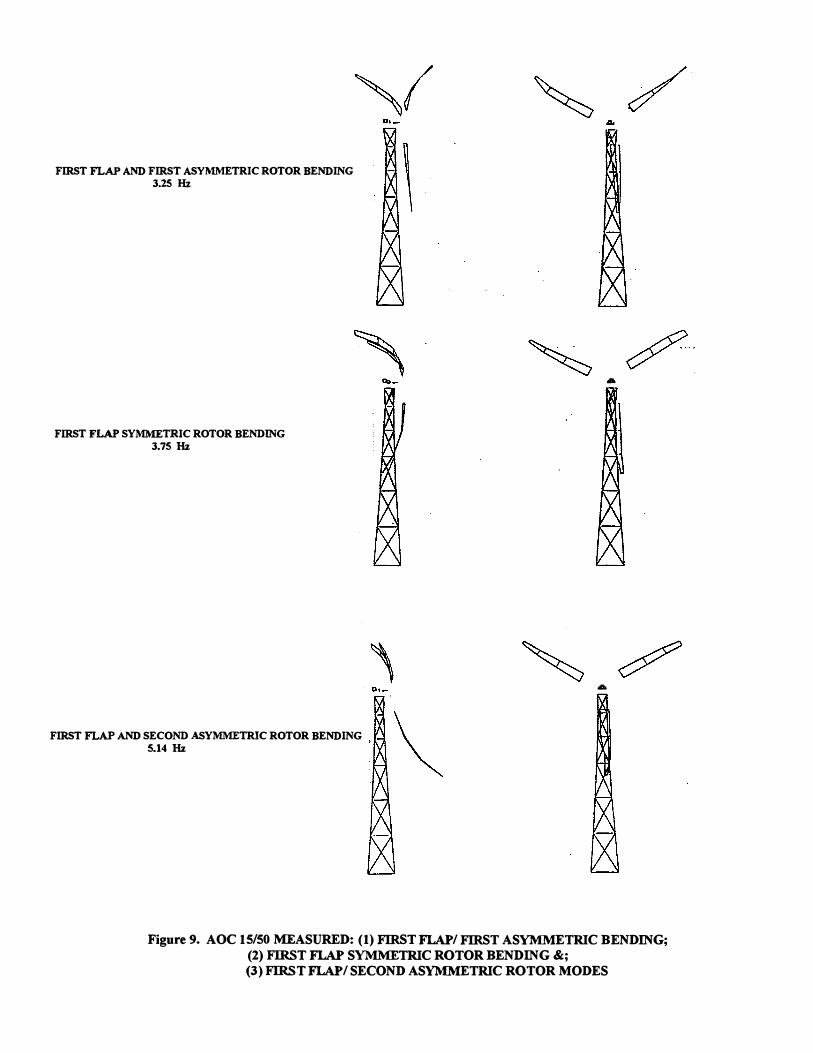
FIRST FLAP AND FIRST ASYMMETRIC ROTOR BENDING
3.25 Hz
FIRST FLAP SYMMETRIC ROTOR BENDING
3.75 Hz
FIRST FLAP AND SECOND ASYMMETRIC ROTOR BENDING
5.14 Hz
..
A
Figure 9. AOC 1 5/50 MEASURED: (1) FIRST FLAP/ FIRST ASYMMETRIC BENDING;(2) FIRST FLAP SYMMETRIC ROTOR BENDING &; (3) FIRST FLAP/ SECOND ASYMMETRIC ROTOR MODES

FIRST FLAP AND ROTOR SYMMETRIC
2.44 Hz FlRST EDGE AND ROTOR SYMMETRIC
4.30 Hz · SECOND FLAP AND ROTOR SYMMETRIC
7.23 Hz
Figure 10. AWT-26 P1 MEASURED: (1) FIRST OUT-OF-PLANE;(2) FIRST IN-PLANE & (3) SECOND OUT-OF-PLANE SYMMETRIC ROTOR BENDING MODES
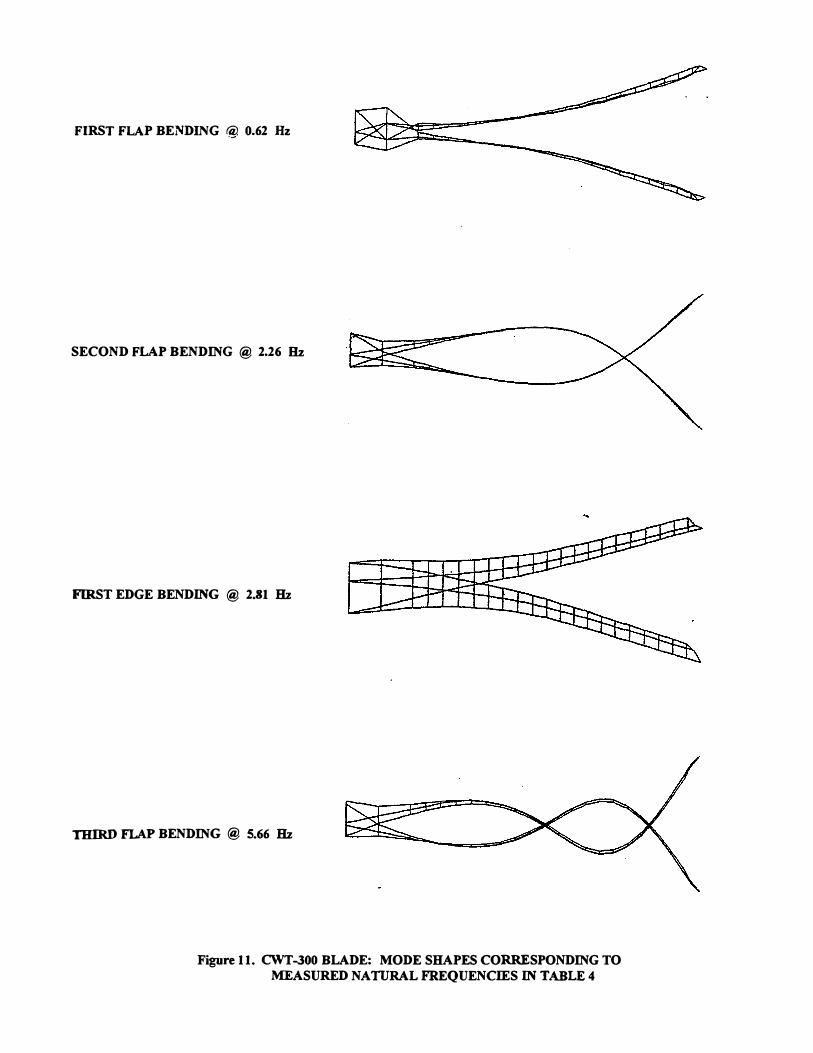
FIRST FLAP BENDING @ 0.62 Hz
SECOND FLAP BENDING @ 2.26 Hz
FIRST EDGE BENDING @ 2.81 Hz
THIRD FLAP BENDING @ 5.66 Hz
Figure 1 1 . CWT-300 BLADE: MODE SHAPES CORRESPONDING TO MEASURED NATURAL FREQUENCIES IN TABLE 4