Embed Size (px)
Citation preview

Mobility and Political Upheavalin an Age of Inequality
By Danny Quah�
Draft: March 9, 2020
Appropriate public policy on inequality hinges critically on un-
derstanding inequality's e�ects on the living conditions of the
poor, on social mobility, and on nationalist populism. This
paper describes two empirical regularities. First, an increase
in inequality typically does not coincide with immiserisation
of the poor and lower middle class. Over 80% of economies
where inequality has risen since 2000 have also increased the
average incomes of their populations' bottom 50%. Second,
for political upheaval, individual well-being and expectations
on its trajectory matter more than inequality. When these
causal factors diverge, the role of inequality is, thus, dimin-
ished. Public policy needs to counter misinterpretation and
misinformation on inequality with rigorous analysis and em-
pirical evidence.
JEL: D31,D63,F52,O40,O57
Keywords: bottom 50%; disinformation; growth; income gap;
income inequality; top 10,%; upward mobility
I. Introduction
The unanimity is deafening. In April 2014 Pope Francis tweeted \Inequality is
the root of social evil".1 Just a few months earlier, in December 2013, President
Barack Obama had declared \the de�ning challenge of our time"|to ensure the
US economy worked for every working American|faced its greatest obstacle in
� Lee Kuan Yew School of Public Policy, NUS, [email protected]. I thank Gayle Amul and KristenTang for assistance; and Gillian Koh, Adam Liu, Kishore Mahbubani, Yong-Soon Tan, Harald Uhlig,Brandon Yoder, and again Gayle and Kristen, and many other LKYSPP colleagues for helpful comments.The author is also Faculty Associate, Centre on Asia and Globalisation at the Lee Kuan Yew School ofPublic Policy.
1http://twitter.com/Pontifex/status/460697074585980928
1

2 N.A. N.A.
\dangerous and growing inequality and lack of upward mobility" jeopardising
that basic bargain for middle-class America.2
Worldwide this narrative on inequality has become clarion call for social and
policy redress. Beyond its signi�cance in domestic policy-making, inequality is
charged with responsibility for the nationalist populism that is both causing
nation-state withdrawal from globalisation and undermining the international
rules-based order. As characterised in Nolan (2019), a grand narrative is emerg-
ing where societies have polarised \into a small elite with highly paid, secure
jobs on one side, and on the other side are growing numbers of people, including
an increasingly `squeezed' middle class, in insecure, poorly-paid work", with this
rising inequality leading to \erosion of solidarity, social trust and faith in demo-
cratic institutions", \election of Donald Trump, the UK's Brexit vote, and the
broad rise of populism".
This paper seeks to add empirical detail to this global debate, so that analysis
and policy-making can draw on an ever more complete evidence base. The paper
presents new calculations on income inequality and mobility, and relates them to
narratives of political upheaval.
Why is it important to accumulate yet more evidence on inequality dynam-
ics? After all, the fraction of wealth accruing to the top 1% has already been
established to be at historical highs (Piketty and Saez, 2003). What more does
one need to know? Despite the conviction often found in such statements, how-
ever, important lessons need to be drawn from the unexpected and unfortunate
outcomes that misunderstanding inequality has sometimes produced.
Most observers would agree that deprivation, poverty, and social immobility
underpin many other social ills. But suppose we �nd those causal factors dimin-
ishing at the same time inequality is rising. Then expending resources to reduce
inequality could be counter-productive, or at minimum unhelpful. The question
then is one not of further re�ning our estimates of inequality but of extracting
their implications. Attempting to rein in inequality while not repairing key un-
derlying causes would be a case of only treating visible symptoms without curing
the patient.
As an example, in 1999 in the US the White House began to push for in-
creased mortgage lending to lower- and middle-income American households.
Rajan (2010) documented how this connected with a governmental strategy of
alleviating political pressures emerging from rising US inequality. An increas-
ingly identi�able American under-class had for decades seen little change in its
economic circumstances. That 1999 White House policy action was a response
2The President's 04 December 2013 remarks to THEARC, Washington DC, available athttps://obamawhitehouse.archives.gov/.

VOL. N.A. NO. N.A. MOBILITY AND POLITICAL UPHEAVAL 3
that treated the symptoms of US income inequality, and thus was politically ex-
pedient. Among American households, home ownership rose from around 65% to
just under 70%.
However, this move failed to treat the root cause of poverty and inequality. It
confronted visibly the challenge of American inequality but it did not solve the
deeper problem of stagnant incomes among the under-class. Instead, the policy
ended up creating a bulge of housing loans that could not conceivably be paid o�
without signi�cant change in the economic conditions of the poor.
The instrument by which the White House enacted this policy was the 1977
Community Reinvestment Act (CRA). In 1998 CRA institutions provided only
3% of housing loans to low- and middle-income Americans. Within a decade,
such loans had grown to be 50% CRA-originated, and had acquired a new label:
subprime mortgages. When the bubble burst in the subprime mortgage market
and borrowers began to default, contagion rippled across American states. This
triggered a national collapse in the US housing market that, in turn, precipitated
the 2008 Global Financial Crisis.
The CRA-vectored attempt to repair US income inequality led to widespread
economic damage worldwide, with the global poor su�ering terribly from loss of
jobs and destruction of savings. This example illustrates how attacking symptoms
without treating the fundamental cause can lead to inappropriate policy actions
with disastrous unintended consequences.
Nonetheless, the temptation remains a powerful one to equate inequality with
ever worse indictment of systemic social failure. To disentangle these, this paper
takes a �rst lead from how Piketty (2014, p. 327) reported \the poorer half of the
population are as poor today as they were in the past, with barely 5 percent of
total wealth in 2010, just as in 1910." The passage goes on to argue: \Basically, all
the middle class managed to get its hands on was a few crumbs". But how much
did the poorer half of the population actually get in the historical co-evolution of
inequality and growth? Did the middle class fall even further behind|i.e., fail
even to keep the same share as they had previously|and if so what exactly was
the growth rate of their incomes? The current paper addresses these questions
by examining the income dynamics of that bottom 50%.
By broadening the discussion beyond just inequality measurement, but keeping
nonetheless to the same spirit of investigation, this paper also takes the stance
that important for analysis is not just what happens to the \top 1%", but instead
how people across the spectrum view the prospects for their leading enabled,
meaningful, and satisfying lives. For those in the bottom half those life chances
are better revealed by their income dynamics|their opportunities for upward
mobility|than by inequality alone.
4 N.A. N.A.
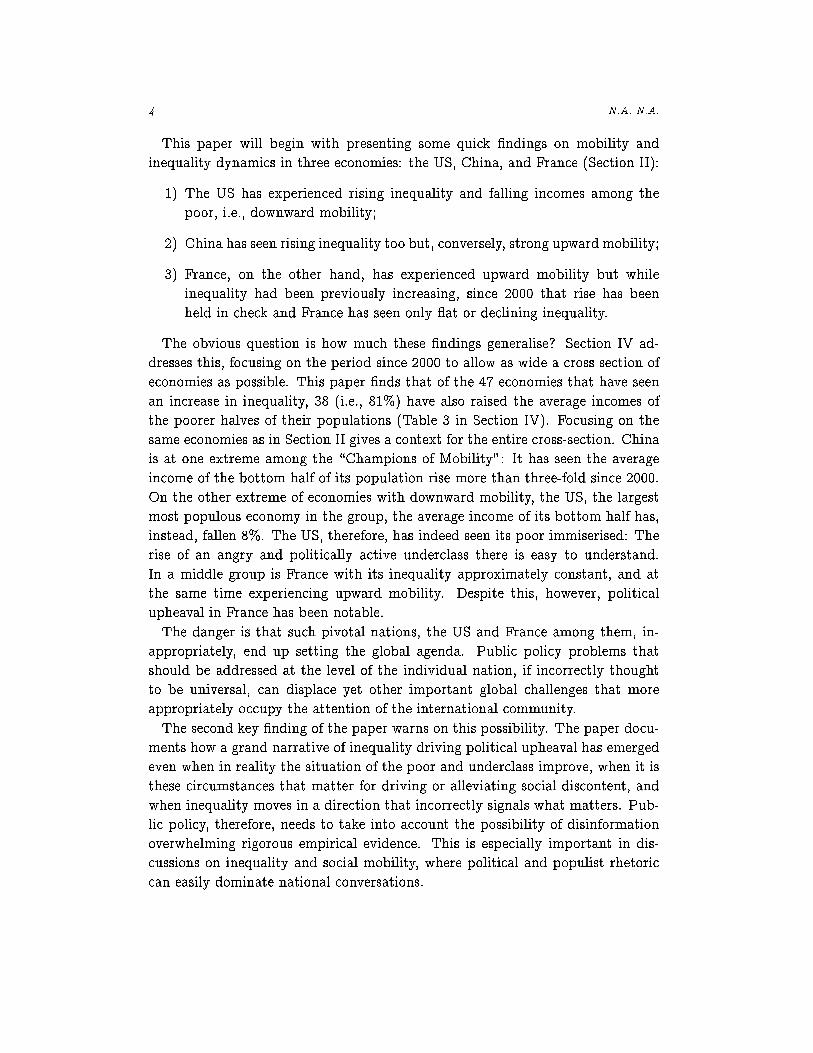
This paper will begin with presenting some quick �ndings on mobility and
inequality dynamics in three economies: the US, China, and France (Section II):
1) The US has experienced rising inequality and falling incomes among the
poor, i.e., downward mobility;
2) China has seen rising inequality too but, conversely, strong upward mobility;
3) France, on the other hand, has experienced upward mobility but while
inequality had been previously increasing, since 2000 that rise has been
held in check and France has seen only at or declining inequality.
The obvious question is how much these �ndings generalise? Section IV ad-
dresses this, focusing on the period since 2000 to allow as wide a cross section of
economies as possible. This paper �nds that of the 47 economies that have seen
an increase in inequality, 38 (i.e., 81%) have also raised the average incomes of
the poorer halves of their populations (Table 3 in Section IV). Focusing on the
same economies as in Section II gives a context for the entire cross-section. China
is at one extreme among the \Champions of Mobility": It has seen the average
income of the bottom half of its population rise more than three-fold since 2000.
On the other extreme of economies with downward mobility, the US, the largest
most populous economy in the group, the average income of its bottom half has,
instead, fallen 8%. The US, therefore, has indeed seen its poor immiserised: The
rise of an angry and politically active underclass there is easy to understand.
In a middle group is France with its inequality approximately constant, and at
the same time experiencing upward mobility. Despite this, however, political
upheaval in France has been notable.
The danger is that such pivotal nations, the US and France among them, in-
appropriately, end up setting the global agenda. Public policy problems that
should be addressed at the level of the individual nation, if incorrectly thought
to be universal, can displace yet other important global challenges that more
appropriately occupy the attention of the international community.
The second key �nding of the paper warns on this possibility. The paper docu-
ments how a grand narrative of inequality driving political upheaval has emerged
even when in reality the situation of the poor and underclass improve, when it is
these circumstances that matter for driving or alleviating social discontent, and
when inequality moves in a direction that incorrectly signals what matters. Pub-
lic policy, therefore, needs to take into account the possibility of disinformation
overwhelming rigorous empirical evidence. This is especially important in dis-
cussions on inequality and social mobility, where political and populist rhetoric
can easily dominate national conversations.
VOL. N.A. NO. N.A. MOBILITY AND POLITICAL UPHEAVAL 5
The remainder of this paper is organised as follows. As already described,
Section II takes a quick �rst look at some of this paper's key empirical �ndings
speci�cally for China, the US, and France. We will see a diversity of experience
on growth, inequality, and mobility across these economies. Section IV addresses
the question of how widespread across the world these characterisations are.
But before then Section III puts a context to these general empirics by recording
in one place some of the most immediately relevant statements on inequality.
The aim of the Section, however, is not just to show that inequality is of research
interest. Instead, this Section points to how a particular narrative on inequality
has become the dominant one in public policy thinking.
Section V addresses how this might have come about by assessing the relation-
ship between inequality and mobility on the one hand, and indicators of political
upheaval on the other. We will see that political activity typically thought to be
driven by high inequality and low social mobility can occur even when inequality
is falling and upward mobility. This paper conjectures that these dynamics are
driven by a kind of disinformation, where the experience in high-pro�le, highly-
visible situations are assumed to carry over, inappropriately in some cases, to
other contexts.
Section VI concludes.
II. Quick Findings
This paper employs straightforward and easily interpretable measures of a num-
ber of key concepts for income distributions. By inequality, the paper means
the di�erence, measured in in ation-adjusted purchasing power parity 2018 ACEuros, between the average income of the top 10% and the average income of
the bottom 50% of the income distribution across people. Section IV will refer
to this inequality as Q. If the average income of the bottom 50% rises, then I
say there is upwards mobility; if it falls or remains constant, I say there is
downward mobility or immobility, respectively. Section IV will refer to the
average income of the bottom 50% as yB50.
As a matter of logic and arithmetic, a rise in inequality can come with any one
of upward mobility, downward mobility, or immobility. Economic growth overall
is an important co-determinant, and when su�ciently high relative to the change
in inequality can imply upward mobility even when inequality increases (Bour-
guignon, 2003; Milanovic, 2016; Quah, 2003). Thus, inequality alone provides
neither su�cient statistic nor overwhelming causal factor. Empirical evidence
indicates that, on average across countries, it is economic growth that dominates
(Dollar and Kraay, 2002).
6 N.A. N.A.
What is of interest in the current study, however, are speci�c individual national
experiences, not just what happens on average. A diversity of these is given by
the examples of the US, Chinese, and French cases, summarised in Figures 1{3
and Table 1. Subsequent sections will be considering as large a cross section of
economies as possible, and so study the period since 2000. Here, for just the three
national economies, the year 1980 instead is a convenient starting point.
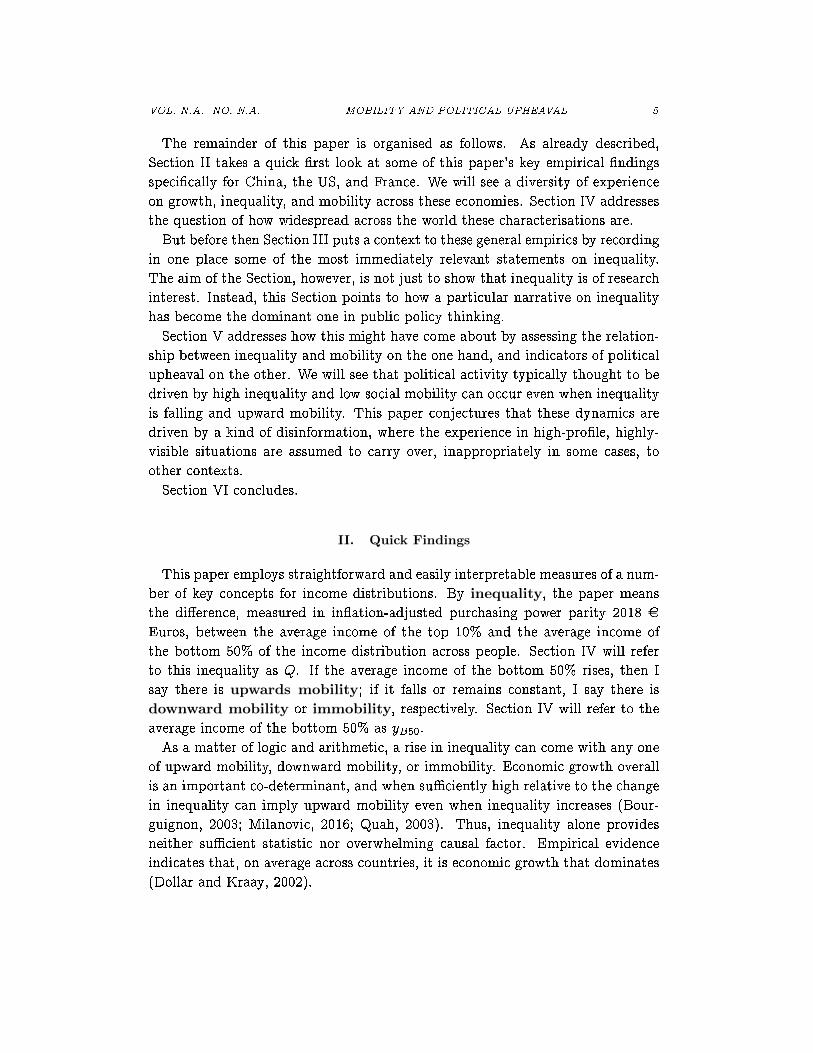
Figure 1. The first panel shows US inequality: in the last four decades the average income
of the top 10% has nearly tripled, dramatically increasing the separation from the average
income of the bottom 50%. The second panel shows the state of US mobility (this is just the
line towards the bottom of the first panel): the poorer half's average income is actually
lower in 2014 than in 2000, and only about the same level as in 1989 and 1980.
Figure 1 shows that the average income of the top 10% in the US has nearly
tripled, dramatically increasing the separation from the average income of that
economy's bottom 50%. Thus, the �rst panel shows high and rising inequality.
The second panel shows the state of US mobility: (this is just the line towards
the bottom of the �rst panel) the poorer half's average income is lower in 2014
than in 2000, and only about the same level as in 1989 and 1980. Thus, for the
US there was immobility over the longer term and even downwards mobility over
signi�cant stretches of time.
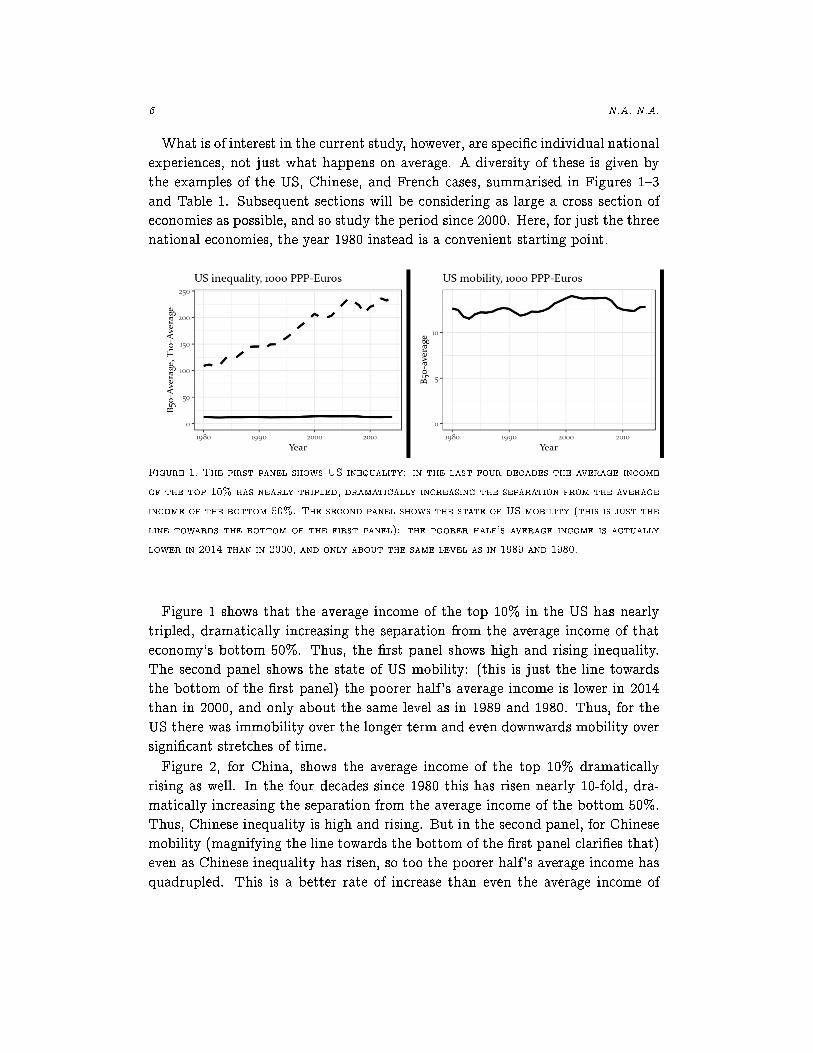
Figure 2, for China, shows the average income of the top 10% dramatically
rising as well. In the four decades since 1980 this has risen nearly 10-fold, dra-
matically increasing the separation from the average income of the bottom 50%.
Thus, Chinese inequality is high and rising. But in the second panel, for Chinese
mobility (magnifying the line towards the bottom of the �rst panel clari�es that)
even as Chinese inequality has risen, so too the poorer half's average income has
quadrupled. This is a better rate of increase than even the average income of

VOL. N.A. NO. N.A. MOBILITY AND POLITICAL UPHEAVAL 7
Figure 2. The first panel shows Chinese inequality: in the last four decades the average
income of the top 10% has risen nearly 10-fold, dramatically increasing the separation from
the average income of the bottom 50%. The second panel shows Chinese mobility: even as
Chinese inequality has risen, so too the poorer half's average income has almost quadrupled.
This is a higher rate of increase than even that of the average income of the US top 10%.
the US's top 10%. China's poor have grown much better o� compared to four
decades past, even as the separation between them and China's rich has risen.
Thus, increases in inequality, in general, do not equate to immiserisation of the
poor and lower middle class.
Figure 3 provides the third example. It depicts French inequality and mobility.
In the last four decades the average income of France's top 10% has risen 50%.
This is a large increase but far smaller than its counterpart in either China or
the US. Moreover, inequality as measured by the separation between average
incomes of the top 10% and the bottom 50%, has been declining since the mid-
2000s. Indeed that separation in 2014 is only about the same magnitude as in
2000. The second panel shows French mobility (magnifying the line towards the
bottom of the �rst panel clari�es how): the French poorer half's average income
has actually been rising. The poor's average income in France has increased 38%
from 1980. While not as good a performance as for China, this is an order of
magnitude better than the US's.
Table 1 summarises the critical message from Figures 1{3. Its critical points,
repeating the message already given earlier in Section I, are:
1) The US has seen rising inequality and downward mobility;
2) China has experienced rising inequality and, at the same time, strong up-
ward mobility|average income of China's bottom 50% has risen faster than
average income of the US's top 10%;

8 N.A. N.A.
Figure 3. The first panel shows French inequality: in the last four decades the average
income of the top 10% has increased 50%. This is large but far smaller than its counterpart in
either China or the US. Moreover, inequality as measured by the separation between average
incomes of the top 10% and the bottom 50%, has been declining since the mid-2000s. Indeed
that separation in 2014 is only about the same magnitude as in 2000. The second panel shows
French mobility: the French poorer half's average income has actually been rising. The poor's
average income in France has increased 32% from 1980. While not as good a performance as
for China, this is an order of magnitude better than the US's.
3) France has had upward mobility while inequality remained roughly at since
2000.
But which of these �ndings is the norm and which unusual relative to the experi-
ences of all the di�erent nations across the world? Section IV will address these
and related questions, but it is useful before then to get a sense of the challenge
that inequality poses for research and public policy.
III. Related Literature
Examples in Section I have highlighted a clear and powerful political narrative
on the overwhelming signi�cance of inequality. Those speci�c cases happened to
come from Pope Francis, Barack Obama, and Thomas Piketty, but the message
itself has been communicated on many di�erent levels.
For over two decades technical work on endogenous growth has considered in-
equality to be potentially causal for aggregate growth (early papers include, e.g.,
Benabou, 1996; Galor and Zeira, 1993; Persson and Tabellini, 1994). More re-
cent writings have no longer felt need theoretically to justify interest in income
disparities, not least as the measured increase in inequality has been so large
and so striking. Instead, the latest work have focused on the painstaking task

VOL. N.A. NO. N.A. MOBILITY AND POLITICAL UPHEAVAL 9
In 1000ACInequality Q Bottom 50% yB50
1980 2000 2014 1980 2000 2014
USA 96.3 193.1 227.7 12.7 13.8 12.8
China 3.3 11.9 48.2 0.8 1.3 3.7
France 64.1 94.9 95.0 11.5 12.2 15.2
Table 1|Source: Author's calculations from Section IV: That Section also defines Q and
yB50 The range of experiences is wide: 1. The US has seen rising inequality and downward
mobility|between 1980 and 2014 inequality rose by 136%, while the average income of the
bottom half remained constant, with that 2014 average income lower than in 2000; 2. China has
experienced rising inequality and, at the same time, strong upward mobility|from 1980 to 2014
the average income of the bottom half of the population increased by 275%, while inequality
rose 15-fold; 3. France has, since 2000, seen both upward mobility and flat inequality; since
1980, average income of the bottom half of the population has risen 32%.
of documenting the degree and form of inequality settling into economies across
the world (Alvaredo, Atkinson, Piketty and Saez, 2013a; Milanovic, 2005, 2016;
Piketty and Saez, 2003), with Piketty (2014) providing a magisterial overview
and relating inequality's evolution to di�erentials between economic growth and
returns on capital. The penetration of these writings on the global public con-
sciousness has been profound.
World Economic Forum Global Agenda Councils (2015) named inequality the
biggest challenge facing the world|ahead of, among other things, the failure
of global leadership, geostrategic rivalry, and global climate change. There was
no confusion over related distributional outcomes such as poverty or the lack of
upward mobility: the evidence featured was that on the rise of national income
shares accruing to the richest 1% across a range of nations (Alvaredo et al., 2013b).
Basu (2018), former World Bank chief economist, pronounced on the geopolit-
ical implications of domestic inequality:
Around the world, the e�ects of alarmingly high economic inequality
are spilling over into politics and society. Economic insecurity is a
driving force behind violent con icts in the Middle East and the rise
of fascist elements in some European countries, not least Hungary
and Poland. Even in older democracies such as the United States,
economic marginalization has led to a strengthening of chauvinist and
supremacist identities and other social problems such as the opioid
epidemic.
In this reckoning, within-nation inequality is causal for violence, drug addic-
10 N.A. N.A.
tion, the rise of fascism and nationalist populism, and thus tensions across na-
tions.3 Basu (2018) makes important normative points about ethics, but what
many readers will take from the article is how inequality is driving \violent con-
icts, [: : : ], the rise of fascist elements [: : : ], a strengthening of chauvinist and
supremacist identities, and other social problems".
Beyond economics, inequality can appear as a convenient conduit by which
speci�c political outcomes emerge out of di�erent socioeconomic forces. In the
language of probability theory, we might say inequality is a su�cient statistic.
Thus, Rodrik (2018, pp. 1{2) describes how, apart from globalization, di�erent
forces might drive the rise of populism:
I do not claim that globalization was the only force at play|nor
necessarily even the most important one. Changes in technology, rise
of winner-take-all markets, erosion of labour-market protections, and
decline of norms restricting pay di�erentials have all played their part.
These developments are not entirely independent from globalization,
insofar as they both fostered globalization, and were reinforced by it.
But neither can they be reduced to it.
All these alternative drivers, while indeed di�erent from globalization|the
point Rodrik (2018) emphasises|matter, however, only in how they raise in-
equality. In other words, while they cannot be reduced to globalisation, they can,
instead, be collapsed to inequality: changes in technology advantage the skilled
workforce, and destroy routine or physical jobs held by the unskilled, hence in-
creasing disparities between rich and poor; winner-take-all markets concentrate
incomes at the very top end of the income distribution, and so raise inequality;
labour-market protections help support the lower end of the income distribution,
so their demise allows the bottom to fall even further; and of course once pay
di�erentials are no longer held in check by social or other norms, inequality is
free to rise without bound. Indeed, the impact of globalization itself, to a large
degree, is imagined to work through rising inequality|if not in income alone
then certainly in power and control, with international cosmopolitan elites on
one extreme, and ordinary people on the other.
Nolan (2019) summarises this kind of reasoning as an emerging grand narrative
where \globalisation and technological change have polarised society into a small
elite with highly paid, secure jobs on one side, and on the other side are growing
numbers of people, including an increasingly `squeezed' middle class, in insecure,
3The article does refer to poverty, once, in a statement about the World Bank showing 10 percent ofthe global population still living below $1.90 per day. But it is inequality that occupies almost all thediscussion, and the connection between inequality and global poverty is never made explicit.

VOL. N.A. NO. N.A. MOBILITY AND POLITICAL UPHEAVAL 11
poorly-paid work", with this rising inequality leading to \erosion of solidarity,
social trust and faith in democratic institutions", \election of Donald Trump, the
UK's Brexit vote, and the broad rise of populism".4
Such studies analyse a chain that goes from globalisation and other varied
fundamental causal drivers|through, in my interpretation, inequality, and then
onwards|to the rise of populism.
Yet other studies simply take inequality, however exogenously arrived at, as
the key driving variable in a political process of interest. Nowhere is this clearer
than in analyses of democratic transition using models of \distributive con ict".
Haggard and Kaufman (2012, p. 495) summarise the important work of Acemoglu
and Robinson (2006) and Boix (2003) in the following:
The more unequal a society, the greater the incentives for disadvan-
taged groups to press for more open and competitive politics. Yet the
wider the income disparities in society, the more elites have to fear
from the transition to democratic rule and the greater the incentives
to repress challenges from below.
Opposing forces in society|notably both derived from inequality|impact the
possibility of democratic transition. Depending on which of the dynamics dom-
inate, the probability of institutional change can rise or fall: in the models of
Acemoglu and Robinson (2006), for instance, there is an inverted U-shaped re-
lation between democratic transition and levels of inequality. Inequality, in this
analysis, is at one and the same time what drives societies to shift from autocracy
to democracy, or keeps the elites motivated to preserve the old regime.
Across today's wider-world cross section of nations, public concern over high
inequality is not seen only in autocracies that are in queue waiting to transition
into democracies. Indeed, it is in mature democracies where that public concern
has become just as intense, if not more so.
Related to this understanding of inequality as both conduit and cause are those
public conversations that seamlessly identify inequality as equivalent to poverty.
There too inequality is tagged as the culprit for all social ills. For instance, in
an interview with the authors Wilkinson and Pickett (2018), the journalist Dawn
Foster (2018) wrote:
4Nolan's point, expanded further in Nolan (2018) and Nolan and Valenzuela (2019), is that that causalchain applies only for the US and a few other places, and cannot be generalised. Nolan's conclusion onUS exceptionalism is con�rmed in Section IV to follow as well as in Quah (2019). However, my analysison American exceptionalism draws on information in the dynamics of income distribution alone|theUS is so di�erent from any other major economy|and not on any other data on populism. Nolan (2019)describes how across the OECD, median household income growth bears little relation to inequality. Thispaper, on the other hand, will document that across all nations, not just the OECD, inequality increasesmainly come with increases, not declines, in incomes across the entire bottom half of the population.

12 N.A. N.A.
New analysis : : : showing that 14mn people live in poverty highlights
just how unequal a society the UK has become. [: : : ] The reality is
that inequality causes real su�ering.
As a matter of arithmetic, however, except under extreme conditions|total
income held constant, the spread of income distribution veering into range of suf-
�ciently low absolute levels|the number of people living in poverty is unrelated
to how unequal society is.
Starvation, child hunger, and inter-generational recidivism are problems of
poverty and immobility. Those problems remain as long as high poverty and low
mobility remain, independent of whether inequality is high or low. If inequality
is lowered but high poverty and low mobility are unchanged, society will continue
to experience starvation, child hunger, and persistently high cross-generational
rates of incarceration.
While it is unreasonable to expect this logic to be explained in a newspaper
article, the more that such publications glide over the conceptual di�erence be-
tween inequality and poverty, the more ingrained in society's thinking becomes
this incorrect identi�cation, and consequently the more di�cult the public policy
challenge on inequality.
One of the most valuable publications in this regard is the nuanced and bal-
anced UNDP (2019) report. This publication points to inequality as a signi�cant
commonality across political upheavals worldwide, but then also quali�es that
observation: \while people may protest to keep pennies in their pockets, power is
the protagonist of this story: the power of the few; the powerlessness of many; and
collective power of the people to demand change" (UNDP, 2019, p. iii). Inequality
might well be a signi�cant presence, but it also comes with other socioeconomic
and political forces. In comparison with those, inequality might turn out not to
the critical agent after all.
If this con�guration of driving forces remains invariant, then the point might be
just academic to say that it is something else that matters, not inequality, when
the two always come together. However, extant �ndings do suggest a relevant
distinction to be made, and the remainder of this paper will seek to provide more
such evidence.
Using survey data for China, Whyte (2016) showed that despite the principal
narrative on social discontent in China|as elsewhere|blaming high and grow-
ing income inequality, in reality, instead, it is the disparity in power that most
exercises the population. The average Chinese citizen is not particularly con-
cerned about the income gap between rich and poor. This is consistent with
Section II discussion on China's strong upward income mobility, at the same
time that inequality has continued to rise. Chinese citizens are concerned about

VOL. N.A. NO. N.A. MOBILITY AND POLITICAL UPHEAVAL 13
\abuses of power, o�cial corruption, bureaucrats who fail to protect the public
from harm, mistreatment by those in authority, and inability to obtain redress
when mistreated" (Whyte, 2016, p. 9). Inequality is at worst an endogenous out-
come, alongside social anger, of an unbalanced system; inequality is not a cause
of social discontent.
For the US, on the other hand, when Americans were asked how much wealth
inequality there was in US society, they systematically gave estimates much lower
than reality (Norton and Ariely, 2011, Fig. 2). In 2005, when the survey was con-
ducted, the top 20% of Americans held 84% of total wealth; survey estimates
averaged only 59%. The bottom 40% of Americans owned only 0.3% of total
wealth; survey estimates averaged almost 10%. This under-estimation of inequal-
ity was remarkably consistent across income class, political belief, and gender
groups (Norton and Ariely, 2011, Fig. 3).
Such analyses highlight how di�cult a concept inequality is for the typical in-
dividual to grasp. Unlike prices or other concrete signals, inequality is neither
concrete for nor speci�c to any economic agent on which basis that agent can
take direct action. Inequality is not a condition or parameter that applies to any
single individual|the color of one's skin, say, or the prices and incomes against
which someone can solve an optimisation problem. Instead, it is meaningful only
to an entire group or society, and takes the same value for every individual in
the group. Eriksson and Simpson (2012) show that powerful anchoring e�ects
can lead to survey respondents expressing inordinately low values in both their
guesses for actual inequality and their preferred levels for what inequality should
be. Starmans, Sheskin and Bloom (2017) note that in laboratory studies of small
groups, people might express a preference for perfect egalitarianism, but inequal-
ity is instead the preferred outcome in larger-scale studies with more realistic
population variation. How attitudes towards inequality change under a particu-
larly simple variation|when average income changes|was studied in Hirschman
and Rothschild (1973).
A �nal strand of literature is relevant, one that has studied rigorously the
relation between inequality and populism (e.g., Nolan and Valenzuela, 2019).
However, given that a �rst goal of this paper is to establish empirical regularities
surrounding inequality and other social indicators, it will be logical to discuss
those results only after �rst establishing those regularities.
The conclusion I take from the studies I have described is two-fold. On the one
hand, both political commentary and scholarly research have hiked the stakes on
inequality. Many di�erent socioeconomic and political dynamics are now assumed
to be driven by or modulated through inequality. On the other hand, inequality's
micro-foundation in terms of individual understanding|that inequality di�ers
14 N.A. N.A.
from poverty and mobility, say|is only very weakly established. Inequality is
a di�cult concept for people who have to take decisions based on their under-
standing of the environment in which they operate: inequality illiteracy is high
but that should not drive political action.
It is helpful, therefore, to provide simpler, more direct indicators of inequality
and of related concepts such as mobility that are more easily interpretable in
terms of individual experience. The next section turns to three such indicators.
Indeed the previous Section II has already informally used them, and thereby
demonstrated why these indicators appeal: Their meanings are readily discussed
even without extensive prior technical preparation.
IV. Results: Growth, Mobility, and Inequality
The combined thrust of arguments in the previous Section III draws inequality
out as so powerful a determining factor of socioeconomic and political outcomes,
one should be able to �nd the impact of inequality obviously in data, and not need
�nely-detailed regression analysis controlling for all other possible confounding
variables. That \obvious e�ect" approach is the one I adopt here.
Following Section II, I analyse principally two variables over time in the cross-
section of economies:
1) Inequality, or Q, the separation between average incomes of the top 10%
and the bottom 50%;
2) Upward mobility, or m, the rate of increase of the average income of the
bottom 50%.
Income growth rates needn't be positive. Therefore, I will refer to the income
growth rate that is upward mobilitym|measured as proportional rates of change,
in percent per annum|as just mobility, when there is no possibility of confu-
sion, and taking care not to con ate m with intra-distribution mobility or other
mobility indices (e.g., Geweke et al., 1986; Singer and Spilerman, 1976). In addi-
tion to inequality Q, here de�ned as just a di�erence in average incomes across
two di�erent income groups, I also de�ne relative inequality q as the ratio of
Q to the average income of the bottom 50%. This measure of relative inequality
is non-negative and unit-free, but, just as Q, still directly relatable to individual
experience.
Average income in this paper is per adult national income, i.e., GDP less con-
sumption of �xed capital plus net foreign income. As argued in World Inequality
Database (2019) this is more appropriate for analysis of economic well-being than
GDP per capita.

VOL. N.A. NO. N.A. MOBILITY AND POLITICAL UPHEAVAL 15
The modern literature reports and conceptualises inequality in a range of ways:
inequality indices range from the well-known Gini coe�cient, the mean-median
ratio, the log standard-deviation, capital's share of national income, and so on
through dozens of other indicators. Here, I seek only a measure that relates trans-
parently to the personal circumstances of an individual agent living within that
income distribution, and therefore comes in units directly meaningful to an as-
sessment of individual well-being. For these reasons, indexes like Gini coe�cients
are less useful: a Gini coe�cient of 0.75 (say) in a given society is not immediately
comparable to any individual's personal circumstances. Similarly, a measure like
the income share accruing to the top 1% (say), while politically evocative, does
not translate directly to an individual's economic situation. Indeed, it is a mat-
ter of logic that what happens to the top 1% says nothing about the material
circumstances of the poor. Moreover, again simply as a matter of arithmetic, an
income share of, say, 50% means something very di�erent in a rich �rst-world
nation than it does in a poor emerging economy, or indeed in any given economy
growing over time.
For these reasons, by inequality Q I mean in this paper the distance between the
average income of the top 10% of adults in the economy and the average income
of the bottom 50%. This measure of inequality is immediately understandable to
any observer, as long as they have some idea of any individual's income. It is only
a further small step from Q to my measure of relative inequality q, that normalises
the separation Q by the bottom endpoint of the interval joining average incomes
of the top 10% and the bottom 50%. As the name suggests relative inequality
q provides a sense of the gulf between rich and poor, from the perspective of a
representative agent among the poor.
Finally, for mobility, it is upward mobility that is most useful in the cur-
rent study. The leading alternative notion of social mobility|switches in ranks,
changes in percentiles or quintiles, and so on|that references churning among
the individuals in the distribution is not useful in the current work.
Fig. 4 explains this paper's preference for income mobility, rather than social
mobility. When there is upward mobility (panel (a) in the Figure), incomes rise
on average, but no group's position is guaranteed. However, when there is social
mobility (panel (b)), some group is guaranteed to have risen in ranking. But,
as a matter of logic, this can happen only because some other group falls: social
mobility, in this sense, is a zero-sum proposition.5
5Footnote 10 in Chetty, Hendren, Kline and Saez (2014a, p. 1562) recognises this, for intergenerationalmobility, as how \if one child moves up in the income distribution in terms of ranks, another must comedown". The property appears in Hout (2015, p. 27) as symmetry, i.e., in the absence of other changes,\mobility is intrinsically symmetrical; each upward move is o�set by a downward move".

16 N.A. N.A.
t
y
(a)
t
y
(b)
Figure 4. Income Mobility and Social Mobility. Each of the left and right panels|societies
(a) and (b) respectively|shows a distribution of income y changing through time t. Each
small circle represents 20% of the group whose income distribution is depicted. The left
panel, that for society (a), sees an increase in average income, but leaves unrestricted who
goes where in the income distribution. When (a) is confined to the bottom 50% in society, this
change in average income is what the text refers to as income mobility. The right panel, that
for society (b), shows the group originally in the 21st{40th percentile, (i.e., the second 20%)
experiencing upward social mobility in transitioning to the third 20%: they rise in society.
For this to happen, however, some group originally in the top 60% must fall into the bottom
40%, thereby experiencing downward social mobility. Put directly, if previously you had
60% of the population richer than you but now only 40%, then one-fifth of the population,
somewhere, must have fallen in the process. Upward social mobility is impossible without, at
the same time, equal and opposite downward social mobility. Social mobility is a zero-sum
proposition.
Respecting the Pareto principle, income mobility, as de�ned in m, potentially
raises social well-being. In contrast, social mobility worsens someone's position
for certain at the same time it seeks to elevate others. Indeed, social mobility
might be high simply because the rich su�er worse outcomes, not because anyone

VOL. N.A. NO. N.A. MOBILITY AND POLITICAL UPHEAVAL 17
in society is actually materially better o�.
There is a closely-related reason for focusing on income mobility as de�ned by
m. UNDP (2019, p. 1) describes the key challenge:
In every country many people have little prospect for a better future.
Lacking hope, purpose, or dignity, they watch from society's sidelines
as they see others pull ahead to ever greater prosperity. Worldwide
many have escaped extreme poverty but even more have neither the
opportunities nor the resources to control their lives.
This quote is followed, in the original, by a statement that income inequality
should be reduced. Logically, however, lowering inequality is neither necessary
nor su�cient to solve the key problems described in the quote. Inequality could be
zero and society perfectly egalitarian, and still people could \have little prospect
for a better future", and \have neither the opportunities nor the resources to
control their lives": all of society might be dirt-poor and itself going nowhere. In
contrast, inequality could be high, but if all of society were su�ciently rich and
economic growth continued to be strong, then everyone would have good future
prospects and would be in control of their lives. What matters to deliver the
poor out of the predicament described in the quote is that they have su�cient
income, not whether there are others in society richer than them. Thus, it has
to be through upward income mobility, i.e., m > 0, that, by de�nition, these
problems identi�ed can be assuredly solved.
The Technical Appendix SectionVII discusses further other potentially useful
mobility concepts. Hereafter, I focus on mobility m as measured by the signed
rate of change in average income of the poorer half of adults in an economy.
Positive m indicates the poor in the future are better o� than the poor in the
past, whereas negative m indicates immiserisation of that group. The greater the
absolute value of m the faster either of these is happening.
The primary data source I use is World Inequality Database (2019). I now de-
scribe how I construct (m;Q; q) from there. Take fromWorld Inequality Database
(2019) per adult national income in in ation-adjusted, Purchasing Power Parity
2018 AC Euros; the Top 10% share; and the Bottom 50% share.6 Call these respec-
tively y, �T10, and �B50. Denote average incomes in the top 10% and bottom 50%
6World Inequality Database (2019) documents that \only few institutions provide inequality esti-mates and those who do so (e.g., the OECD or the World Bank data portals) rely for the most part onhousehold surveys. One key problem with surveys, however, is that they are based upon self-reportingand are well known to underestimate top incomes and top wealth shares. In addition, surveys only covera limited time span and make it impossible to o�er a long-term perspective on inequality trends. Incontrast, WID.world combines national accounts and survey data with �scal data sources. This allowsus to release inequality estimates that are more reliable|from the bottom to the top of the distributionof income and wealth|and also that span over much longer periods."
18 N.A. N.A.
by yT10 and yB50. Calculate them by noting that, if total population is written
N , then by de�nition:
�T10 =10%�N � yT10
N � yand �B50 =
50%�N � yB50N � y
;
so that rearranging gives
(1) yT10 =y � �T10
0:1and yB50 =
y � �B500:5
:
Total population N , while central in the conceptualisation, is never needed in
equation (1).
Hereafter use an upper bar x to denote timeseries average, superscript xg to
denote proportional growth rate, and superscript x� to denote location or level.
A timeseries graph can be partially described by these three operators. The
timeseries average and population growth rate are obvious but for location or
level of the graph, I use the median rather than arithmetic mean, or initial or
�nal values. The idea here is not to �xate overly on, say, starting or terminal
levels, but instead just to indicate the height of the timeseries graph.
Construct for each economy the timeseries:
(2) m = ygB50
def=
d(yB50)=dt
yB50; Q
def= yT10 � yB50 ; q
def= Q=yB50
of mobility, inequality, and relative inequality. In the sequel, it will be convenient
to report
� m time-averaged mobility, or long-run mobility;
� Qg, qg, the long-run growth rates of inequality and relative inequality, re-
spectively;
� Q�, q�, the location of inequality, i.e., the median value of the timeseries
observations on Q and q, respectively.
Growth rates Qg, qg will give a sense of longer-run trends in inequality. Recall
that unlike, say, Gini coe�cients or income shares, the inequality measures Q and
q are not bounded from above: it makes sense, therefore, to consider longer-run
dynamics in them.
Since the focus in this paper is not extreme long-run dynamics but what tran-
spired in the last several decades, I look at the inequality and mobility experience
since 2000.
Table 2 shows long-run mobility and the dynamics of inequality and relative
inequality. It gives economies in decreasing order of long-run mobility. In the

VOL. N.A. NO. N.A. MOBILITY AND POLITICAL UPHEAVAL 19
2000-2016 m Q� Qg q� qg
1. China 7.2 29.4 9.7 12.9 2.6
2. Moldova 5.6 8.8 2.0 5.2 -3.6
3. Thailand 5.5 62.0 2.3 21.0 -3.1
[: : : ]
47. Saudi Arabia -0.3 369.4 -0.3 39.1 0.0
48. Qatar -0.5 758.4 0.3 34.1 0.8
49. USA -0.5 209.7 1.2 15.5 1.7
50. Netherlands -0.5 89.4 1.6 4.0 2.1
[: : : ]
58. UAE -4.2 434.8 -3.7 35.4 0.5
59. Yemen -4.8 32.2 -4.8 17.0 0.0
60. Oman -5.0 280.6 -2.6 32.6 2.4
Table 2|2000-2016 Champions of mobility, and others. Economies are sorted in descending
order of long-run mobility m. Units for the different variables are m Mobility (% p.a.); Q�
Inequality (103AC); Qg and qg long-run rates of change (% p.a.); while q� relative inequality
is a unit-free ratio. As described in the text the locations Q� and q� are medians in the
timeseries values for each economy, and are not necessarily either start or end points: they
are intended only to give a sense of the (stochastic) height of each timeseries graph. By
definition, qg = Qg �m. Insufficient data were available to complete the calculations in 19
economies: those included, among others, Canada, Indonesia, Japan, and Singapore.
sample the best performer, China, has seen its bottom 50% increase average
incomes at over 7% per annum. This, the highest long-run mobility seen in the
data, means that the poor in China have average incomes doubling every decade.
At the same time, China's inequality is comparatively high with sample median
29.4 thousand AC, and is growing at nearly 10% a year. Thus, China has high and
rising inequality at the same time that upward mobility is appreciable.
Moldova and Thailand have the next two highest long-run mobility, but lower
than China's by more than 1.5 percentage points per annum. Relative inequality
in both Moldova and Thailand are falling, but compared to China's, Thailand's
relative inequality is higher and Moldova's lower. For these top three upwardly
mobile societies, inequality and its dynamics show no obvious systematic pattern
relative to mobility.
In contrast, societies such as Saudi Arabia, Qatar, the US, and the Nether-
lands have seen long-run immiserisation of their poor, with the UAE, Yemen,
and Oman the worst performers in long-run mobility in the sample. At current
20 N.A. N.A.
trends, Yemen has its poor halving their average incomes every fourteen years.
Again, however, no obvious pattern is manifest in inequality and its dynamics:
relative inequality in the Netherlands is low but in Saudi Arabia, Qatar, the UAE,
and Oman, relative inequality is high. Inequality is falling in Saudi Arabia, the
UAE, Yemen, and Oman, but rising in Qatar, the US, and the Netherlands.
Relative inequality is increasing in Oman, the Netherlands, and the US, but un-
changing in Saudi Arabia and Yemen. For downwardly mobile societies as well
then, inequality and its dynamics show no obvious systematic pattern relative to
mobility.
An important and powerful message emerges from Table 2 despite there being
no strong relation between mobility and inequality. In the sample the varied
upward mobilities lead to large di�erences in the well-being of the poor in societies
across the world. The gap between long-run mobility of -0.5% (USA) and 7%
(China) is responsible for the stark di�erence between the bottom 50%'s economic
outcomes in the US and China, i.e., Figures 1{2 of the earlier Section II.
The entire cross-section of societies, to which we now turn, will con�rm the
lack of systematic relation between mobility on the one hand and inequality and
its dynamics on the other. Only at extreme levels of inequality or its trends
will there appear to be a more pronounced relation with mobility. However,
observations are also sparse at extremes. In the middle range where most of the
data cluster, there is considerable variation and thus signi�cant ambiguity in the
relation between mobility and inequality and its dynamics.
Figure 5 displays the complete sample of underlying statistics, parts of which
were explicitly given in Table 2. The three dimensions in each of the panels in
the Figure corresponds to the variables long-run mobility m, inequality Q�; q�,
and long-run change in inequality Qg; qg.
Figure 5 shows that societies with very high inequality are few in the sample,
but are so extreme they can distort regression and other averaging analyses. Most
of the world, instead, clusters towards the wall de�ned by Trends in Inequality or
in Relative Inequality: this is particularly evident in the left (Inequality) panel
but also in the right (Relative Inequality). Figure 6 focuses on this e�ect by
projecting the 3-dimensional Figure 5 vertically downwards onto the oor.
Figure 6 shows that when societies experience high inequality they invariably
also show immiserisation: the poor become poorer, or at best remain stagnant
in their average incomes. These extreme observations distort the best-�tting
linear relation across the sample to be negatively sloped. In contrast, the clusters
of low and even moderately high inequality|the left sides of either the left or
right panels|show instead a wide range of mobility behaviours. For instance,
in the right panel, societies with relative inequality between 10 and 20 range in

VOL. N.A. NO. N.A. MOBILITY AND POLITICAL UPHEAVAL 21
Figure 5. Mobility with (left panel) Inequality Dynamics and (right panel) Relative Inequality
Dynamics. Societies with very high inequality are few in the sample, but are so extreme they
can distort regression and other averaging analyses. Most of the world, instead, clusters
towards the wall defined by Trends in Inequality or in Relative Inequality: this is particu-
larly evident in the left (Inequality) panel but also in the right (Relative Inequality).
mobility from over 7% to nearly -5%, with no systematic slope in the relation
between mobility and relative inequality. Across the range of low and moderately
high inequality, marginally more societies show upward mobility than downward
mobility. Still, however, of the six cases where mobility m fell below -2.0% p.a.,
four had relative inequality q less than 20, with one of those experiencing relative
inequality at only 4.9.
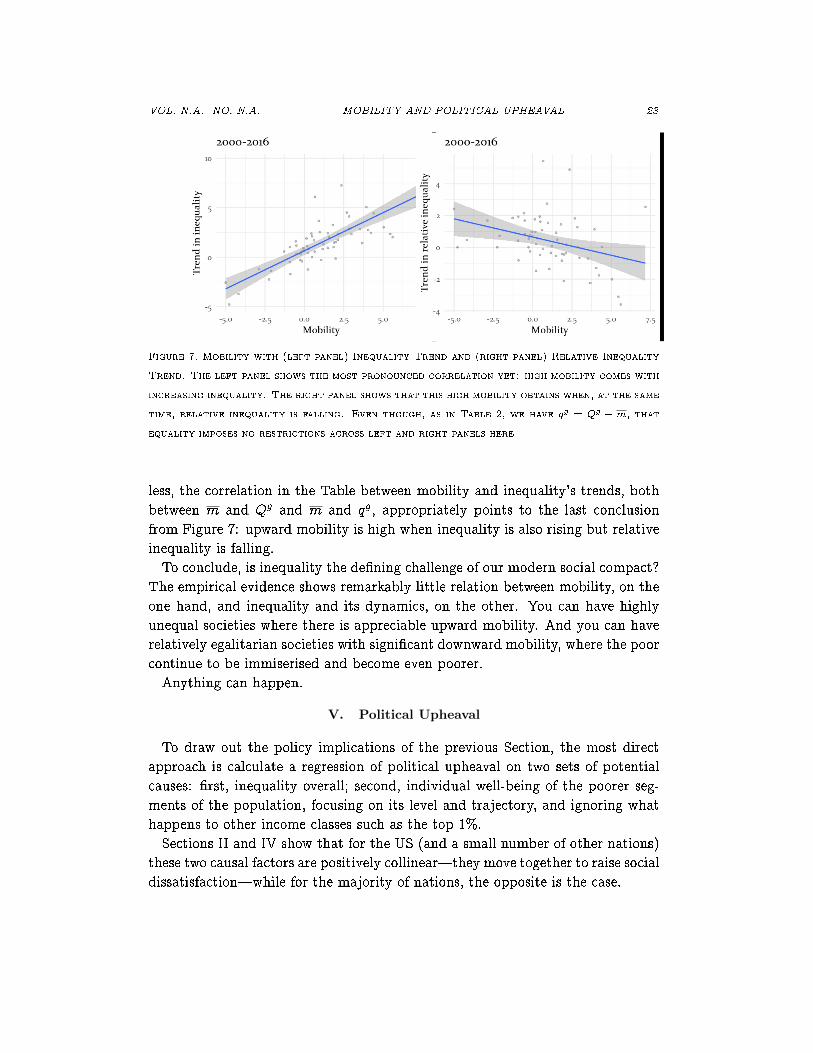
To complete the discussion of Figure 5 consider the Figure's projection, from
the right, onto the wall de�ned by inequality trends.7 Figure 7 in its left panel
shows the most pronounced correlation yet: high mobility comes with increasing
inequality. The right panel shows that this high mobility obtains when, at the
same time, relative inequality is falling. Even though, as in Table 2, qg = Qg�m,
that equality imposes no restrictions across left and right panels here.
Table 3 eshes out further insight on Figure 7. Of the 47 economies that
have experienced a rise in inequality since 2000, 38 (i.e., 81%) have seen upward
mobility. Nine economies have experienced both downward mobility and a rise
in inequality: notable among them are the US and the Netherlands. France
7In this text I don't analyse the �nal projection, that from the front of Figure 5, integrating out themobility m axis. Although the location variable is the median rather than an initial value, there is stilla Galton's Fallacy kind of e�ect here (Quah, 1993). For completeness the Technical Appendix displaysthis �nal projection as Figure 9, and indeed the characteristic Galton's Fallacy negative regression linedoes manifest.

22 N.A. N.A.
Figure 6. Mobility with (left panel) Inequality and (right panel) Relative Inequality. When
societies experience high inequality they also show immiserisation: the poor become poorer,
or at best remain stagnant in their average incomes. These extreme observations distort
the best-fitting linear relation across the sample to be negatively sloped. In contrast, the
clusters of low and even moderately high inequalty|the left sides of either the left or
right panels|show instead a wide range of mobility behaviours. For instance, in the right
panel, societies with relative inequality between 10 and 20 range in mobility from over 7% to
nearly -5%, with no systematic slope in the relation between mobility and relative inequality.
Across the range of low and moderately high inequality, marginally more societies show
upward mobility than downward mobility.
has experienced insigni�cant change in inequality and at the same time upward
mobility. Yet, France is also a society where political upheaval has been notable.
Section V will return to this.
Table 3 shows 19 societies experienced downward mobility. Among them the US
is the largest and most populous.8 Quah (2019) explores further this American
exceptionalism, and compares it with mobility and growth experiences elsewhere
in the world.
Finally, Table 4 shows the correlation across mobility and inequality. The dis-
cussion of Figures 5{7 has highlighted how summary measures in correlations,
averages, or regression lines will hide some of the most important features of
the data. Indeed, the negative correlation between mobility and inequality, both
between m and Q� and between m and q� that appears in the Table has been
revealed to be the result of only the extreme inequality observations. Nonethe-
8The others are Cyprus, Finland, Jordan, Lebanon, the Netherlands, Palestine, Qatar, Switzerland(all with rising inequality); and Bahrain, Greece, Italy, Luxembourg, Oman, Portugal, Saudi Arabia,Syria, the UAE, and Yemen (falling inequality).
VOL. N.A. NO. N.A. MOBILITY AND POLITICAL UPHEAVAL 23
Figure 7. Mobility with (left panel) Inequality Trend and (right panel) Relative Inequality
Trend. The left panel shows the most pronounced correlation yet: high mobility comes with
increasing inequality. The right panel shows that this high mobility obtains when, at the same
time, relative inequality is falling. Even though, as in Table 2, we have qg = Qg �m, that
equality imposes no restrictions across left and right panels here.
less, the correlation in the Table between mobility and inequality's trends, both
between m and Qg and m and qg, appropriately points to the last conclusion
from Figure 7: upward mobility is high when inequality is also rising but relative
inequality is falling.
To conclude, is inequality the de�ning challenge of our modern social compact?
The empirical evidence shows remarkably little relation between mobility, on the
one hand, and inequality and its dynamics, on the other. You can have highly
unequal societies where there is appreciable upward mobility. And you can have
relatively egalitarian societies with signi�cant downward mobility, where the poor
continue to be immiserised and become even poorer.
Anything can happen.
V. Political Upheaval
To draw out the policy implications of the previous Section, the most direct
approach is calculate a regression of political upheaval on two sets of potential
causes: �rst, inequality overall; second, individual well-being of the poorer seg-
ments of the population, focusing on its level and trajectory, and ignoring what
happens to other income classes such as the top 1%.
Sections II and IV show that for the US (and a small number of other nations)
these two causal factors are positively collinear|they move together to raise social
dissatisfaction|while for the majority of nations, the opposite is the case.

24 N.A. N.A.
m
� +
Qg � 10 3
+ 9 38
1) (+;�) USA 1:2%, �0:5%; Netherlands 1:6%, �0:5%; Cyprus; Finland; Jor-
dan; Lebanon; Palestine; Qatar; Switzerland.
2) (+;+) China 9.7%, 7.2%; France 0:0%, 0:5% (noting Mouvement des Gilets
Jaunes); UK 0.8%, 1.2%; Albania; Austria; Belgium; Bosnia-Herzegovina;
Brazil; Croatia; Czech Republic; Denmark; Egypt; Estonia; Germany; Hun-
gary; Iceland; India; Iraq; Ireland; Kosovo; Latvia; Lithuania; Macedonia;
Malta; Moldova; Montenegro; Norway; Poland; Romania; Russia; Serbia;
Slovakia; Slovenia; Spain; Sweden; Thailand; Turkey.
3) (�;�) Bahrain; Greece; Italy; Luxembourg �1:4%, �2:1%; Oman; Portu-
gal; Saudi Arabia; Syrian Arab Republic; United Arab Emirates; Yemen.
4) (�;+) Cote d'Ivoire; Iran; Kuwait.
Table 3|Inequality and Mobility
Mass protests worlwide rose dramatically the year of the Arab Spring, and
stayed high through at least the decade after (Fig. 8). Following what Nolan
(2019) refers to as the emerging grand narrative surrounding the discussion of
Section III, many observers are led to the hypothesis that this is, indeed, evidence
on inequality's pernicious impacts.
Published empirical evidence on inequality and populism is considerable. This
Section will argue that that evidence, in summary, shows little correlation much
less causality between the two variables. The empirical �ndings of Section IV cor-
roborate this in how inequality alone provides little information on what happens
to mobility and low incomes, those measures that should matter to people.
The term populism in its modern form carries two distinctive features (Nolan
and Valenzuela, 2019; Rodrik, 2018): First, generally, populism speaks for ordi-
nary people against elites. Second, in the current world environment, populism
opposes globalisation and liberal economic practice, because it identi�es those
environments to bene�t those already well o�. Populism opposes the established
system because it assumes that system|whatever its granular details|must ad-
vantage those already privileged. Populism comes with decline in the perceived

VOL. N.A. NO. N.A. MOBILITY AND POLITICAL UPHEAVAL 25
m Q� Qg
m -0.39 0.77
Q� -0.38
Qg
m q� qg
m -0.30 -0.34
q� -0.12
qg
Table 4|Correlation matrix: (left) Mobility and Inequality; (right) Mobility and Relative
Inequality.
legitimacy of the system, and, in democracies, with voters ocking to extremist
parties.
Associated with populism, therefore, is the idea that trust is eroded in estab-
lished social and political institutions. Trust has indeed sharply declined in the
US (Gould and Hijzen, 2016). However, trust displays no clear trend in Europe
(Gould and Hijzen, 2016; Sarracino and Mikucka, 2016). Critically, while the
US fall in trust can be explained by the inequality across the bottom 50% of
earnings, neither overall inequality nor inequality at the top of the distribution
carries consistent explanatory power (Gould and Hijzen, 2016).
Outside of developed nations, unfortunately, little systematic evidence is avail-
able on trust.
In democracies, the evidence for inequality driving populism turns out to be
weak. Inglehart and Norris (2016) �nd that to explain voters moving towards
extremist parties, variables measuring cultural attitudes matter more than do
economic variables. In Austria and France, inequality has been stable; in Poland
income growth has been strong. Yet in these three nations, populist support has
risen for extremist political parties, equally as it has in countries where instead
inequality has risen and median incomes have stagnated.
Witte, Burger and Ianchovichina (2020) �nd that mass protests and strikes
around the world are explained by aggregate recessions and growth slowdowns,
worsening living conditions, and deteriorating expectations of \a purposeful and
meaningful life". In that sample, therefore, for understanding political upheaval,
it is not inequality that matters, but instead the economic situation of the indi-
vidual.
Section IV has shown that the majority of national experiences have individual
and inequality indicators shifting in a way opposite to that suggested in the
standard \grand narrative". Put together with the Witte et al. (2020) �nding and
the others described in this Section, this paper therefore suggests that excessive
policy focus on repairing just inequality can be socially unproductive.
The GDELT Project Leetaru (2019) provides \a realtime open data global
graph over human society as seen through the eyes of the world's news media".

26 N.A. N.A.
Figure 8. Source: Witte, Burger and Ianchovichina (2020). Strikes and demonstrations, and
armed conflicts, 1995{2015
Using its
[: : : ]
VI. Conclusion
This paper has described two key empirical regularities. First, inequality is, in
the majority of cases, a misleading indicator for the income paths of those at the
bottom of the income distribution. Second, political upheaval responds more to
individual circumstances (individual well-being, expectations of mobility) than
to whole-group indicators (inequality).
Neither high levels of nor increases in inequality equate to immiserisation of
the poor and lower middle class (Table 2 and Figs. 5{7). Indeed, on average up-
ward mobility is highest when inequality is rising (and relative inequality falling;
Fig. 7). Empirical evidence shows otherwise remarkably little relation between
VOL. N.A. NO. N.A. MOBILITY AND POLITICAL UPHEAVAL 27
upward or downward mobility, on the one hand, and inequality and its dynamics,
on the other. You can have highly unequal societies where there is appreciable
upward mobility. And you can have highly unequal societies with signi�cant
downward mobility, where the poor continue to be immiserised and become even
poorer.
The correlation is strongly negative with mobility only when inequality is par-
ticularly high: the situation is then aggravated over time with the already-poor
in society experiencing continued immiserisation. Because of their extreme na-
ture, however, these exceptional cases can be over-weighted in the analysis of
cross-national experiences.
By providing an explicit account of what happens at the bottom 50% of income
distributions this paper has expanded analysis beyond just inequality. For people
to lead enabled, meaningful, and satisfying lives, what matters is what income
they have, not how that income compares to those of others around them. For
those who seek to improve their prospects for the future, the opportunities and
resources they can use to control their lives derive from how much income they
have|not whether they are ranked top 25% or bottom 15% in the income dis-
tribution, nor how much disparity there is between them and the top 1% of the
income distribution.
The majority of nations that have seen a rise in inequality since 2000 have the
poorer half of their population nonetheless raise incomes over time. While such
an outcome is the majority experience, the outcome is not universal: the US is a
signi�cant instance where indeed the poor have indeed gotten poorer.
Because the US is so central in the international system, there is the risk that its
domestic political challenges end up determining the global policy agenda. Public
policy challenges that are appropriately addressed at the level of the individual
nation can, if thought to be universal, inappropriately displace important global
challenges that genuinely deserve the attention of the international community.
This paper has argued that while there is an emerging grand narrative that
draws insight from the US experience to suggest a signi�cant weight on inequality
as signal for the well-being of society, that generalisation is inappropriate. This is
so for two reasons: First, in the historical reality, outside of the US, inequality is
typically uninformative for the well-being of citizens and for subjective assessment
of the life chances ahead for the young. Second, recent research suggests that in
the cross-section of nations [either outside the US altogether or otherwise in global
cross-sections for which the US is but a single entry], either cultural factors or
individual circumstances are the causes of populism and protest.
Public policy, therefore, needs to take into account the possibility of disin-
formation or perhaps just inequality illiteracy overwhelming rigorous empirical

28 N.A. N.A.
evidence. This is especially important in such policy domains where political and
populist rhetoric can inappropriately dominate national conversation.
VII. Technical Appendix
This Section presents a number of technical ideas relevant but not central to
the discussion in the text. It also provides additional related �ndings, again not
central to the text, but useful to have as con�rmatory checks.
A. Inequality Measurement
The paper settles on Q = yT10 � yB50, the income distance between rich and
poor, as the measure of inequality to analyse. Any selection is, to a degree,
arbitrary but in an empirical study some choice is needed and here, as the text
explains, a straightforward reason justi�es this choice.
The measure Q is immediately understood by anyone in that income distribu-
tion. It is simply how much richer, in currency units, the rich are than the poor.
If someone understands their own income in that currency unit, they have to
understand immediately Q. In other words, Q is translatable within the system
itself. So too, q = Q=yB50, the second inequality measure the paper uses, that
simply rescales inequality to be measured in units not of currency but of multiples
of the average income of the poor.
In contrast, other measures of income inequality, even when axiomatically justi-
�ed by yet other properties, don't always bear this translatability characteristic.
The Gini coe�cient, for instance, is scale-invariant but arguably has no direct
meaning to any representative agent living in that income distribution. That
agent will certainly know that the Gini coe�cient takes the value 1 when all
income is equally divided and the value 0 when instead one agent has all the
income, but is more likely concerned about what income exactly she gets under
Gini equals 1, and is more likely worried that she has no income under Gini equals
0 than she would be about the fact that the Gini coe�cient is zero. The inter-
quartile range, the standard deviation of the logarithm of income or of income
levels, the median-mean ratio, and yet others are even more di�cult to translate
to a meaning for the representative agent in the income distribution.
B. Concepts of Mobility
The paper discusses mobility only through its empirical �ndings for income
mobility, de�ned in Section IV as the change in yB50. Social mobility or intra-
distribution mobility appears as a concept in Fig. 4, but then only to suggest
that this research should focus on income mobility instead.
VOL. N.A. NO. N.A. MOBILITY AND POLITICAL UPHEAVAL 29
Informal analysis and gut instinct might suggest to readers yet other ways to
conceptualise and measure some notion of mobility. This section analyses how
the paper's reliance on yB50's dynamics is informative, and how, conversely, it
might not be. I introduce here some labels because they make the analysis more
compact. These labels arise in informal discussions I have had with many other
social scientists or policy-makers, but are not always technical terms that have
been used elsewhere in academic writings.
Section IV de�nes income mobility as the change over time in yB50, the
average income of the bottom 50%. This concept of mobility does not seek to
track individual incomes. Indeed, the people in the bottom 50% at the end
of the sample are likely not the same individuals as those in the bottom 50%
at the beginning of the sample. Thus, this de�nition is not concerned with
speci�c individuals and makes no claim to individual income dynamics. However,
what it does do is transparently and directly address the question, What is the
state of the poor? Have the economic circumstances of the poor improved or
worsened? Additional insight might come from re-doing the calculations for not
the bottom 50% but instead the bottom 40% or 30% or even 10%. My limited
experimentation shows no dramatic change in conclusion in those cases where
this further re�nement is possible. In the bulk of the World Inequality Database
(2019) data, however, such narrowing is not possible.
In Fig. 4 the paper describes social mobility or intra-distribution mobility.
The picture can be rewritten as follows: Rank-order at time t everyone in society
from the richest (no. 1) on down to the poorest (no. N). There is social mobility
when there is some person n at time t such that at a later time t0 > t that person
is now at a rank n0 that is better, i.e., n0 < n. Person n has overtaken others and
risen to a position higher in society. The requirement can even be made stricter,
i.e., it's not that there is just one such n, but perhaps 10% of the population for
which this is true. What Fig. 4 shows, however, is that for any such n+ that
has moved higher in society, there is necessarily always an n� that shows the
opposite change, i.e., who has moved lower in society. Social mobility is seen
to be bene�cial in the eyes of those who have moved to a better place in the
rankings, but is simultaneously seen to be disadvantageous by yet others. What
Fig. 4 shows is that those for whom social mobility is bene�cial are exactly equal
in number to those for whom it is disadvantageous.
Closely related to social mobility is a concept that relaxes the requirement of
overtaking. This gives rise to a concept of relative mobility where individual
n increases her income relative to others in society, even without her necessarily
having overtaken anyone. However, the same switched-perspective objection can
be raised as well to this. If n is better o� because her income relative to others

30 N.A. N.A.
in society is now higher, then others in society must be worse o� because their
income relative to n is now lower. Policy that subscribes to either social mobility
or relative mobility is policy that validates worsening the well-being of some in
society, at the same time that it seeks to improve the well-being of yet others.
However, in the previous example we could say n is better o� simply because
her income is now higher|regardless of her income relative to others. This has
led some observers to say that what matters for mobility is this, i.e., absolute
mobility, in contrast to the earlier relative mobility. But then absolute mobil-
ity is nothing more or less than just growth in income. The word mobility is
unnecessary in such a description because what matters is just growth of that
individual's income.
The comprehensive taxonomy on \social mobility" given in World Economic
Forum (2020, p. 9) combines elements of the categories above. The process of
moving between socio-economic classes or up and down the socio-economic ladder
appears in a couple of the categories (\intragenerational mobility", \intergener-
ational mobility"). But the others|\absolute income mobility", absolute edu-
cational mobility", \relative income mobility", \relative educational mobility"|
speak only of earnings going higher or lower, either over time or in comparison
with one's parents: no recognition is made of comparing oneself to others in soci-
ety. In the categories of intragenerational mobility and intergenerational mobility,
the idea is that it is possible for everyone to move up in socio-economic class.
But if so then that is, again, just economic growth, called by another name. In
the last four categories, comparing whether one does better than one's parents
is a matter only of growth in income, over time or generation. There is nothing
related speci�cally to mobility in these categories named. What World Economic
Forum (2020) refers to as di�erent variants of mobility comes logically with just
economic growth, and nothing more.
The important studies on intergenerational mobility by Raj Chetty and a range
of co-authors (Chetty et al., 2014b,a, 2017) introduced a profoundly new data-
source for understanding income dynamics across generations. Additionally, parts
of that work sought to place intergenerational income dynamics in the context of
geography, education, and a range of other potential causal covariates. Thus that
work goes well beyond the more macroeconomic analysis in the current paper.
On the underlying conceptual structure, however, my description above can be
applied directly to intergenerational analyses provided one relabels observation
units from individuals or groups to families (or dynasties), and switches time
from calendar years to generational sequence (�rst generation, second generation,
and so on). However, past the second generation, identi�cation of a predecessor|
grandparents, great grandparents, and so on|becomes trickier, as multiple sets
VOL. N.A. NO. N.A. MOBILITY AND POLITICAL UPHEAVAL 31
of predecessors get involved, that in turn might be interlinked across di�erent
o�spring observations. Ignoring those complications, however, the important
additional concepts of intergenerational mobility can be related to that used here.
Intergenerational income mobility (Chetty et al., 2014b, p. 141) is an o�-
spring's probability of transitioning in the income distribution relative to the
parents' position. This is measured in three di�erent ways: the correlation be-
tween successive generations' ranks; correlation between attending university and
parents' income rank; and the transition probability of reaching the top quintile
of the income distribution when the parents are located in the bottom quntile.
The �rst and third of these involve ranks, and so are subject to the zero-sum
property of what this paper calls social mobility. The study �nds that mobility,
using these three measures, has not changed comparing labour market entrants
in the 2010s to those in the 1970s.
Absolute upward mobility (Chetty et al., 2014a, p. 1556) is the mean in-
come rank of those whose parents were located in the bottom half of the income
distribution. The focus on the bottom half of the income distribution is a feature
in common with the measure m used in the current paper. However, focusing
on the mean income rank of the o�spring means the concept shares the zero-sum
property of social mobility as de�ned in this paper. (So too the measures of
relative mobility and absolute mobility considered in that work.)
Finally, absolute income mobility (Chetty et al., 2017, p. 398) is the per-
centage who earn more than their parents. That work shows \absolute mobility
has fallen from 90% for o�spring born in 1940 compared to 50% for children born
in the 1980s". This is a striking �nding. However, as a concept more generally,
absolute income mobility relies on a binary feature in its de�nition that generates
a peculiar ordering for assessing social improvement. Suppose there are 100 peo-
ple in society and consider two di�erent situations. In the �rst the increase in the
economie pie compared to the parents' generation is 750 and three quarters of the
o�springs equally earns that increment, so 75 people have received an improve-
ment of 10 over their parents, while the remaining 25 receive zero improvement.
Absolute income mobility here is 75%. Now consider a second situation where
the total increase is only 100, but here every o�spring gets an increment of 1.
Absolute income mobility is now 100%. What is the sense that there has been an
improvement in social well-being when absolute income mobility increases from
75% to 100% across the two situations?
C. Auxiliary Empirical Findings
Finally, for completeness, this section presents the projection of footnote IV.
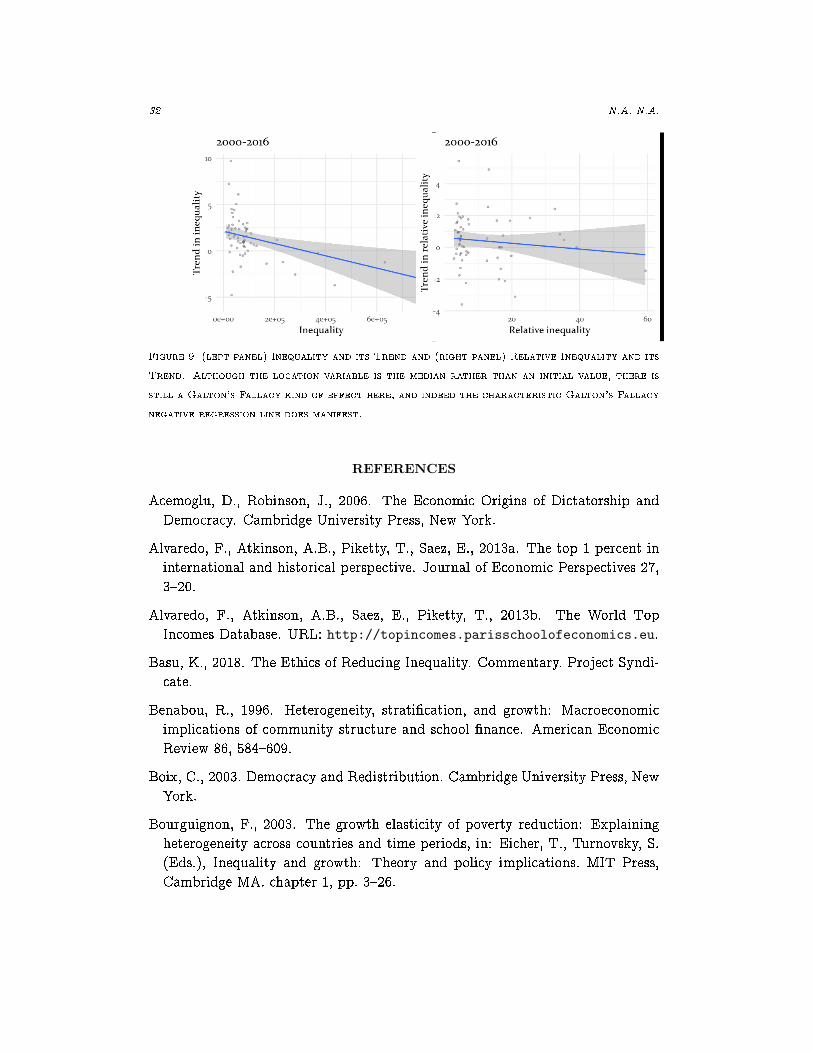
32 N.A. N.A.
Figure 9. (left panel) Inequality and its Trend and (right panel) Relative Inequality and its
Trend. Although the location variable is the median rather than an initial value, there is
still a Galton's Fallacy kind of effect here, and indeed the characteristic Galton's Fallacy
negative regression line does manifest.
REFERENCES
Acemoglu, D., Robinson, J., 2006. The Economic Origins of Dictatorship and
Democracy. Cambridge University Press, New York.
Alvaredo, F., Atkinson, A.B., Piketty, T., Saez, E., 2013a. The top 1 percent in
international and historical perspective. Journal of Economic Perspectives 27,
3{20.
Alvaredo, F., Atkinson, A.B., Saez, E., Piketty, T., 2013b. The World Top
Incomes Database. URL: http://topincomes.parisschoolofeconomics.eu.
Basu, K., 2018. The Ethics of Reducing Inequality. Commentary. Project Syndi-
cate.
Benabou, R., 1996. Heterogeneity, strati�cation, and growth: Macroeconomic
implications of community structure and school �nance. American Economic
Review 86, 584{609.
Boix, C., 2003. Democracy and Redistribution. Cambridge University Press, New
York.
Bourguignon, F., 2003. The growth elasticity of poverty reduction: Explaining
heterogeneity across countries and time periods, in: Eicher, T., Turnovsky, S.
(Eds.), Inequality and growth: Theory and policy implications. MIT Press,
Cambridge MA. chapter 1, pp. 3{26.

VOL. N.A. NO. N.A. MOBILITY AND POLITICAL UPHEAVAL 33
Chetty, R., Grusky, D., Hell, M., Hendren, N., Manduca, R., Narang, J., 2017.
The fading American dream: Trends in absolute income mobility since 1940.
Science 356, 398{406.
Chetty, R., Hendren, N., Kline, P., Saez, E., 2014a. Where is the land of op-
portunity? The geography of intergenerational mobility in the United States.
Quarterly Journal of Economics 129, 1553{1624. doi:10.1093/qje/qju022.
Chetty, R., Hendren, N., Kline, P., Saez, E., Turner, N., 2014b. Is the United
States still a land of opportunity? Recent trends in intergenerational mobility.
American Economic Review 104, 141{147. doi:10.1257/aer.104.5.141.
Dollar, D., Kraay, A., 2002. Growth is good for the poor. Journal of Economic
Growth 7, 195{225. doi:10.1023/A:1020139631000.
Eriksson, K., Simpson, B., 2012. What do Americans know about inequality? it
depends on how you ask them. Judgement and Decision Making 7, 741{745.
Foster, D., 2018. Interview: Kate Pickett and Richard Wilkinson `Inequality
Strikes at Our Health and Happiness'. Newspaper. The Guardian (18 Sep).
London.
Galor, O., Zeira, J., 1993. Income distribution and Macroeconomics. Review of
Economic Studies 60, 35{52.
Geweke, J., Marshall, R.C., Zarkin, G.A., 1986. Mobility indices in continuous
time Markov chains. Econometrica 54, 1407{1423.
Gould, E.D., Hijzen, A., 2016. Growing Apart, Losing Trust? The Impact of
Inequality on Social Capital. IMF Working Paper. IMF. Washington DC.
Haggard, S., Kaufman, R.R., 2012. Inequality and regime change: Democratic
transitions and the stability of democratic rule. American Political Science
Review 106, 495{516. doi:10.1017/S0003055412000287.
Hirschman, A.O., Rothschild, M., 1973. The changing tolerance for income in-
equality in the course of economic development. Quarterly Journal of Eco-
nomics 87, 544{566.
Hout, M., 2015. A summary of what we know about social mobility. The Annals
of the American Academy of Political and Social Science 657, 27{36.
Inglehart, R.F., Norris, P., 2016. Trump, Brexit, and the Rise of Populism:
Economic Have-Nots and Cultural Backlash. Faculty Research Working Paper
Series. Harvard Kennedy School. Cambridge MA.

34 N.A. N.A.
Leetaru, K., 2019. The GDELT Project: The Global Database of Events, Lan-
guage, and Tone. URL: https://www.gdeltproject.org/.
Milanovic, B., 2005. Worlds Apart: Measuring International and Global Inequal-
ity. Princeton University Press, Princeton.
Milanovic, B., 2016. Global Inequality: A New Approach for the Age of Global-
ization. Harvard University Press, Cambridge MA.
Nolan, B. (Ed.), 2018. Generating Prosperity for Working Fam-
ilies in A�uent Countries. Oxford University Press, Oxford.
doi:10.1093/oso/9780198807056.001.0001.
Nolan, B., 2019. Why we can't just blame rising inequality for the growth of
populism around the world. The Conversation .
Nolan, B., Valenzuela, L., 2019. Inequality and its discontents. Oxford Review
of Economic Policy 35, 396{430. doi:10.1093/oxrep/grz016.
Norton, M.I., Ariely, D., 2011. Building a better America | one wealth quintile
at a time. Perspectives on Psychological Science 1, 9{12.
Persson, T., Tabellini, G., 1994. Is inequality harmful for growth? American
Economic Review 84, 600{621.
Piketty, T., 2014. Capital in the Twenty-First Century. Harvard University Press,
Cambridge MA.
Piketty, T., Saez, E., 2003. Income inequality in the United States, 1913-1998.
Quarterly Journal of Economics 118, 1{38.
Quah, D., 1993. Galton's fallacy and tests of the convergence hypothesis. Scan-
dinavian Journal of Economics 95, 427{443.
Quah, D., 2003. One third of the world's growth and inequality, in: Eicher,
T., Turnovsky, S.J. (Eds.), Inequality and Growth. MIT Press, Cambridge.
chapter 2, pp. 27{58. doi:10.7551/mitpress/3750.003.0005.
Quah, D., 2019. The US is, Indeed, the Exceptional Nation: Income Dynamics
in the Bottom 50%. Working Paper. Lee Kuan Yew School of Public Policy,
NUS. Singapore. doi:10.13140/RG.2.2.23376.97289.
Rajan, R., 2010. Fault Lines: How Hidden Fractures Still Threaten the World
Economy. Princeton University Press, Princeton.

VOL. N.A. NO. N.A. MOBILITY AND POLITICAL UPHEAVAL 35
Rodrik, D., 2018. Populism and the economics of globalization. Journal of Inter-
national Business Policy 1, 12{33. doi:10.1057/s42214-018-0001-4.
Sarracino, F., Mikucka, M., 2016. Social capital in Europe from 1990 to 2012:
Trends and convergence. Social Indicators Research , 1{26.
Singer, B., Spilerman, S., 1976. The representation of social processes by Markov
models. American Journal of Sociology 82, 1{54. doi:10.1086/226269.
Starmans, C., Sheskin, M., Bloom, P., 2017. Why people prefer unequal societies.
Nature Human Behaviour 1, 1{7.
UNDP, 2019. Human Development Report 2019: Beyond Income, Beyond Aver-
ages, Beyond Today. Inequalities in Human Development in the 21st Century.
United Nations Development Programme, New York City.
Whyte, M.K., 2016. China's dormant and active social volcanoes. The China
Journal 75, 9{37.
Wilkinson, R.G., Pickett, K., 2018. The Inner Level. Penguin, London.
Witte, C., Burger, M., Ianchovichina, E., 2020. Subjective well-being and peaceful
uprisings. Kyklos 73, 120{158. doi:10.1111/kykl.12219.
World Economic Forum, 2020. The Global Social Mobility Index 2020: Why
Economies Bene�t from Fixing Inequality. Insight Report. World Economic
Forum. Davos.
World Economic Forum Global Agenda Councils, 2015. Outlook on the Global
Agenda 2015. World Economic Forum, Geneva.
World Inequality Database, 2019. The World Inequality Database. URL:
http://wid.world.