Embed Size (px)
Citation preview
Mobile POS: It’s REAL Now
August, 2016
Analysts: Lee Holman
Greg Buzek

Introduction
© Copyright 2016 IHL Group. All rights reserved.
MOBILE POS: IT’S REAL NOW
2
Mobile technology in retail, more particularly Mobile POS, has been the source of a tremendous amount of buzz sincecoming on the scene a handful of years ago. When it first came on the scene, there was a great deal of talk about howMobile POS would replace traditional POS. Since then, however, reality has set in and retailers are moving forward, albeitmore slowly than originally anticipated.
All that said, mobility has been transforming how retailers and hospitality providers interact with customers. The seminalmoment was the release of the iPad. And it was not so much the device, but the price point of $499 that opened the doorfor retailers to begin looking at mobile devices for associates and potentially as a replacement for POS. This is true in spiteof the fact that the device is neither retail-hardened nor enterprise-friendly.
For most retailers, deploying mobile at the store level involves four stages.
o Stage 1 –Retailers simply get their store managers to use mobile devices instead of backoffice PCs, thus freeingthem to spend more time on the sales floor. Studies show an undisputed link between the success of a store and thenumber of hours a manager is on the floor versus being in the back office. Devices used here are typically tablets,though consumer handhelds are sometimes used.
o Stage 2 – The use of mobile devices is extended to sales associates for use in their interactions with consumers,essentially leveling the playing field on knowledge and information access where consumers have had an advantagedue their smart phones. Tablets and consumer handhelds are used.
o Stage 3 – This is where retailers face the most difficulty and challenge; it’s where the mobile device is used toperform a checkout transaction. Tablets, consumer handhelds, and retail-hardened handhelds are the technologiesused.
o Stage 4 – At this stage, the customer is enabled to use their own device, typically a consumer handheld, to performthe checkout transaction while in the store.
4 Stages of Mobile
© Copyright 2016 IHL Group. All rights reserved.
MOBILE POS: IT’S REAL NOW
3
At Stages 1 and 2 (mobile for managers and associates), the market is additive related to POS in that new mobile devicesare coming into the store, but there is no impact on the number of traditional POS devices.
Stage 3 (Mobile POS) is the game changer for POS and in certain segments has become a major disrupter to overall POSshipments going forward. In general, however, mobile POS is best used where transaction speed is not as critical asmobility and customer engagement at the transaction.
Stage 4 (leveraging the customer device) may have an effect on total number of POS devices, but not for several years.This makes the most sense in transaction environments where customers bring their own bags.
The use of one or more of these stages is entirely dependent upon the retailer’s individual desire for the technology andtheir willingness to transform the manner in which they interact with the customer. The aforementioned slower adoption ofStage 3 is due in part to a variety of reasons, including:
o EMV solutions for mobile are not ideal and are kludgy, so EMV installs are delaying mobile deployments.
o Retailers are working towards a unified commerce back end system to feed the Mobile POS, ecommerce, and POSplatforms. Most retailers have focused on this first as it is a core issue of growth and survival.
o Apple’s continued challenges to date in “enterprise-friendliness” have also caused delays, though IBM’s relationshipwith Apple may help this in the future.
o Mobile POS requires new layouts of security cameras, payment islands, etc.. Those remodels are costly.
In this report, we provide worldwide and North American shipments and installed base for each of the handheld categoriesoutlined for Stage 3 for North America. We also forecast the shipments and installed base for these devices through 2020.
Retailers can utilize the data to measure their own plans against what we are anticipating, as well as what competingretailers are considering. Vendors, for their part, will be able to utilize the data in as a tool to gauge the most likely areas ofinvestment by retailers and how to refine their strategies

CONTENTS
Introduction:MPOS – It’s REAL Now
4 Stages of MobileStage 3 – Mobile POS
Background:Technology Development
Trends, Drivers and Barriers:What Is Driving, Hindering Growth?
Market Size Per Year:Shipments And Forecasts By Region
2
3
8
20
24
Market Size – Installed Base:Installed Units And Forecast By Region?
Key Vendors:Who Are The Top Mobile POS Players?
Retailer Purchase Intent:What Are The Retailers’ Plans for MPOS?
What We See Ahead:What’s Coming?
Methodology:How We Got Here
34
15
37
5
37
Background
Quick History Lesson
© Copyright 2016 IHL Group. All rights reserved.6
BACKGROUND
Quick History Lesson, con’t
© Copyright 2016 IHL Group. All rights reserved.7
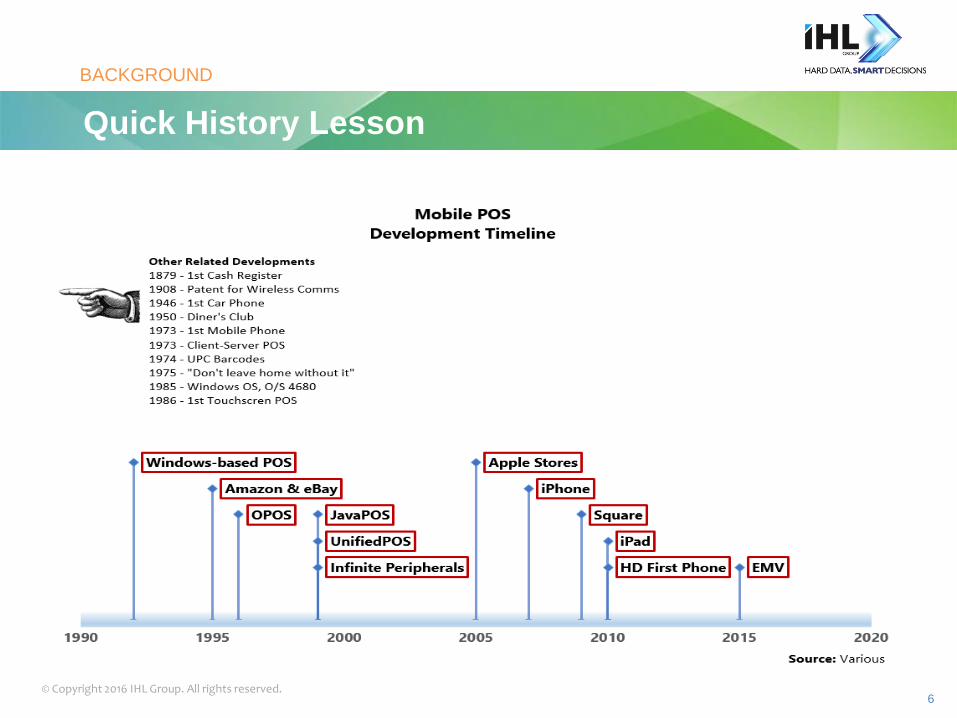
Mobile POS, the technology that we address in this study, is actually a combination several technologies that include point-of-sale, wireless communications, IP networking, barcode scanning and handheld computing, among others. All of theseare fairly recent developments, though retailers have been applying various technologies to retail transactions forthousands of years.
The 1970’s and Prior – The most advanced piece of technology used in the early days was the abacus, which allowedshopkeepers to total up the sale to an individual customer. The cash register, along with the “cha-ching” sound, camealong in 1879, and allowed retailers to keep a running total of all sales in their individual stores. These devices were mostlymechanical in nature and ubiquitous on retail counters throughout the first half of the 20th century. They were graduallyreplaced by smaller electronic cash registers that began appearing in the 1950’s. Other technological and operationaladvancements were made during these times, including mobile communications, barcodes and credit cards.
1980’s – 1990’s – Personal computing made huge contributions to the advancement of retail technology during this time,as retailers began making the transition from stand-alone cash registers to networked POS systems. Retailers didn’t knowit yet, but the development of the Windows operating system during this time would lay the groundwork for it becoming themost widely-used OS in retail. The Internet also came along during this time, and along with it came a little companynamed Amazon, which changed the face of retail forever.
2000 and Since – Mobile devices (tablets, smart phones) have seen great development since the turn of the century, notjust in their capabilities but also in their adoption. The first devices started showing up around 2002, and Apple releasedthe iPhone in 2007 (11 subsequent models since then). Payment systems and the incorporation of WiFi in the stores bothsaw tremendous progress, though security remains a top concern. The Apple Store’s incorporation of Mobile POS in 2005is widely credited with being the source of all desire for Mobile POS. In an effort to help speed their customers through thecheckout line, Apple adopted Windows-based Pocket PC devices made by Symbol (Apple continued to use the Windows-based devices until they were replaced by iPod Touch devices in time for the 2009 Christmas shopping season). The buzzfor Mobile POS was huge, but the actual adoption was somewhat muted for a variety of reasons, not the least of whichwas the lack of a well-thought-out overall approach that incorporated not just the technical aspects of deployment, but alsothe operational aspects (how to deal with cash, receipt delivery, customer experience issues with front door security, etc).
BACKGROUND

Pricing – License Information
© Copyright 2015 IHL Group. All rights reserved.
BEACONS: PRIVACY, PROMISE, POTENTIAL
8
We offer three different types of licenses ranging from a single user license to a license
that allows for vendors to share the study as part of lead generation activities.
Type of License Price Comments
Single User $3,295 USD For use by a single user,
not to be shared in
company
Enterprise $3,995 USD Can be used for entire
company and presented
internally
For any questions regarding this policy, please contact us at 615-591-2955 or email us at [email protected]
© Copyright 2016 IHL Group. All rights reserved. 9
MethodologyHere’s how we did it
How We Got Here
© Copyright 2016 IHL Group. All rights reserved.10
This Mobile POS study combines the results of several IHL primary research studies that are directed at differentaudiences.
The annual Store Systems Study that we do with RIS News (The Brave New World of Unified Commerce) serves as asource of some of the data we use for this study. Simply, we ask hundreds of retailers about their spend plans andpreferences for a wide assortment of IT for the coming years. This data is aggregated by retail tier and by retail segment,and the overall report represents the very first retail IT study released each year, corresponding with NRF.
Our Mobile POS Hardware Vendor Market Share product also serves as a source for data for this study. This product isvery data intensive and can go as deep as shipments by segment by region by operating system or processor-type. Thedata is also available simply in aggregate by vendor worldwide or by individual region. Included are historical data back 2years and projections forward for the next 6 quarters by vendor.
Our Sophia Data Service also provides some of the foundation for this study. Sophia is by far the most comprehensivesource of not just validated leads, but key wisdom for smart decisions in the retail industry. In addition, we use ourWorldView product to get a handle on market sizing and forecasts.
Our hope is that vendors and retailers can utilize the data contained herein to track and regain lost revenues by fixingthese issues. . For more information on this study, please see our website or contact us at +1.615.591.2955.
METHODOLOGY

Single User License
© Copyright 2016 IHL Group. All rights reserved.
LICENSING
11
This IHL Study includes a Single Use License and is only intended for use by the purchaser. We ask
that this information not be shared with partners or others inside or outside the purchasing company
without authorization from IHL Group.
Practically, this implies the following:
1. The research reports and databases cannot be distributed in whole or in part to others in the organization,partners, or customers without express written approval from IHL Group.
3. You may quote components of the data (limited use) in presentations to others in the organization orcustomers such as specific charts. This is limited to percentage components, not individual unit information. Unitdata cannot be shared externally without express written approval from IHL Group. All references to the data inpresentations should include credit to IHL Group for the data.
4. The license holder can reference qualitative quotes in printed material with written approval from IHL Group.
5. All requests requiring written approval should be submitted to [email protected] and will be reviewedwithin one business day.
For any questions regarding this policy, please contact us at 615-591-2955 or email us at [email protected]
Enterprise License
© Copyright 2016 IHL Group. All rights reserved.
LICENSING
12
This IHL Study includes an electronic Enterprise License and can be shared freely within the purchasingorganization and wholly owned subsidiaries. We ask that this information not be shared with partners or othersoutside the purchasing company without authorization from IHL Group. The license does not extend to jointventures or other partnerships. If the relationship is not a wholly owned subsidiary, then both parties would needa license.
Practically, this implies the following:
1. The purchasing company can use the reports worldwide internally as long as the international organizationsare wholly owned subsidiaries of the purchasing company.
2. The research reports and databases cannot be distributed in whole or in part to others in the organization,partners, or customers without express written approval from IHL Group.
3. You may quote components of the data (limited use) in presentations to others in the organization orcustomers such as specific charts. This is limited to percentage components, not individual unit information. Unitdata cannot be shared externally without express written approval from IHL Group. All references to the data inpresentations should include credit to IHL Group for the data.
4. The license holder can reference qualitative quotes in printed material with written approval from IHL Group.
5. All requests requiring written approval should be submitted to [email protected] and will be reviewedwithin one business day.
For any questions regarding this policy, please contact us at 615-591-2955 or email us at [email protected]
© Copyright 2016 IHL Group. All rights reserved. 13
Thank You
contact information
For more info, please contact us at
www.ihlservices.com
[email protected]@ihlservices.com@gregbuzek+1 615-591-2955