Embed Size (px)
Citation preview

Thoughts from a Renaissance man Morocco’s ‘first world’ problems
Thoughts from a Renaissance man Economics & Strategy
29 February 2016
The macro backdrop is the best of the top five equity markets in Africa.
We think Morocco looks good within the frontier space today
This economist’s most recent ‘first world’ problem was being allocated the dreaded middle seat on the Ryanair flight back from
Rabat, landing at midnight, at Stansted (that’s actually four problems in one sentence). Morocco also has little to really complain
about. The country has trains and modern trams you might associate with the Netherlands, and smart airports, roads and buildings
(residential and commercial) similar to Spain or South Africa. Over the past decade or two, Morocco has already delivered the
physical infrastructure that Kenya and Nigeria still aspire to. As a result, car manufacturing (Renault’s capacity is 170k cars a year)
has now become its number one export – and in this regard the country can be compared to frontier peer Romania. With
aerospace components and additional car manufacturing (Peugeot plans 90k vehicles by 2019), Morocco should continue to move
up the value added curve. Morocco’s 34mn people – only a little fewer than Poland or Spain – have a better demographic profile
than either, and, in our view, the $104bn economy looks understated (or everyone else is overstated). Access to banking has
widened sharply; meanwhile Morocco’s banks and telecom companies have used this strong foundation to expand across Africa
over the past 10-15 years.
This has seemingly all been achieved under the benign rule of Morocco’s king (similar to Dubai or Oman, but he’s only 52) and via
Morocco’s very high domestic savings. Unlike Brazil or Russia, it would appear that Morocco’s savings have never been wiped out
by hyperinflation or deep economic shocks. High domestic savings have meant Morocco’s lending to GDP ratio is much higher
than many EM countries at 97% of GDP (source: IMF) and this has not been financed from abroad. External debt was just 32% of
GDP in 2015. The loan-to-deposit ratio is 95% and so in this regard Morocco is more similar to China or Vietnam than most of Sub
Saharan Africa (SSA). As with these two countries, the plentiful supply of savings mean interest rates are low at just 2.5% and the
IMF expects inflation to end 2016 at 1.3%.
So what’s the problem?
The only ‘problem’ is that Morocco is not growing as fast as local officials would like. The prime minister (facing re-election in
October) targeted 7% growth at the last election, but in 2015 the IMF estimates it was 4.7%. Stripping out extremely volatile
agriculture, GDP has risen by just 3% annually since 2013, which we think is pretty good relative to many in EEMEA and given
weakness in Europe (62% of exports in 2014). Officials believe better than 5% should be the target. Morocco, a little like Romania
or Pakistan, is seeing little demand for new loans (credit growth was 1-2% in 2015) after a pre-global financial crisis (GFC) lending
boom. We believe an interest rate cut in March, or further central bank (CB) support for lending growth (similar to Hungary’s
support for SMEs, or the UK’s CB support for lending) is likely.
Exchange rate flexibility is coming
The impressive economic backdrop makes this an ideal year for Morocco to loosen the currency peg (60% euro, 40% US dollar)
according to the IMF. The current account deficit was 1% of GDP in 2015. The currency is fairly valued according to our REER model and
inflation is low. The lack of a significant interest rate premium over the ECB or Fed means even with wider bands – we would guess 3%
bands around a central parity rate as the first move – we see no obvious reason for the currency to move much in any direction.
Macro good – but valuations high
Our data imply Morocco is the second-biggest underweight (after Kuwait) for frontier investors despite offering what we consider to
be the best macro picture among the largest African equity markets. While we are not convinced that either credit or GDP growth
is about to surge, we do like an African currency that is fairly valued and protected by high FX reserves. Daniel Salter, our Global
Equity Strategist, rates Morocco as an Overweight.
© 2016 Renaissance Securities (Cyprus) Limited. All rights reserved. Regulated by the Cyprus Securities and Exchange Commission (Licence No: KEPEY 053/04). Hyperlinks to important information accessible at www.rencap.com: Disclosures and Privacy Policy, Terms & Conditions, Disclaimer.
Charles Robertson +44 (203) 379-7835 [email protected] Mobile +44 7747 118 756
@RenCapMan

2
Renaissance Capital 29 February 2016
Thoughts from a Renaissance man
There were two reasons for this week’s visit to Rabat and Casablanca, where we met with
local officials from the public and private sectors.
First, we wanted to find out if there were macro or political risks that we have been
missing. In September 2015, we got more interested in Moroccan macro – particularly in
the African context – because our REER model suggests that unlike overvalued Nigeria,
Egypt or Kenya, the Moroccan dirham (MAD) was marginally cheap compared to its own
history. Our January update reiterated this point. Below we touch on some of the potential
issues, but the short answer is no, we do not see significant risks.
Second, we wanted to understand how Morocco managed to avoid a bust after the private
sector debt boom in the run-up to the GFC. We have been arguing (Frontier and
emerging markets: Reform awakens, published 14 May 2015) that Turkey is vulnerable to
a bust because the only other EM countries that have seen credit/GDP rising as fast as
Turkey in the past decade are Brazil and Greece. All three have seen the credit/GDP ratio
rise by at least 50 ppts of GDP. The result for both Brazil and Greece is well known.
Morocco also saw a credit/GDP boom of 50 ppts but has not crashed. Might this provide a
ray of hope for Turkey?
Figure 1: The rise in GDP vs the rise in credit to ‘other sectors’ (private sector, state owned enterprises, local government but not central government) as % of GDP
Source: IMF
We are not sure we have all the answers to this second question. One official we met said
it may be too early to tell if Morocco has really avoided a crash, but in our view, we would
have seen a blow-up by now if it was coming.
The two key reasons for Morocco avoiding an implosion probably relate to 1) how lending
has been financed; and 2) who has borrowed. It is probably to the great credit of the
banking regulator that the credit cycle has been managed so well.
It is worth noting that the IMF shows Morocco to have the best supervision standards in
the region (see appendix table 1 on page 46 of the IMF’s report) – followed by Kenya,
helped by IRFS standards and (parts of) Basel III capital adequacy standards. IMF stress
tests show the banking sector can cope with either a global shock or prolonged weakness
in the eurozone, and despite expansion to SSA, any problems there too should not impact
too significantly on Moroccan banks. Moroccan bank operations in SSA are funded
locally, unlike Greek bank operations in the Balkans up to the 2007-2008 GFC.
As noted on the front page, domestic sources seem to have financed the lending. Unlike
eastern Europe in the run-up to the GFC, Morocco’s banking system seems to have been
flush with sufficient savings to fund its own growth rate. Until 2007-2008, credit growth
that peaked at 30% pa (see Figure 4) fuelled a big rise in real estate prices, much like in
eastern Europe. As in the Baltic states in 2006-2007, this growth came to a halt because
0
2
4
6
8
10
12
14
16
18
20
02 03 04 05 06 07 08 09 10 11 12 13 14 15F 16F
Change in lending as % of GDP Real GDP %YoY
Credit booms like this usually end in a growth or banking crash - but Morocco avoided both

3
Renaissance Capital 29 February 2016
Thoughts from a Renaissance man
house prices reached levels that locals became uncomfortable with, but eastern Europe
relied on foreign funding because local savings had been inadequate to fund demand for
borrowing. When the GFC saw this foreign funding dry up (central Europe) or even
reverse (Kazakhstan, Ukraine, etc), the boom became a bust. In Morocco by contrast,
transactions in the real estate market fell but prices did not fall dramatically. Today the
IMF says it sees little evidence of a housing bubble.
Quite where Morocco’s savings have come from is a good question. Perhaps 500 years of
relative peace since the Moors were expelled from southern Spain has helped. But one
consequence is that there is plenty of bank funds available for loans to companies, which
may have been to the detriment of the stock exchange. In contrast, Kenya or Nigeria have
a shortage of savings that has encouraged growth in their stock markets.
In any case, the loan-to-deposit ratio is far better than in those countries that have had a
boom-bust cycle at around 100-105% from 2012-2014. It gently fell to 95% by September
2015 according to Figure 2 below and page 16 of the IMF report.
The borrowing also appears more sustainable to us. While Russia, or Brazil, or SA have
recently had a problem with consumer finance when debt in this sector reached around
10% of GDP, in Morocco, much of the borrowing was done via mortgages. While
mortgages remain in single digits in Russia or Turkey, in Morocco, helped by government
guarantees, mortgages have now risen to 18% of GDP. Moroccans have proven to be
resolute in meeting their mortgage commitments and as there has been no recession,
there has been no obvious reason for NPLs to pick up significantly. Mortgages also look
affordable. The borrowing rate is around 6-7% now and the maturity is up to 30 years for
younger borrowers.
Figure 2: Mortgages-to-GDP ratio more in line with richer EM countries or SA (1 December 2015, unless otherwise stated)
Note: All data as of 1 December 2015, except SA (1 November 2015), Turkey (1 August 2015) and Morocco
Source: BAM, Renaissance Capital
So Morocco has seen a credit boom that ended quietly as there was no interest rate
shock, nor a withdrawal of foreign funding. The reason Turkey cannot take comfort from
this is that Turkey’s loan-to-deposit ratio is around 120% so foreign financing is an issue,
and the failure to control inflation means that interest rate shocks are a threat too.
What happens next? Access to credit has broadened and both Egypt and Pakistan might
look to Morocco to see how this has been achieved. In 2011, 41% of the population had
access to a bank account compared to closer to 10% in both Egypt and Pakistan1. This
remains well below the 60-70% rates in Greece and Oman, so there is room for further
1 See Figure 2 in Thoughts from a Renaissance Man: Pakistan – thanks for the reminder, 19 February 2015
0
5
10
15
20
25
Poland South Africa Czech R. Hungary Turkey Russia Morocco(2009)
Morocco(2014)

4
Renaissance Capital 29 February 2016
Thoughts from a Renaissance man
growth. Note this comparative World Bank data is different from Moroccan figures cited by
the IMF (see page 11 of the IMF’s report) which shows a rise from 43% of the population
with a bank account in 2008, to 63% in 2015, alongside a 50% rise in bank branches
since 2008. However, in that report the IMF also cites the 41% figure for Morocco.
In addition, when mortgages are 60% of GDP or more in the US or UK, and just 18% of
GDP in Morocco, there is scope for the stock of debt to keep rising. Low interest rates
help. We believe that total credit growth of around 6-7% annually should be sustainable
(when inflation is around 1%). Contrast this with Vietnam, which in our view is risking an
unsustainable boom with credit growth closer to 20% from a high base. We believe even
10-15% would be acceptable for one to two years and high single digits would be
acceptable over three to five years if inflation picked up to 2-3%.
As a result we should assume more CB action to deliver higher credit growth, as early as
the March 2016 CB meeting. The conservative assumption would be a 25 bpts cut; but
the CB could try and shock depositors and potential borrowers by pushing for a 100-200
bpts cut, although 25 bpts is far more likely, in our view. The CB may also lend more to
banks at the deposit rate, for on-lending to the rest of the economy. Already reserve
requirements have been slashed from 16.5% in 2007 to 2% so there is limited scope to
use that to encourage more lending.
We are not sure how effective this will be. Morocco has a high lending-to-GDP ratio
already and perhaps after the boom that ended in 2009, subdued borrowing will continue
in the medium term. Romania and Pakistan have both struggled to get lending up after
their pre-GFC credit booms. Moreover, Moroccan companies seem reluctant to invest
heavily at a time when global growth is weak and the key export market (Europe) is
weaker still.
Figure 3: Claims on ‘other sectors’ as % of GDP in 2014 (DM in red, EM in blue, Frontier in green, Beyond Frontier in yellow)
Note: Some countries such as China and India only provide data on the narrower definition of "claims on the private sector"
Source: IMF
We do not advise that investors should assume a renewed credit boom. We pencil in 4%
nominal growth in 2016, but given the CB willingness to encourage this, we believe there
is potential upside to this figure.
0
50
100
150
200
Net
herla
nds
Uni
ted
Sta
tes
Spa
in
Japa
n
Aus
tral
ia
Sou
th K
orea
Chi
na
Uni
ted
Kin
gdom
Ger
man
y
Fra
nce
Italy
Gre
ece
Vie
tnam
Mor
occo
Sou
th A
fric
a
Bra
zil
Tur
key
Rus
sia
UA
E
Pol
and
Cze
ch R
epub
lic
Iran
Indi
a
Hun
gary
Phi
lippi
nes
Kaz
akhs
tan
Indo
nesi
a
Ken
ya
Egy
pt
Rom
ania
Mex
ico
Sri
Lank
a
Nig
eria
Pak
ista
n
Arg
entin
a
Private sector debt as % of GDP - 2014

5
Renaissance Capital 29 February 2016
Thoughts from a Renaissance man
Figure 4: Morocco's bank lending % ch YoY
Source: IMF
Talking with officials actually reminded us more of the debate in developed markets such
as the eurozone – how to lift borrowing demand – than the typical discussion we might
have in other frontier markets. Morocco shares more characteristics with central Europe
than with most African countries. The eurozone disease of very low inflation and very low
interest rates seem to be contagious.
Figure 5: Inflation is now below that of Poland, Hungary and the Czech Republic
Source: Bloomberg
Figure 6: Interest rates may follow central Europe further down too
Source: Bloomberg
-5
0
5
10
15
20
25
30
35
Dec
-02
Jun-
03
Dec
-03
Jun-
04
Dec
-04
Jun-
05
Dec
-05
Jun-
06
Dec
-06
Jun-
07
Dec
-07
Jun-
08
Dec
-08
Jun-
09
Dec
-09
Jun-
10
Dec
-10
Jun-
11
Dec
-11
Jun-
12
Dec
-12
Jun-
13
Dec
-13
Jun-
14
Dec
-14
Jun-
15
Dec
-15
Claims on other sectors Claims on private sector
-4
-2
0
2
4
6
8
10
Jan-
10
Apr
-10
Jul-1
0
Oct
-10
Jan-
11
Apr
-11
Jul-1
1
Oct
-11
Jan-
12
Apr
-12
Jul-1
2
Oct
-12
Jan-
13
Apr
-13
Jul-1
3
Oct
-13
Jan-
14
Apr
-14
Jul-1
4
Oct
-14
Jan-
15
Apr
-15
Jul-1
5
Oct
-15
Jan-
16Czech CPI, % YoY Hungary CPI, % YoY Morocco CPI, % YoY
Poland CPI, % YoY Romania CPI, % YoY
0
1
2
3
4
5
6
7
8
Jan-
10
Apr
-10
Jul-1
0
Oct
-10
Jan-
11
Apr
-11
Jul-1
1
Oct
-11
Jan-
12
Apr
-12
Jul-1
2
Oct
-12
Jan-
13
Apr
-13
Jul-1
3
Oct
-13
Jan-
14
Apr
-14
Jul-1
4
Oct
-14
Jan-
15
Apr
-15
Jul-1
5
Oct
-15
Jan-
16
Czech CB rate Hungary CB rate Morocco CB rate
Poland CB rate Romania CB rate

6
Renaissance Capital 29 February 2016
Thoughts from a Renaissance man
The currency
As we outlined on the front page, a shift towards currency flexibility is likely. Preparations
have been underway for many years and we believe that only external shocks may have
prevented a move a few years ago. IMF analysis in the latest IMF Article IV (see page 16)
suggests there are minimal risks attached to moving now (assuming no new external
shocks). Low external debt and banks that are long dollars means any depreciation may
actually benefit banks. The pass-through from exchange rate moves is estimated at 0.18.
We do not expect the CB would widen the bands sufficiently to make any currency move
that meaningful for inflation.
Morocco’s fundamentals look pretty good as they are – so we did ask why move at all?
The answer is that Morocco aims to be a hub for Africa and a more flexible exchange rate
regime is seen as a step on the road in helping this process.
Note that while foreigners can put money into and take it out of Morocco with no
restrictions, this is not the case for local citizens. The IMF recommends separating
liberalisation of the currency peg with liberalisation of the capital account. We assume the
latter will come in future years.
The political economy
It is not possible to talk MENA without touching on geopolitical and security risks.
According to the global terrorism database, there have been no fatalities in Morocco from
terrorism since one attack in 2011 and prior to that the only attacks were as far back as
2007. The stability of Morocco is one reason why Renault in 2012, Citroen, Peugeot and
potentially Volkswagen are investing in Morocco.
Political stability may in part be because of the country’s commitment to espousing
moderate Islamic principles, but also reflects the popularity of King Mohammed VI. Born
in 1963, and after studying law (and working in Brussels with the EU Commission), before
taking power in 1999. He has played a key role in overseeing Morocco’s development
since then. In March 2011, just months after the Arab Spring erupted, he proposed a new
constitution that granted more powers to parliament. This resulted in a shift in Morocco’s
political system score from -6 to -4 in the benchmark Polity2 database (where -10 is Saudi
Arabia and +10 is Germany). Morocco may well become one of those countries that
transitions peacefully towards a +10 rating in the coming decades. The king remains the
most powerful political force in the country and his role in the country reminds us of Oman
or Dubai’s experience in recent decades.
The forthcoming elections on 7 October 2016 will be the second since the new
constitution was promulgated. In 2011, the Islamist Justice and Development Party (PJD)
won 107 of the 395 seats and its leader Abdelilah Benkirane became prime minister.
Economic portfolios went to the centre-right RNI, which won 52 seats in parliament.
The 2011-2016 government has made important reforms – “perhaps the most rational
reforms undertaken in the Middle East and North Africa region in many years” according
to a World Bank paper. Faced with a 2012 budget deficit of 7% of GDP and a current
account deficit of 10% of GDP, due in part to subsidies that cost 6.5% of GDP, the
government decided to abolish fuel subsidies. From our conversations with local officials,
we understand that subsidies in 2016 are expected to cost the country no more than 1-2%
of GDP, with sugar subsidies to be phased out too (we were told that just cooking gas
may remain as a subsidised item). The budget deficit is targeted to be 3.5% of GDP in
2016 and the current account deficit is expected to be 1-2% of GDP. There is widespread
praise for these reforms from economists, but there is uncertainty about how the
7
Renaissance Capital 29 February 2016
Thoughts from a Renaissance man
electorate will react in the 2016 elections. Elections may jeopardise or delay further
pension reforms planned for 2017, which are needed to address long-term funding issues.
The model of development
A question posed by the World Bank is whether Morocco may reach southern European
levels of development by 2040. That is a little too ambitious, in our opinion, but the
comparison point is accurate. Morocco reminds us of Spain. Mexico is another potential
comparison point – from the impressive pension reforms enacted in the 1990s to the
successful drive to build a manufacturing base aimed at exporting to its northern neighbour.
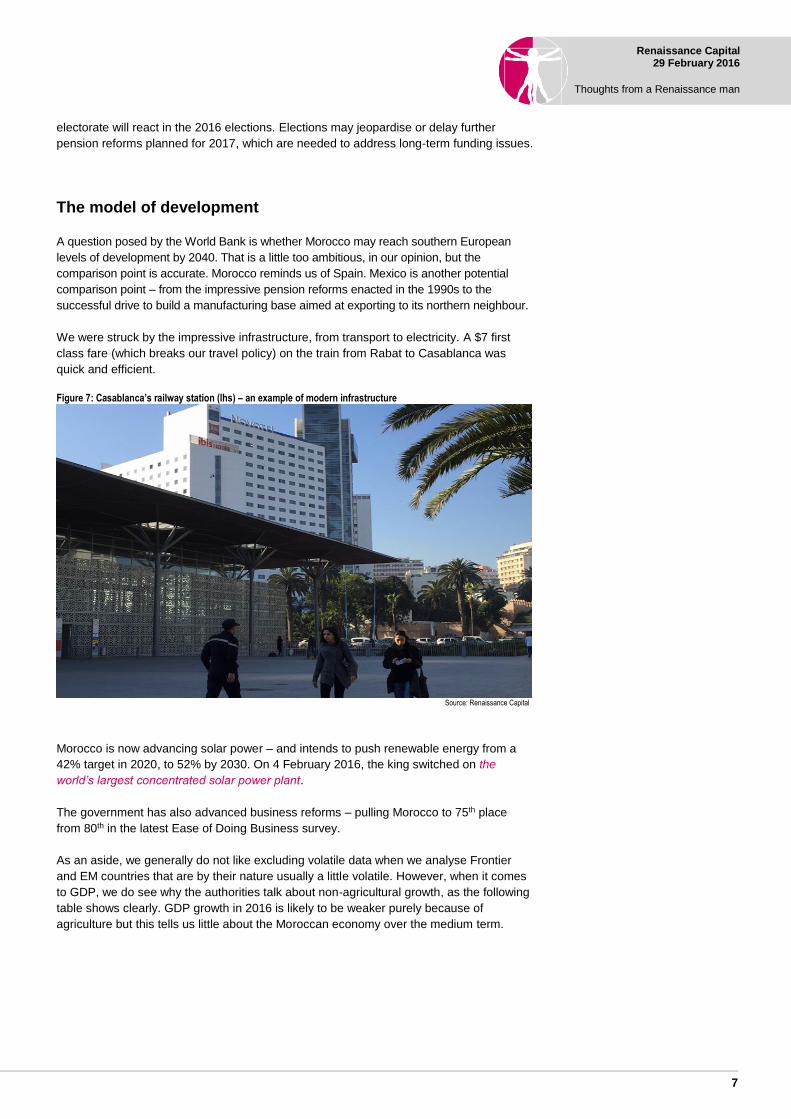
We were struck by the impressive infrastructure, from transport to electricity. A $7 first
class fare (which breaks our travel policy) on the train from Rabat to Casablanca was
quick and efficient.
Figure 7: Casablanca’s railway station (lhs) – an example of modern infrastructure
Source: Renaissance Capital
Morocco is now advancing solar power – and intends to push renewable energy from a
42% target in 2020, to 52% by 2030. On 4 February 2016, the king switched on the
world’s largest concentrated solar power plant.
The government has also advanced business reforms – pulling Morocco to 75th place
from 80th in the latest Ease of Doing Business survey.
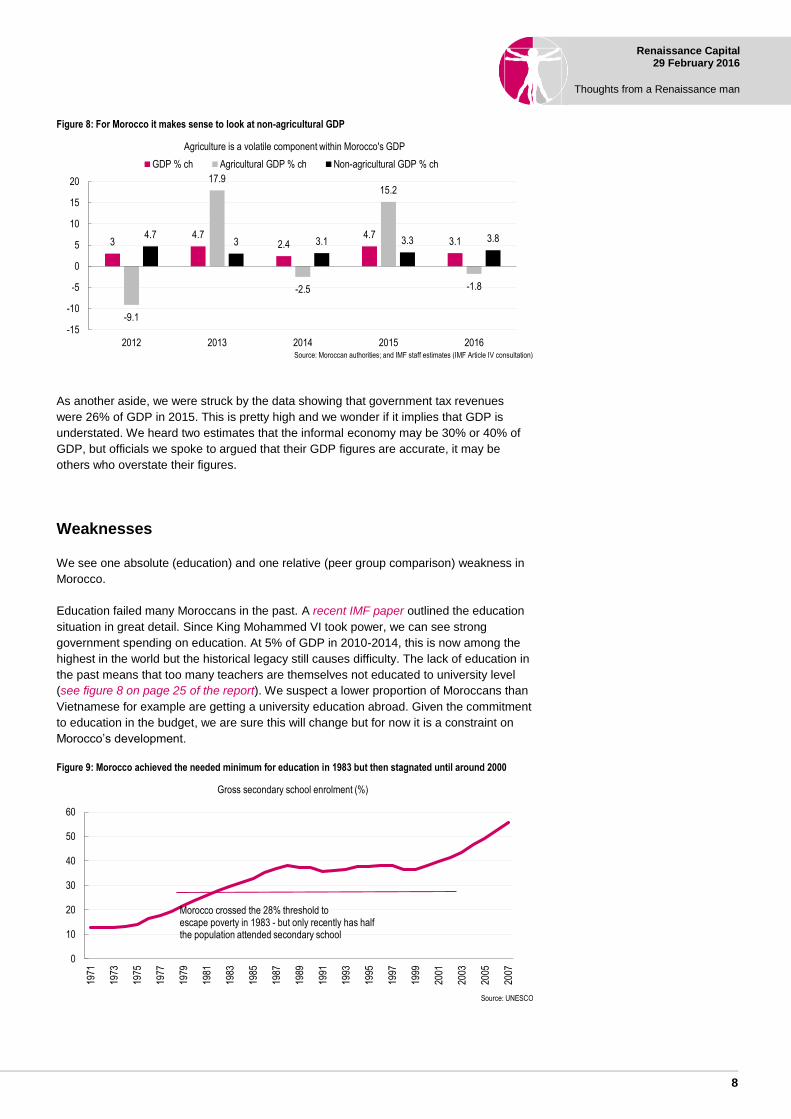
As an aside, we generally do not like excluding volatile data when we analyse Frontier
and EM countries that are by their nature usually a little volatile. However, when it comes
to GDP, we do see why the authorities talk about non-agricultural growth, as the following
table shows clearly. GDP growth in 2016 is likely to be weaker purely because of
agriculture but this tells us little about the Moroccan economy over the medium term.
8
Renaissance Capital 29 February 2016
Thoughts from a Renaissance man
Figure 8: For Morocco it makes sense to look at non-agricultural GDP
Source: Moroccan authorities; and IMF staff estimates (IMF Article IV consultation)
As another aside, we were struck by the data showing that government tax revenues
were 26% of GDP in 2015. This is pretty high and we wonder if it implies that GDP is
understated. We heard two estimates that the informal economy may be 30% or 40% of
GDP, but officials we spoke to argued that their GDP figures are accurate, it may be
others who overstate their figures.
Weaknesses
We see one absolute (education) and one relative (peer group comparison) weakness in
Morocco.
Education failed many Moroccans in the past. A recent IMF paper outlined the education
situation in great detail. Since King Mohammed VI took power, we can see strong
government spending on education. At 5% of GDP in 2010-2014, this is now among the
highest in the world but the historical legacy still causes difficulty. The lack of education in
the past means that too many teachers are themselves not educated to university level
(see figure 8 on page 25 of the report). We suspect a lower proportion of Moroccans than
Vietnamese for example are getting a university education abroad. Given the commitment
to education in the budget, we are sure this will change but for now it is a constraint on
Morocco’s development.
Figure 9: Morocco achieved the needed minimum for education in 1983 but then stagnated until around 2000
Source: UNESCO
34.7
2.44.7
3.1
-9.1
17.9
-2.5
15.2
-1.8
4.73 3.1 3.3 3.8
-15
-10
-5
0
5
10
15
20
2012 2013 2014 2015 2016
Agriculture is a volatile component within Morocco's GDP
GDP % ch Agricultural GDP % ch Non-agricultural GDP % ch
0
10
20
30
40
50
60
1971
1973
1975
1977
1979
1981
1983
1985
1987
1989
1991
1993
1995
1997
1999
2001
2003
2005
2007
Gross secondary school enrolment (%)
Morocco crossed the 28% threshold to escape poverty in 1983 - but only recently has half the population attended secondary school

9
Renaissance Capital 29 February 2016
Thoughts from a Renaissance man
The second problem is Morocco’s peer group. We think the economy is the best in Africa
relative to any peers with a significant equity market (SA, Egypt, Nigeria and Kenya). It
has better growth and an elite that is more successful in driving reform than SA. It has a
competitive currency unlike the overvalued and capital account-restricted situation in
Egypt or Nigeria. It has fewer imbalances than Kenya and greater savings than either
Kenya or Nigeria.
However – if we compare Morocco to central Europe – the situation looks different.
Morocco has far better demographics than ageing eastern Europe2 but this is partly offset
by the far better education levels that are the result of communism’s positive legacy from
Poland to Romania. Demographics mean Morocco should be able to grow faster than
most of eastern Europe, but the lower education levels mean we doubt per capita GDP
can converge in the next generation.
To answer the World Bank’s question “can Morocco converge by 2040 with southern
Europe income levels of 2015?” it is worth comparing secondary school enrolment rates.
The latest 2007 figure of 56% for Morocco is below the 58% of Spain in 1971 or the 63%
of Greece in that same year. Education levels are 45 years behind southern Europe, so
we do not see how Morocco can achieve Spain’s current level of per capita GDP in the
next 25 years. By comparison, Romania had 73% secondary school enrolment in 1971
and Poland had 74%. Unfortunately that high level of education could not offset the
income damage caused by communism – hence central Europe being poorer than
southern Europe today.
Figure 10: Secondary school gross enrolment rates (%)
Poland 1971 74 Romania 1971 73 Greece 1971 63 Spain 1971 58 Morocco 2007 56 Egypt 2004 79 Kenya 2009 59 Nigeria 2007 30
Source: UNESCO
In addition, EU membership has two important effects on the investment climate that
should benefit eastern Europe but not Morocco. First, the EU gives 3-4% of GDP a year
to east European EU member states. Nearly half goes to the agricultural sector and the
remainder mainly focuses on infrastructure. Morocco will not get such inflows (although
Gulf money does help).
Second, EU membership improves the legal climate. The Renaissance Capital legal score
for Morocco was around 40/100 (similar to Colombia or Ghana) in our most recent
update. This compares to around 65 for Romania and over 80 for Poland and the Czech
Republic. As we have written previously3, EU membership appears to lift the legal score
well above what per capita GDP data alone might suggest was likely.
This makes east European EU member states a more trusted investment destination for
foreign direct investment (FDI). FDI decision makers do not need to think about the same
level of potential risks when they invest in EU member states as they do when they invest
in Morocco.
Having said all that – there is of course a price for everything. Per capita GDP in Morocco
of around $3,000 compares to $9,000 in Romania and over $12,000 in Poland. When
Morocco is this much cheaper than eastern European countries, and because we assume
2 See The final frontier and beyond 28 April 2014 3 See Thoughts from a Renaissance Man: Are you constrained by the law? 31 March 2015

10
Renaissance Capital 29 February 2016
Thoughts from a Renaissance man
that differential is likely to last over decades (because of shrinking labour forces in eastern
Europe and a growing labour force in Morocco, as well as education) – it makes sense
that Morocco should now be attracting automotive sector investments.
Note, however, that per capita GDP might be misleading (it is an average that will include
low value-added employees in agriculture). We do not have reliable data on
manufacturing wages. It was announced in April 2015 that the public sector minimum
wage would be raised to MAD3,000 in July 2015, equivalent to EUR278 today. This is
high relative to per capita GDP (28% above Romania, despite Romania’s much higher per
capita GDP). Nonetheless, we know that Renault, which operates in both Romania and
Morocco, has chosen to build up in Morocco too – implying this makes economic sense
for the company – and is not just investment directed by Paris for political reasons.
Figure 11: Morocco has quite a high minimum wage relative to its per capita GDP
Source: Reuters, Eurostat
Conclusion
In our opinion, Morocco has the best macro situation of any country in Africa with a
significant equity market. We think there is a good chance of (non-agricultural) growth
picking up from 3% in recent years towards 5% by 2020. Broadening access to banking
services in the medium term and broadening access to education in the longer term mean
we are pretty bullish on this country. We are struggling to identify risks but then so is the
IMF in its latest positive reports.
Morocco – Equity Strategy Comment from Daniel Salter
We like Morocco from an equity strategy perspective (particularly against more
challenged markets elsewhere in Africa for Africa funds).
We initiated on Morocco as an equity strategy Overweight in November’s SPECTRE
report.
Since then, Morocco is up 3.3% in dollar terms – on the face of it unexciting, but
actually making Morocco one of the top five performing markets in Frontier, way ahead
of the 9% decline in MSCI Frontier and the top performing African market in MSCI
Frontier or Emerging (the only one in positive territory – Nigeria, Kenya and Egypt are
all down) since then.
0
150
300
450
600
750
900
-
5,000
10,000
15,000
20,000
25,000
30,000
Slo
veni
a
Spa
in
Gre
ece
Por
tuga
l
Pol
and
Tur
key
(if 3
0% h
ighe
r)
Cro
atia
Est
onia
Slo
vaki
a
Latv
ia
Hun
gary
Cze
ch R
epub
lic
Tur
key
2015
Lith
uani
a
Mor
occo
(20
15)
Rom
ania
Bul
garia
Per capita GDP ($, lhs, 2015) vs minimum wage (euros, rhs, 2014 or now)
Per capita GDP in 2015 ($), IMF Minimum wage in Euros, end-2014
Daniel Salter +44 (203) 379-7824 [email protected]

11
Renaissance Capital 29 February 2016
Thoughts from a Renaissance man
We reiterated our Overweight in this month’s The Strategy Show:
Figure 12: Renaissance Capital country summaries – FM (extract)
Country Rec Bull case Bear case
Morocco OW
Morocco is under-owned, yet the currency (and much financing) is euro-linked and not overvalued by our REER measure. The market has de-rated from 19x 12M fwd P/E to 14x over the past 12 months. Investors tell us they are looking for new markets in Africa, given currency questions in Nigeria/Egypt.
Investors tell us that Morocco’s corporate stories are underwhelming – we intend to visit Morocco this quarter to do more work.
Source: The Strategy Show, 19 February 2016
Investors always come back with three pushbacks on Morocco (i) expensive valuations vs
Frontier; (ii) poor liquidity; and (iii) uninspiring corporate stories.
Valuations admittedly have come down, but you still pay 14.7x 12M fwd PER for MSCI
Morocco vs 9.5x for MSCI Frontier, representing a 50% premium. Admittedly, bond yields
in Morocco are very low: 10-year MAD bond yields are about 3.4%, so a premium is fully
justified vs SSA and Egypt, in this strategist’s opinion. This low bond yield might also
tempt local investors to add positions in the equity market that offer a dividend yield of 4-
5%.
Figure 13: MSCI Morocco and Frontier – 12M fwd PER (x)
Source: Bloomberg, Renaissance Capital
On liquidity, the story’s not pretty. There was a burst of liquidity in December 2015, but
that seems to have subsided and over the last month, the market is trading just around
$7.5mn a day (1M ADTV) with only two stocks trading over a million dollars a day (real
estate developer, Douja Promotion and telecoms operator, Maroc Telecom – not
covered). Even market favourite, Bank Attijariwafa (not covered) has traded only $0.9mn
a day over the past month.
We have a BUY rating on Residences Dar Saada (TP MAD 223, CP MAD 152).
As a last aside, this government has not prioritised the stock market. The downgrade from
EM to Frontier status in 2013 was due to a fall in transaction volume that may be a
symptom of this. We doubt this will change in the near term, but the stock exchange is
planning a series of reforms that might encourage more volatility. Allowing short selling is
one such planned reform. The exchange also hopes to see African companies from other
countries list on the exchange, which would give local savings an opportunity to diversify.
8
10
12
14
16
18
20
Jan-
11
Jul-1
1
Jan-
12
Jul-1
2
Jan-
13
Jul-1
3
Jan-
14
Jul-1
4
Jan-
15
Jul-1
5
Jan-
16
MSCI Frontier MSCI Morocco

12
Renaissance Capital 29 February 2016
Thoughts from a Renaissance man
Figure 14: Key data Local currency MAD
GDP/capita, $ (2015) 3,071 Population, mn (2015) 33.7 S&P/Moody's rating BBB-/Ba1 Weight in MSCI FM, % 7.5%
MSCI Index MXMA
2015 P/E, x 15.2 2015 FY EPS growth 7.7% Trailing P/B, x 2.5 Beta to FM 0.3 MSCI full MktCap, $bn 32.6 MSCI free float MktCap, $bn 6.3 No. of companies 9 3M ADTV, $mn, MSCI cos 12.2
Local index MOSEMDX
MktCap, $bn 43.3 No. of companies 54 3M ADTV, $mn 18.4
Figure 15: Index performance
Figure 16: MSCI sector weights
Figure 17: Index and stock data
Ticker Name Sector MktCap FF MktCap 3M ADTV $ performance (%) 12MF Trail 12MF # analyst MSCI
($mn) ($mn) ($mn) 1M 3M 12M P/E (x) PBV (x) RoE (%) Recs wgt (%)
MXMA MSCI Morocco 32,630 6,301 12.2 5.2 4.0 -14.6 15.0 2.5 21.3 47 7.5
IAM MC Maroc Telecom Telecoms 10,551 2,125 1.3 4.8 7.4 -13.4 16.7 6.8 35.2 10 34 ATW MC Attijariwafa Financials 6,796 1,367 5.4 0.4 1.6 -15.6 13.3 1.9 12.3 7 22 LAC MC Lafarge Ciments Materials 3,019 755 1.2 10.4 5.3 -14.6 20.3 6.6 28.2 5 12 BCE MC Banque Marocaine Financials 3,669 566 0.9 -4.4 -5.9 -18.2 15.1 2.2 na 3 9 BCP MC Banque Centrale Financials 3,986 417 1.3 0.8 1.1 -11.8 14.7 1.1 9.4 6 7 ADH MC Douja Prom Addoh Financials 1,033 420 1.6 17.7 12.8 -4.8 8.8 0.9 9.4 4 7 CMA MC Ciments Du Maroc Materials 1,762 352 0.2 10.0 5.6 -2.7 18.3 3.1 16.4 4 6 WAA MC Wafa Assurance Financials 1,127 225 0.2 3.2 -9.6 -30.9 12.1 2.5 16.2 3 4 MNG MC Managem Materials 550 74 0.0 5.7 -30.0 -40.1 na 1.6 8.7 5 1
HOL MC Holcim Materials 899 440 0.1 7.2 2.4 -28.5 16.4 2.3 25.3 4 - TMA MC Total Maroc Sa Energy 515 232 0.2 0.2 -0.4 5.9 na na 39.2 2 - CSR MC Cosumar Cons. Staples 827 231 0.2 8.9 13.4 4.0 10.1 2.2 18.7 5 - TQM MC Taqa Morocco Utilities 1,428 203 1.1 4.2 4.7 15.1 15.7 na 17.5 3 - BCI MC Banque Marocaine Financials 729 186 1.6 2.9 -10.9 -23.1 14.7 0.8 na 2 - LES MC Lesieur Cristal Cons. Staples 341 138 0.2 -0.4 10.6 12.7 15.1 2.3 13.2 5 - ATH MC Auto Hall Cons. Disc. 501 131 0.2 6.2 7.5 5.2 17.5 2.9 14.0 3 - LBV MC Label Vie Cons. Staples 282 123 1.3 -0.7 -1.6 -1.2 na 2.0 8.8 3 - CDM MC Credit Du Maroc Financials 452 114 0.4 1.1 -1.8 -28.0 na 1.0 na 2 -
Figure 18: 3M ADTV, $mn
Figure 19: 12M fwd PE, x
Note: all forward figures for valuations are taken from Bloomberg consensus estimates. Note: 3M ADTV is not representative due to high end-year turnover figures All data as of 25 February 2016
Source for all charts: Bloomberg
40
60
80
100
120
140
160
Jan-
10
Jul-1
0
Jan-
11
Jul-1
1
Jan-
12
Jul-1
2
Jan-
13
Jul-1
3
Jan-
14
Jul-1
4
Jan-
15
Jul-1
5
Jan-
16
MSCI Morocco, $ MSCI FM, $
47%
34%
19%
Financials
Telecoms
Materials
0
10
20
30
40
50
60
70
80
Jan-
10
Jul-1
0
Jan-
11
Jul-1
1
Jan-
12
Jul-1
2
Jan-
13
Jul-1
3
Jan-
14
Jul-1
4
Jan-
15
Jul-1
5
Jan-
16
Morocco 3M ADTV ($mn) MSCI Morocco 3M ADTV ($mn)
0
2
4
6
8
10
12
14
16
18
20
Jan-
10
May
-10
Sep
-10
Jan-
11
May
-11
Sep
-11
Jan-
12
May
-12
Sep
-12
Jan-
13
May
-13
Sep
-13
Jan-
14
May
-14
Sep
-14
Jan-
15
May
-15
Sep
-15
Jan-
16
Morocco Frontier
Morocco

13
Renaissance Capital 29 February 2016
Thoughts from a Renaissance man
Figure 20: Population, ’000
Source: UN
Figure 21: Export destinations, total $23bn
Source: IMF
Figure 22: CPI average %, CA % of GDP
Source: IMF
Figure 23: Morocco – dirham
Source: Bruegel, Bloomberg
Figure 24: Bank lending growth vs GDP
Source: IMF, Renaissance Capital
Figure 25: Real GDP % change, YoY
Source: IMF
0
5,000
10,000
15,000
20,000
25,000
30,000
1990
1995
2000
2005
2010
2015
2020
2025
2030
2035
2040
2045
2050
0-19 20-64 65+
0
2
4
6
8
10
12
14
16
0
0.1
0.2
0.3
0.4
0.5
0.6
0.7
EU
Eur
o A
rea
Spa
in
Fra
nce
Bra
zil
Italy
US
A
Indi
a
UK
Ger
man
y
% of total exports Value ($bn), 2014, RHS
-10
-8
-6
-4
-2
00.0
0.5
1.0
1.5
2.0
2.5
3.0
3.5
4.0
4.5
2004
2005
2006
2007
2008
2009
2010
2011
2012
2013
2014
2015
E
2016
E
2017
E
2018
E
Current account balance (% of GDP) RHS CPI (average % YoY)
85
90
95
100
105
110
1150
2
4
6
8
10
12
14
Jan-
00
Dec
-00
Nov
-01
Oct
-02
Sep
-03
Aug
-04
Jul-0
5
Jun-
06
May
-07
Apr
-08
Mar
-09
Feb
-10
Jan-
11
Dec
-11
Nov
-12
Oct
-13
Sep
-14
Aug
-15
MAD vs $ MAD vs EUR Morocco REER (Dec 07 = 100)
Weaker
Stronger
0
2
4
6
8
10
12
14
16
18
20
2004
2005
2006
2007
2008
2009
2010
2011
2012
2013
2014
2015
E
2016
E
Change in lending as % of GDP Real GDP (% YoY)
4.8
3.3
7.6
3.5
5.9
4.23.8
5.2
3.0
4.7
2.4
4.9
3.7
4.8 5.0
0
1
2
3
4
5
6
7
8
2004
2005
2006
2007
2008
2009
2010
2011
2012
2013
2014
2015
E
2016
E
2017
E
2018
E
Morocco

14
Renaissance Capital 29 February 2016
Thoughts from a Renaissance man
Figure 26: Morocco key economic indicators Ratings (M/S&P/F) Ba1/BBB-/BBB- Year 2005 2006 2007 2008 2009 2010 2011 2012 2013 2014 2015E 2016E 2017E
Activity
Real GDP (% YoY) 3.3 7.6 3.5 5.9 4.2 3.8 5.2 3.0 4.7 2.4 4.7 3.1 4.2
Investment (% GDP) 27.5 28.1 33.9 39.1 35.0 34.1 35.8 35.0 34.7 33.7 33.3 34.5 35.5
Unemployment rate year-end (%) 11.1 9.7 9.8 9.6 9.1 9.1 8.9 9.0 9.2 9.9 9.8 9.7 9.6
Nominal GDP (lcl bn) 553 604 648 717 748 785 820 848 901 925 1,003 1,048 1,104
Nominal GDP ($bn) 62.3 68.6 79.0 92.5 92.9 93.2 101.4 98.3 107.2 110.0 103.5 108.4 115.3
Population (mn) 30.2 30.5 30.8 31.2 31.5 31.9 32.2 32.6 33.0 33.3 33.7 34.0 34.4
GDP per capita ($) 2,066 2,250 2,563 2,967 2,948 2,927 3,149 3,014 3,250 3,304 3,071 3,188 3,352
Stock of bank credit (lcl, bn) 296 359 462 577 644 715 790 830 859 896 950 1,007 na
Lending/GDP (%) 53.5 59.4 71.4 80.5 86.1 91.2 96.3 97.9 95.3 96.9 90.2 89.8 90.4
Gross domestic saving (% of GDP) 27.3 26.6 31.4 31.9 29.7 29.7 27.9 25.5 26.8 28.2 31.1 32.6 33.6
Prices
CPI (average % YoY) 1.0 3.3 2.0 3.9 1.0 1.0 0.9 1.3 1.9 0.4 1.6 1.5 2.0
CPI (year-end, % YoY) 2.1 3.3 2.0 4.2 -1.6 2.2 0.9 2.6 0.4 1.6 1.6 1.3 2.0
Fiscal balance (% of GDP)
Consolidated government balance -5.9 -1.9 -0.1 0.7 -1.8 -4.3 -6.6 -7.3 -5.2 -4.9 -4.3 -3.5 -3.0
Total public debt (% of GDP) 61.6 56.8 52.0 45.4 46.1 49.0 52.5 58.3 61.5 63.4 63.6 64.4 64.0
External indicators
Exports ($bn) 10.8 12.3 14.5 18.9 13.5 16.6 20.8 17.0 18.3 20.0 18.5 19.9 21.9
Imports ($bn) 20.5 23.3 31.2 40.6 32.4 35.1 43.6 38.9 40.2 40.6 32.5 34.5 37.5
Trade balance ($bn) -9.6 -11.0 -16.8 -21.7 -18.9 -18.5 -22.8 -21.9 -21.9 -20.6 -14.0 -14.6 -15.6
Trade balance (% of GDP) -15.5 -16.0 -21.2 -23.5 -20.4 -19.9 -22.5 -22.3 -20.5 -18.7 -13.5 -13.5 -13.5
Current account balance ($bn) -0.1 -1.1 -2.0 -6.6 -4.9 -4.1 -8.0 -9.3 -8.5 -6.2 -1.6 -0.8 -1.1
Current account balance (% of GDP) -0.2 -1.5 -2.5 -7.1 -5.3 -4.4 -7.9 -9.5 -7.9 -5.7 -1.5 -0.7 -0.9
Net FDI ($bn) 1.6 2.0 2.2 2.2 1.5 0.7 2.4 2.3 3.0 3.1 2.7 3.0 3.2
Net FDI (% of GDP) 2.6 2.9 2.8 2.3 1.6 0.7 2.2 2.3 2.8 2.8 2.6 2.8 2.8
C/A balance plus FDI (% of GDP) 2.4 1.4 0.3 -4.8 -3.7 -3.7 -5.6 -7.2 -5.1 -2.9 1.1 2.1 1.9
Exports (% YoY, value) 9.4 13.3 17.7 30.8 -28.8 23.4 25.2 -18.2 7.6 9.3 -7.5 7.6 10.1
Imports (% YoY, value) 15.1 13.5 34.2 30.1 -20.3 8.5 24.2 -10.8 3.3 1.0 -20.0 6.2 8.7
FX reserves (ex gold, $bn) 16.2 20.3 24.1 22.1 22.8 22.6 20.6 17.5 19.3 20.4 23.5 28.8 32.2
Import cover (months of imports) 9.5 10.5 9.3 6.5 8.4 7.7 5.4 4.6 4.9 5.1 na na na
Gross external debt ($bn) 26.1 28.5 29.2 32.7 31.9 32.7 31.9
Currency and monetary policy
Key policy rate (% YE) 3.3 3.3 3.3 3.5 3.3 3.3 3.3 3.0 3.0 2.8 2.5 2.0 na
Broad money growth (%YoY) 14.1 18.1 17.5 13.3 7.0 4.2 6.4 4.5 3.1 6.2 5.5 6.5 na
Exchange rate (EUR) annual average 11.0 11.0 11.2 11.4 11.2 11.2 11.3 11.1 11.2 11.2 10.8 10.7 10.7
Exchange rate ($) annual average 8.9 8.8 8.2 7.8 8.1 8.4 8.1 8.6 8.4 8.4 9.8 9.6 9.5
Note: 2016-2017E exchange rate forecasts are the IMF implied exchange rates Source: IMF, UNCTAD, Bloomberg
15
Renaissance Capital 29 February 2016
Thoughts from a Renaissance man
Analysts certification
This research report has been prepared by the research analyst(s), whose name(s) appear(s) on the front page of this document, to provide background information about the issuer or issuers (collectively, the “Issuer”) and the securities and markets that are the subject matter of this report. Each research analyst hereby certifies that with respect to the Issuer and such securities and markets, this document has been produced independently of the Issuer and all the views expressed in this document accurately reflect his or her personal views about the Issuer and any and all of such securities and markets. Each research analyst and/or persons connected with any research analyst may have interacted with sales and trading personnel, or similar, for the purpose of gathering, synthesizing and interpreting market information. If the date of this report is not current, the views and contents may not reflect the research analysts’ current thinking.
Each research analyst also certifies that no part of his or her compensation was, or will be, directly or indirectly related to the specific ratings, forecasts, estimates, opinions or views in this research report. Research analysts’ compensation is determined based upon activities and services intended to benefit the investor clients of Renaissance Securities (Cyprus) Limited and any of its affiliates (“Renaissance Capital”). Like all of Renaissance Capital’s employees, research analysts receive compensation that is impacted by overall Renaissance Capital profitability, which includes revenues from other business units within Renaissance Capital.
Important issuer disclosures
Important issuer disclosures outline currently known conflicts of interest that may unknowingly bias or affect the objectivity of the analyst(s) with respect to an issuer that is the subject matter of this report. Disclosure(s) apply to Renaissance Securities (Cyprus) Limited or any of its direct or indirect subsidiaries or affiliates (which are individually or collectively referred to as “Renaissance Capital”) with respect to any issuer or the issuer’s securities.
A complete set of disclosure statements associated with the issuers discussed in this Report is available using the ‘Stock Finder’ or ‘Bond Finder’ for individual issuers on the Renaissance Capital Research Portal at: http://research.rencap.com/eng/default.asp
RESIDENCES DAR SAADA S.A. Bloomberg: RDS:MC
Renaissance Capital was not aware of any actual, material conflict of interest with the issuer at the time of publication.
Investment ratings
Investment ratings may be determined by the following standard ranges: Buy (expected total return of 15% or more); Hold (expected total return of 0-15%); and Sell (expected negative total return). Standard ranges do not always apply to emerging markets securities and ratings may be assigned on the basis of the research analyst’s knowledge of the securities.
Investment ratings are a function of the research analyst’s expectation of total return on equity (forecast price appreciation and dividend yield within the next 12 months, unless stated otherwise in the report). Investment ratings are determined at the time of initiation of coverage of an issuer of equity securities or a change in target price of any of the issuer’s equity securities. At other times, the expected total returns may fall outside of the range used at the time of setting a rating because of price movement and/or volatility. Such interim deviations will be permitted but will be subject to review by Renaissance Capital’s Research Management.
Where the relevant issuer has a significant material event with further information pending or to be announced, it may be necessary to temporarily place the investment rating Under Review. This does not revise the previously published rating, but indicates that the analyst is actively reviewing the investment rating or waiting for sufficient information to re-evaluate the analyst’s expectation of total return on equity.
Where coverage of the relevant issuer is due to be maintained by a new analyst, on a temporary basis the relevant issuer will be rated as Coverage in Transition. Previously published investment ratings should not be relied upon as they may not reflect the new analysts’ current expectations of total return. While rated as Coverage in Transition, Renaissance Capital may not always be able to keep you informed of events or provide background information relating to the issuer.
If issuing of research is restricted due to legal, regulatory or contractual obligations publishing investment ratings will be Restricted. Previously published investment ratings should not be relied upon as they may no longer reflect the analysts’ current expectations of total return. While restricted, the analyst may not always be able to keep you informed of events or provide background information relating to the issuer.
Where Renaissance Capital has neither reviewed nor revised its investment ratings on the relevant issuer for a period of 180 calendar days, coverage shall be discontinued.
Where Renaissance Capital has not provided coverage of an issuer for a period of 365 calendar days, coverage shall be discontinued.
Where Renaissance Capital has not expressed a commitment to provide continuous coverage and/or an expectation of total return, to keep you informed, analysts may prepare reports covering significant events or background information without an investment rating (Not Covered).
Your decision to buy or sell a security should be based upon your personal investment objectives and should be made only after evaluating the security’s expected performance and risk.
Renaissance Capital reserves the right to update or amend its investment ratings in any way and at any time it determines.
Disclosures appendix

16
Renaissance Capital 29 February 2016
Thoughts from a Renaissance man
Renaissance Capital equity research distribution of ratings
Investment Rating Distribution Investment Banking Relationships*
Renaissance Capital Research Renaissance Capital Research
Buy 144 44% Buy 3 100%
Hold 115 35% Hold 0 0%
Sell 66 20% Sell 0 0%
Under Review 2 1% Under Review 0 0%
Restricted 0 0% Restricted 0 0%
Cov. in Trans. 1 0% Cov. in Trans. 0 0%
328 3
*Companies from which RenCap has received compensation within the past 12 months. NR – Not Rated UR – Under Review
Source: Bloomberg
0%
20%
40%
60%
80%
100%
0
50
100
150
200
250
Jan-
15
Feb
-15
Feb
-15
Mar
-15
Mar
-15
Apr
-15
Apr
-15
Apr
-15
May
-15
May
-15
Jun-
15
Jun-
15
Jul-1
5
Jul-1
5
Aug
-15
Aug
-15
Sep
-15
Sep
-15
Sep
-15
Oct
-15
Oct
-15
Nov
-15
Nov
-15
Dec
-15
Dec
-15
Jan-
16
Jan-
16
Feb
-16
Feb
-16
Residences Dar Saada share price, target price and rating history
Buy Hold Sell Not covered Cov. in Trans.
Under Review Restricted Suspended Target Price Last Price

Renaissance Capital research team
Head of Research & Turkish Product Michael Harris +44 (203) 379-7982 [email protected]
Deputy Head of Research David Ferguson +7 (495) 641-4189 [email protected]
Head of Nigerian Research Adesoji Solanke +234 (1) 448-5300 x5384 [email protected]
Head of South African Research Johann Pretorius +27 (11) 750-1450 [email protected]
Name Telephone number Coverage Name Telephone number Coverage
Macro Oil and gas
Charles Robertson +44 (203) 379-7835 Global Ildar Davletshin +44 (203) 379-7954 EMEA
Yvonne Mhango +27 (11) 750-1488 Sub-Saharan Africa Temilade Aduroja +234 (1) 448-5300 x5363 Sub-Saharan Africa
Oleg Kouzmin +7 (495) 258-7770 x4506 Russia/CIS Evgeny Stroinov +7 (495) 258-7770 x4046 Russia/CIS
Equity strategy Metals and mining
Daniel Salter +44 (203) 379-7824 Global Johann Pretorius +27 (11) 750-1450 South Africa
Michael Harris +44 (203) 379-7982 Turkey Steven Friedman +27 (11) 750-1481 South Africa
Charles Robertson +44 (203) 379-7835 Global Kabelo Moshesha +27 (11) 750-1472 South Africa
Vikram Lopez +44 (203) 379-7974 x8974 Global Vladimir Sklyar +7 (495) 258-7770 x4624 Russia/CIS
Anastasia Burkhanova +7 (495) 258-7770 x4594 Russia/CIS
Financials
Armen Gasparyan +7 (495) 783-5673 Russia, CEE Real estate
Ilan Stermer +27 (11) 750-1482 South Africa Seki Mutukwa +44 (203) 379-7736 Sub-Saharan Africa/MENA
Francois Du Toit +27 (21) 855-2896 South Africa
Adesoji Solanke +234 (1) 448-5300 x5384 Sub-Saharan Africa Telecoms/Transportation
Olamipo Ogunsanya +234 (1) 448-5300 x5368 Sub-Saharan Africa Alexander Kazbegi +41 (78) 883-4527 Global
Seki Mutukwa +44 (203) 379-7736 Sub-Saharan Africa/MENA Artem Yamschikov +7 (495) 258-7770 x7511 Russia/CIS
Omair Ansari +234 (1) 448-5329 CEE Amine Wafy +971 (4) 409-2052 MENA
Consumer/Retail/Agriculture Media/Technology/
David Ferguson +7 (495) 641-4189 Russia/CIS, Africa David Ferguson +7 (495) 641-4189 Russia/CIS, Africa
Kirill Panarin +7 (495) 258-7770 x4009 Russia/CIS, Africa Kirill Panarin +7 (495) 258-7770 x4009 Russia/CIS, Africa
Zaheer Joosub +27 (11) 750-1427 South Africa Ahmed Motara +27 (11) 750-1458 South Africa
Omair Ansari +234 (1) 448-5329 Sub-Saharan Africa/CEE
Olaloye Oyawoye +234 (1) 448-5300 x5377 Sub-Saharan Africa/CEE Fertilisers
Robyn Collins +27 (11) 750-1480 South Africa Vladimir Sklyar +7 (495) 258-7770 x4624 Russia/CIS/MENA/Pakistan
Mohamed Zein +971 (4) 409-2032 MENA Anastasia Burkhanova +7 (495) 258-7770 x4594 Russia/CIS/MENA/Pakistan
Diversified/Industrials Utilities/Electric Equipment
Seki Mutukwa +44 (203) 379-7736 Sub-Saharan Africa/MENA Vladimir Sklyar +7 (495) 258-7770 x4624 Russia/CIS/SSA/Pakistan
Brent Madel +27 (11) 750-1160 South Africa Anastasia Tikhonova +7 (495) 258-7770 x4078 Russia/CIS/SSA/Pakistan
Renaissance Capital research is available via the following platforms: Renaissance research portal: research.rencap.com Bloomberg: RENA <GO> Capital IQ: www.capitaliq.com
Thomson Reuters: thomsonreuters.com/financial Factset: www.factset.com

Renaissance Capital Moscow T + 7 (495) 258 7777
Renaissance Capital Ltd. London T + 44 (203) 379 7777
Renaissance Capital Johannesburg T +27 (11) 750 1400
Renaissance Securities (Cyprus) Ltd. Nicosia T + 357 (22) 505 800
Renaissance Securities (Nigeria) Ltd. Lagos T +234 (1) 448 5300
Renaissance Capital Nairobi T +254 (20) 368 2000
Renaissance Capital Istanbul T +90 (212) 362 3500
Renaissance Capital Dubai T +971 (4) 409 2000
© 2016 Renaissance Securities (Cyprus) Limited, an indirect subsidiary of Renaissance Financial Holdings Limited ("Renaissance Capital"), which together with other subsidiaries operates outside of the USA under the brand name of Renaissance Capital, for contact details see Bloomberg page RENA, or contact the relevant office. All rights reserved. This document and/or information has been prepared by and, except as otherwise specified herein, is communicated by Renaissance Securities (Cyprus) Limited, regulated by the Cyprus Securities and Exchange Commission (License No: KEPEY 053/04). The RenCap-NES Leading GDP Indicator is a model that seeks to forecast GDP growth and was developed by and is the exclusive property of Renaissance Capital and the New Economic School (e-mail: [email protected]).
This document is for information purposes only. The information presented herein does not comprise a prospectus of securities for the purposes of EU Directive 2003/71/EC or Federal Law No. 39-FZ of 22 April 1994 (as amended) of the Russian Federation "On the Securities Market". Any decision to purchase securities in any proposed offering should be made solely on the basis of the information to be contained in the final prospectus published in relation to such offering. This document does not form a fiduciary relationship or constitute advice and is not and should not be construed as an offer, or a solicitation of an offer, or an invitation or inducement to engage in investment activity, and cannot be relied upon as a representation that any particular transaction necessarily could have been or can be effected at the stated price. This document is not an advertisement of securities. Opinions expressed herein may differ or be contrary to opinions expressed by other business areas or groups of Renaissance Capital as a result of using different assumptions and criteria. All such information and opinions are subject to change without notice, and neither Renaissance Capital nor any of its subsidiaries or affiliates is under any obligation to update or keep current the information contained herein or in any other medium.
Descriptions of any company or companies or their securities or the markets or developments mentioned herein are not intended to be complete. This document and/or information should not be regarded by recipients as a substitute for the exercise of their own judgment as the information has no regard to the specific investment objectives, financial situation or particular needs of any specific recipient. The application of taxation laws depends on an investor’s individual circumstances and, accordingly, each investor should seek independent professional advice on taxation implications before making any investment decision. The information and opinions herein have been compiled or arrived at based on information obtained from sources believed to be reliable and in good faith. Such information has not been independently verified, is provided on an ‘as is’ basis and no representation or warranty, either expressed or implied, is provided in relation to the accuracy, completeness, reliability, merchantability or fitness for a particular purpose of such information and opinions, except with respect to information concerning Renaissance Capital, its subsidiaries and affiliates. All statements of opinion and all projections, forecasts, or statements relating to expectations regarding future events or the possible future performance of investments represent Renaissance Capital’s own assessment and interpretation of information available to them currently.
The securities described herein may not be eligible for sale in all jurisdictions or to certain categories of investors. Options, derivative products and futures are not suitable for all investors and trading in these instruments is considered risky. Past performance is not necessarily indicative of future results. The value of investments may fall as well as rise and the investor may not get back the amount initially invested. Some investments may not be readily realisable since the market in the securities is illiquid or there is no secondary market for the investor’s interest and therefore valuing the investment and identifying the risk to which the investor is exposed may be difficult to quantify. Investments in illiquid securities involve a high degree of risk and are suitable only for sophisticated investors who can tolerate such risk and do not require an investment easily and quickly converted into cash. Foreign-currency-denominated securities are subject to fluctuations in exchange rates that could have an adverse effect on the value or the price of, or income derived from, the investment. Other risk factors affecting the price, value or income of an investment include but are not necessarily limited to political risks, economic risks, credit risks, and market risks. Investing in emerging markets such as Russia, other CIS, African or Asian countries and emerging markets securities involves a high degree of risk and investors should perform their own due diligence before investing.
Excluding significant beneficial ownership of securities where Renaissance Capital has expressed a commitment to provide continuous coverage in relation to an issuer or an issuer’s securities, Renaissance Capital and its affiliates, their directors, representatives, employees (excluding the US broker-dealer unless specifically disclosed), or clients may have or have had interests in the securities of issuers described in the Investment Research or long or short positions in any of the securities mentioned in the Investment Research or other related financial instruments at any time and may make a purchase and/or sale, or offer to make a purchase and/or sale, of any such securities or other financial instruments from time to time in the open market or otherwise, in each case as principals or as agents. Where Renaissance Capital has not expressed a commitment to provide continuous coverage in relation to an issuer or an issuer’s securities, Renaissance Capital and its affiliates (excluding the US broker-dealer unless specifically disclosed) may act or have acted as market maker in the securities or other financial instruments described in the Investment Research, or in securities underlying or related to such securities. Employees of Renaissance Capital or its affiliates may serve or have served as officers or directors of the relevant companies. Renaissance Capital and its affiliates may have or have had a relationship with or provide or have provided investment banking, capital markets, advisory, investment management, and/or other financial services to the relevant companies, and have established and maintain information barriers, such as ‘Chinese Walls’, to control the flow of information contained in one or more areas of Renaissance Capital, into other areas, units, groups or affiliates of the Firm.
The information herein is not intended for distribution to the public and may not be reproduced, redistributed
or published, in whole or in part, for any purpose without the written permission of Renaissance Capital, and neither Renaissance Capital nor any of its affiliates accepts any liability whatsoever for the actions of third parties in this respect. This information may not be used to create any financial instruments or products or any indices. Neither Renaissance Capital and its affiliates, nor their directors, representatives, or employees accept any liability for any direct or consequential loss or damage arising out of the use of all or any part of the information herein
Bermuda: Neither the Bermuda Monetary Authority nor the Registrar of Companies of Bermuda has
approved the contents of this document and any statement to the contrary, express or otherwise, would constitute a material misstatement and an offence.
EEA States: Distributed by Renaissance Securities (Cyprus) Limited, regulated by Cyprus Securities and Exchange Commission, or Renaissance Capital Limited, member of the London Stock Exchange and regulated in the UK by the Financial Conduct Authority (“FCA”) in relation to designated investment business (as detailed in the FCA rules).
Cyprus: Except as otherwise specified herein the information herein is not intended for, and should
not be relied upon by, retail clients of Renaissance Securities (Cyprus) Limited. The Cyprus Securities and Exchange Commission Investor Compensation Fund is available where Renaissance Securities (Cyprus) Limited is unable to meet its liabilities to its retail clients, as specified in the Customer Documents Pack.
UAE: Approved for distribution in the Dubai International Financial Centre by Renaissance Capital
(Dubai) Ltd which is regulated by the Dubai Financial Services Authority (“DFSA”). Material is intended only for persons who meet the criteria for Professional Clients under the Rules of the DFSA and no other person should act upon it.
United Kingdom: Approved and distributed by Renaissance Capital Limited only to persons who are eligible counterparties or professional clients (as detailed in the FCA Rules). The information herein does not apply to, and should not be relied upon by, retail clients; neither the FCA’s protection rules nor compensation scheme may be applied.
Kenya: Distributed by Renaissance Capital (Kenya) Limited, regulated by the Capital Markets
Authority.
Nigeria: Distributed by RenCap Securities (Nigeria) Limited, authorised dealing member of The
Nigerian Stock Exchange, or Renaissance Securities (Nigeria) Limited, entities regulated by the Securities and Exchange Commission.
Russia: Distributed by Renaissance Broker Limited or Renaissance Online Limited, entities regulated
by the Bank of Russia.
South Africa: Distributed by Rencap Securities (Proprietary) Limited, an authorised Financial
Services Provider and member of the JSE Limited. The information contained herein is intended for Institutional investors only.
Turkey: Distributed by Renaissance Capital Menkul Degerler A.S. - Warning Note Published Pursuant to the “Communiqué on Principles Regarding Investment Services, Activities and Ancillary Services” by the Capital Markets Board: “The investment information, comments and advices given herein are not part of investment advisory activity. Investment advisory services are provided by authorized institutions to persons and entities privately by considering their risk and return preferences. Whereas the comments and advices included herein are of general nature. Therefore, they may not fit to your financial situation and risk and return preferences. For this reason, making an investment decision only by relying on the information given herein may not give rise to results that fit your expectations.”
United States: Distributed in the United States by RenCap Securities, Inc., member of FINRA and
SIPC, or by a non-US subsidiary or affiliate of Renaissance Financial Holdings Limited that is not registered as a US broker-dealer (a "non-US affiliate"), to major US institutional investors only. RenCap Securities, Inc. accepts responsibility for the content of a research report prepared by another non-US affiliate when distributed to US persons by RenCap Securities, Inc. Although it has accepted responsibility for the content of this research report when distributed to US investors, RenCap Securities, Inc. did not contribute to the preparation of this report and the analysts authoring this are not employed by, and are not associated persons of, RenCap Securities, Inc. Among other things, this means that the entity issuing this report and the analysts authoring this report are not subject to all the disclosures and other US regulatory requirements to which RenCap Securities, Inc. and its employees and associated persons are subject. Any US person receiving this report who wishes to effect transactions in any securities referred to herein should contact RenCap Securities, Inc., not its non-US affiliate. RenCap Securities, Inc. is a subsidiary of Renaissance Financial Holdings Limited and forms a part of a group of companies operating outside of the United States as "Renaissance Capital." Contact: RenCap Securities, Inc., 780 Third Avenue, 20th Floor, New York, New York 10017, Telephone: +1 (212) 824-1099.
Other distribution: The distribution of this document in other jurisdictions may be restricted by law
and persons into whose possession this document comes should inform themselves about, and observe, any such restriction.
Additional information (including information about the RenCap-NES Leading GDP Indicator) and supporting documentation is available upon request.
Renaissance Capital equity research disclosures (SA stocks)