Embed Size (px)
Citation preview

MMA The Power of Independence
Page 1
MMA The Power of Independence
MUNICIPALS: POST SUB-PRIME, BAB’s & WHITNEY
Thomas G. Doe, Founder and CEOOctober 6, 2011
www. mma-research.com

MMA The Power of Independence
Page 2
2 Year 5 Year 10 Year 15 Year 20 Year 25 Year 30 Year
Average TRR ('83-'10) 4.14% 5.20% 6.41% 7.32% 7.82% 8.08% 8.22%
2011 0.96% 2.98% 7.19% 8.52% 9.93% 10.35% 11.19%
0%
2%
4%
6%
8%
10%
12%
TRR
%MMA Total Rate of Return (TRR): 2011 v. Average
Average TRR ('83-'10) 2011

MMA The Power of Independence
Page 3
$275
$178$206
$283
$394 $389 $401
$234
$0
$75
$150
$225
$300
$375
$450
$525
2.50
3.00
3.50
4.00
4.50
5.00
5.50
6.00 Avg. A
nnual Issuance ($B's)
Yiel
d (%
)
Average MMA AAA Municipal 10-Year Yieldvs. Annual Total Issuance (By Era of Demand)
Annual Average Average 10-Year Yield

MMA The Power of Independence
Page 4
$ Qtr % Qtr % AnnHouseholds 1,049 37% 1089 37% 1066 37% (22) -2% 2%Money Funds 352 12% 321 11% 306 11% (15) -5% -13%Mutual Funds 522 18% 523 18% 528 18% 5 1% 1%Closed End Fds 81 3% 80 3% 80 3% - 0% -2%Non-Fin. Cos. 20 1% 20 1% 20 1% (1) -3% -2%Banks 231 8% 263 9% 270 9% 7 3% 17%Broker Dealers 35 1% 37 1% 41 1% 4 10% 16%Prop/Cas. Ins. 359 13% 350 12% 348 12% (2) 0% -3%Life Insurers 91 3% 115 4% 116 4% 1 1% 28%GSEs and Gov'ts 27 1% 24 1% 23 1% (1) -4% -16%Foreign Buyers 65 2% 75 3% 77 3% 2 3% 19%Total 2,859 100% 2,908 100% 2,886 100% (22) -1% 1%
Ownership of Muni Bonds by Investor Segment
Investor Segment
$ Outstanding ($Bn) Change
2q10 1q11 2q11

MMA The Power of Independence
Page 5
1-5 6-10 11-20 21-40 40+
2008 46.0 24.8 13.6 7.3 8.3
2009 50.3 21.3 10.7 8.0 9.7
2010 53.1 18.6 11.5 8.0 8.8
0.0
10.0
20.0
30.0
40.0
50.0
60.0
Perc
ent
Percent of Customer Trades by Tiers of Dealer Volume
2008 2009 2010 Source: MSRB

MMA The Power of Independence
Page 6
Tax-Exempt Total 2007 (#) 2010 (#) 2010 vs. 2007 (% Change)0-$25,000 12,425 17,259 38.9%$25,001-$50,000 5,725 7,025 22.7%$50,001-$75,000 1,353 1,477 9.2%$75,001-$100,000 3,291 3,038 -7.7%$100,001-$500,000 5,434 4,382 -19.4%$500,001-$1,000,000 1,231 788 -36.0%$1,000,001-$2,000,000 785 467 -40.5%$2,000,000+ 1,499 846 -43.6%
Comparison of Number of Tax-Exempt Municipal Transactions by Trade Size: 2007-2010

MMA The Power of Independence
Page 7
90%
3%7%
Breakdown of Outstanding Municipals (%)
Investment Grade from atLeast One Agency
Below Investment Grade
Unrated
Source: Bloomberg

MMA The Power of Independence
Page 8
1.802.002.202.402.602.803.003.203.40
4.204.404.604.805.005.205.405.605.80
Mar-10 Jun-10 Sep-10 Dec-10 Mar-11 Jun-11
Wake Co., N
C Sa
lt R
iver
Salt River AZ 5's '35 v. Wake Co., NC 5's '20Yield Comparison (YTM): March 2010 to August 2011
Salt River (79575DUJ7) Wake Co (930863R23)Source: IDC, Bloomberg

MMA The Power of Independence
Page 9
30yr2010 MMA: 5% MMD
LMIS: (Barclays): Long-Term Salt River, AZ
MMA: PAR 0.97 0.95 0.95 0.94MMA: 5% 0.99 0.97 0.96MMD 0.99 0.98LMIS: Long 0.99
30yr2011 MMA: 5% MMD
LMIS: (Barclays): Long-Term Salt River, AZ
MMA: PAR 0.99 0.99 0.98 0.92MMA: 5% 1.00 1.00 0.94MMD 1.00 0.93LMIS: Long 0.95

MMA The Power of Independence
Page 10
Jan Feb Mar Apr May Jun Jul Aug Sep*
TOB Issuance $0.81 $1.50 $1.57 $0.49 $1.35 $1.72 $1.75 $2.61 $6.00
% of Primary Issuance 6% 9% 8% 3% 7% 5% 8% 12% 24%
0.0%
5.0%
10.0%
15.0%
20.0%
25.0%
30.0%
$0.0
$1.5
$3.0
$4.5
$6.0
$7.5
$9.0 TOB %
Primary IssuanceTO
B Cr
eati
on P
ar ($
B's)
Monthly TOB Creation ($B's) vs. % of Primary Issuance
TOB Issuance % of Primary Issuance Source: Bloomberg* Estimated

MMA The Power of Independence
Page 11
“What we’re going to ask our examiners to ask our banks…do you know what you’re holding? What do you have? How do you break it down?”
-- OCC’s Director for Market Risk Policy
MMA The Power of Independence
Page 12
Sector SEP All Notices DEFAULT Support OtherALL $5,680 (74) $36,270 (649) $8,753 (320) $19,223 (211) $8,294 (118)Land Secured $410 (22) $4,633 (260) $2,757 (149) $1,618 (101) $258 (10)Tribal none $940 (4) $940 (4) none noneIDB $125 (5) $1,230 (34) $919 (16) $301 (16) $11 (2)Toll Road/Transit $541 (2) $4,666 (7) $889 (4) $1,419 (1) $2,358 (2)Retirement $402 (8) $2,222 (67) $713 (27) $285 (10) $1,224 (30)Housing $189 (11) $829 (70) $676 (53) $85 (9) $67 (8)Hotel $125 (3) $715 (13) $422 (8) $194 (4) $98 (1)Other Risky Sectors $263 (12) $13,502 (142) $1,410 (55) $10,374 (51) $1,718 (36)Safe Sectors (GO,Wtr/Swr,SalesTx) $3,626 (11) $7,534 (52) $26 (4) $4,947 (19) $2,561 (29)Initially Non-Rated Bonds $1,170 (51) $10,753 (462) $5,988 (267) $2,921 (136) $1,843 (59)Initially Insured/LOC Bonds $4,008 (7) $14,453 (87) $541 (5) $9,207 (47) $4,705 (35)
Initially Rated, Uninsured Bonds $455 (14) $10,183 (57) $1,699 (21) $6,881 (22) $1,602 (14)
Par (and #) of Outstanding Muni Bonds With an Uncured Default, Reserve Draw, or Other Impairment ($MM)
MMA The Power of Independence
Page 13
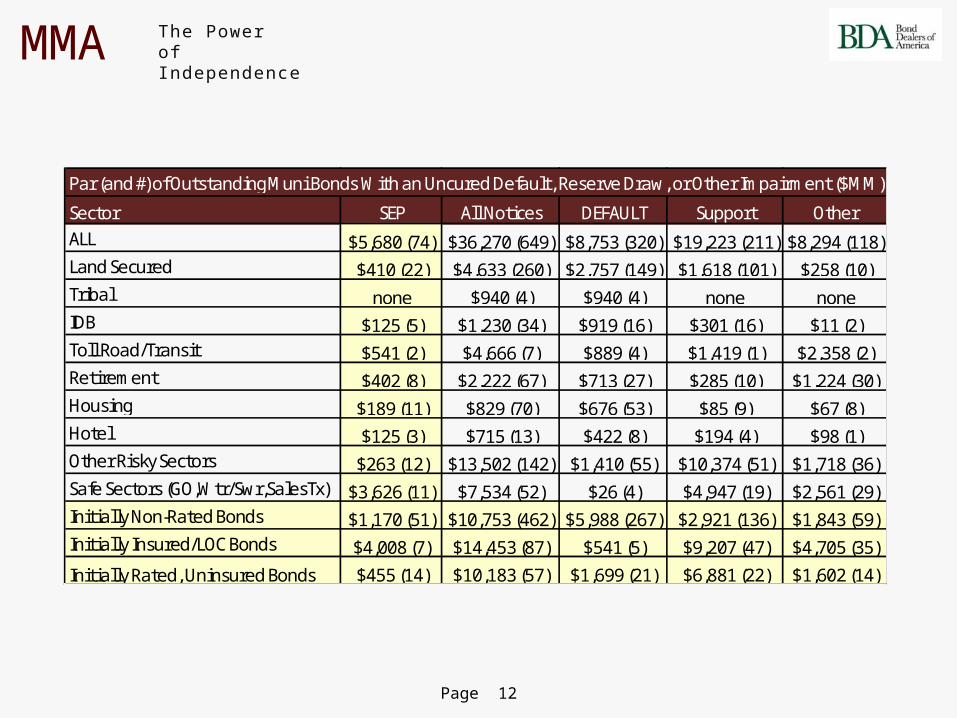
GASB Initiative
Expected to provide additional information on pension funding and some standardization in calculations.
Discount Rate While there are plan assets: an expected rate of return on plan investments as
recommended by actuary based on actual returns of the plan. After plan assets depleted: based on a high quality municipal bond index rate.
Attribution Method Single method to be utilized.
Based on entry age normal principles; Level percentage of payroll. Beginning in first period employee’s services lead to benefits and ending in
last period of service. Increased Transparency
Net Pension Liability to be in financial statements. More disclosures in notes, including actuarial assumptions. 10 years of information in requirement supplementary section.

MMA The Power of Independence
Page 14
$26.8$30.4 $32.1
$35.2 $37.1
$30.4 $31.3
$37.0
$43.7$47.6
$0.0
$5.0
$10.0
$15.0
$20.0
$25.0
$30.0
$35.0
$40.0
$45.0
$50.0
2010 2011 2012 2013 2014
Estimates of the Cost of the Municipal Tax-Exemption ($B's)
JCT ($B's) Treasury/OMB ($B's)

MMA The Power of Independence
Page 15
Four Critical Themes for the Balance of 2011 & 2012:
Credit Risks Garnering Increased State and Federal Regulatory Interest Amid Ratings Ambiguity.
Illiquidity and Poor Price Discovery Prompting Scrutiny of Evaluation Processes.
Issuers’ Ability to Sustain Fiscal Discipline and……
….Defend the Value of the Tax-Exemption.