Embed Size (px)
Citation preview
MLP Investment Company
KYN Annual ReportNovember 30, 2016

CONTENTS
Page
Letter to Stockholders . . . . . . . . . . . . . . . . . . . . . . . . . . . . . . . . . . . . . . . . . . . . . . . . . . . . . . . . . . . . . . . . . . . . 1
Portfolio Summary . . . . . . . . . . . . . . . . . . . . . . . . . . . . . . . . . . . . . . . . . . . . . . . . . . . . . . . . . . . . . . . . . . . . . . 6
Management Discussion . . . . . . . . . . . . . . . . . . . . . . . . . . . . . . . . . . . . . . . . . . . . . . . . . . . . . . . . . . . . . . . . . . 8
Schedule of Investments . . . . . . . . . . . . . . . . . . . . . . . . . . . . . . . . . . . . . . . . . . . . . . . . . . . . . . . . . . . . . . . . . . 13
Statement of Assets and Liabilities . . . . . . . . . . . . . . . . . . . . . . . . . . . . . . . . . . . . . . . . . . . . . . . . . . . . . . . . . 16
Statement of Operations . . . . . . . . . . . . . . . . . . . . . . . . . . . . . . . . . . . . . . . . . . . . . . . . . . . . . . . . . . . . . . . . . . 17
Statement of Changes in Net Assets Applicable to Common Stockholders . . . . . . . . . . . . . . . . . . . . . . . . . . 18
Statement of Cash Flows . . . . . . . . . . . . . . . . . . . . . . . . . . . . . . . . . . . . . . . . . . . . . . . . . . . . . . . . . . . . . . . . . 19
Financial Highlights . . . . . . . . . . . . . . . . . . . . . . . . . . . . . . . . . . . . . . . . . . . . . . . . . . . . . . . . . . . . . . . . . . . . . 20
Notes to Financial Statements . . . . . . . . . . . . . . . . . . . . . . . . . . . . . . . . . . . . . . . . . . . . . . . . . . . . . . . . . . . . . 24
Report of Independent Registered Public Accounting Firm . . . . . . . . . . . . . . . . . . . . . . . . . . . . . . . . . . . . . . 45
Privacy Policy Notice . . . . . . . . . . . . . . . . . . . . . . . . . . . . . . . . . . . . . . . . . . . . . . . . . . . . . . . . . . . . . . . . . . . . 46
Dividend Reinvestment Plan . . . . . . . . . . . . . . . . . . . . . . . . . . . . . . . . . . . . . . . . . . . . . . . . . . . . . . . . . . . . . . 48
Information Concerning Directors and Corporate Officers . . . . . . . . . . . . . . . . . . . . . . . . . . . . . . . . . . . . . . . 51
Annual Certification . . . . . . . . . . . . . . . . . . . . . . . . . . . . . . . . . . . . . . . . . . . . . . . . . . . . . . . . . . . . . . . . . . . . . 54
Proxy Voting and Portfolio Holdings Information . . . . . . . . . . . . . . . . . . . . . . . . . . . . . . . . . . . . . . . . . . . . . . 54
Repurchase Disclosure . . . . . . . . . . . . . . . . . . . . . . . . . . . . . . . . . . . . . . . . . . . . . . . . . . . . . . . . . . . . . . . . . . . 54
CAUTIONARY NOTE REGARDING FORWARD-LOOKING STATEMENTS: This report ofKayne Anderson MLP Investment Company (“the Company”) contains “forward-looking statements” as definedunder the U.S. federal securities laws. Generally, the words “believe,” “expect,” “intend,” “estimate,”“anticipate,” “project,” “will” and similar expressions identify forward-looking statements, which generally arenot historical in nature. Forward-looking statements are subject to certain risks and uncertainties that could causeactual results to materially differ from the Company’s historical experience and its present expectations orprojections indicated in any forward-looking statements. These risks include, but are not limited to, changes ineconomic and political conditions; regulatory and legal changes; master limited partnership (“MLP”) industryrisk; leverage risk; valuation risk; interest rate risk; tax risk; and other risks discussed in the Company’s filingswith the Securities and Exchange Commission (“SEC”). You should not place undue reliance on forward-lookingstatements, which speak only as of the date they are made. The Company undertakes no obligation to update orrevise any forward-looking statements made herein. There is no assurance that the Company’s investmentobjectives will be attained.

KAYNE ANDERSON MLP INVESTMENT COMPANYLETTER TO STOCKHOLDERS
January 20, 2017
Dear Fellow Stockholders:
It is difficult to describe how pleased I am to have 2016 behind us. While it was a very successful year forthe Company in terms of performance, it was also an extremely challenging year, especially during the firstquarter of 2016. Since the most difficult days of January and February of 2016, the market has improvedmaterially, and I am confident in saying that the worst is clearly behind us. When I wrote last year’s letter, theAlerian MLP index, or AMZ, had already declined 19% for the fiscal year, and it would go on to decline another18% to an intraday low of 199 on February 11th. On that day, crude oil prices also hit a muti-year low of $26 perbarrel, nearly $10 below the lowest price we saw during the 2008–2009 financial crisis. At the same time, as wenoted in last year’s letter, investors were asking some very serious questions about the continued viability of theMLP model. While we did not agree with many of the prevailing concerns, the MLP market was indeed facingsome very real challenges. Over the course of the past 12 months, most of the fears that investors had about theMLP market have been allayed.
As we turn the page to 2017, we start the year with an optimistic outlook. Despite the recovery we’ve seenthus far (the AMZ is up 61% since its low last February), we believe that the MLP market continues to present anattractive value proposition. The outlook for the domestic energy industry is much improved, which bodes wellfor the MLP sector. Further, we expect the new administration to be much more accommodating towards thedevelopment of additional energy infrastructure. As we will discuss in more detail in this letter, some potentialheadwinds exist for the MLP sector, but we believe these challenges are manageable. We, like everyone else, arecarefully watching the new administration’s actions to get a better sense of its proposed policies – in particular asthey relate to potential tax reform. It is too early to say with certainty what the next four years in Washington willbring, but our expectation is that it will bring more positives than negatives for MLPs. With all of these factorstaken into consideration, we believe the next few years will provide a very constructive backdrop for thedomestic energy industry and the MLP sector.
Performance Review
Coming off of a very challenging 2015, which was one of the worst years in the Company’s history, we arepleased to report that the Company performed very well in fiscal 2016. From the lows in February, our net assetvalue per share increased by over 70%. For the fiscal year, our Net Asset Value Return, which is equal to thechange in net asset value per share plus the cash distributions paid during the period (assuming reinvestmentthrough our dividend reinvestment program) was 14.6%. During the same period, the total return of the AMZwas 9.3%. We are very pleased to have outperformed the AMZ by such a wide margin during fiscal 2016, and webelieve that the Company’s portfolio is well positioned to outperform as market conditions continue to improve.Another measure of the Company’s performance is Market Return (share price change plus reinvesteddividends), which was 24.1% for fiscal 2016. This measure exceeded our Net Asset Value Return, as our stockprice moved from trading at a 5% discount to NAV at the beginning of the year to trading at a 3% premium toNAV at the end of the year.
In addition to generating a strong return for the year, I am also proud of how our team navigated a verychallenging market. During the first three months of fiscal 2016, we experienced extreme volatility and veryrapid declines in the market. In response, we prudently sold securities to raise cash and decrease the Company’sleverage levels. During the first quarter of fiscal 2016, the Company redeemed $264 million of notes and$60 million of mandatory redeemable preferred stock (MRPS). While we never want to be forced to de-lever, wewere able to strategically redeem notes and MRPS in such a way that we maintained compliance with ourleverage covenants and avoided a significant amount of early redemption penalties. As a result of our experiencethrough this downturn, we increased our asset coverage targets as the market recovered to ensure that the
1

KAYNE ANDERSON MLP INVESTMENT COMPANYLETTER TO STOCKHOLDERS
Company has more downside protection in the event of future market declines. Currently, our leverage levels arein line with these new targets.
In spite of the difficult energy market during the year, I’m happy to report that we were able to continue tosuccessfully access the capital markets. We were successful in refinancing the Company’s revolving creditfacility during February, which was a very tough banking market for energy companies given crude oil priceswere at their lows and many banks were expecting widespread defaults in the energy sector. In September, wewere able to take advantage of very low interest rates and issue $50 million of MRPS to partially refinance someof our existing MRPS that were coming due.
Finally, as we noted in last year’s letter, we made the difficult decision to reduce the Company’s distributionfrom $0.6575 per share to $0.55 per share, starting with the distribution paid in January 2016. We detailed thereasons for this reduction last year, but as a reminder, the primary drivers were the Kinder Morgan distributioncut, our deleveraging activity (selling higher yielding securities to redeem lower-cost leverage) and mergeractivity in which lower yielding entities acquired higher yielding entities (resulting in lower distributions for theholders of the higher yielding entities). This last phenomenon, which we refer to as “back-door distribution cuts,”is a trend that has continued. In fact, the most recent example, the merger between Sunoco Logistics and EnergyTransfer, was announced at the end of November 2016 and has yet to close. We will discuss further the impact ofback-door distribution cuts on our future distributions later in the letter.
Overall, it was a good year for the Company in terms of both relative and absolute performance. We believethe actions that we took with the distribution and the balance sheet were prudent and necessary. The Company ison sound financial footing and well positioned to capitalize on attractive investment opportunities.
MLP Market — Year in Review
If one was to look at the MLP market only in terms of performance measured from the start of the year, itappears that fiscal 2016 was pretty uneventful. The AMZ started the year at 301 and finished at 303, and the totalreturn (including distributions) was 9%. However, the year was anything but normal. When the MLP marketreached the February low, it capped off a vicious, nearly 18-month downturn that saw the AMZ decline 63%from peak to trough. This downturn was longer and more severe than the 55% decline that the AMZ experiencedduring the 2008–2009 financial crisis. Moreover, the market displayed extreme volatility, especially in the firstquarter. By the end of our first fiscal quarter, there had been six moves of greater than 18% (up or down), withthe worst being the 28% decline between January 4th and January 20th (just 12 trading days).
So why did the MLP market fall so precipitously when MLPs are supposed to own stable energyinfrastructure assets? We spent the majority of last year’s letter detailing why we thought these steep declineswere not justified by the fundamentals in the market, but it is worth recapping some of what we wrote last yearand reviewing how things actually played out.
First, it is important to highlight, as we do in almost every annual letter, that MLPs generally do not havedirect exposure to crude oil prices. MLPs are primarily in the business of gathering, transporting and storingcrude oil, natural gas and natural gas liquids, or NGLs. Despite this fact, the decline in crude oil prices was by farthe biggest driver of the negative sentiment in the MLP market during the downturn, and we saw anunprecedented correlation between crude oil prices and MLP equity prices (this was the case for the broadermarket as well). This simply did not make sense, and thankfully, we have seen this correlation fall significantlyover the last six months.
While the MLP market should not have been trading so closely with crude oil, commodity prices (includingcrude oil) are important for the long-term health of the MLP market, as producers need an economic price toproduce the natural gas and oil that will supply the pipelines and storage assets owned by MLPs. As we describedin last year’s letter, we were convinced that crude oil prices were unsustainably low and that the fundamentals
2

KAYNE ANDERSON MLP INVESTMENT COMPANYLETTER TO STOCKHOLDERS
were in place for a recovery. Specifically, demand was projected to continue to grow, and producers weresignificantly reducing capital expenditures, resulting in projected declines in domestic crude oil production. Mostimportantly, the global “over-supply” was not very large at around 1-2% of demand, so we knew that the marketwould come back into balance in the near-term. Today, domestic oil production has declined from 9.6 to8.8 million barrels per day, and crude oil prices are trading in the $50–$55 per barrel range (double the Februarylow), as prices are now reflecting the rebalancing of supply and demand. Admittedly, OPEC helped out themarket in November by agreeing to cut production, but most experts believe this only accelerated the marketrebalancing by about six months. In the meantime, the industry still has excess crude oil inventories to workthrough, so we expect continued price recovery through 2017 and 2018.
A related point that we made in last year’s letter was that we expected MLP cash flows to be resilient, andthis played out as predicted. On average, the top 20 MLPs by market cap have grown their distributable cash flowon a per unit basis since the market peak in 2014. This performance is simply not consistent with the severedeclines in MLP equity prices during this downturn. The fact is that MLPs receive a substantial majority of theirrevenues in the form of fixed fees, and a significant portion of this revenue comes from “take-or-pay”arrangements whereby customers must pay whether or not they utilize the assets owned by MLPs. Furthermore,while certain assets within MLPs were challenged due to either lower volumes or lower prices (if not fee-based),many MLPs have become much more diversified across the midstream value chain and across producing basins.These more diversified MLPs benefitted during the downturn by offsetting weak parts of their asset portfoliowith new growth projects, cost cutting and in some cases, converting commodity sensitive contracts to fee-basedcontracts on very favorable terms.
The MLP model for many years has been to pay out all free cash flow and finance acquisitions and growthexpenditures in the capital markets. During the depths of the downturn, investors feared that the MLP “model”was broken. We asserted in last year’s letter that we did not think the model was broken and that we did notexpect the capital markets to shut down for any material amount of time. As it turned out, institutional investors,including Kayne Anderson, stepped in to provide private financing for MLPs like Plains All American, WesternGas and MPLX in early 2016, and the regular-way public equity markets re-opened to issuers in March. Duringcalendar 2016, there were 31 public equity offerings that raised over $7 billion and seven private placements,primarily in the form of convertible preferred equity, that raised $6 billion. As the year progressed, sentimentbegan to improve as management teams were very successful in cutting operating costs and delaying capitalexpenditures where possible, and as operating results continued to hold up better than expected.
As the market recovered, there were a few key themes that got investors excited about the MLP marketagain. First, investors pivoted with pretty amazing speed from being worried about midstream MLPsexperiencing significant declines in pipeline throughput (i.e. volumes) to focusing on the impact of productiongrowth in key domestic shale basins. This transition evolved as it became clear during 2016 that producers weredoing significantly more with less capital, and that domestic production would be more resilient than originallyexpected. In particular, as upstream companies reported results and provided guidance, it became evident that thecumulative effect of lower oilfield service costs, improved drilling efficiency (how quickly a well can be drilled)and improved completion techniques (the fracking “recipe” to maximize well productivity) had dramaticallylowered break-even prices (the commodity price needed by a producer to make an adequate return after spendingcapital). While many crude oil plays required prices in the $70 to $80 per barrel range in 2014 to be economic, by2016 it was clear that many areas could be drilled economically at $40 per barrel and below.
The most talked about area in the context of this trend has been the Permian Basin in west Texas andNew Mexico. In the Permian, producers have been aggressively acquiring acreage in the best areas, and thecapital markets have been wide open for these producers to raise equity capital to finance these acreageacquisitions. This is quite the turnaround from the widespread belief that there would be mass bankruptcies forupstream companies during 2016. There also has been a lot of excitement around the SCOOP/STACK in
3
KAYNE ANDERSON MLP INVESTMENT COMPANYLETTER TO STOCKHOLDERS
Oklahoma, and more recently, the core areas of the Bakken. These oil shale plays will be instrumental instemming the decline of domestic crude oil production, which we believe bottomed in late 2016, and facilitatingthe resumption of production growth. Clearly these technological advancements in the upstream will be verybeneficial for MLPs as well, especially for those MLPs with spare capacity on existing assets that will benefitfrom higher volumes with little incremental cost. Furthermore, this same dynamic is continuing to driveproduction growth for producers in natural gas plays like the Marcellus and Utica, and the MLPs that gather,process and transport this production will similarly benefit.
Another theme that received a lot of attention was the coming increase in ethane demand. Ethane makes upthe largest portion of the typical NGL barrel and is used primarily for the production of ethylene, which in turn isused by petrochemical companies to produce plastics. From 2017 through 2020, several world-scale ethanecrackers are slated to come on line, which should drive a step change in the demand for ethane in the U.S.Currently, the U.S. produces around 1.3 million barrels per day of ethane, and the vast majority of this productionis consumed domestically by petrochemical companies. As the new ethane crackers are placed in service,domestic demand will increase by 40–50% over the next few years. For those MLPs that own processing plants,NGL pipelines and NGL fractionators, this increase in demand represents a huge opportunity, which is expectedto be satisfied by increased domestic production and translate into higher utilization levels for midstream assets.
Some trends during 2016 were not so beneficial for MLPs and are contributing to some of the headwinds Imentioned earlier. First of all, we saw a much tougher regulatory environment in 2016. The poster child forincreased regulatory difficulty has been the Bakken Pipeline Project, which includes the Dakota Access Pipeline(DAPL). This project is being pursued by a consortium of midstream energy companies, including EnergyTransfer and Sunoco Logistics. Many of you have probably read news stories about DAPL protestors inNorth Dakota or seen protests on television or the internet (for example during a recent NFL game). In additionto garnering significant media attention, those who oppose projects like DAPL have become much moresophisticated in using the courts and the regulatory system to slow the approval process for new projects. Whilewe believe the Trump administration will be more accommodating and we expect DAPL to be completed during2017, we do not expect the opponents of fossil fuels to be any less zealous in attempting any and every way toslow or stop projects. Accordingly, the ultimate cost and timeline for announced projects will continue to bemore uncertain than it has been in the past.
Finally, I want to spend some time discussing “back-door distribution cuts,” a trend that continued in 2016and that we expect to continue into 2017 and beyond. As described above, these occur when an entity with arelatively lower yield acquires one with a relatively higher yield. The result of this kind of transaction is aneffective distribution cut for the owner of the higher yielding entity, because the premium received is typicallynot sufficient to overcome the lower distribution of the acquiring entity. Most of these transactions have eitherbeen “simplifications” in which a c-corp parent acquires its subsidiary MLP, or mergers between MLPs undercommon control (i.e. two MLPs with the same general partner). In fact, since the Kinder Morgan simplificationtransaction closed in November of 2014, there have been seven additional back-door cuts announced or closed,only one of which was a true third-party transaction. We have had serious concerns about the fairness of some ofthese transactions to the limited partners of the MLP relative to the general partner, and we believe that theindustry could benefit from more rigorous corporate governance with an eye toward protecting the interests ofthe limited partners.
The most recently announced transaction with a back-door cut is the proposed merger between SunocoLogistics and Energy Transfer, which will result in an initial distribution cut of 27% to the owners of EnergyTransfer. While the transaction consideration initially represented a 10% premium to Energy Transfer equityholders, that premium was wiped out by the trading performance of Sunoco Logistics after the deal wasannounced. We noted in our December press release for the fourth quarter distribution that we expected torecommend lowering our distribution for the first quarter by $0.07 to $0.08 per share, primarily as a result of this
4
KAYNE ANDERSON MLP INVESTMENT COMPANYLETTER TO STOCKHOLDERS
transaction (though the actual amount will depend on a variety of factors). In contrast to some of thesimplification transactions that resulted in back-door cuts, Plains All American and Williams Partners pursuedsimplification transactions whereby the MLP acquired the general partner and incentive distribution rights fromtheir respective parents (rather than a “roll-up” in which the c-corp parent acquires the subsidiary MLP).Although Plains and Williams also announced distribution cuts at the MLPs in conjunction with these “buy-in”transactions, the equity prices of the MLPs reacted more favorably than the roll-up transactions for a number ofreasons. First, because there is an explicit cut in the distribution at the MLP, we believe the boards of thesecompanies were forced to consider more carefully the value of the general partner’s incentive distribution rights(IDRs) post-cut, which resulted in a fairer deal for the MLP. Second, buy-in transactions do not result in ataxable transaction for either the MLP unitholders or c-corp parent shareholders. Finally, we believe the resultingMLP with no IDRs will enjoy a better valuation than a c-corp survivor of a roll-up simply because the MLP willnot be subject to entity-level taxation.
We expect to see simplifications continue. MPLX has recently announced its intention to buy-in its generalpartner and IDRs from Marathon Petroleum once MPLX has acquired all of the assets from Marathon that areintended for the MLP, and a number of other MLPs have publicly stated that they are evaluating what to do withtheir IDRs. As more MLPs pursue simplification, crafting a permanent solution to the IDR burden will eventuallybecome a competitive imperative for larger MLPs that have not addressed the issue.
Outlook
The outlook for MLPs into 2017 and beyond is very good. The worst part of the downturn is in the rearviewmirror, and once again, the MLP model has prevailed. Although the market is up an astounding 61% since theFebruary lows, we believe that there is still room for additional, meaningful price appreciation in the MLPmarket. Currently, the AMZ stands at 320 and yields 7.0%. With 10-year U.S. Treasury Bonds currently yielding2.47%, the MLP “spread to Treasuries” stands at 453 basis points. While this is much tighter than the 809 basispoint spread as of last year’s letter, it is still significantly higher than the long-term spread of ~300–350 basispoints. In addition, MLPs look very attractive relative to other yield alternatives, with Utilities yielding 3.6% andREITs yielding 4.6%, and also look compelling on traditional valuation metrics such as Enterprise Value toEBITDA and Price to Distributable Cash Flow multiples.
While we are optimistic for continued recovery in the MLP market, we expect that the rising tide will notnecessarily lift all boats. Exposure to the right basins, prudent management teams and strong balance sheets willbe the keys to success for individual MLPs. We believe our team is well situated to identify which MLPs will bethe best performers as the recovery continues to unfold.
We know that it has not been a pleasant experience enduring this downturn, but we sincerely believe thatpatient, long-term investors in the Company will be rewarded with very attractive returns over the next three tofive years. We appreciate your investment in the Company and look forward to executing on our business plan ofachieving high after-tax total returns by investing in MLPs and other midstream companies. We invite you tovisit our website at kaynefunds.com for the latest updates.
Sincerely,
Kevin S. McCarthyChairman of the Board of Directorsand Chief Executive Officer
5
KAYNE ANDERSON MLP INVESTMENT COMPANYPORTFOLIO SUMMARY
(UNAUDITED)
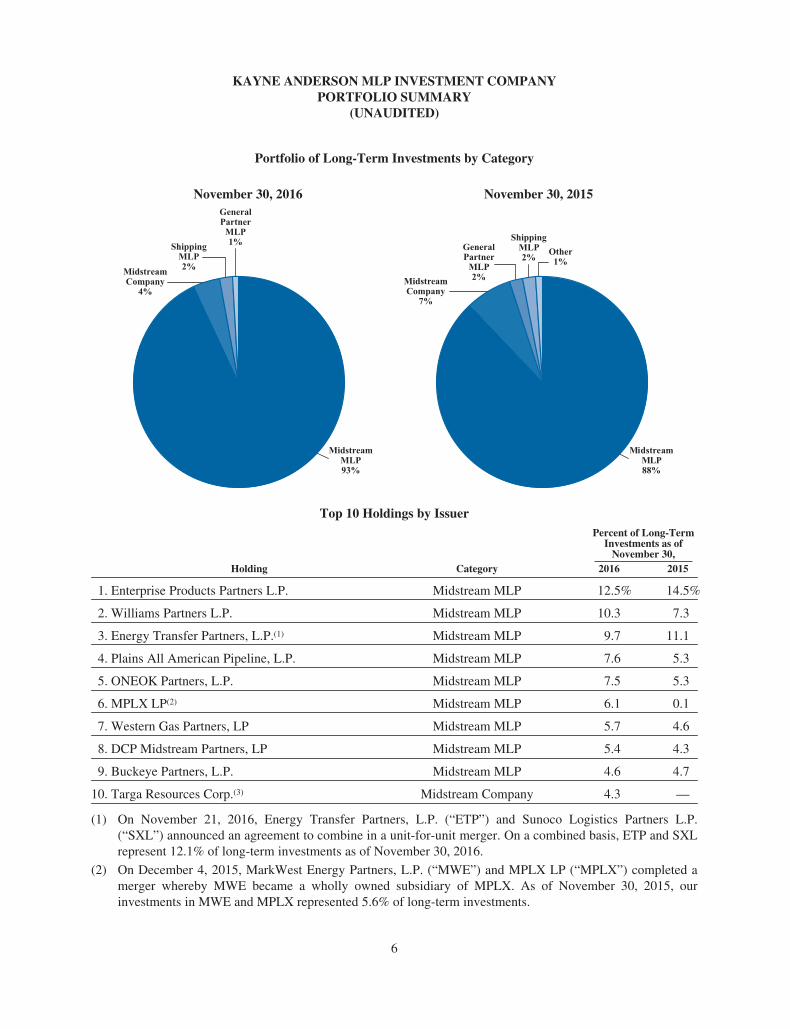
Portfolio of Long-Term Investments by Category
November 30, 2016 November 30, 2015
MidstreamCompany4%
MidstreamMLP93%
ShippingMLP2%
GeneralPartnerMLP1%
MidstreamCompany7%
MidstreamMLP88%
ShippingMLP2% Other
1%GeneralPartnerMLP2%
Top 10 Holdings by IssuerPercent of Long-Term
Investments as ofNovember 30,
Holding Category 2016 2015
1. Enterprise Products Partners L.P. Midstream MLP 12.5% 14.5%
2. Williams Partners L.P. Midstream MLP 10.3 7.3
3. Energy Transfer Partners, L.P.(1) Midstream MLP 9.7 11.1
4. Plains All American Pipeline, L.P. Midstream MLP 7.6 5.3
5. ONEOK Partners, L.P. Midstream MLP 7.5 5.3
6. MPLX LP(2) Midstream MLP 6.1 0.1
7. Western Gas Partners, LP Midstream MLP 5.7 4.6
8. DCP Midstream Partners, LP Midstream MLP 5.4 4.3
9. Buckeye Partners, L.P. Midstream MLP 4.6 4.7
10. Targa Resources Corp.(3) Midstream Company 4.3 —
(1) On November 21, 2016, Energy Transfer Partners, L.P. (“ETP”) and Sunoco Logistics Partners L.P.(“SXL”) announced an agreement to combine in a unit-for-unit merger. On a combined basis, ETP and SXLrepresent 12.1% of long-term investments as of November 30, 2016.
(2) On December 4, 2015, MarkWest Energy Partners, L.P. (“MWE”) and MPLX LP (“MPLX”) completed amerger whereby MWE became a wholly owned subsidiary of MPLX. As of November 30, 2015, ourinvestments in MWE and MPLX represented 5.6% of long-term investments.
6

KAYNE ANDERSON MLP INVESTMENT COMPANYPORTFOLIO SUMMARY
(UNAUDITED)
(3) On February 17, 2016, Targa Resources Corp. (“TRGP”) completed its acquisition of Targa ResourcesPartners LP (“NGLS”). As of November 30, 2015, our investment in NGLS represented 2.5% of long-terminvestments. As of that date we did not own any shares of TRGP.
7
KAYNE ANDERSON MLP INVESTMENT COMPANYMANAGEMENT DISCUSSION
(UNAUDITED)
Company Overview
Kayne Anderson MLP Investment Company is a non-diversified, closed-end fund that commencedoperations in September 2004. Our investment objective is to obtain a high after-tax total return by investing atleast 85% of our total assets in energy-related master limited partnerships and their affiliates (“MLPs”) and inother companies that operate assets used in the gathering, transporting, processing, storing, refining, distributing,mining or marketing of natural gas, natural gas liquids, crude oil, refined petroleum products or coal (collectivelywith MLPs, “Midstream Energy Companies”).
As of November 30, 2016, we had total assets of $3.9 billion, net assets applicable to our commonstockholders of $2.2 billion (net asset value of $19.18 per share), and 113.7 million shares of common stockoutstanding.
Our investments are principally in equity securities issued by MLPs, but we also may invest in debtsecurities of MLPs and equity/debt securities of other Midstream Energy Companies. As of November 30, 2016,we held $3.9 billion in equity investments and no debt investments.
Results of Operations — For the Three Months Ended November 30, 2016
Investment Income. Investment income totaled $7.2 million for the quarter. We received $75.3 million ofdividends and distributions, of which $66.1 million was treated as return of capital and $2.0 million was treatedas distributions in excess of cost basis. Interest income was $0.01 million. We also received $1.2 million ofpaid-in-kind dividends during the quarter, which are not included in investment income, but are reflected as anunrealized gain.
Operating Expenses. Operating expenses totaled $26.7 million, including $13.3 million of investmentmanagement fees, $7.4 million of interest expense, $5.1 million of preferred stock distributions and $0.9 millionof other operating expenses. Interest expense includes $0.4 million of non-cash amortization of debt issuancecosts. Preferred stock distributions include $1.2 million of non-cash amortization and write-off of offering costs.
Net Investment Loss. Our net investment loss totaled $13.8 million and included a current tax expense of$1.4 million and a deferred tax benefit of $7.1 million.
Net Realized Losses. We had net realized losses from our investments of $1.8 million, consisting ofrealized losses from long term investments of $2.3 million, $0.2 million of realized gains from option activity, acurrent tax benefit of $1.4 million and a deferred tax expense of $1.1 million.
Net Change in Unrealized Gains. We had a net increase in our unrealized gains of $63.3 million. The netchange consisted of a $102.0 million increase in our unrealized gains on investments, $0.1 million of unrealizedlosses from option activity and a deferred tax expense of $38.6 million.
Net Increase in Net Assets Resulting from Operations. We had an increase in net assets resulting fromoperations of $47.7 million. This increase was comprised of a net investment loss of $13.8 million, net realizedlosses of $1.8 million and a net increase in unrealized gains of $63.3 million, as noted above.
Results of Operations — For the Fiscal Year Ended November 30, 2016
Investment Income. Investment income totaled $11.4 million for the year and consisted of net dividendsand distributions on our investments. We received $301.5 million of dividends and distributions, of which $284.0million was treated as return of capital and $6.2 million was treated as distributions in excess of cost basis.Return of capital was increased by $24.0 million due to 2015 tax reporting information that was received in fiscal2016. Interest income was $0.1 million. We also received $4.7 million of paid-in-kind dividends during the fiscalyear, which are not included in investment income, but are reflected as an unrealized gain.
8
KAYNE ANDERSON MLP INVESTMENT COMPANYMANAGEMENT DISCUSSION
(UNAUDITED)
Operating Expenses. Operating expenses totaled $110.7 million, including $49.9 million of investmentmanagement fees, $36.5 million of interest expense, $20.4 million of preferred stock distributions and$3.9 million of other operating expenses. Interest expense includes $5.7 million of prepayment penalties andaccelerated interest associated with unsecured notes (“Notes”) redemptions during fiscal 2016 and $2.4 millionof non-cash amortization and write-off of debt issuance costs. Preferred stock distributions include $0.2 millionof accelerated dividends associated with mandatory redeemable preferred stock (“MRP Shares”) redemptionsduring fiscal 2016 and $2.6 million of non-cash amortization and write-off of offering costs.
Net Investment Loss. Our net investment loss totaled $69.0 million and included a current tax expense of$4.6 million and a deferred tax benefit of $34.9 million.
Net Realized Gains. We had net realized gains from our investments of $111.7 million, consisting ofrealized gains from long term investments of $175.7 million, and $2.4 million of realized gains from optionactivity, a current tax benefit of $10.0 million and a deferred tax expense of $76.4 million.
Net Change in Unrealized Gains. We had a net increase in our unrealized gains of $210.9 million. The netchange consisted of a $336.3 million increase in our unrealized gains on investments, $0.1 million of unrealizedlosses from option activity and a deferred tax expense of $125.3 million.
Net Increase in Net Assets Resulting from Operations. We had an increase in net assets resulting fromoperations of $253.6 million. This increase was comprised of a net investment loss of $69.0 million, net realizedgains of $111.7 million and a net increase in unrealized gains of $210.9 million, as noted above.
Distributions to Common Stockholders
We pay quarterly distributions to our common stockholders, funded generally by net distributable income(“NDI”) generated from our portfolio investments. NDI is the amount of income received by us from ourportfolio investments less operating expenses, subject to certain adjustments as described below. NDI is not afinancial measure under the accounting principles generally accepted in the United States of America (“GAAP”).Refer to the “Reconciliation of NDI to GAAP” section below for a reconciliation of this measure to our resultsreported under GAAP.
Income from portfolio investments includes (a) cash dividends and distributions, (b) paid-in-kind dividendsreceived (i.e., stock dividends), (c) interest income from debt securities and commitment fees from privateinvestments in public equity (“PIPE investments”) and (d) net premiums received from the sale of covered calls.
Operating expenses include (a) investment management fees paid to our investment adviser (KAFA),(b) other expenses (mostly comprised of fees paid to other service providers), (c) interest expense and preferredstock distributions and (d) current and deferred income tax expense/benefit on net investment income/loss.
9

KAYNE ANDERSON MLP INVESTMENT COMPANYMANAGEMENT DISCUSSION
(UNAUDITED)
Net Distributable Income (NDI)(amounts in millions, except for per share amounts)
Three MonthsEnded
November 30,2016
Fiscal YearEnded
November 30,2016
Distributions and Other Income from InvestmentsDividends and Distributions(1) . . . . . . . . . . . . . . . . . . . . . . . . . . . . . . . . . . . . . . . . . $ 75.3 $301.5Paid-In-Kind Dividends(1) . . . . . . . . . . . . . . . . . . . . . . . . . . . . . . . . . . . . . . . . . . . . . 1.2 4.7Net Premiums Received from Call Options Written . . . . . . . . . . . . . . . . . . . . . . . . 0.3 3.5Other Income . . . . . . . . . . . . . . . . . . . . . . . . . . . . . . . . . . . . . . . . . . . . . . . . . . . . . . — 0.1
Total Distributions and Other Income from Investments . . . . . . . . . . . . . . . . . . . 76.8 309.8Expenses
Net Investment Management Fee . . . . . . . . . . . . . . . . . . . . . . . . . . . . . . . . . . . . . . . (13.3) (49.9)Other Expenses . . . . . . . . . . . . . . . . . . . . . . . . . . . . . . . . . . . . . . . . . . . . . . . . . . . . . (0.9) (3.9)Interest Expense(2) . . . . . . . . . . . . . . . . . . . . . . . . . . . . . . . . . . . . . . . . . . . . . . . . . . . (7.2) (35.1)Preferred Stock Distributions(2) . . . . . . . . . . . . . . . . . . . . . . . . . . . . . . . . . . . . . . . . (3.9) (17.8)Income Tax Benefit(3) . . . . . . . . . . . . . . . . . . . . . . . . . . . . . . . . . . . . . . . . . . . . . . . . 5.7 30.3
Net Distributable Income (NDI) . . . . . . . . . . . . . . . . . . . . . . . . . . . . . . . . . . . . . . . . $ 57.2 $233.4
Weighted Shares Outstanding . . . . . . . . . . . . . . . . . . . . . . . . . . . . . . . . . . . . . . . . . . 113.5 113.0NDI per Weighted Share Outstanding . . . . . . . . . . . . . . . . . . . . . . . . . . . . . . . . . . . $0.504 $2.067
Adjusted NDI per Weighted Share Outstanding(2)(4)(5) . . . . . . . . . . . . . . . . . . . . . . $0.540 $2.178
Distributions paid per Common Share(6) . . . . . . . . . . . . . . . . . . . . . . . . . . . . . . . . . $0.550 $2.200
(1) See Note 2 (Investment Income) to the Financial Statements for additional information regarding paid-in-kind and non-cash dividends and distributions.
(2) Interest expense for the year includes prepayment penalties and accelerated interest related to theredemption of Notes ($5.7 million). Preferred stock distributions include accelerated dividends associatedwith MRP Shares redemptions ($0.2 million). Adjusted NDI for the year excludes the after-tax-impact ofprepayment penalties and accelerated interest related to the redemption of Notes ($3.6 million) andaccelerated dividends related to the redemption of MRP Shares ($0.2 million).
(3) The income tax benefit for the year includes an $8.8 million increase which is attributable to a change made toour return of capital estimate for 2015 (the “Return of Capital Adjustment”). We increased our return of capitalestimate for 2015 as a result of tax reporting information attributable to fiscal 2015 received during fiscal 2016.
(4) For the purposes of calculating Adjusted NDI, we allocated the Return of Capital Adjustment equally toeach quarter in 2016 ($8.8 million adjustment in aggregate; $2.2 million quarterly adjustment).
(5) Adjusted NDI for the year includes $8.6 million of consideration received in two mergers that was intended tooffset lower quarterly distributions as a result of such transactions. The two transactions were the mergers ofEnergy Transfer Partners, L.P. and Regency Energy Partners LP ($1.2 million) and MarkWest EnergyPartners, L.P. and MPLX LP ($7.4 million, $1.9 million of which is included in the fourth quarter). Becausethe acquiring entity has deemed part of the merger consideration to be compensation to help offset the lowerquarterly distribution that unitholders of the acquired entity would receive after closing, we believe it to beappropriate to include this amount in Adjusted NDI. This merger consideration is not included in investmentincome for GAAP purposes, but rather is treated as additional consideration when calculating the realized orunrealized gain (loss) that results from the merger transaction.
(6) The distribution of $0.55 per share for the fourth quarter of fiscal 2016 was paid on January 13, 2017.Distributions for fiscal 2016 include the distributions paid in April 2016, July 2016, October 2016 andJanuary 2017.
10
KAYNE ANDERSON MLP INVESTMENT COMPANYMANAGEMENT DISCUSSION
(UNAUDITED)
Payment of future distributions is subject to Board of Directors approval, as well as meeting the covenantsof our debt agreements and terms of our preferred stock. Because our quarterly distributions are funded primarilyby NDI generated from our portfolio investments, the Board of Directors, in determining our quarterlydistribution to common stockholders, gives a significant amount of consideration to the NDI and Adjusted NDIgenerated in the current quarter, as well as the NDI that our portfolio is expected to generate over the next twelvemonths. The Board of Directors also considers other factors, including but not limited to, realized and unrealizedgains generated by the portfolio.
In December 2016, we provided guidance for our distribution for the first quarter of fiscal 2017.Management stated at such time that it expected to recommend a reduction of $0.07 to $0.08 per share to ourquarterly distribution. Over the last two years there has been an on-going trend of MLPs (or GPs) with loweryields acquiring MLPs with higher yields, including the merger of Energy Transfer Partners, L.P. and SunocoLogistics Partners, L.P. announced in November 2016. The impact of these transactions has been to significantlyreduce our NDI over that time period. The actual amount of the first quarter distribution will depend on a varietyof factors.
Reconciliation of NDI to GAAP
The difference between distributions and other income from investments in the NDI calculation and totalinvestment income as reported in our Statement of Operations is reconciled as follows:
• GAAP recognizes that a significant portion of the cash distributions received from MLPs ischaracterized as a return of capital and therefore excluded from investment income, whereas the NDIcalculation includes the return of capital portion of such distributions.
• GAAP recognizes distributions received from MLPs that exceed the cost basis of our securities to berealized gains and are therefore excluded from investment income, whereas the NDI calculation includesthese distributions.
• NDI includes the value of paid-in-kind dividends and distributions, whereas such amounts are notincluded as investment income for GAAP purposes, but rather are recorded as unrealized gains uponreceipt.
• NDI includes commitment fees from PIPE investments, whereas such amounts are generally notincluded in investment income for GAAP purposes, but rather are recorded as a reduction to the cost ofthe investment.
• We may hold debt securities from time to time. Certain of our investments in debt securities may bepurchased at a discount or premium to the par value of such security. When making such investments,we consider the security’s yield to maturity, which factors in the impact of such discount (or premium).Interest income reported under GAAP includes the non-cash accretion of the discount (or amortizationof the premium) based on the effective interest method. When we calculate interest income for purposesof determining NDI, in order to better reflect the yield to maturity, the accretion of the discount (oramortization of the premium) is calculated on a straight-line basis to the earlier of the expected call dateor the maturity of the debt security.
• We may sell covered call option contracts to generate income or to reduce our ownership of certainsecurities that we hold. In some cases, we are able to repurchase these call option contracts at a priceless than the call premium that we received, thereby generating a profit. The premium we receive fromselling call options, less (i) the premium that we pay to repurchase such call option contracts and (ii) theamount by which the market price of an underlying security is above the strike price at the time a newcall option is written (if any), is included in NDI. For GAAP purposes, premiums received from call
11

KAYNE ANDERSON MLP INVESTMENT COMPANYMANAGEMENT DISCUSSION
(UNAUDITED)
option contracts sold are not included in investment income. See Note 2 — Significant AccountingPolicies for a full discussion of the GAAP treatment of option contracts.
The treatment of expenses included in NDI also differs from what is reported in the Statement of Operationsas follows:
• The non-cash amortization or write-offs of capitalized debt issuance costs, premiums on newly issueddebt and preferred stock offering costs related to our financings is included in interest expense anddistributions on mandatory redeemable preferred stock for GAAP purposes, but is excluded from ourcalculation of NDI.
• NDI also includes recurring payments (or receipts) on interest rate swap contracts or the amortization oftermination payments on interest rate swap contracts entered into in anticipation of an offering of Notes orMRP Shares. The termination payments on interest rate swap contracts are amortized over the term of theNotes or MRP Shares issued. For GAAP purposes, these amounts are included in the realized gains/lossessection of the Statement of Operations.
Liquidity and Capital Resources
At November 30, 2016, we had total leverage outstanding of $1,110 million, which represented 28% of totalassets and was comprised of $767 million of Notes, $43 million of borrowings outstanding under our unsecuredterm loan (the “Term Loan”) and $300 million of MRP Shares. At November 30, 2016, we did not have anyborrowings outstanding under our unsecured revolving credit facility (the “Credit Facility”), and we had$1 million of cash and cash equivalents. As of January 20, 2017, we had no borrowings outstanding under ourCredit Facility, $98 million outstanding under our Term Loan, and we had $2 million of cash and cashequivalents.
Our Credit Facility has a two-year term maturing on February 28, 2018 and a total commitment amount of$150 million. The interest rate on outstanding loan balances may vary between LIBOR plus 1.60% and LIBORplus 2.25%, depending on our asset coverage ratios. We pay a fee of 0.30% per annum on any unused amounts ofthe Credit Facility.
Our Term Loan has a total commitment of $150 million and matures on February 18, 2019. Borrowingsunder the Term Loan bear interest at a rate of LIBOR plus 1.30%. Amounts borrowed under the Term Loan maybe repaid and subsequently borrowed. We pay a fee of 0.25% per annum on any unused amounts of the TermLoan.
At November 30, 2016, we had $767 million of Notes outstanding that mature between 2017 and 2025 and wehad $300 million of MRP Shares outstanding that are subject to mandatory redemption between 2017 and 2022.
On October 3, 2016, we redeemed all 2,000,000 shares of our Series G MRP Shares with an aggregateliquidation value of $50 million. On November 9, 2016, we completed the private placement of $50 million ofSeries J MRP Shares with an institutional investor. Net proceeds from the offering along with borrowings on ourTerm Loan were used to redeem all 4,160,000 shares of our Series A MRP Shares ($104 million liquidationvalue).
At November 30, 2016, our asset coverage ratios under the Investment Company Act of 1940, as amended(the “1940 Act”), were 406% for debt and 296% for total leverage (debt plus preferred stock). Our target assetcoverage ratio with respect to our debt is 385%. At times we may be above or below our target depending onmarket conditions as well as certain other factors, including our target total leverage asset coverage ratio of 290%and the basic maintenance amount as stated in our rating agency guidelines.
As of November 30, 2016, our total leverage consisted 96% of fixed rate obligations and 4% of floating rateobligations. At such date, the weighted average interest/dividend rate on our total leverage was 3.57%.
12
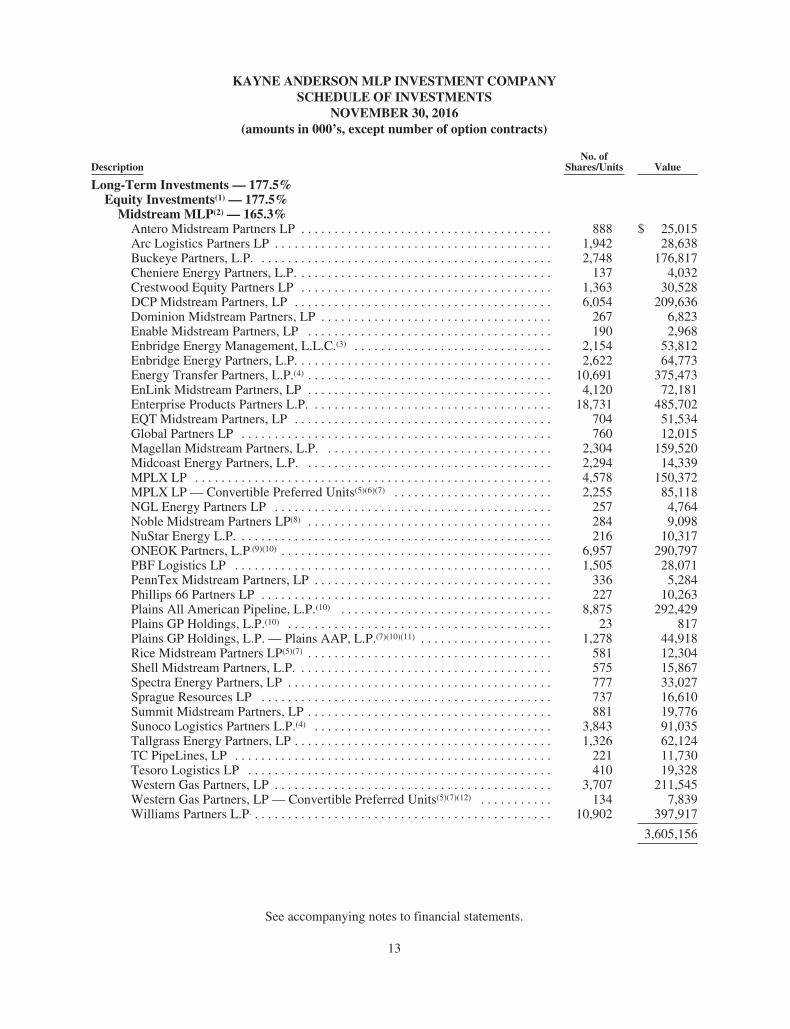
KAYNE ANDERSON MLP INVESTMENT COMPANYSCHEDULE OF INVESTMENTS
NOVEMBER 30, 2016(amounts in 000’s, except number of option contracts)
DescriptionNo. of
Shares/Units Value
Long-Term Investments — 177.5%Equity Investments(1) — 177.5%
Midstream MLP(2) — 165.3%Antero Midstream Partners LP . . . . . . . . . . . . . . . . . . . . . . . . . . . . . . . . . . . . . . 888 $ 25,015Arc Logistics Partners LP . . . . . . . . . . . . . . . . . . . . . . . . . . . . . . . . . . . . . . . . . . 1,942 28,638Buckeye Partners, L.P. . . . . . . . . . . . . . . . . . . . . . . . . . . . . . . . . . . . . . . . . . . . . 2,748 176,817Cheniere Energy Partners, L.P. . . . . . . . . . . . . . . . . . . . . . . . . . . . . . . . . . . . . . . 137 4,032Crestwood Equity Partners LP . . . . . . . . . . . . . . . . . . . . . . . . . . . . . . . . . . . . . . 1,363 30,528DCP Midstream Partners, LP . . . . . . . . . . . . . . . . . . . . . . . . . . . . . . . . . . . . . . . 6,054 209,636Dominion Midstream Partners, LP . . . . . . . . . . . . . . . . . . . . . . . . . . . . . . . . . . . 267 6,823Enable Midstream Partners, LP . . . . . . . . . . . . . . . . . . . . . . . . . . . . . . . . . . . . . 190 2,968Enbridge Energy Management, L.L.C.(3) . . . . . . . . . . . . . . . . . . . . . . . . . . . . . . 2,154 53,812Enbridge Energy Partners, L.P. . . . . . . . . . . . . . . . . . . . . . . . . . . . . . . . . . . . . . . 2,622 64,773Energy Transfer Partners, L.P.(4) . . . . . . . . . . . . . . . . . . . . . . . . . . . . . . . . . . . . . 10,691 375,473EnLink Midstream Partners, LP . . . . . . . . . . . . . . . . . . . . . . . . . . . . . . . . . . . . . 4,120 72,181Enterprise Products Partners L.P. . . . . . . . . . . . . . . . . . . . . . . . . . . . . . . . . . . . . 18,731 485,702EQT Midstream Partners, LP . . . . . . . . . . . . . . . . . . . . . . . . . . . . . . . . . . . . . . . 704 51,534Global Partners LP . . . . . . . . . . . . . . . . . . . . . . . . . . . . . . . . . . . . . . . . . . . . . . . 760 12,015Magellan Midstream Partners, L.P. . . . . . . . . . . . . . . . . . . . . . . . . . . . . . . . . . . 2,304 159,520Midcoast Energy Partners, L.P. . . . . . . . . . . . . . . . . . . . . . . . . . . . . . . . . . . . . . 2,294 14,339MPLX LP . . . . . . . . . . . . . . . . . . . . . . . . . . . . . . . . . . . . . . . . . . . . . . . . . . . . . . 4,578 150,372MPLX LP — Convertible Preferred Units(5)(6)(7) . . . . . . . . . . . . . . . . . . . . . . . . 2,255 85,118NGL Energy Partners LP . . . . . . . . . . . . . . . . . . . . . . . . . . . . . . . . . . . . . . . . . . 257 4,764Noble Midstream Partners LP(8) . . . . . . . . . . . . . . . . . . . . . . . . . . . . . . . . . . . . . 284 9,098NuStar Energy L.P. . . . . . . . . . . . . . . . . . . . . . . . . . . . . . . . . . . . . . . . . . . . . . . . 216 10,317ONEOK Partners, L.P.(9)(10) . . . . . . . . . . . . . . . . . . . . . . . . . . . . . . . . . . . . . . . . . 6,957 290,797PBF Logistics LP . . . . . . . . . . . . . . . . . . . . . . . . . . . . . . . . . . . . . . . . . . . . . . . . 1,505 28,071PennTex Midstream Partners, LP . . . . . . . . . . . . . . . . . . . . . . . . . . . . . . . . . . . . 336 5,284Phillips 66 Partners LP . . . . . . . . . . . . . . . . . . . . . . . . . . . . . . . . . . . . . . . . . . . . 227 10,263Plains All American Pipeline, L.P.(10) . . . . . . . . . . . . . . . . . . . . . . . . . . . . . . . . 8,875 292,429Plains GP Holdings, L.P.(10) . . . . . . . . . . . . . . . . . . . . . . . . . . . . . . . . . . . . . . . . 23 817Plains GP Holdings, L.P. — Plains AAP, L.P.(7)(10)(11) . . . . . . . . . . . . . . . . . . . . 1,278 44,918Rice Midstream Partners LP(5)(7) . . . . . . . . . . . . . . . . . . . . . . . . . . . . . . . . . . . . . 581 12,304Shell Midstream Partners, L.P. . . . . . . . . . . . . . . . . . . . . . . . . . . . . . . . . . . . . . . 575 15,867Spectra Energy Partners, LP . . . . . . . . . . . . . . . . . . . . . . . . . . . . . . . . . . . . . . . . 777 33,027Sprague Resources LP . . . . . . . . . . . . . . . . . . . . . . . . . . . . . . . . . . . . . . . . . . . . 737 16,610Summit Midstream Partners, LP . . . . . . . . . . . . . . . . . . . . . . . . . . . . . . . . . . . . . 881 19,776Sunoco Logistics Partners L.P.(4) . . . . . . . . . . . . . . . . . . . . . . . . . . . . . . . . . . . . 3,843 91,035Tallgrass Energy Partners, LP . . . . . . . . . . . . . . . . . . . . . . . . . . . . . . . . . . . . . . . 1,326 62,124TC PipeLines, LP . . . . . . . . . . . . . . . . . . . . . . . . . . . . . . . . . . . . . . . . . . . . . . . . 221 11,730Tesoro Logistics LP . . . . . . . . . . . . . . . . . . . . . . . . . . . . . . . . . . . . . . . . . . . . . . 410 19,328Western Gas Partners, LP . . . . . . . . . . . . . . . . . . . . . . . . . . . . . . . . . . . . . . . . . . 3,707 211,545Western Gas Partners, LP — Convertible Preferred Units(5)(7)(12) . . . . . . . . . . . 134 7,839Williams Partners L.P. . . . . . . . . . . . . . . . . . . . . . . . . . . . . . . . . . . . . . . . . . . . . . 10,902 397,917
3,605,156
See accompanying notes to financial statements.
13
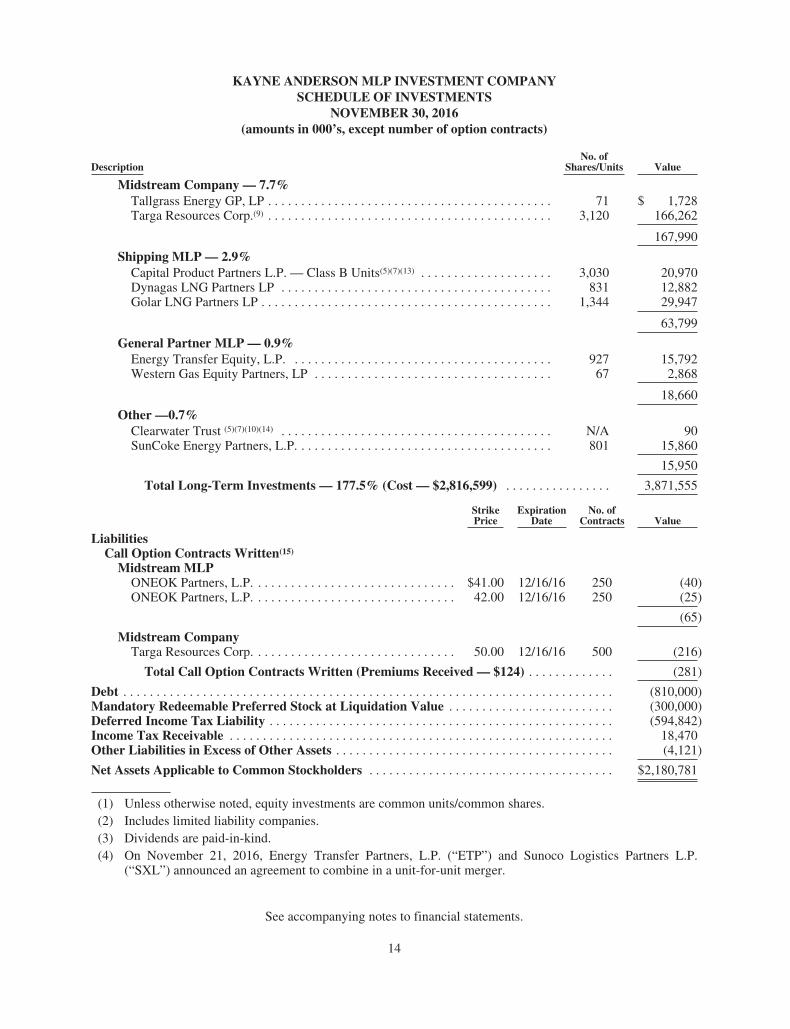
KAYNE ANDERSON MLP INVESTMENT COMPANYSCHEDULE OF INVESTMENTS
NOVEMBER 30, 2016(amounts in 000’s, except number of option contracts)
DescriptionNo. of
Shares/Units Value
Midstream Company — 7.7%Tallgrass Energy GP, LP . . . . . . . . . . . . . . . . . . . . . . . . . . . . . . . . . . . . . . . . . . . 71 $ 1,728Targa Resources Corp.(9) . . . . . . . . . . . . . . . . . . . . . . . . . . . . . . . . . . . . . . . . . . . 3,120 166,262
167,990
Shipping MLP — 2.9%Capital Product Partners L.P. — Class B Units(5)(7)(13) . . . . . . . . . . . . . . . . . . . . 3,030 20,970Dynagas LNG Partners LP . . . . . . . . . . . . . . . . . . . . . . . . . . . . . . . . . . . . . . . . . 831 12,882Golar LNG Partners LP . . . . . . . . . . . . . . . . . . . . . . . . . . . . . . . . . . . . . . . . . . . . 1,344 29,947
63,799
General Partner MLP — 0.9%Energy Transfer Equity, L.P. . . . . . . . . . . . . . . . . . . . . . . . . . . . . . . . . . . . . . . . 927 15,792Western Gas Equity Partners, LP . . . . . . . . . . . . . . . . . . . . . . . . . . . . . . . . . . . . 67 2,868
18,660
Other —0.7%Clearwater Trust (5)(7)(10)(14) . . . . . . . . . . . . . . . . . . . . . . . . . . . . . . . . . . . . . . . . . N/A 90SunCoke Energy Partners, L.P. . . . . . . . . . . . . . . . . . . . . . . . . . . . . . . . . . . . . . . 801 15,860
15,950
Total Long-Term Investments — 177.5% (Cost — $2,816,599) . . . . . . . . . . . . . . . . 3,871,555
StrikePrice
ExpirationDate
No. ofContracts Value
LiabilitiesCall Option Contracts Written(15)
Midstream MLPONEOK Partners, L.P. . . . . . . . . . . . . . . . . . . . . . . . . . . . . . . $41.00 12/16/16 250 (40)ONEOK Partners, L.P. . . . . . . . . . . . . . . . . . . . . . . . . . . . . . . 42.00 12/16/16 250 (25)
(65)
Midstream CompanyTarga Resources Corp. . . . . . . . . . . . . . . . . . . . . . . . . . . . . . . 50.00 12/16/16 500 (216)
Total Call Option Contracts Written (Premiums Received — $124) . . . . . . . . . . . . . (281)
Debt . . . . . . . . . . . . . . . . . . . . . . . . . . . . . . . . . . . . . . . . . . . . . . . . . . . . . . . . . . . . . . . . . . . . . . . . . . (810,000)Mandatory Redeemable Preferred Stock at Liquidation Value . . . . . . . . . . . . . . . . . . . . . . . . . (300,000)Deferred Income Tax Liability . . . . . . . . . . . . . . . . . . . . . . . . . . . . . . . . . . . . . . . . . . . . . . . . . . . . (594,842)Income Tax Receivable . . . . . . . . . . . . . . . . . . . . . . . . . . . . . . . . . . . . . . . . . . . . . . . . . . . . . . . . . . 18,470Other Liabilities in Excess of Other Assets . . . . . . . . . . . . . . . . . . . . . . . . . . . . . . . . . . . . . . . . . . (4,121)
Net Assets Applicable to Common Stockholders . . . . . . . . . . . . . . . . . . . . . . . . . . . . . . . . . . . . . $2,180,781
(1) Unless otherwise noted, equity investments are common units/common shares.(2) Includes limited liability companies.(3) Dividends are paid-in-kind.(4) On November 21, 2016, Energy Transfer Partners, L.P. (“ETP”) and Sunoco Logistics Partners L.P.
(“SXL”) announced an agreement to combine in a unit-for-unit merger.
See accompanying notes to financial statements.
14
KAYNE ANDERSON MLP INVESTMENT COMPANYSCHEDULE OF INVESTMENTS
NOVEMBER 30, 2016(amounts in 000’s, except number of option contracts)
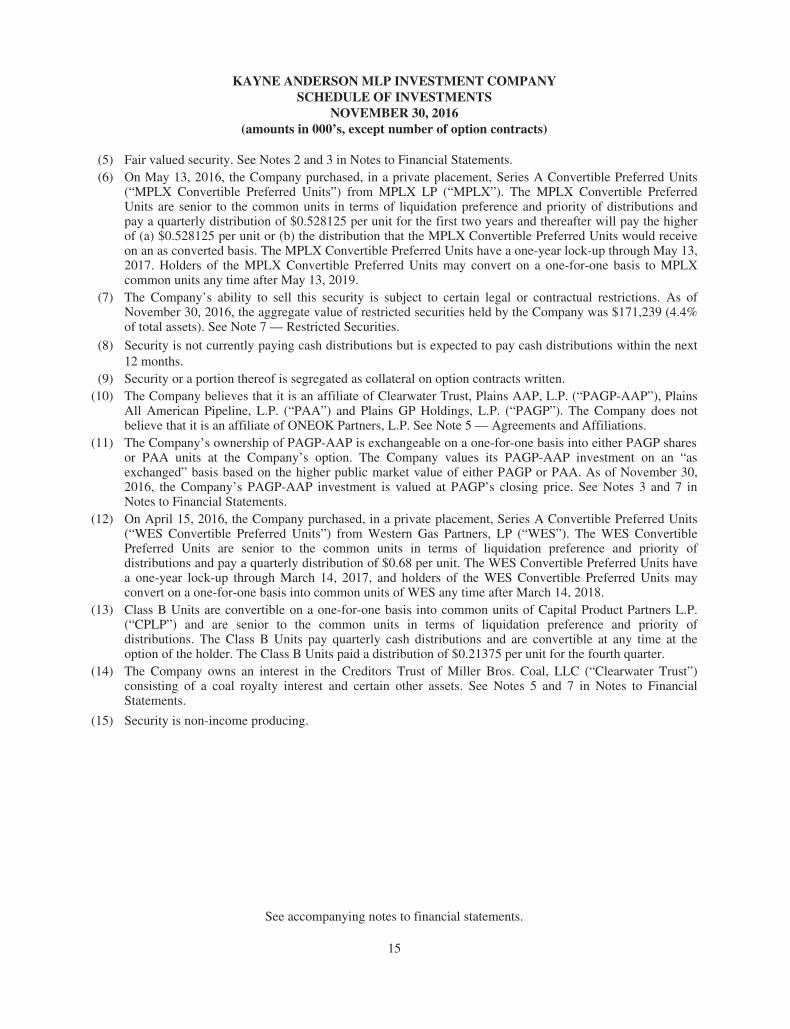
(5) Fair valued security. See Notes 2 and 3 in Notes to Financial Statements.(6) On May 13, 2016, the Company purchased, in a private placement, Series A Convertible Preferred Units
(“MPLX Convertible Preferred Units”) from MPLX LP (“MPLX”). The MPLX Convertible PreferredUnits are senior to the common units in terms of liquidation preference and priority of distributions andpay a quarterly distribution of $0.528125 per unit for the first two years and thereafter will pay the higherof (a) $0.528125 per unit or (b) the distribution that the MPLX Convertible Preferred Units would receiveon an as converted basis. The MPLX Convertible Preferred Units have a one-year lock-up through May 13,2017. Holders of the MPLX Convertible Preferred Units may convert on a one-for-one basis to MPLXcommon units any time after May 13, 2019.
(7) The Company’s ability to sell this security is subject to certain legal or contractual restrictions. As ofNovember 30, 2016, the aggregate value of restricted securities held by the Company was $171,239 (4.4%of total assets). See Note 7 — Restricted Securities.
(8) Security is not currently paying cash distributions but is expected to pay cash distributions within the next12 months.
(9) Security or a portion thereof is segregated as collateral on option contracts written.(10) The Company believes that it is an affiliate of Clearwater Trust, Plains AAP, L.P. (“PAGP-AAP”), Plains
All American Pipeline, L.P. (“PAA”) and Plains GP Holdings, L.P. (“PAGP”). The Company does notbelieve that it is an affiliate of ONEOK Partners, L.P. See Note 5 — Agreements and Affiliations.
(11) The Company’s ownership of PAGP-AAP is exchangeable on a one-for-one basis into either PAGP sharesor PAA units at the Company’s option. The Company values its PAGP-AAP investment on an “asexchanged” basis based on the higher public market value of either PAGP or PAA. As of November 30,2016, the Company’s PAGP-AAP investment is valued at PAGP’s closing price. See Notes 3 and 7 inNotes to Financial Statements.
(12) On April 15, 2016, the Company purchased, in a private placement, Series A Convertible Preferred Units(“WES Convertible Preferred Units”) from Western Gas Partners, LP (“WES”). The WES ConvertiblePreferred Units are senior to the common units in terms of liquidation preference and priority ofdistributions and pay a quarterly distribution of $0.68 per unit. The WES Convertible Preferred Units havea one-year lock-up through March 14, 2017, and holders of the WES Convertible Preferred Units mayconvert on a one-for-one basis into common units of WES any time after March 14, 2018.
(13) Class B Units are convertible on a one-for-one basis into common units of Capital Product Partners L.P.(“CPLP”) and are senior to the common units in terms of liquidation preference and priority ofdistributions. The Class B Units pay quarterly cash distributions and are convertible at any time at theoption of the holder. The Class B Units paid a distribution of $0.21375 per unit for the fourth quarter.
(14) The Company owns an interest in the Creditors Trust of Miller Bros. Coal, LLC (“Clearwater Trust”)consisting of a coal royalty interest and certain other assets. See Notes 5 and 7 in Notes to FinancialStatements.
(15) Security is non-income producing.
See accompanying notes to financial statements.
15
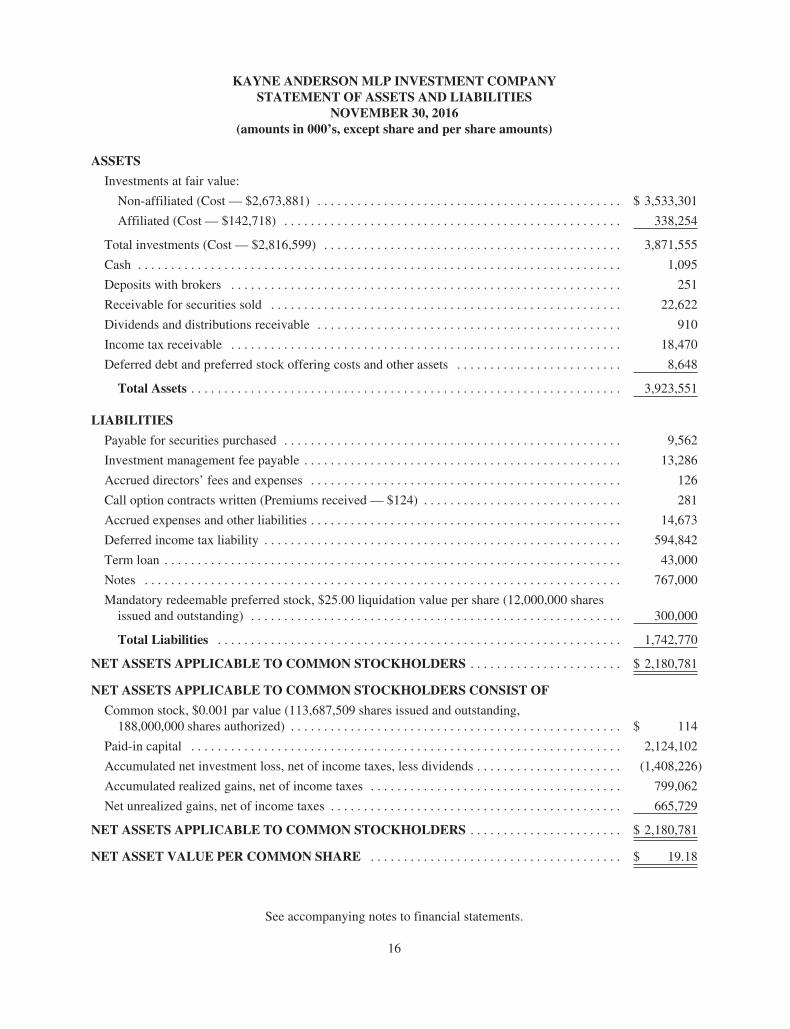
KAYNE ANDERSON MLP INVESTMENT COMPANYSTATEMENT OF ASSETS AND LIABILITIES
NOVEMBER 30, 2016(amounts in 000’s, except share and per share amounts)
ASSETS
Investments at fair value:
Non-affiliated (Cost — $2,673,881) . . . . . . . . . . . . . . . . . . . . . . . . . . . . . . . . . . . . . . . . . . . . . . $ 3,533,301
Affiliated (Cost — $142,718) . . . . . . . . . . . . . . . . . . . . . . . . . . . . . . . . . . . . . . . . . . . . . . . . . . . 338,254
Total investments (Cost — $2,816,599) . . . . . . . . . . . . . . . . . . . . . . . . . . . . . . . . . . . . . . . . . . . . . 3,871,555
Cash . . . . . . . . . . . . . . . . . . . . . . . . . . . . . . . . . . . . . . . . . . . . . . . . . . . . . . . . . . . . . . . . . . . . . . . . . 1,095
Deposits with brokers . . . . . . . . . . . . . . . . . . . . . . . . . . . . . . . . . . . . . . . . . . . . . . . . . . . . . . . . . . . 251
Receivable for securities sold . . . . . . . . . . . . . . . . . . . . . . . . . . . . . . . . . . . . . . . . . . . . . . . . . . . . . 22,622
Dividends and distributions receivable . . . . . . . . . . . . . . . . . . . . . . . . . . . . . . . . . . . . . . . . . . . . . . 910
Income tax receivable . . . . . . . . . . . . . . . . . . . . . . . . . . . . . . . . . . . . . . . . . . . . . . . . . . . . . . . . . . . 18,470
Deferred debt and preferred stock offering costs and other assets . . . . . . . . . . . . . . . . . . . . . . . . . 8,648
Total Assets . . . . . . . . . . . . . . . . . . . . . . . . . . . . . . . . . . . . . . . . . . . . . . . . . . . . . . . . . . . . . . . . . 3,923,551
LIABILITIES
Payable for securities purchased . . . . . . . . . . . . . . . . . . . . . . . . . . . . . . . . . . . . . . . . . . . . . . . . . . . 9,562
Investment management fee payable . . . . . . . . . . . . . . . . . . . . . . . . . . . . . . . . . . . . . . . . . . . . . . . . 13,286
Accrued directors’ fees and expenses . . . . . . . . . . . . . . . . . . . . . . . . . . . . . . . . . . . . . . . . . . . . . . . 126
Call option contracts written (Premiums received — $124) . . . . . . . . . . . . . . . . . . . . . . . . . . . . . . 281
Accrued expenses and other liabilities . . . . . . . . . . . . . . . . . . . . . . . . . . . . . . . . . . . . . . . . . . . . . . . 14,673
Deferred income tax liability . . . . . . . . . . . . . . . . . . . . . . . . . . . . . . . . . . . . . . . . . . . . . . . . . . . . . . 594,842
Term loan . . . . . . . . . . . . . . . . . . . . . . . . . . . . . . . . . . . . . . . . . . . . . . . . . . . . . . . . . . . . . . . . . . . . . 43,000
Notes . . . . . . . . . . . . . . . . . . . . . . . . . . . . . . . . . . . . . . . . . . . . . . . . . . . . . . . . . . . . . . . . . . . . . . . . 767,000
Mandatory redeemable preferred stock, $25.00 liquidation value per share (12,000,000 sharesissued and outstanding) . . . . . . . . . . . . . . . . . . . . . . . . . . . . . . . . . . . . . . . . . . . . . . . . . . . . . . . . 300,000
Total Liabilities . . . . . . . . . . . . . . . . . . . . . . . . . . . . . . . . . . . . . . . . . . . . . . . . . . . . . . . . . . . . . 1,742,770
NET ASSETS APPLICABLE TO COMMON STOCKHOLDERS . . . . . . . . . . . . . . . . . . . . . . . $ 2,180,781
NET ASSETS APPLICABLE TO COMMON STOCKHOLDERS CONSIST OF
Common stock, $0.001 par value (113,687,509 shares issued and outstanding,188,000,000 shares authorized) . . . . . . . . . . . . . . . . . . . . . . . . . . . . . . . . . . . . . . . . . . . . . . . . . . $ 114
Paid-in capital . . . . . . . . . . . . . . . . . . . . . . . . . . . . . . . . . . . . . . . . . . . . . . . . . . . . . . . . . . . . . . . . . 2,124,102
Accumulated net investment loss, net of income taxes, less dividends . . . . . . . . . . . . . . . . . . . . . . (1,408,226)
Accumulated realized gains, net of income taxes . . . . . . . . . . . . . . . . . . . . . . . . . . . . . . . . . . . . . . 799,062
Net unrealized gains, net of income taxes . . . . . . . . . . . . . . . . . . . . . . . . . . . . . . . . . . . . . . . . . . . . 665,729
NET ASSETS APPLICABLE TO COMMON STOCKHOLDERS . . . . . . . . . . . . . . . . . . . . . . . $ 2,180,781
NET ASSET VALUE PER COMMON SHARE . . . . . . . . . . . . . . . . . . . . . . . . . . . . . . . . . . . . . . $ 19.18
See accompanying notes to financial statements.
16
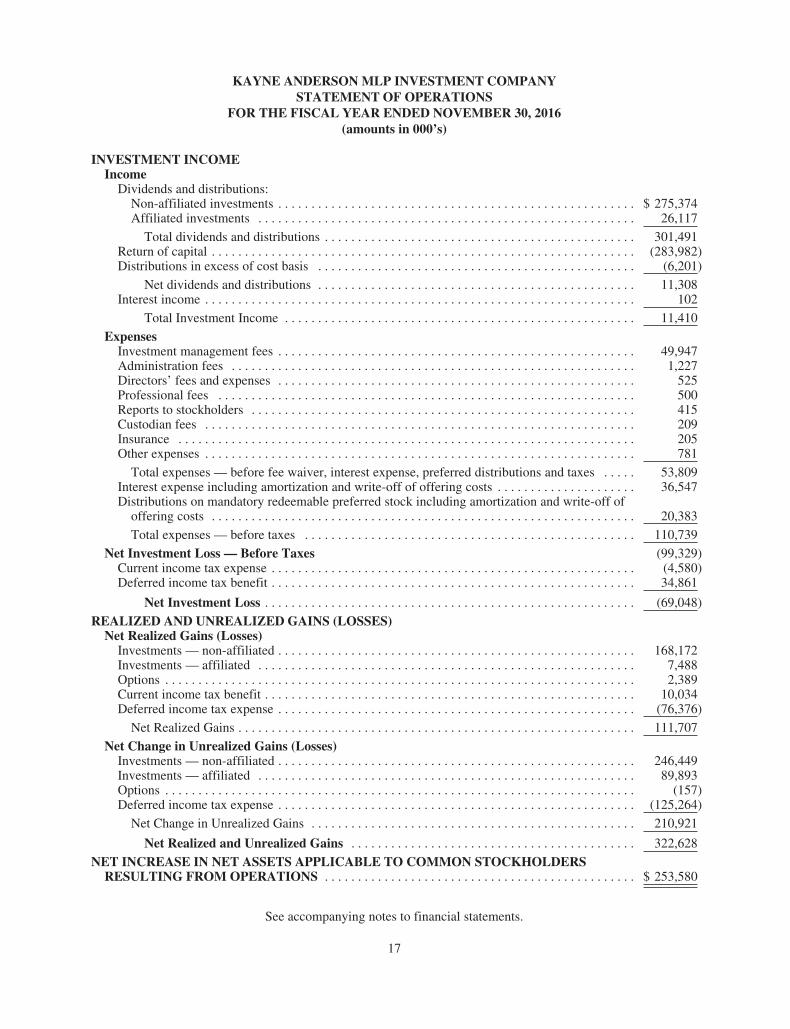
KAYNE ANDERSON MLP INVESTMENT COMPANYSTATEMENT OF OPERATIONS
FOR THE FISCAL YEAR ENDED NOVEMBER 30, 2016(amounts in 000’s)
INVESTMENT INCOMEIncome
Dividends and distributions:Non-affiliated investments . . . . . . . . . . . . . . . . . . . . . . . . . . . . . . . . . . . . . . . . . . . . . . . . . . . . . . $ 275,374Affiliated investments . . . . . . . . . . . . . . . . . . . . . . . . . . . . . . . . . . . . . . . . . . . . . . . . . . . . . . . . . 26,117
Total dividends and distributions . . . . . . . . . . . . . . . . . . . . . . . . . . . . . . . . . . . . . . . . . . . . . . . 301,491Return of capital . . . . . . . . . . . . . . . . . . . . . . . . . . . . . . . . . . . . . . . . . . . . . . . . . . . . . . . . . . . . . . . . (283,982)Distributions in excess of cost basis . . . . . . . . . . . . . . . . . . . . . . . . . . . . . . . . . . . . . . . . . . . . . . . . (6,201)
Net dividends and distributions . . . . . . . . . . . . . . . . . . . . . . . . . . . . . . . . . . . . . . . . . . . . . . . . 11,308Interest income . . . . . . . . . . . . . . . . . . . . . . . . . . . . . . . . . . . . . . . . . . . . . . . . . . . . . . . . . . . . . . . . . 102
Total Investment Income . . . . . . . . . . . . . . . . . . . . . . . . . . . . . . . . . . . . . . . . . . . . . . . . . . . . . 11,410
ExpensesInvestment management fees . . . . . . . . . . . . . . . . . . . . . . . . . . . . . . . . . . . . . . . . . . . . . . . . . . . . . . 49,947Administration fees . . . . . . . . . . . . . . . . . . . . . . . . . . . . . . . . . . . . . . . . . . . . . . . . . . . . . . . . . . . . . 1,227Directors’ fees and expenses . . . . . . . . . . . . . . . . . . . . . . . . . . . . . . . . . . . . . . . . . . . . . . . . . . . . . . 525Professional fees . . . . . . . . . . . . . . . . . . . . . . . . . . . . . . . . . . . . . . . . . . . . . . . . . . . . . . . . . . . . . . . 500Reports to stockholders . . . . . . . . . . . . . . . . . . . . . . . . . . . . . . . . . . . . . . . . . . . . . . . . . . . . . . . . . . 415Custodian fees . . . . . . . . . . . . . . . . . . . . . . . . . . . . . . . . . . . . . . . . . . . . . . . . . . . . . . . . . . . . . . . . . 209Insurance . . . . . . . . . . . . . . . . . . . . . . . . . . . . . . . . . . . . . . . . . . . . . . . . . . . . . . . . . . . . . . . . . . . . . 205Other expenses . . . . . . . . . . . . . . . . . . . . . . . . . . . . . . . . . . . . . . . . . . . . . . . . . . . . . . . . . . . . . . . . . 781
Total expenses — before fee waiver, interest expense, preferred distributions and taxes . . . . . 53,809Interest expense including amortization and write-off of offering costs . . . . . . . . . . . . . . . . . . . . . 36,547Distributions on mandatory redeemable preferred stock including amortization and write-off of
offering costs . . . . . . . . . . . . . . . . . . . . . . . . . . . . . . . . . . . . . . . . . . . . . . . . . . . . . . . . . . . . . . . . 20,383
Total expenses — before taxes . . . . . . . . . . . . . . . . . . . . . . . . . . . . . . . . . . . . . . . . . . . . . . . . . . 110,739
Net Investment Loss — Before Taxes (99,329)Current income tax expense . . . . . . . . . . . . . . . . . . . . . . . . . . . . . . . . . . . . . . . . . . . . . . . . . . . . . . . (4,580)Deferred income tax benefit . . . . . . . . . . . . . . . . . . . . . . . . . . . . . . . . . . . . . . . . . . . . . . . . . . . . . . . 34,861
Net Investment Loss . . . . . . . . . . . . . . . . . . . . . . . . . . . . . . . . . . . . . . . . . . . . . . . . . . . . . . . . (69,048)
REALIZED AND UNREALIZED GAINS (LOSSES)Net Realized Gains (Losses)
Investments — non-affiliated . . . . . . . . . . . . . . . . . . . . . . . . . . . . . . . . . . . . . . . . . . . . . . . . . . . . . . 168,172Investments — affiliated . . . . . . . . . . . . . . . . . . . . . . . . . . . . . . . . . . . . . . . . . . . . . . . . . . . . . . . . . 7,488Options . . . . . . . . . . . . . . . . . . . . . . . . . . . . . . . . . . . . . . . . . . . . . . . . . . . . . . . . . . . . . . . . . . . . . . . 2,389Current income tax benefit . . . . . . . . . . . . . . . . . . . . . . . . . . . . . . . . . . . . . . . . . . . . . . . . . . . . . . . . 10,034Deferred income tax expense . . . . . . . . . . . . . . . . . . . . . . . . . . . . . . . . . . . . . . . . . . . . . . . . . . . . . . (76,376)
Net Realized Gains . . . . . . . . . . . . . . . . . . . . . . . . . . . . . . . . . . . . . . . . . . . . . . . . . . . . . . . . . . . . 111,707
Net Change in Unrealized Gains (Losses)Investments — non-affiliated . . . . . . . . . . . . . . . . . . . . . . . . . . . . . . . . . . . . . . . . . . . . . . . . . . . . . . 246,449Investments — affiliated . . . . . . . . . . . . . . . . . . . . . . . . . . . . . . . . . . . . . . . . . . . . . . . . . . . . . . . . . 89,893Options . . . . . . . . . . . . . . . . . . . . . . . . . . . . . . . . . . . . . . . . . . . . . . . . . . . . . . . . . . . . . . . . . . . . . . . (157)Deferred income tax expense . . . . . . . . . . . . . . . . . . . . . . . . . . . . . . . . . . . . . . . . . . . . . . . . . . . . . . (125,264)
Net Change in Unrealized Gains . . . . . . . . . . . . . . . . . . . . . . . . . . . . . . . . . . . . . . . . . . . . . . . . . 210,921
Net Realized and Unrealized Gains . . . . . . . . . . . . . . . . . . . . . . . . . . . . . . . . . . . . . . . . . . . 322,628
NET INCREASE IN NET ASSETS APPLICABLE TO COMMON STOCKHOLDERSRESULTING FROM OPERATIONS . . . . . . . . . . . . . . . . . . . . . . . . . . . . . . . . . . . . . . . . . . . . . . . $ 253,580
See accompanying notes to financial statements.
17
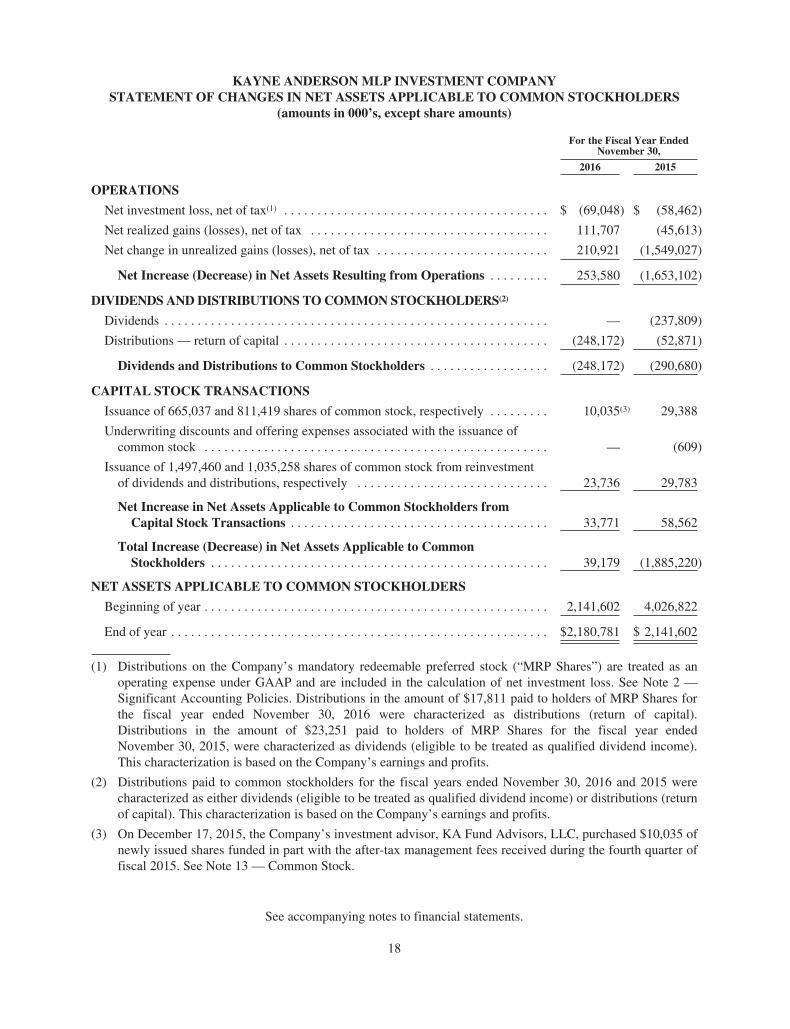
KAYNE ANDERSON MLP INVESTMENT COMPANYSTATEMENT OF CHANGES IN NET ASSETS APPLICABLE TO COMMON STOCKHOLDERS
(amounts in 000’s, except share amounts)
For the Fiscal Year EndedNovember 30,
2016 2015
OPERATIONS
Net investment loss, net of tax(1) . . . . . . . . . . . . . . . . . . . . . . . . . . . . . . . . . . . . . . . . $ (69,048) $ (58,462)
Net realized gains (losses), net of tax . . . . . . . . . . . . . . . . . . . . . . . . . . . . . . . . . . . . 111,707 (45,613)
Net change in unrealized gains (losses), net of tax . . . . . . . . . . . . . . . . . . . . . . . . . . 210,921 (1,549,027)
Net Increase (Decrease) in Net Assets Resulting from Operations . . . . . . . . . 253,580 (1,653,102)
DIVIDENDS AND DISTRIBUTIONS TO COMMON STOCKHOLDERS(2)
Dividends . . . . . . . . . . . . . . . . . . . . . . . . . . . . . . . . . . . . . . . . . . . . . . . . . . . . . . . . . . — (237,809)
Distributions — return of capital . . . . . . . . . . . . . . . . . . . . . . . . . . . . . . . . . . . . . . . . (248,172) (52,871)
Dividends and Distributions to Common Stockholders . . . . . . . . . . . . . . . . . . (248,172) (290,680)
CAPITAL STOCK TRANSACTIONS
Issuance of 665,037 and 811,419 shares of common stock, respectively . . . . . . . . . 10,035(3) 29,388
Underwriting discounts and offering expenses associated with the issuance ofcommon stock . . . . . . . . . . . . . . . . . . . . . . . . . . . . . . . . . . . . . . . . . . . . . . . . . . . . — (609)
Issuance of 1,497,460 and 1,035,258 shares of common stock from reinvestmentof dividends and distributions, respectively . . . . . . . . . . . . . . . . . . . . . . . . . . . . . 23,736 29,783
Net Increase in Net Assets Applicable to Common Stockholders fromCapital Stock Transactions . . . . . . . . . . . . . . . . . . . . . . . . . . . . . . . . . . . . . . . 33,771 58,562
Total Increase (Decrease) in Net Assets Applicable to CommonStockholders . . . . . . . . . . . . . . . . . . . . . . . . . . . . . . . . . . . . . . . . . . . . . . . . . . . 39,179 (1,885,220)
NET ASSETS APPLICABLE TO COMMON STOCKHOLDERS
Beginning of year . . . . . . . . . . . . . . . . . . . . . . . . . . . . . . . . . . . . . . . . . . . . . . . . . . . . 2,141,602 4,026,822
End of year . . . . . . . . . . . . . . . . . . . . . . . . . . . . . . . . . . . . . . . . . . . . . . . . . . . . . . . . . $2,180,781 $ 2,141,602
(1) Distributions on the Company’s mandatory redeemable preferred stock (“MRP Shares”) are treated as anoperating expense under GAAP and are included in the calculation of net investment loss. See Note 2 —Significant Accounting Policies. Distributions in the amount of $17,811 paid to holders of MRP Shares forthe fiscal year ended November 30, 2016 were characterized as distributions (return of capital).Distributions in the amount of $23,251 paid to holders of MRP Shares for the fiscal year endedNovember 30, 2015, were characterized as dividends (eligible to be treated as qualified dividend income).This characterization is based on the Company’s earnings and profits.
(2) Distributions paid to common stockholders for the fiscal years ended November 30, 2016 and 2015 werecharacterized as either dividends (eligible to be treated as qualified dividend income) or distributions (returnof capital). This characterization is based on the Company’s earnings and profits.
(3) On December 17, 2015, the Company’s investment advisor, KA Fund Advisors, LLC, purchased $10,035 ofnewly issued shares funded in part with the after-tax management fees received during the fourth quarter offiscal 2015. See Note 13 — Common Stock.
See accompanying notes to financial statements.
18
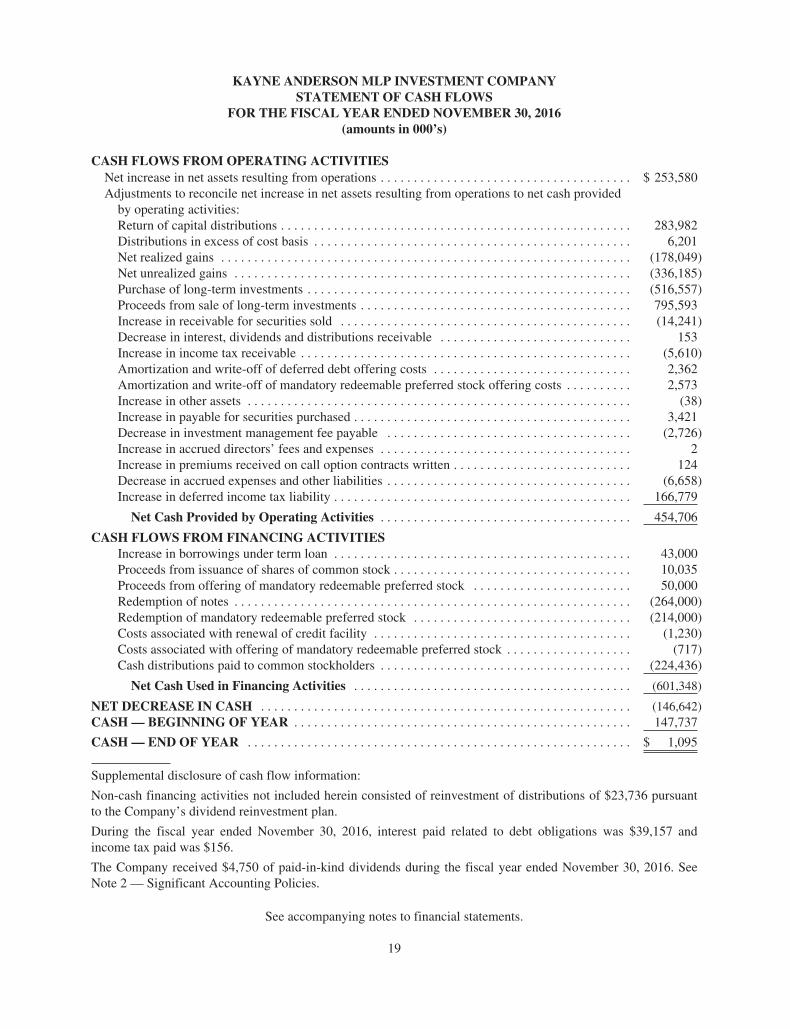
KAYNE ANDERSON MLP INVESTMENT COMPANYSTATEMENT OF CASH FLOWS
FOR THE FISCAL YEAR ENDED NOVEMBER 30, 2016(amounts in 000’s)
CASH FLOWS FROM OPERATING ACTIVITIESNet increase in net assets resulting from operations . . . . . . . . . . . . . . . . . . . . . . . . . . . . . . . . . . . . . . $ 253,580Adjustments to reconcile net increase in net assets resulting from operations to net cash provided
by operating activities:Return of capital distributions . . . . . . . . . . . . . . . . . . . . . . . . . . . . . . . . . . . . . . . . . . . . . . . . . . . . . 283,982Distributions in excess of cost basis . . . . . . . . . . . . . . . . . . . . . . . . . . . . . . . . . . . . . . . . . . . . . . . . 6,201Net realized gains . . . . . . . . . . . . . . . . . . . . . . . . . . . . . . . . . . . . . . . . . . . . . . . . . . . . . . . . . . . . . . (178,049)Net unrealized gains . . . . . . . . . . . . . . . . . . . . . . . . . . . . . . . . . . . . . . . . . . . . . . . . . . . . . . . . . . . . (336,185)Purchase of long-term investments . . . . . . . . . . . . . . . . . . . . . . . . . . . . . . . . . . . . . . . . . . . . . . . . . (516,557)Proceeds from sale of long-term investments . . . . . . . . . . . . . . . . . . . . . . . . . . . . . . . . . . . . . . . . . 795,593Increase in receivable for securities sold . . . . . . . . . . . . . . . . . . . . . . . . . . . . . . . . . . . . . . . . . . . . (14,241)Decrease in interest, dividends and distributions receivable . . . . . . . . . . . . . . . . . . . . . . . . . . . . . 153Increase in income tax receivable . . . . . . . . . . . . . . . . . . . . . . . . . . . . . . . . . . . . . . . . . . . . . . . . . . (5,610)Amortization and write-off of deferred debt offering costs . . . . . . . . . . . . . . . . . . . . . . . . . . . . . . 2,362Amortization and write-off of mandatory redeemable preferred stock offering costs . . . . . . . . . . 2,573Increase in other assets . . . . . . . . . . . . . . . . . . . . . . . . . . . . . . . . . . . . . . . . . . . . . . . . . . . . . . . . . . (38)Increase in payable for securities purchased . . . . . . . . . . . . . . . . . . . . . . . . . . . . . . . . . . . . . . . . . . 3,421Decrease in investment management fee payable . . . . . . . . . . . . . . . . . . . . . . . . . . . . . . . . . . . . . (2,726)Increase in accrued directors’ fees and expenses . . . . . . . . . . . . . . . . . . . . . . . . . . . . . . . . . . . . . . 2Increase in premiums received on call option contracts written . . . . . . . . . . . . . . . . . . . . . . . . . . . 124Decrease in accrued expenses and other liabilities . . . . . . . . . . . . . . . . . . . . . . . . . . . . . . . . . . . . . (6,658)Increase in deferred income tax liability . . . . . . . . . . . . . . . . . . . . . . . . . . . . . . . . . . . . . . . . . . . . . 166,779
Net Cash Provided by Operating Activities . . . . . . . . . . . . . . . . . . . . . . . . . . . . . . . . . . . . . . 454,706
CASH FLOWS FROM FINANCING ACTIVITIESIncrease in borrowings under term loan . . . . . . . . . . . . . . . . . . . . . . . . . . . . . . . . . . . . . . . . . . . . . 43,000Proceeds from issuance of shares of common stock . . . . . . . . . . . . . . . . . . . . . . . . . . . . . . . . . . . . 10,035Proceeds from offering of mandatory redeemable preferred stock . . . . . . . . . . . . . . . . . . . . . . . . 50,000Redemption of notes . . . . . . . . . . . . . . . . . . . . . . . . . . . . . . . . . . . . . . . . . . . . . . . . . . . . . . . . . . . . (264,000)Redemption of mandatory redeemable preferred stock . . . . . . . . . . . . . . . . . . . . . . . . . . . . . . . . . (214,000)Costs associated with renewal of credit facility . . . . . . . . . . . . . . . . . . . . . . . . . . . . . . . . . . . . . . . (1,230)Costs associated with offering of mandatory redeemable preferred stock . . . . . . . . . . . . . . . . . . . (717)Cash distributions paid to common stockholders . . . . . . . . . . . . . . . . . . . . . . . . . . . . . . . . . . . . . . (224,436)
Net Cash Used in Financing Activities . . . . . . . . . . . . . . . . . . . . . . . . . . . . . . . . . . . . . . . . . . (601,348)
NET DECREASE IN CASH . . . . . . . . . . . . . . . . . . . . . . . . . . . . . . . . . . . . . . . . . . . . . . . . . . . . . . . . (146,642)CASH — BEGINNING OF YEAR . . . . . . . . . . . . . . . . . . . . . . . . . . . . . . . . . . . . . . . . . . . . . . . . . . . 147,737
CASH — END OF YEAR . . . . . . . . . . . . . . . . . . . . . . . . . . . . . . . . . . . . . . . . . . . . . . . . . . . . . . . . . . $ 1,095
Supplemental disclosure of cash flow information:
Non-cash financing activities not included herein consisted of reinvestment of distributions of $23,736 pursuantto the Company’s dividend reinvestment plan.
During the fiscal year ended November 30, 2016, interest paid related to debt obligations was $39,157 andincome tax paid was $156.
The Company received $4,750 of paid-in-kind dividends during the fiscal year ended November 30, 2016. SeeNote 2 — Significant Accounting Policies.
See accompanying notes to financial statements.
19
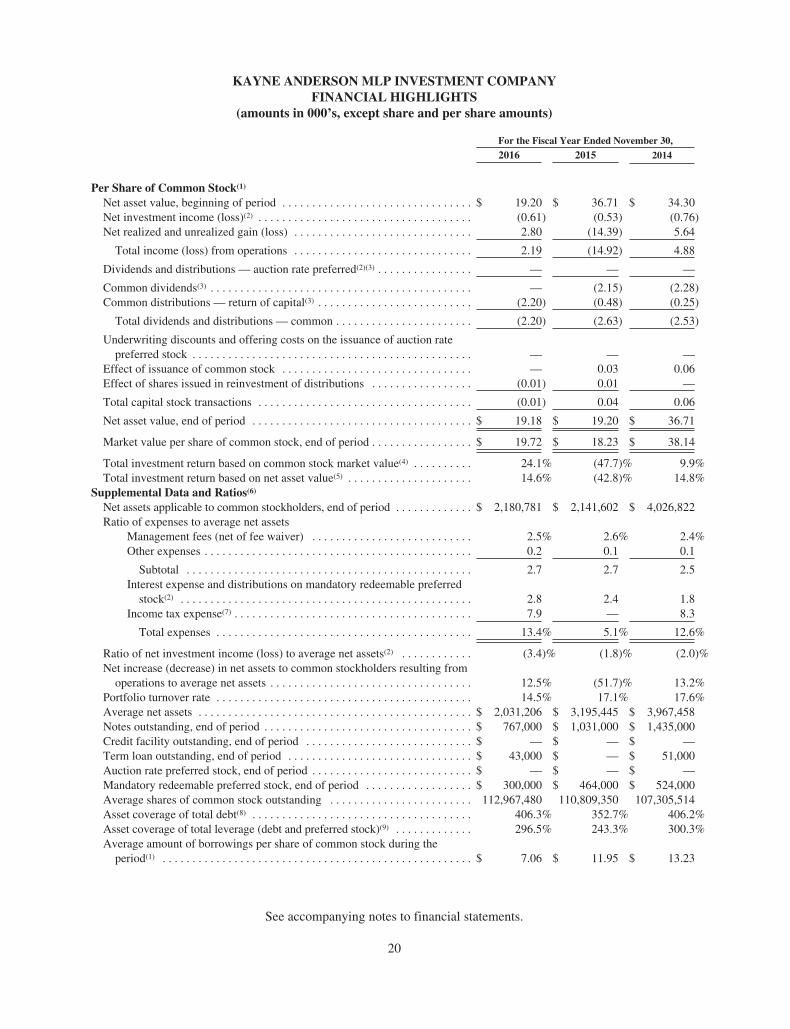
KAYNE ANDERSON MLP INVESTMENT COMPANYFINANCIAL HIGHLIGHTS
(amounts in 000’s, except share and per share amounts)
For the Fiscal Year Ended November 30,
2016 2015 2014
Per Share of Common Stock(1)
Net asset value, beginning of period . . . . . . . . . . . . . . . . . . . . . . . . . . . . . . . . $ 19.20 $ 36.71 $ 34.30Net investment income (loss)(2) . . . . . . . . . . . . . . . . . . . . . . . . . . . . . . . . . . . . (0.61) (0.53) (0.76)Net realized and unrealized gain (loss) . . . . . . . . . . . . . . . . . . . . . . . . . . . . . . 2.80 (14.39) 5.64
Total income (loss) from operations . . . . . . . . . . . . . . . . . . . . . . . . . . . . . . 2.19 (14.92) 4.88
Dividends and distributions — auction rate preferred(2)(3) . . . . . . . . . . . . . . . . — — —
Common dividends(3) . . . . . . . . . . . . . . . . . . . . . . . . . . . . . . . . . . . . . . . . . . . . — (2.15) (2.28)Common distributions — return of capital(3) . . . . . . . . . . . . . . . . . . . . . . . . . . (2.20) (0.48) (0.25)
Total dividends and distributions — common . . . . . . . . . . . . . . . . . . . . . . . (2.20) (2.63) (2.53)
Underwriting discounts and offering costs on the issuance of auction ratepreferred stock . . . . . . . . . . . . . . . . . . . . . . . . . . . . . . . . . . . . . . . . . . . . . . . — — —
Effect of issuance of common stock . . . . . . . . . . . . . . . . . . . . . . . . . . . . . . . . — 0.03 0.06Effect of shares issued in reinvestment of distributions . . . . . . . . . . . . . . . . . (0.01) 0.01 —
Total capital stock transactions . . . . . . . . . . . . . . . . . . . . . . . . . . . . . . . . . . . . (0.01) 0.04 0.06
Net asset value, end of period . . . . . . . . . . . . . . . . . . . . . . . . . . . . . . . . . . . . . $ 19.18 $ 19.20 $ 36.71
Market value per share of common stock, end of period . . . . . . . . . . . . . . . . . $ 19.72 $ 18.23 $ 38.14
Total investment return based on common stock market value(4) . . . . . . . . . . 24.1% (47.7)% 9.9%Total investment return based on net asset value(5) . . . . . . . . . . . . . . . . . . . . . 14.6% (42.8)% 14.8%
Supplemental Data and Ratios(6)
Net assets applicable to common stockholders, end of period . . . . . . . . . . . . . $ 2,180,781 $ 2,141,602 $ 4,026,822Ratio of expenses to average net assets
Management fees (net of fee waiver) . . . . . . . . . . . . . . . . . . . . . . . . . . . 2.5% 2.6% 2.4%Other expenses . . . . . . . . . . . . . . . . . . . . . . . . . . . . . . . . . . . . . . . . . . . . . 0.2 0.1 0.1
Subtotal . . . . . . . . . . . . . . . . . . . . . . . . . . . . . . . . . . . . . . . . . . . . . . . . 2.7 2.7 2.5Interest expense and distributions on mandatory redeemable preferred
stock(2) . . . . . . . . . . . . . . . . . . . . . . . . . . . . . . . . . . . . . . . . . . . . . . . . . 2.8 2.4 1.8Income tax expense(7) . . . . . . . . . . . . . . . . . . . . . . . . . . . . . . . . . . . . . . . . 7.9 — 8.3
Total expenses . . . . . . . . . . . . . . . . . . . . . . . . . . . . . . . . . . . . . . . . . . . 13.4% 5.1% 12.6%
Ratio of net investment income (loss) to average net assets(2) . . . . . . . . . . . . (3.4)% (1.8)% (2.0)%Net increase (decrease) in net assets to common stockholders resulting from
operations to average net assets . . . . . . . . . . . . . . . . . . . . . . . . . . . . . . . . . . 12.5% (51.7)% 13.2%Portfolio turnover rate . . . . . . . . . . . . . . . . . . . . . . . . . . . . . . . . . . . . . . . . . . . 14.5% 17.1% 17.6%Average net assets . . . . . . . . . . . . . . . . . . . . . . . . . . . . . . . . . . . . . . . . . . . . . . $ 2,031,206 $ 3,195,445 $ 3,967,458Notes outstanding, end of period . . . . . . . . . . . . . . . . . . . . . . . . . . . . . . . . . . . $ 767,000 $ 1,031,000 $ 1,435,000Credit facility outstanding, end of period . . . . . . . . . . . . . . . . . . . . . . . . . . . . $ — $ — $ —Term loan outstanding, end of period . . . . . . . . . . . . . . . . . . . . . . . . . . . . . . . $ 43,000 $ — $ 51,000Auction rate preferred stock, end of period . . . . . . . . . . . . . . . . . . . . . . . . . . . $ — $ — $ —Mandatory redeemable preferred stock, end of period . . . . . . . . . . . . . . . . . . $ 300,000 $ 464,000 $ 524,000Average shares of common stock outstanding . . . . . . . . . . . . . . . . . . . . . . . . 112,967,480 110,809,350 107,305,514Asset coverage of total debt(8) . . . . . . . . . . . . . . . . . . . . . . . . . . . . . . . . . . . . . 406.3% 352.7% 406.2%Asset coverage of total leverage (debt and preferred stock)(9) . . . . . . . . . . . . . 296.5% 243.3% 300.3%Average amount of borrowings per share of common stock during the
period(1) . . . . . . . . . . . . . . . . . . . . . . . . . . . . . . . . . . . . . . . . . . . . . . . . . . . . $ 7.06 $ 11.95 $ 13.23
20
See accompanying notes to financial statements.
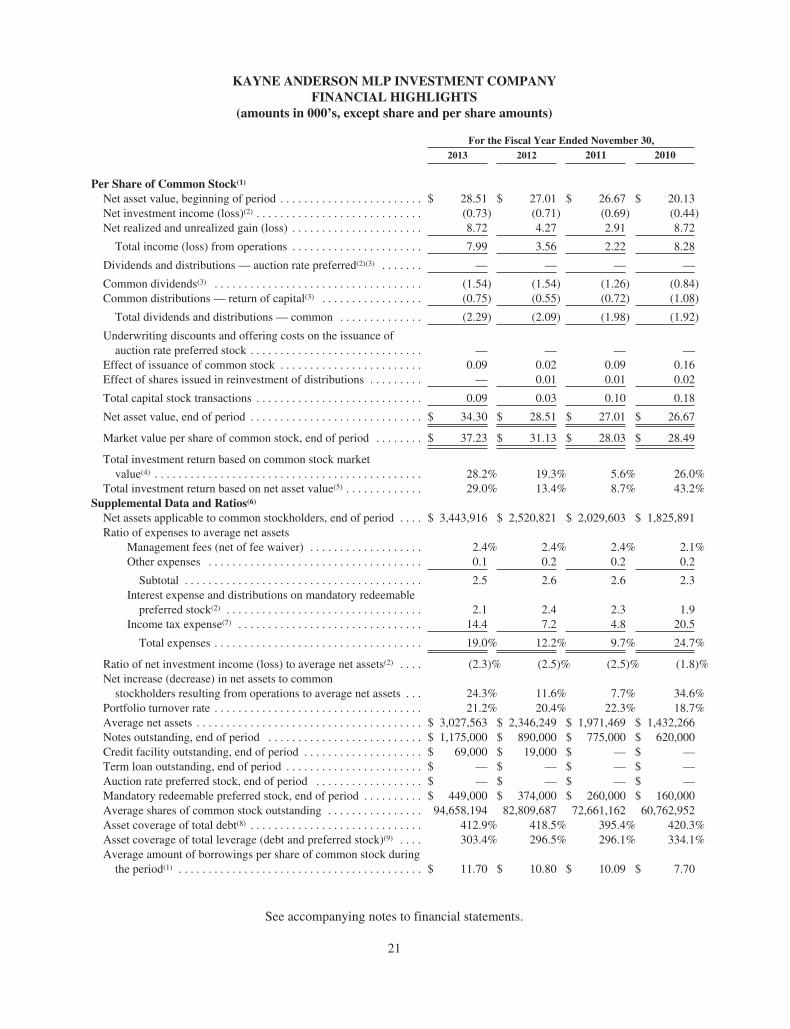
KAYNE ANDERSON MLP INVESTMENT COMPANYFINANCIAL HIGHLIGHTS
(amounts in 000’s, except share and per share amounts)
For the Fiscal Year Ended November 30,2013 2012 2011 2010
Per Share of Common Stock(1)
Net asset value, beginning of period . . . . . . . . . . . . . . . . . . . . . . . . $ 28.51 $ 27.01 $ 26.67 $ 20.13Net investment income (loss)(2) . . . . . . . . . . . . . . . . . . . . . . . . . . . . (0.73) (0.71) (0.69) (0.44)Net realized and unrealized gain (loss) . . . . . . . . . . . . . . . . . . . . . . 8.72 4.27 2.91 8.72
Total income (loss) from operations . . . . . . . . . . . . . . . . . . . . . . 7.99 3.56 2.22 8.28
Dividends and distributions — auction rate preferred(2)(3) . . . . . . . — — — —
Common dividends(3) . . . . . . . . . . . . . . . . . . . . . . . . . . . . . . . . . . . (1.54) (1.54) (1.26) (0.84)Common distributions — return of capital(3) . . . . . . . . . . . . . . . . . (0.75) (0.55) (0.72) (1.08)
Total dividends and distributions — common . . . . . . . . . . . . . . (2.29) (2.09) (1.98) (1.92)
Underwriting discounts and offering costs on the issuance ofauction rate preferred stock . . . . . . . . . . . . . . . . . . . . . . . . . . . . . — — — —
Effect of issuance of common stock . . . . . . . . . . . . . . . . . . . . . . . . 0.09 0.02 0.09 0.16Effect of shares issued in reinvestment of distributions . . . . . . . . . — 0.01 0.01 0.02
Total capital stock transactions . . . . . . . . . . . . . . . . . . . . . . . . . . . . 0.09 0.03 0.10 0.18
Net asset value, end of period . . . . . . . . . . . . . . . . . . . . . . . . . . . . . $ 34.30 $ 28.51 $ 27.01 $ 26.67
Market value per share of common stock, end of period . . . . . . . . $ 37.23 $ 31.13 $ 28.03 $ 28.49
Total investment return based on common stock marketvalue(4) . . . . . . . . . . . . . . . . . . . . . . . . . . . . . . . . . . . . . . . . . . . . . 28.2% 19.3% 5.6% 26.0%
Total investment return based on net asset value(5) . . . . . . . . . . . . . 29.0% 13.4% 8.7% 43.2%Supplemental Data and Ratios(6)
Net assets applicable to common stockholders, end of period . . . . $ 3,443,916 $ 2,520,821 $ 2,029,603 $ 1,825,891Ratio of expenses to average net assets
Management fees (net of fee waiver) . . . . . . . . . . . . . . . . . . . 2.4% 2.4% 2.4% 2.1%Other expenses . . . . . . . . . . . . . . . . . . . . . . . . . . . . . . . . . . . . 0.1 0.2 0.2 0.2
Subtotal . . . . . . . . . . . . . . . . . . . . . . . . . . . . . . . . . . . . . . . . 2.5 2.6 2.6 2.3Interest expense and distributions on mandatory redeemable
preferred stock(2) . . . . . . . . . . . . . . . . . . . . . . . . . . . . . . . . . 2.1 2.4 2.3 1.9Income tax expense(7) . . . . . . . . . . . . . . . . . . . . . . . . . . . . . . . 14.4 7.2 4.8 20.5
Total expenses . . . . . . . . . . . . . . . . . . . . . . . . . . . . . . . . . . . 19.0% 12.2% 9.7% 24.7%
Ratio of net investment income (loss) to average net assets(2) . . . . (2.3)% (2.5)% (2.5)% (1.8)%Net increase (decrease) in net assets to common
stockholders resulting from operations to average net assets . . . 24.3% 11.6% 7.7% 34.6%Portfolio turnover rate . . . . . . . . . . . . . . . . . . . . . . . . . . . . . . . . . . . 21.2% 20.4% 22.3% 18.7%Average net assets . . . . . . . . . . . . . . . . . . . . . . . . . . . . . . . . . . . . . . $ 3,027,563 $ 2,346,249 $ 1,971,469 $ 1,432,266Notes outstanding, end of period . . . . . . . . . . . . . . . . . . . . . . . . . . $ 1,175,000 $ 890,000 $ 775,000 $ 620,000Credit facility outstanding, end of period . . . . . . . . . . . . . . . . . . . . $ 69,000 $ 19,000 $ — $ —Term loan outstanding, end of period . . . . . . . . . . . . . . . . . . . . . . . $ — $ — $ — $ —Auction rate preferred stock, end of period . . . . . . . . . . . . . . . . . . $ — $ — $ — $ —Mandatory redeemable preferred stock, end of period . . . . . . . . . . $ 449,000 $ 374,000 $ 260,000 $ 160,000Average shares of common stock outstanding . . . . . . . . . . . . . . . . 94,658,194 82,809,687 72,661,162 60,762,952Asset coverage of total debt(8) . . . . . . . . . . . . . . . . . . . . . . . . . . . . . 412.9% 418.5% 395.4% 420.3%Asset coverage of total leverage (debt and preferred stock)(9) . . . . 303.4% 296.5% 296.1% 334.1%Average amount of borrowings per share of common stock during
the period(1) . . . . . . . . . . . . . . . . . . . . . . . . . . . . . . . . . . . . . . . . . $ 11.70 $ 10.80 $ 10.09 $ 7.70
21
See accompanying notes to financial statements.

KAYNE ANDERSON MLP INVESTMENT COMPANYFINANCIAL HIGHLIGHTS
(amounts in 000’s, except share and per share amounts)
For the Fiscal Year EndedNovember 30,
2009 2008 2007
Per Share of Common Stock(1)
Net asset value, beginning of period . . . . . . . . . . . . . . . . . . . . . . . . . . . . . . . . . . . $ 14.74 $ 30.08 $ 28.99Net investment income (loss)(2) . . . . . . . . . . . . . . . . . . . . . . . . . . . . . . . . . . . . . . . (0.33) (0.73) (0.73)Net realized and unrealized gain (loss) . . . . . . . . . . . . . . . . . . . . . . . . . . . . . . . . . 7.50 (12.56) 3.58
Total income (loss) from operations . . . . . . . . . . . . . . . . . . . . . . . . . . . . . . . . . 7.17 (13.29) 2.85
Dividends and distributions — auction rate preferred(2)(3) . . . . . . . . . . . . . . . . . . . (0.01) (0.10) (0.10)
Common dividends(3) . . . . . . . . . . . . . . . . . . . . . . . . . . . . . . . . . . . . . . . . . . . . . . . — — (0.09)Common distributions — return of capital(3) . . . . . . . . . . . . . . . . . . . . . . . . . . . . . (1.94) (1.99) (1.84)
Total dividends and distributions — common . . . . . . . . . . . . . . . . . . . . . . . . . . (1.94) (1.99) (1.93)
Underwriting discounts and offering costs on the issuance of auction ratepreferred stock . . . . . . . . . . . . . . . . . . . . . . . . . . . . . . . . . . . . . . . . . . . . . . . . . . — — —
Effect of issuance of common stock . . . . . . . . . . . . . . . . . . . . . . . . . . . . . . . . . . . 0.12 — 0.26Effect of shares issued in reinvestment of distributions . . . . . . . . . . . . . . . . . . . . 0.05 0.04 0.01
Total capital stock transactions . . . . . . . . . . . . . . . . . . . . . . . . . . . . . . . . . . . . . . . 0.17 0.04 0.27
Net asset value, end of period . . . . . . . . . . . . . . . . . . . . . . . . . . . . . . . . . . . . . . . . $ 20.13 $ 14.74 $ 30.08
Market value per share of common stock, end of period . . . . . . . . . . . . . . . . . . . . $ 24.43 $ 13.37 $ 28.27
Total investment return based on common stock market value(4) . . . . . . . . . . . . . 103.0% (48.8)% (4.4)%Total investment return based on net asset value(5) . . . . . . . . . . . . . . . . . . . . . . . . 51.7% (46.9)% 10.2%
Supplemental Data and Ratios(6)
Net assets applicable to common stockholders, end of period . . . . . . . . . . . . . . . $ 1,038,277 $ 651,156 $ 1,300,030Ratio of expenses to average net assets
Management fees (net of fee waiver) . . . . . . . . . . . . . . . . . . . . . . . . . . . . . . 2.1% 2.2% 2.3%Other expenses . . . . . . . . . . . . . . . . . . . . . . . . . . . . . . . . . . . . . . . . . . . . . . . . 0.4 0.3 0.2
Subtotal . . . . . . . . . . . . . . . . . . . . . . . . . . . . . . . . . . . . . . . . . . . . . . . . . . . 2.5 2.5 2.5Interest expense and distributions on mandatory redeemable preferred
stock(2) . . . . . . . . . . . . . . . . . . . . . . . . . . . . . . . . . . . . . . . . . . . . . . . . . . . . 2.5 3.4 2.3Income tax expense(7) . . . . . . . . . . . . . . . . . . . . . . . . . . . . . . . . . . . . . . . . . . . 25.4 — 3.5
Total expenses . . . . . . . . . . . . . . . . . . . . . . . . . . . . . . . . . . . . . . . . . . . . . . 30.4% 5.9% 8.3%
Ratio of net investment income (loss) to average net assets(2) . . . . . . . . . . . . . . . (2.0)% (2.8)% (2.3)%Net increase (decrease) in net assets to common stockholders resulting from
operations to average net assets . . . . . . . . . . . . . . . . . . . . . . . . . . . . . . . . . . . . . 43.2% (51.2)% 7.3%Portfolio turnover rate . . . . . . . . . . . . . . . . . . . . . . . . . . . . . . . . . . . . . . . . . . . . . . 28.9% 6.7% 10.6%Average net assets . . . . . . . . . . . . . . . . . . . . . . . . . . . . . . . . . . . . . . . . . . . . . . . . . $ 774,999 $ 1,143,192 $ 1,302,425Notes outstanding, end of period . . . . . . . . . . . . . . . . . . . . . . . . . . . . . . . . . . . . . . $ 370,000 $ 304,000 $ 505,000Credit facility outstanding, end of period . . . . . . . . . . . . . . . . . . . . . . . . . . . . . . . $ — $ — $ 97,000Term loan outstanding, end of period . . . . . . . . . . . . . . . . . . . . . . . . . . . . . . . . . . $ — $ — $ —Auction rate preferred stock, end of period . . . . . . . . . . . . . . . . . . . . . . . . . . . . . . $ 75,000 $ 75,000 $ 75,000Mandatory redeemable preferred stock, end of period . . . . . . . . . . . . . . . . . . . . . $ — $ — $ —Average shares of common stock outstanding . . . . . . . . . . . . . . . . . . . . . . . . . . . 46,894,632 43,671,666 41,134,949Asset coverage of total debt(8) . . . . . . . . . . . . . . . . . . . . . . . . . . . . . . . . . . . . . . . . 400.9% 338.9% 328.4%Asset coverage of total leverage (debt and preferred stock)(9) . . . . . . . . . . . . . . . . 333.3% 271.8% 292.0%Average amount of borrowings per share of common stock during the
period(1) . . . . . . . . . . . . . . . . . . . . . . . . . . . . . . . . . . . . . . . . . . . . . . . . . . . . . . . $ 6.79 $ 11.52 $ 12.14
22
See accompanying notes to financial statements.
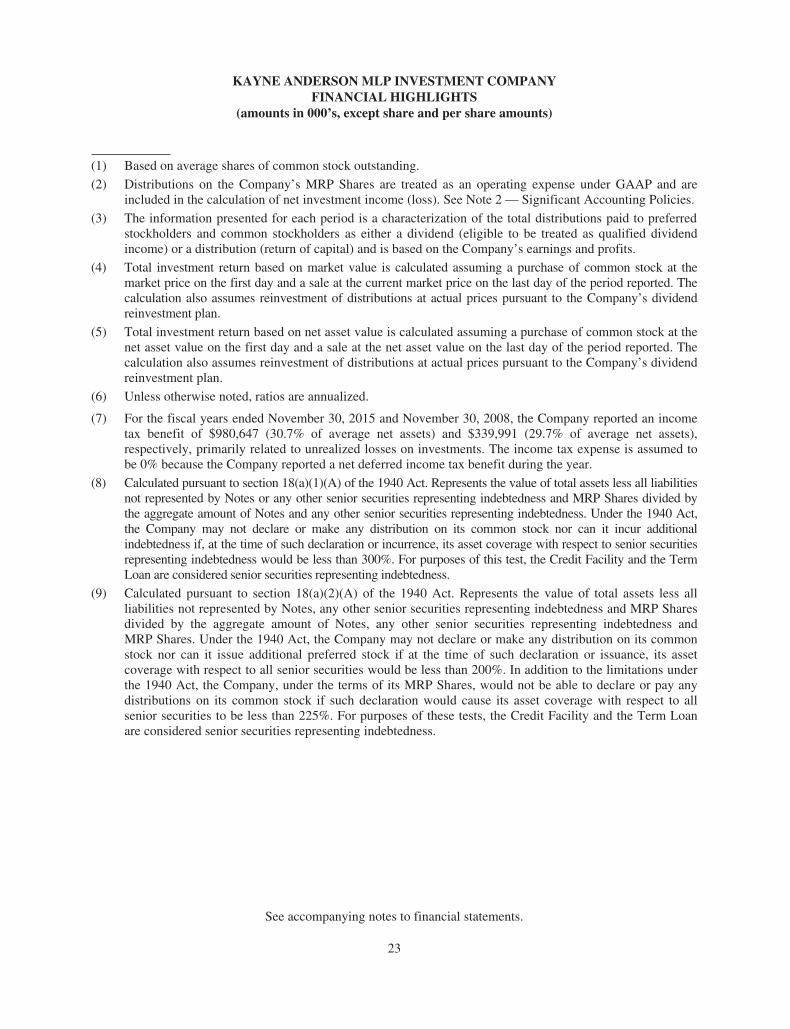
KAYNE ANDERSON MLP INVESTMENT COMPANYFINANCIAL HIGHLIGHTS
(amounts in 000’s, except share and per share amounts)
(1) Based on average shares of common stock outstanding.
(2) Distributions on the Company’s MRP Shares are treated as an operating expense under GAAP and areincluded in the calculation of net investment income (loss). See Note 2 — Significant Accounting Policies.
(3) The information presented for each period is a characterization of the total distributions paid to preferredstockholders and common stockholders as either a dividend (eligible to be treated as qualified dividendincome) or a distribution (return of capital) and is based on the Company’s earnings and profits.
(4) Total investment return based on market value is calculated assuming a purchase of common stock at themarket price on the first day and a sale at the current market price on the last day of the period reported. Thecalculation also assumes reinvestment of distributions at actual prices pursuant to the Company’s dividendreinvestment plan.
(5) Total investment return based on net asset value is calculated assuming a purchase of common stock at thenet asset value on the first day and a sale at the net asset value on the last day of the period reported. Thecalculation also assumes reinvestment of distributions at actual prices pursuant to the Company’s dividendreinvestment plan.
(6) Unless otherwise noted, ratios are annualized.
(7) For the fiscal years ended November 30, 2015 and November 30, 2008, the Company reported an incometax benefit of $980,647 (30.7% of average net assets) and $339,991 (29.7% of average net assets),respectively, primarily related to unrealized losses on investments. The income tax expense is assumed tobe 0% because the Company reported a net deferred income tax benefit during the year.
(8) Calculated pursuant to section 18(a)(1)(A) of the 1940 Act. Represents the value of total assets less all liabilitiesnot represented by Notes or any other senior securities representing indebtedness and MRP Shares divided bythe aggregate amount of Notes and any other senior securities representing indebtedness. Under the 1940 Act,the Company may not declare or make any distribution on its common stock nor can it incur additionalindebtedness if, at the time of such declaration or incurrence, its asset coverage with respect to senior securitiesrepresenting indebtedness would be less than 300%. For purposes of this test, the Credit Facility and the TermLoan are considered senior securities representing indebtedness.
(9) Calculated pursuant to section 18(a)(2)(A) of the 1940 Act. Represents the value of total assets less allliabilities not represented by Notes, any other senior securities representing indebtedness and MRP Sharesdivided by the aggregate amount of Notes, any other senior securities representing indebtedness andMRP Shares. Under the 1940 Act, the Company may not declare or make any distribution on its commonstock nor can it issue additional preferred stock if at the time of such declaration or issuance, its assetcoverage with respect to all senior securities would be less than 200%. In addition to the limitations underthe 1940 Act, the Company, under the terms of its MRP Shares, would not be able to declare or pay anydistributions on its common stock if such declaration would cause its asset coverage with respect to allsenior securities to be less than 225%. For purposes of these tests, the Credit Facility and the Term Loanare considered senior securities representing indebtedness.
See accompanying notes to financial statements.
23
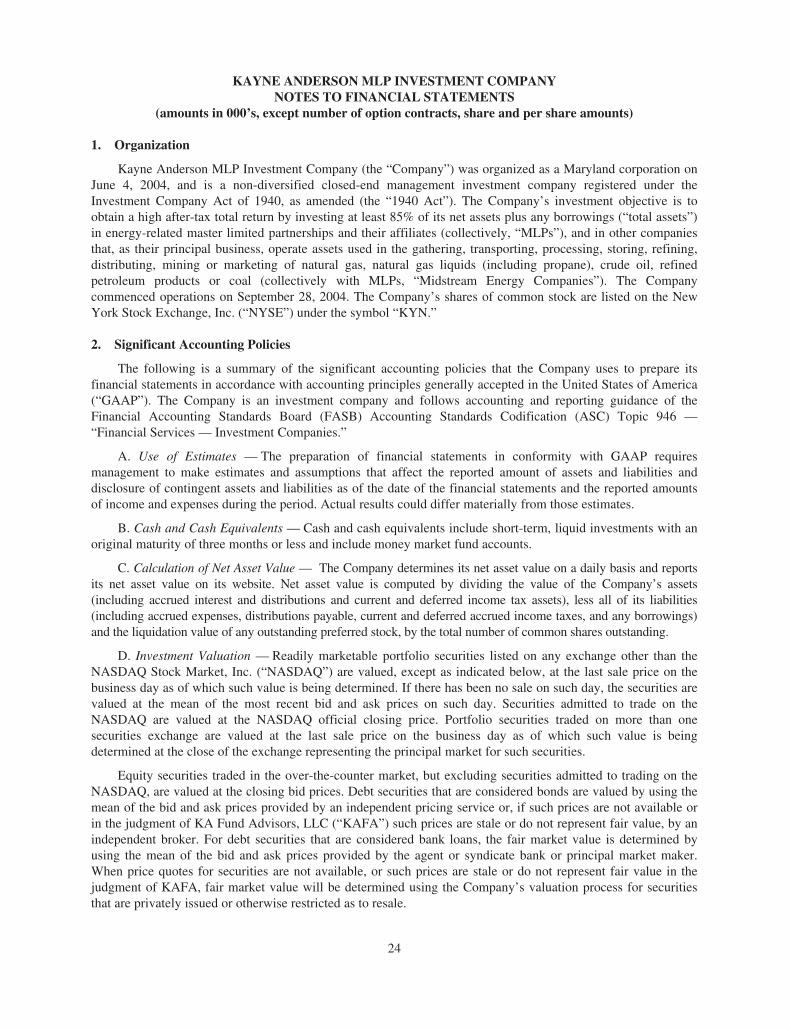
KAYNE ANDERSON MLP INVESTMENT COMPANYNOTES TO FINANCIAL STATEMENTS
(amounts in 000’s, except number of option contracts, share and per share amounts)
1. Organization
Kayne Anderson MLP Investment Company (the “Company”) was organized as a Maryland corporation onJune 4, 2004, and is a non-diversified closed-end management investment company registered under theInvestment Company Act of 1940, as amended (the “1940 Act”). The Company’s investment objective is toobtain a high after-tax total return by investing at least 85% of its net assets plus any borrowings (“total assets”)in energy-related master limited partnerships and their affiliates (collectively, “MLPs”), and in other companiesthat, as their principal business, operate assets used in the gathering, transporting, processing, storing, refining,distributing, mining or marketing of natural gas, natural gas liquids (including propane), crude oil, refinedpetroleum products or coal (collectively with MLPs, “Midstream Energy Companies”). The Companycommenced operations on September 28, 2004. The Company’s shares of common stock are listed on the NewYork Stock Exchange, Inc. (“NYSE”) under the symbol “KYN.”
2. Significant Accounting Policies
The following is a summary of the significant accounting policies that the Company uses to prepare itsfinancial statements in accordance with accounting principles generally accepted in the United States of America(“GAAP”). The Company is an investment company and follows accounting and reporting guidance of theFinancial Accounting Standards Board (FASB) Accounting Standards Codification (ASC) Topic 946 —“Financial Services — Investment Companies.”
A. Use of Estimates — The preparation of financial statements in conformity with GAAP requiresmanagement to make estimates and assumptions that affect the reported amount of assets and liabilities anddisclosure of contingent assets and liabilities as of the date of the financial statements and the reported amountsof income and expenses during the period. Actual results could differ materially from those estimates.
B. Cash and Cash Equivalents — Cash and cash equivalents include short-term, liquid investments with anoriginal maturity of three months or less and include money market fund accounts.
C. Calculation of Net Asset Value — The Company determines its net asset value on a daily basis and reportsits net asset value on its website. Net asset value is computed by dividing the value of the Company’s assets(including accrued interest and distributions and current and deferred income tax assets), less all of its liabilities(including accrued expenses, distributions payable, current and deferred accrued income taxes, and any borrowings)and the liquidation value of any outstanding preferred stock, by the total number of common shares outstanding.
D. Investment Valuation — Readily marketable portfolio securities listed on any exchange other than theNASDAQ Stock Market, Inc. (“NASDAQ”) are valued, except as indicated below, at the last sale price on thebusiness day as of which such value is being determined. If there has been no sale on such day, the securities arevalued at the mean of the most recent bid and ask prices on such day. Securities admitted to trade on theNASDAQ are valued at the NASDAQ official closing price. Portfolio securities traded on more than onesecurities exchange are valued at the last sale price on the business day as of which such value is beingdetermined at the close of the exchange representing the principal market for such securities.
Equity securities traded in the over-the-counter market, but excluding securities admitted to trading on theNASDAQ, are valued at the closing bid prices. Debt securities that are considered bonds are valued by using themean of the bid and ask prices provided by an independent pricing service or, if such prices are not available orin the judgment of KA Fund Advisors, LLC (“KAFA”) such prices are stale or do not represent fair value, by anindependent broker. For debt securities that are considered bank loans, the fair market value is determined byusing the mean of the bid and ask prices provided by the agent or syndicate bank or principal market maker.When price quotes for securities are not available, or such prices are stale or do not represent fair value in thejudgment of KAFA, fair market value will be determined using the Company’s valuation process for securitiesthat are privately issued or otherwise restricted as to resale.
24
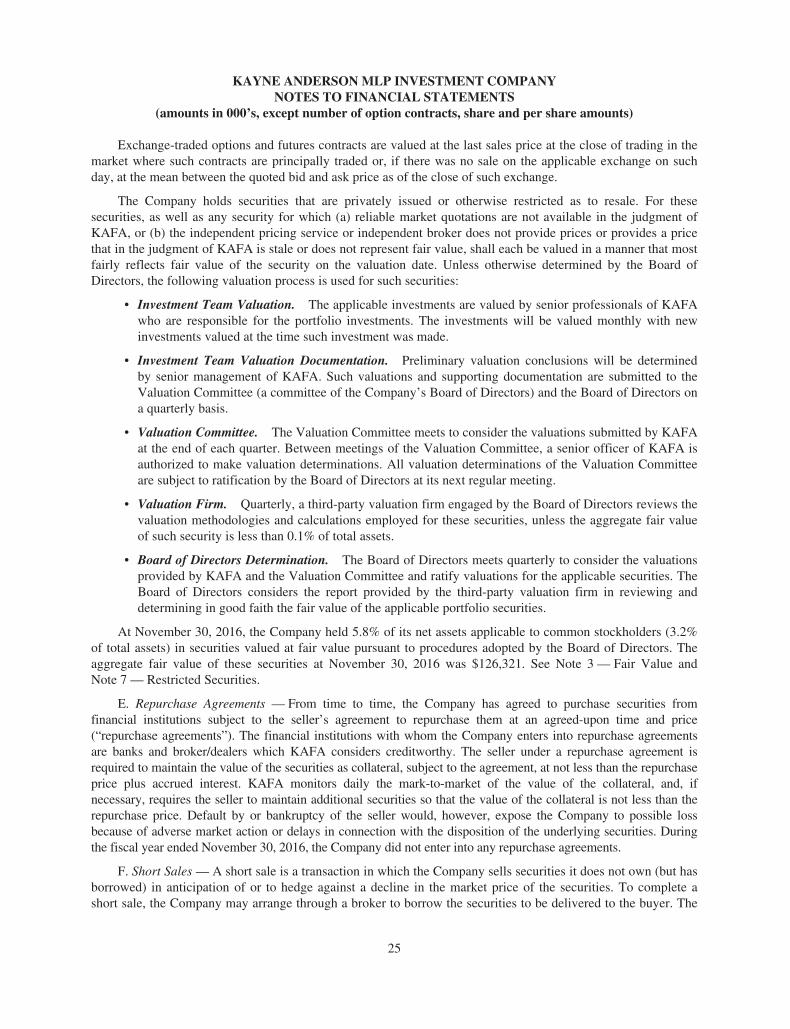
KAYNE ANDERSON MLP INVESTMENT COMPANYNOTES TO FINANCIAL STATEMENTS
(amounts in 000’s, except number of option contracts, share and per share amounts)
Exchange-traded options and futures contracts are valued at the last sales price at the close of trading in themarket where such contracts are principally traded or, if there was no sale on the applicable exchange on suchday, at the mean between the quoted bid and ask price as of the close of such exchange.
The Company holds securities that are privately issued or otherwise restricted as to resale. For thesesecurities, as well as any security for which (a) reliable market quotations are not available in the judgment ofKAFA, or (b) the independent pricing service or independent broker does not provide prices or provides a pricethat in the judgment of KAFA is stale or does not represent fair value, shall each be valued in a manner that mostfairly reflects fair value of the security on the valuation date. Unless otherwise determined by the Board ofDirectors, the following valuation process is used for such securities:
• Investment Team Valuation. The applicable investments are valued by senior professionals of KAFAwho are responsible for the portfolio investments. The investments will be valued monthly with newinvestments valued at the time such investment was made.
• Investment Team Valuation Documentation. Preliminary valuation conclusions will be determinedby senior management of KAFA. Such valuations and supporting documentation are submitted to theValuation Committee (a committee of the Company’s Board of Directors) and the Board of Directors ona quarterly basis.
• Valuation Committee. The Valuation Committee meets to consider the valuations submitted by KAFAat the end of each quarter. Between meetings of the Valuation Committee, a senior officer of KAFA isauthorized to make valuation determinations. All valuation determinations of the Valuation Committeeare subject to ratification by the Board of Directors at its next regular meeting.
• Valuation Firm. Quarterly, a third-party valuation firm engaged by the Board of Directors reviews thevaluation methodologies and calculations employed for these securities, unless the aggregate fair valueof such security is less than 0.1% of total assets.
• Board of Directors Determination. The Board of Directors meets quarterly to consider the valuationsprovided by KAFA and the Valuation Committee and ratify valuations for the applicable securities. TheBoard of Directors considers the report provided by the third-party valuation firm in reviewing anddetermining in good faith the fair value of the applicable portfolio securities.
At November 30, 2016, the Company held 5.8% of its net assets applicable to common stockholders (3.2%of total assets) in securities valued at fair value pursuant to procedures adopted by the Board of Directors. Theaggregate fair value of these securities at November 30, 2016 was $126,321. See Note 3 — Fair Value andNote 7 — Restricted Securities.
E. Repurchase Agreements — From time to time, the Company has agreed to purchase securities fromfinancial institutions subject to the seller’s agreement to repurchase them at an agreed-upon time and price(“repurchase agreements”). The financial institutions with whom the Company enters into repurchase agreementsare banks and broker/dealers which KAFA considers creditworthy. The seller under a repurchase agreement isrequired to maintain the value of the securities as collateral, subject to the agreement, at not less than the repurchaseprice plus accrued interest. KAFA monitors daily the mark-to-market of the value of the collateral, and, ifnecessary, requires the seller to maintain additional securities so that the value of the collateral is not less than therepurchase price. Default by or bankruptcy of the seller would, however, expose the Company to possible lossbecause of adverse market action or delays in connection with the disposition of the underlying securities. Duringthe fiscal year ended November 30, 2016, the Company did not enter into any repurchase agreements.
F. Short Sales — A short sale is a transaction in which the Company sells securities it does not own (but hasborrowed) in anticipation of or to hedge against a decline in the market price of the securities. To complete ashort sale, the Company may arrange through a broker to borrow the securities to be delivered to the buyer. The
25
KAYNE ANDERSON MLP INVESTMENT COMPANYNOTES TO FINANCIAL STATEMENTS
(amounts in 000’s, except number of option contracts, share and per share amounts)
proceeds received by the Company for the short sale are retained by the broker until the Company replaces theborrowed securities. In borrowing the securities to be delivered to the buyer, the Company becomes obligated toreplace the securities borrowed at their market price at the time of replacement, whatever the price may be.
The Company’s short sales, if any, are fully collateralized. The Company is required to maintain assetsconsisting of cash or liquid securities equal in amount to the liability created by the short sale. These assets areadjusted daily to reflect changes in the value of the securities sold short. The Company is liable for any dividendsor distributions paid on securities sold short.
The Company may also sell short “against the box” (i.e., the Company enters into a short sale as describedabove while holding an offsetting long position in the security which it sold short). If the Company enters into ashort sale “against the box,” the Company would segregate an equivalent amount of securities owned ascollateral while the short sale is outstanding. During the fiscal year ended November 30, 2016, the Company didnot engage in any short sales.
G. Security Transactions — Security transactions are accounted for on the date these securities arepurchased or sold (trade date). Realized gains and losses are calculated using the specific identification cost basismethod for GAAP purposes. Since the Company’s inception, it had also utilized the specific identification costbasis method for tax purposes. On July 13, 2015, the Company filed a request with the Internal Revenue Service(the “IRS”) to change the tax accounting method used to compute the adjusted tax cost basis of its MLPsecurities to the average cost method. On January 5, 2016, the Company received notification that the IRSapproved the tax accounting method change effective December 1, 2014. The tax accounting method changedoes not change the accounting method utilized for GAAP purposes. See Note 6 — Income Taxes.
H. Return of Capital Estimates — Distributions received from the Company’s investments in MLPs andother securities generally are comprised of income and return of capital. The Company records investmentincome and return of capital based on estimates made at the time such distributions are received. Since itsinception, the Company has estimated that 90% of distributions received from its MLP investments were returnof capital distributions. This estimate is adjusted to actual in the subsequent fiscal year when tax reportinginformation related to the Company’s MLP investments is received. Based on the actual return of capital duringthe previous two years, the Company revised its estimate of return of capital related to MLP investments to91%.” Such estimates for MLPs and other investments are based on historical information available from eachinvestment and other industry sources.
The return of capital portion of the distributions is a reduction to investment income that results in anequivalent reduction in the cost basis of the associated investments and increases net realized gains (losses) andnet change in unrealized gains (losses). If the cash distributions received by the Company exceed its cost basis(i.e. its cost basis is zero), the distributions are treated as realized gains.
The Company includes all cash distributions received on its Statement of Operations and reduces itsinvestment income by (i) the estimated return of capital and (ii) the distributions in excess of cost basis. For thefiscal year ended November 30, 2016, the Company estimated $283,982 of return of capital and $6,201 of cashdistributions that were in excess of cost basis. The cash distributions that were in excess of cost basis weretreated as realized gains.
In accordance with GAAP, the return of capital cost basis reductions for the Company’s MLP investmentsare limited to the total amount of the cash distributions received from such investments. For income tax purposes,the cost basis reductions for the Company’s MLP investments typically exceed cash distributions received fromsuch investments due to allocated losses from these investments. See Note 6 — Income Taxes. The following
26
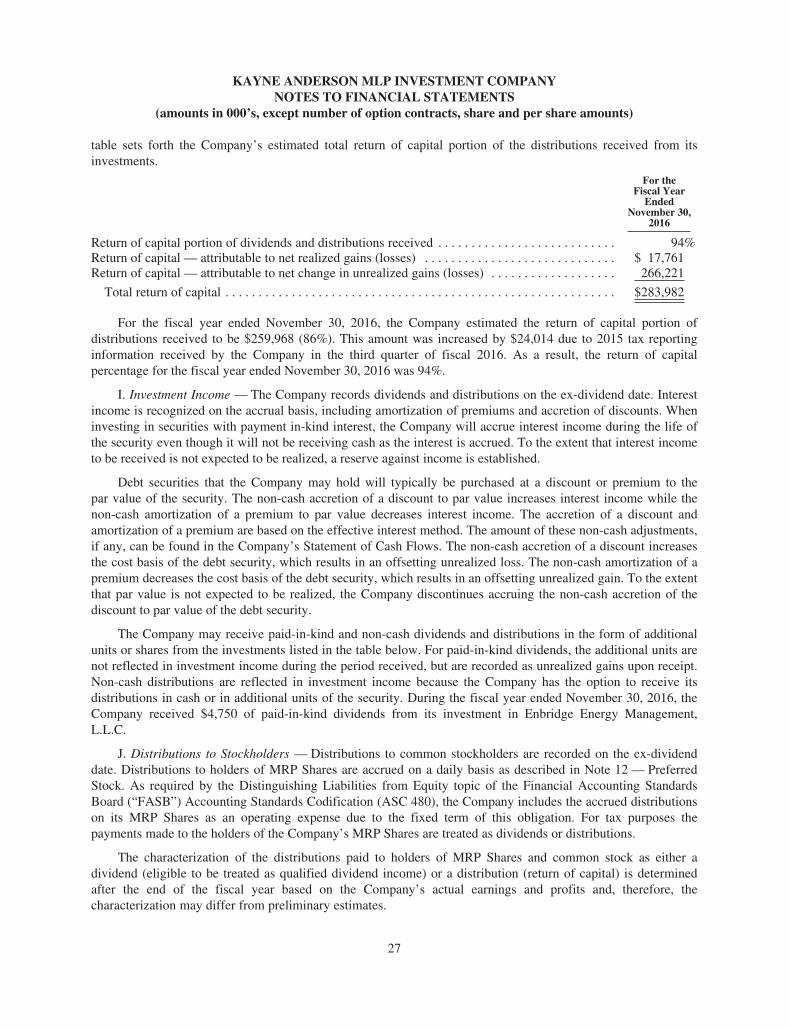
KAYNE ANDERSON MLP INVESTMENT COMPANYNOTES TO FINANCIAL STATEMENTS
(amounts in 000’s, except number of option contracts, share and per share amounts)
table sets forth the Company’s estimated total return of capital portion of the distributions received from itsinvestments.
For theFiscal Year
EndedNovember 30,
2016
Return of capital portion of dividends and distributions received . . . . . . . . . . . . . . . . . . . . . . . . . . . 94%Return of capital — attributable to net realized gains (losses) . . . . . . . . . . . . . . . . . . . . . . . . . . . . . $ 17,761Return of capital — attributable to net change in unrealized gains (losses) . . . . . . . . . . . . . . . . . . . 266,221
Total return of capital . . . . . . . . . . . . . . . . . . . . . . . . . . . . . . . . . . . . . . . . . . . . . . . . . . . . . . . . . . . $283,982
For the fiscal year ended November 30, 2016, the Company estimated the return of capital portion ofdistributions received to be $259,968 (86%). This amount was increased by $24,014 due to 2015 tax reportinginformation received by the Company in the third quarter of fiscal 2016. As a result, the return of capitalpercentage for the fiscal year ended November 30, 2016 was 94%.
I. Investment Income — The Company records dividends and distributions on the ex-dividend date. Interestincome is recognized on the accrual basis, including amortization of premiums and accretion of discounts. Wheninvesting in securities with payment in-kind interest, the Company will accrue interest income during the life ofthe security even though it will not be receiving cash as the interest is accrued. To the extent that interest incometo be received is not expected to be realized, a reserve against income is established.
Debt securities that the Company may hold will typically be purchased at a discount or premium to thepar value of the security. The non-cash accretion of a discount to par value increases interest income while thenon-cash amortization of a premium to par value decreases interest income. The accretion of a discount andamortization of a premium are based on the effective interest method. The amount of these non-cash adjustments,if any, can be found in the Company’s Statement of Cash Flows. The non-cash accretion of a discount increasesthe cost basis of the debt security, which results in an offsetting unrealized loss. The non-cash amortization of apremium decreases the cost basis of the debt security, which results in an offsetting unrealized gain. To the extentthat par value is not expected to be realized, the Company discontinues accruing the non-cash accretion of thediscount to par value of the debt security.
The Company may receive paid-in-kind and non-cash dividends and distributions in the form of additionalunits or shares from the investments listed in the table below. For paid-in-kind dividends, the additional units arenot reflected in investment income during the period received, but are recorded as unrealized gains upon receipt.Non-cash distributions are reflected in investment income because the Company has the option to receive itsdistributions in cash or in additional units of the security. During the fiscal year ended November 30, 2016, theCompany received $4,750 of paid-in-kind dividends from its investment in Enbridge Energy Management,L.L.C.
J. Distributions to Stockholders — Distributions to common stockholders are recorded on the ex-dividenddate. Distributions to holders of MRP Shares are accrued on a daily basis as described in Note 12 — PreferredStock. As required by the Distinguishing Liabilities from Equity topic of the Financial Accounting StandardsBoard (“FASB”) Accounting Standards Codification (ASC 480), the Company includes the accrued distributionson its MRP Shares as an operating expense due to the fixed term of this obligation. For tax purposes thepayments made to the holders of the Company’s MRP Shares are treated as dividends or distributions.
The characterization of the distributions paid to holders of MRP Shares and common stock as either adividend (eligible to be treated as qualified dividend income) or a distribution (return of capital) is determinedafter the end of the fiscal year based on the Company’s actual earnings and profits and, therefore, thecharacterization may differ from preliminary estimates.
27
KAYNE ANDERSON MLP INVESTMENT COMPANYNOTES TO FINANCIAL STATEMENTS
(amounts in 000’s, except number of option contracts, share and per share amounts)
K. Partnership Accounting Policy — The Company records its pro-rata share of the income (loss) andcapital gains (losses), to the extent of distributions it has received, allocated from the underlying partnerships andadjusts the cost basis of the underlying partnerships accordingly. These amounts are included in the Company’sStatement of Operations.
L. Federal and State Income Taxation — The Company, as a corporation, is obligated to pay federal and stateincome tax on its taxable income. The Company invests its assets primarily in MLPs, which generally are treated aspartnerships for federal income tax purposes. As a limited partner in the MLPs, the Company includes its allocableshare of the MLP’s taxable income or loss in computing its own taxable income. Deferred income taxes reflect(i) taxes on unrealized gains (losses), which are attributable to the difference between fair value and tax cost basis,(ii) the net tax effects of temporary differences between the carrying amounts of assets and liabilities for financialreporting purposes and the amounts used for income tax purposes and (iii) the net tax benefit of accumulated netoperating and capital losses. To the extent the Company has a deferred tax asset, consideration is given as towhether or not a valuation allowance is required. The need to establish a valuation allowance for deferred tax assetsis assessed periodically by the Company based on the Income Tax Topic of the FASB Accounting StandardsCodification (ASC 740), that it is more likely than not that some portion or all of the deferred tax asset will not berealized. In the assessment for a valuation allowance, consideration is given to all positive and negative evidencerelated to the realization of the deferred tax asset. This assessment considers, among other matters, the nature,frequency and severity of current and cumulative losses, forecasts of future profitability (which are highlydependent on future cash distributions from the Company’s MLP holdings), the duration of statutory carryforwardperiods and the associated risk that operating and capital loss carryforwards may expire unused.
The Company may rely to some extent on information provided by the MLPs, which may not necessarily betimely, to estimate taxable income allocable to the MLP units held in the portfolio and to estimate the associateddeferred tax liability. Such estimates are made in good faith. From time to time, as new information becomesavailable, the Company modifies its estimates or assumptions regarding the deferred tax liability.
Since the Company’s inception, it had utilized the specific identification tax accounting method to compute theadjusted tax cost basis of its MLP securities and for selection of lots to be sold. On July 13, 2015, the Company fileda request with the IRS to change the tax accounting method used to compute the adjusted tax cost basis of its MLPsecurities to the average cost method. On January 5, 2016, the Company received notification that the IRS approvedthe tax accounting method change effective December 1, 2014. See Note 6 — Income Taxes.
The Company’s policy is to classify interest and penalties associated with underpayment of federal and stateincome taxes, if any, as income tax expense on its Statement of Operations. Tax years subsequent to fiscal year2012 remain open and subject to examination by the federal and state tax authorities.
M. Derivative Financial Instruments — The Company may utilize derivative financial instruments in itsoperations.
In October 2016, the Securities and Exchange Commission (“SEC”) adopted new rules and forms, andamendments to certain current rules and forms, to modernize reporting and disclosure of information byregistered investment companies. The amendments to Regulation S-X will require standardized, enhanceddisclosure about derivatives in investment company financial statements, and will also change the rulesgoverning the form and content of such financial statements. The amendments to Regulation S-X take effect onAugust 1, 2017. At this time, the Company is assessing the anticipated impact of these regulatory developmentsand will adopt these when they become effective.
Interest rate swap contracts. The Company may use hedging techniques such as interest rate swaps tomitigate potential interest rate risk on a portion of the Company’s leverage. Such interest rate swaps wouldprincipally be used to protect the Company against higher costs on its leverage resulting from increases ininterest rates. The Company does not hedge any interest rate risk associated with portfolio holdings. Interest ratetransactions the Company uses for hedging purposes expose it to certain risks that differ from the risks associated
28
KAYNE ANDERSON MLP INVESTMENT COMPANYNOTES TO FINANCIAL STATEMENTS
(amounts in 000’s, except number of option contracts, share and per share amounts)
with its portfolio holdings. A decline in interest rates may result in a decline in the value of the swap contracts,which, everything else being held constant, would result in a decline in the net assets of the Company. Inaddition, if the counterparty to an interest rate swap defaults, the Company would not be able to use theanticipated net receipts under the interest rate swap to offset its cost of financial leverage.
Interest rate swap contracts are recorded at fair value with changes in value during the reporting period, andamounts accrued under the agreements, included as unrealized gains or losses in the Statement of Operations.Monthly cash settlements under the terms of the interest rate swap agreements or termination payments arerecorded as realized gains or losses in the Statement of Operations. The Company generally values its interestrate swap contracts based on dealer quotations, if available, or by discounting the future cash flows from thestated terms of the interest rate swap agreement by using interest rates currently available in the market.See Note 8 — Derivative Financial Instruments.
Option contracts. The Company is also exposed to financial market risks including changes in the valuationsof its investment portfolio. The Company may purchase or write (sell) call options. A call option on a security is acontract that gives the holder of the option, in return for a premium, the right to buy from the writer of the option thesecurity underlying the option at a specified exercise price at any time during the term of the option.
The Company would realize a gain on a purchased call option if, during the option period, the value of suchsecurities exceeded the sum of the exercise price, the premium paid and transaction costs; otherwise theCompany would realize either no gain or a loss on the purchased call option. The Company may also purchaseput option contracts. If a purchased put option is exercised, the premium paid increases the cost basis of thesecurities sold by the Company.
The Company may also write (sell) call options with the purpose of generating realized gains or reducing itsownership of certain securities. If the Company writes a call option on a security, the Company has the obligationupon exercise of the option to deliver the underlying security upon payment of the exercise price. The Companywill only write call options on securities that the Company holds in its portfolio (i.e., covered calls).
When the Company writes a call option, an amount equal to the premium received by the Company is recorded asa liability and is subsequently adjusted to the current fair value of the option written. Premiums received from writingoptions that expire unexercised are treated by the Company on the expiration date as realized gains from investments.If the Company repurchases a written call option prior to its exercise, the difference between the premium received andthe amount paid to repurchase the option is treated as a realized gain or loss. If a call option is exercised, the premiumis added to the proceeds from the sale of the underlying security in determining whether the Company has realized again or loss. The Company, as the writer of an option, bears the market risk of an unfavorable change in the price of thesecurity underlying the written option. See Note 8 — Derivative Financial Instruments.
N. Indemnifications — Under the Company’s organizational documents, its officers and directors areindemnified against certain liabilities arising out of the performance of their duties to the Company. In addition,in the normal course of business, the Company enters into contracts that provide general indemnification to otherparties. The Company’s maximum exposure under these arrangements is unknown, as this would involve futureclaims that may be made against the Company that have not yet occurred, and may not occur. However, theCompany has not had prior claims or losses pursuant to these contracts and expects the risk of loss to be remote.
O. Offering and Debt Issuance Costs — Offering costs incurred by the Company related to the issuance ofits common stock reduce additional paid-in capital when the stock is issued. Costs incurred by the Companyrelated to the issuance of its debt (credit facility, term loan or senior notes) or its preferred stock are capitalizedand amortized over the period the debt or preferred stock is outstanding.
In April 2015, the FASB issued Accounting Standards Update (“ASU”) No. 2015-03 “Interest —Imputation of Interest (Subtopic 835-30), Simplifying the Presentation of Debt Issuance Costs”.ASU No. 2015-03 requires that all costs incurred to issue debt be presented in the balance sheet as a direct
29
KAYNE ANDERSON MLP INVESTMENT COMPANYNOTES TO FINANCIAL STATEMENTS
(amounts in 000’s, except number of option contracts, share and per share amounts)
deduction from the carrying value of the debt. In August 2015, the FASB issued ASU No. 2015-15 “Interest —Imputation of Interest (Subtopic 835-30), Presentation and Subsequent Measurement of Debt Issuance CostsAssociated with Line-of-Credit Arrangements”. ASU No. 2015-15 states that the SEC staff will not object to anentity presenting the cost of securing a revolving line of credit as an asset, regardless of whether a balance isoutstanding. ASU No. 2015-03 and ASU No. 2015-15 are effective for fiscal years beginning after December 15,2015, and interim periods within those fiscal years, and should be applied retrospectively. The Company willadopt these changes related to balance sheet presentation in fiscal 2017 when they become effective.
3. Fair Value
The Fair Value Measurement Topic of the FASB Accounting Standards Codification (“ASC 820”) definesfair value as the price at which an orderly transaction to sell an asset or to transfer a liability would take placebetween market participants under current market conditions at the measurement date. As required by ASC 820,the Company has performed an analysis of all assets and liabilities (other than deferred taxes) measured at fairvalue to determine the significance and character of all inputs to their fair value determination. Inputs are theassumptions, along with considerations of risk, that a market participant would use to value an asset or a liability.In general, observable inputs are based on market data that is readily available, regularly distributed andverifiable that the Company obtains from independent, third-party sources. Unobservable inputs are developed bythe Company based on its own assumptions of how market participants would value an asset or a liability.
Accounting Standards Update (“ASU”) No. 2011-04 “Amendments to Achieve Common Fair ValueMeasurement and Disclosure Requirements in U.S. GAAP and IFRSs” amends ASC 820. The amended guidanceclarifies the wording used to describe many requirements in accounting literature for fair value measurement anddisclosure to establish consistency between U.S. GAAP and International Financial Reporting Standards (“IFRSs”).
ASU No. 2011-04 requires the inclusion of additional disclosures on assumptions used by the Company todetermine fair value. Specifically, for assets measured at fair value using significant unobservable inputs(Level 3), ASU No. 2011-04 requires that the Company (i) describe the valuation process, (ii) disclosequantitative information about unobservable inputs and (iii) provide a qualitative discussion about the sensitivityof the fair value measurement to changes in the unobservable inputs and inter-relationships between the inputs.
The fair value hierarchy prioritizes the inputs to valuation techniques used to measure fair value into thefollowing three broad categories.
• Level 1 — Valuations based on quoted unadjusted prices for identical instruments in active marketstraded on a national exchange to which the Company has access at the date of measurement.
• Level 2 — Valuations based on quoted prices for similar instruments in active markets; quoted prices foridentical or similar instruments in markets that are not active; and model-derived valuations in which allsignificant inputs and significant value drivers are observable in active markets. Level 2 inputs are thosein markets for which there are few transactions, the prices are not current, little public information existsor instances where prices vary substantially over time or among brokered market makers.
• Level 3 — Model derived valuations in which one or more significant inputs or significant value driversare unobservable. Unobservable inputs are those inputs that reflect the Company’s own assumptions thatmarket participants would use to price the asset or liability based on the best available information.
The following table presents the Company’s assets and liabilities measured at fair value on a recurring basisat November 30, 2016, and the Company presents these assets and liabilities by security type and description onits Schedule of Investments or on its Statement of Assets and Liabilities. Note that the valuation levels below arenot necessarily an indication of the risk or liquidity associated with the underlying investment.
30

KAYNE ANDERSON MLP INVESTMENT COMPANYNOTES TO FINANCIAL STATEMENTS
(amounts in 000’s, except number of option contracts, share and per share amounts)
Total
Quoted Prices inActive Markets
(Level 1)
Prices with OtherObservable Inputs
(Level 2)
UnobservableInputs
(Level 3)
Assets at Fair ValueEquity investments . . . . . . . . . . . . . . . . . . . . . . . . . $3,871,555 $3,700,316 $44,918(1) $126,321
Liabilities at Fair ValueCall option contracts written . . . . . . . . . . . . . . . . . $ 281 $ — $ 281 $ —
(1) The Company’s investment in Plains AAP, L.P. (“PAGP-AAP”) is exchangeable on a one-for-one basis intoeither Plains GP Holdings, L.P. (“PAGP”) shares or Plains All American Pipeline, L.P. (“PAA”) units at theCompany’s option. The Company values its PAGP-AAP investment on an “as exchanged” basis based on thehigher public market value of either PAGP or PAA. As of November 30, 2016, the Company’s PAGP-AAPinvestment is valued at PAGP’s closing price. The Company categorizes its investment as a Level 2 securityfor fair value reporting purposes.
For the fiscal year ended November 30, 2016, there were no transfers between Level 1 and Level 2.
As of November 30, 2016, the Company had Notes outstanding with aggregate principal amount of$767,000 and 12,000,000 shares of MRP Shares outstanding with a total liquidation value of $300,000. SeeNote 11 — Notes and Note 12 — Preferred Stock.
Of the $300,000 of MRP Shares, Series F ($125,000 liquidation value) is publicly traded on the NYSE. As aresult, the Company categorizes this series of MRP Shares as Level 1 securities. The remaining series of MRPShares and all of the Notes were issued in private placements to institutional investors and are not listed on anyexchange or automated quotation system. As such, the Company categorizes all of the Notes ($767,000 aggregateprincipal amount) and the remaining MRP Shares ($175,000 aggregate liquidation value) as Level 3 anddetermines the fair value of these instruments based on estimated market yields and credit spreads forcomparable instruments with similar maturity, terms and structure.
The Company records these Notes and MRP Shares on its Statement of Assets and Liabilities at principalamount or liquidation value. As of November 30, 2016, the estimated fair values of these leverage instrumentsare as follows.
InstrumentPrincipal Amount/Liquidation Value Fair Value
Notes (Series W, Y through GG and II through OO) . . . . . . . . . . . . . . . . . . . . . . . . . $767,000 $784,700MRP Shares (Series B, C, H, I and J) . . . . . . . . . . . . . . . . . . . . . . . . . . . . . . . . . . . . . $175,000 $176,100MRP Shares (Series F) . . . . . . . . . . . . . . . . . . . . . . . . . . . . . . . . . . . . . . . . . . . . . . . . $125,000 $127,050
The following table presents the Company’s assets measured at fair value on a recurring basis usingsignificant unobservable inputs (Level 3) for the fiscal year ended November 30, 2016.
EquityInvestments
Balance — November 30, 2015 . . . . . . . . . . . . . . . . . . . . . . . . . . . . . . . . . . . . . . . . . . . . . . . . . . . . . . . $ 21,926Purchases . . . . . . . . . . . . . . . . . . . . . . . . . . . . . . . . . . . . . . . . . . . . . . . . . . . . . . . . . . . . . . . . . . . . . . 113,916Transfers out to Level 1 and 2 . . . . . . . . . . . . . . . . . . . . . . . . . . . . . . . . . . . . . . . . . . . . . . . . . . . . . . (25,001)Realized gains (losses) . . . . . . . . . . . . . . . . . . . . . . . . . . . . . . . . . . . . . . . . . . . . . . . . . . . . . . . . . . . . —Unrealized gains (losses), net . . . . . . . . . . . . . . . . . . . . . . . . . . . . . . . . . . . . . . . . . . . . . . . . . . . . . . . 15,480
Balance — November 30, 2016 . . . . . . . . . . . . . . . . . . . . . . . . . . . . . . . . . . . . . . . . . . . . . . . . . . . . . . . $126,321
The purchases of $113,916 relates to the Company’s investments in Sunoco LP common units(December 2015), Western Gas Partners, LP convertible preferred units (April 2016), MPLX LP convertiblepreferred units (May 2016) and Rice Midstream Partners LP common units (October 2016).
31
KAYNE ANDERSON MLP INVESTMENT COMPANYNOTES TO FINANCIAL STATEMENTS
(amounts in 000’s, except number of option contracts, share and per share amounts)
The $25,001 transfers out to Level 1 relates to the Company’s investment in Sunoco LP that becamemarketable during the second quarter of 2016. The Company utilizes the beginning of the reporting periodmethod for determining transfer between levels.
The $15,480 of net unrealized gains relates to investments that are still held at the end of the reportingperiod, and the Company includes these unrealized gains on the Statement of Operations — Net Change inUnrealized Gains (Losses).
Valuation Techniques and Unobservable Inputs
Unless otherwise determined by the Board of Directors, the Company values its private investments inpublic equity (“PIPE”) investments that are convertible into or otherwise will become publicly tradeable (e.g.,through subsequent registration or expiration of a restriction on trading) based on the market value of thepublicly-traded security less a discount. This discount is initially equal to the discount negotiated at the time theCompany agrees to a purchase price. To the extent that such securities are convertible or otherwise becomepublicly traded within a time frame that may be reasonably determined, this discount will be amortized on astraight line basis over such estimated time frame.
The Company owns convertible preferred units of Capital Product Partners L.P. (“CPLP”), MPLX LP(“MPLX”) and Western Gas Partners, LP (“WES”) that were issued in private placements. The convertiblepreferred units are convertible on a one-for-one basis into common units and are senior to the underlyingcommon units of CPLP, MPLX and WES in terms of liquidation preference and priority of distributions. TheCompany’s Board of Directors has determined that it is appropriate to value the convertible preferred units usinga convertible pricing model. This model takes into account the attributes of the convertible preferred units,including the preferred dividend, conversion ratio and call features, to determine the estimated value of suchunits. In using this model, the Company estimates (i) the credit spread for the convertible preferred units, whichis based on credit spreads for companies in a similar line of business for CPLP and the credit spread of theMLP’s unsecured notes in the case of MPLX and WES, and (ii) the expected volatility for the underlyingcommon units, which is based on historical volatility. For CPLP, the Company applies a discount to the valuederived from the convertible pricing model to account for an expected discount in market prices for convertiblesecurities relative to the values calculated using the pricing model. For MPLX and WES, the Company applies adiscount to the value derived from the convertible pricing model to account for the expected period of illiquidity.In each case, if the resulting price for the convertible preferred units is less than the public market price for theunderlying common units at such time, the public market price for the common units will be used to value theconvertible preferred units.
The Company also has a private investment in the Creditors Trust of Miller Bros. Coal, LLC (“ClearwaterTrust”), which is a privately held entity. Clearwater Trust has an overriding royalty interest in certain coalreserves that were sold as part of the reorganization of Clearwater Natural Resources, LP. Clearwater Trust hasagreed to sell this overriding royalty interest and is receiving monthly installment payments through September2017 from the buyer as payment for this royalty interest. The Company values its interest in Clearwater Trustbased on the discounted cash flow from the expected monthly installment payments. Generally an increase in thediscount rate selected by the Company will result in a decrease in the fair value of Clearwater Trust.
Due to the inherent uncertainty of determining the fair value of investments that do not have a readily availablemarket value, the fair value of the Company’s investments may fluctuate from period to period. Additionally, thefair value of the Company’s investments may differ from the values that would have been used had a ready marketexisted for such investments and may differ materially from the values that the Company may ultimately realize.
32
KAYNE ANDERSON MLP INVESTMENT COMPANYNOTES TO FINANCIAL STATEMENTS
(amounts in 000’s, except number of option contracts, share and per share amounts)
The following table summarizes the significant unobservable inputs that the Company used to value itsportfolio investments categorized as Level 3 as of November 30, 2016:
Quantitative Table for Valuation TechniquesRange Weighted
AverageAssets at Fair Value Fair Value Valuation Technique Unobservable Inputs Low High
Rice Midstream PartnersLP (PIPE) – valuedbased on a discount tomarket value
$ 12,304 - Discount to publicly-tradedsecurities
- Current discount 1.8% 1.8% 1.8%
MPLX and WES – valuedbased on pricing model
92,957 - Convertible pricing model - Credit spread- Volatility- Illiquidity discount
4.0%30.0%0.5%
4.9%35.0%0.9%
4.6%32.5%0.9%
CPLP – valued based onpricing model
20,970 - Convertible pricing model - Credit spread- Volatility- Discount for marketability
7.8%40.0%10.0%
8.5%45.0%10.0%
8.1%42.5%10.0%
Clearwater Trust 90 - Discounted cash flow - Discount rate 20% 20% 20%
Total $126,321
4. Concentration of Risk
The Company’s investments are concentrated in the energy sector. The focus of the Company’s portfolio withinthe energy sector may present more risks than if the Company’s portfolio were broadly diversified across numeroussectors of the economy. A downturn in the energy sector would have a larger impact on the Company than on aninvestment company that does not focus on the energy sector. The performance of securities in the energy sector maylag the performance of other industries or the broader market as a whole. Additionally, to the extent that the Companyinvests a relatively high percentage of its assets in the securities of a limited number of issuers, the Company may bemore susceptible than a more widely diversified investment company to any single economic, political or regulatoryoccurrence. At November 30, 2016, the Company had the following investment concentrations:
Category
Percent ofLong-TermInvestments
Securities of energy companies . . . . . . . . . . . . . . . . . . . . . . . . . . . . . . . . . . . . . . . . . . . . . . . . . . . . . . . 100.0%Equity securities . . . . . . . . . . . . . . . . . . . . . . . . . . . . . . . . . . . . . . . . . . . . . . . . . . . . . . . . . . . . . . . . . . . 100.0%Securities of MLPs(1) . . . . . . . . . . . . . . . . . . . . . . . . . . . . . . . . . . . . . . . . . . . . . . . . . . . . . . . . . . . . . . . 95.7%Midstream Energy Companies . . . . . . . . . . . . . . . . . . . . . . . . . . . . . . . . . . . . . . . . . . . . . . . . . . . . . . . . 99.6%Largest single issuer . . . . . . . . . . . . . . . . . . . . . . . . . . . . . . . . . . . . . . . . . . . . . . . . . . . . . . . . . . . . . . . . 12.5%Restricted securities . . . . . . . . . . . . . . . . . . . . . . . . . . . . . . . . . . . . . . . . . . . . . . . . . . . . . . . . . . . . . . . . 4.4%
(1) Securities of MLPs consist of energy-related partnerships and their affiliates (including affiliates of MLPsthat own general partner interests or, in some cases subordinated units, registered or unregistered commonunits, or other limited partner units in a MLP) and partnerships that elected to be taxed as a corporation forfederal income tax purposes.
5. Agreements and Affiliations
A. Administration Agreement — The Company has entered into an administration and accountingagreement with Ultimus Fund Solutions, LLC (“Ultimus”), which may be amended from time to time. Pursuantto the agreement, Ultimus will provide certain administrative and accounting services for the Company. Theagreement has automatic one-year renewals unless earlier terminated by either party as provided under the termsof the agreement.
33

KAYNE ANDERSON MLP INVESTMENT COMPANYNOTES TO FINANCIAL STATEMENTS
(amounts in 000’s, except number of option contracts, share and per share amounts)
B. Investment Management Agreement — The Company has entered into an investment managementagreement with KA Fund Advisors, LLC (“KAFA”) under which KAFA, subject to the overall supervision of theCompany’s Board of Directors, manages the day-to-day operations of, and provides investment advisory servicesto, the Company. For providing these services, KAFA receives an investment management fee from theCompany. KAFA has also entered into a fee waiver agreement with the Company that provides for amanagement fee of 1.375% on average total assets up to $4,500,000, a fee of 1.25% on average total assetsbetween $4,500,000 and $9,500,000, a fee of 1.125% on average total assets between $9,500,000 and$14,500,000 and a fee of 1.0% on average total assets in excess of $14,500,000. On March 9, 2016, the Companyrenewed its investment management agreement and fee waiver agreement with KAFA for a period of one year.The investment management and fee waiver agreements will expire on March 31, 2017 and may be renewedannually thereafter upon approval of the Company’s Board of Directors (including a majority of the Company’sdirectors who are not “interested persons” of the Company, as such term is defined in the 1940 Act). For thefiscal year ended November 30, 2016, the Company paid management fees at an annual rate of 1.375% of theCompany’s average quarterly total assets (as defined in the investment management agreement).
For purposes of calculating the management fee the average total assets for each quarterly period aredetermined by averaging the total assets at the last day of that quarter with the total assets at the last day of theprior quarter. The Company’s total assets are equal to the Company’s gross asset value (which includes assetsattributable to the Company’s use of preferred stock, commercial paper or notes and other borrowings andexcludes any net deferred tax asset), minus the sum of the Company’s accrued and unpaid dividends anddistributions on any outstanding common stock and accrued and unpaid dividends and distributions on anyoutstanding preferred stock and accrued liabilities (other than liabilities associated with borrowing or leverage bythe Company and any accrued taxes, including, a deferred tax liability). Liabilities associated with borrowing orleverage by the Company include the principal amount of any borrowings, commercial paper or notes issued bythe Company, the liquidation preference of any outstanding preferred stock, and other liabilities from other formsof borrowing or leverage such as short positions and put or call options held or written by the Company.
C. Portfolio Companies — From time to time, the Company may “control” or may be an “affiliate” of oneor more of its portfolio companies, as each of these terms is defined in the 1940 Act. In general, under the 1940Act, the Company would be presumed to “control” a portfolio company if the Company and its affiliates owned25% or more of its outstanding voting securities and would be an “affiliate” of a portfolio company if theCompany and its affiliates owned 5% or more of its outstanding voting securities. The 1940 Act containsprohibitions and restrictions relating to transactions between investment companies and their affiliates (includingthe Company’s investment adviser), principal underwriters and affiliates of those affiliates or underwriters.
The Company believes that there are several factors that determine whether or not a security should beconsidered a “voting security” in complex structures such as limited partnerships of the kind in which theCompany invests. The Company also notes that the Securities and Exchange Commission (the “SEC”) staff hasissued guidance on the circumstances under which it would consider a limited partnership interest to constitute avoting security. Under most partnership agreements, the management of the partnership is vested in the generalpartner, and the limited partners, individually or collectively, have no rights to manage or influence managementof the partnership through such activities as participating in the selection of the managers or the board of thelimited partnership or the general partner. As a result, the Company believes that many of the limited partnershipinterests in which it invests should not be considered voting securities. However, it is possible that the SEC staffmay consider the limited partner interests the Company holds in certain limited partnerships to be votingsecurities. If such a determination were made, the Company may be regarded as a person affiliated with andcontrolling the issuer(s) of those securities for purposes of Section 17 of the 1940 Act.
In making such a determination as to whether to treat any class of limited partnership interests the Companyholds as a voting security, the Company considers, among other factors, whether or not the holders of suchlimited partnership interests have the right to elect the board of directors of the limited partnership or the generalpartner. If the holders of such limited partnership interests do not have the right to elect the board of directors, the
34

KAYNE ANDERSON MLP INVESTMENT COMPANYNOTES TO FINANCIAL STATEMENTS
(amounts in 000’s, except number of option contracts, share and per share amounts)
Company generally has not treated such security as a voting security. In other circumstances, based on the factsand circumstances of those partnership agreements, including the right to elect the directors of the generalpartner, the Company has treated those securities as voting securities. If the Company does not consider thesecurity to be a voting security, it will not consider such partnership to be an “affiliate” unless the Company andits affiliates own more than 25% of the outstanding securities of such partnership. Additionally, certainpartnership agreements give common unitholders the right to elect the partnership’s board of directors, but limitthe amount of voting securities any limited partner can hold to no more than 4.9% of the partnership’soutstanding voting securities (i.e., any amounts held in excess of such limit by a limited partner do not havevoting rights). In such instances, the Company does not consider itself to be an affiliate if it owns more than 5%of such partnership’s common units.
There is no assurance that the SEC staff will not consider that other limited partnership securities that theCompany owns and does not treat as voting securities are, in fact, voting securities for the purposes of Section 17 ofthe 1940 Act. If such determination were made, the Company will be required to abide by the restrictions on“control” or “affiliate” transactions as proscribed in the 1940 Act. The Company or any portfolio company that itcontrols, and its affiliates, may from time to time engage in certain of such joint transactions, purchases, sales andloans in reliance upon and in compliance with the conditions of certain exemptive rules promulgated by the SEC.The Company cannot make assurances, however, that it would be able to satisfy the conditions of these rules withrespect to any particular eligible transaction, or even if the Company were allowed to engage in such a transaction,that the terms would be more or as favorable to the Company or any company that it controls as those that could beobtained in an arm’s length transaction. As a result of these prohibitions, restrictions may be imposed on the size ofpositions that may be taken for the Company or on the type of investments that it could make.
Clearwater Trust — At November 30, 2016, the Company held approximately 63% of the Clearwater Trust. TheCompany believes that it is an “affiliate” of the trust under the 1940 Act by virtue of its majority interest in the trust.
Plains GP Holdings, L.P., Plains AAP, L.P. and Plains All American Pipeline, L.P. — Robert V. Sinnott isCo-Chairman of Kayne Anderson Capital Advisors, L.P. (“KACALP”), the managing member of KAFA.Mr. Sinnott also serves as a director of PAA GP Holdings LLC, which is the general partner of Plains GPHoldings L.P. (“PAGP”). Members of senior management of KACALP and KAFA and various affiliated fundsmanaged by KACALP own PAGP shares, Plains All American Pipeline, L.P. (“PAA”) units and interests inPlains AAP, L.P. (“PAGP-AAP”). The Company believes that it is an affiliate of PAA, PAGP and PAGP-AAPunder the 1940 Act by virtue of (i) the Company’s and other affiliated Kayne Anderson funds’ ownership interestin PAA, PAGP and PAGP-AAP and (ii) Mr. Sinnott’s participation on the board of PAA GP Holdings LLC.
ONEOK, Inc. and ONEOK Partners, L.P. — Kevin S. McCarthy, the Chief Executive Officer of theCompany, began serving as a director of ONEOK, Inc. (“OKE”) during December of 2015. OKE is the generalpartner of ONEOK Partners, L.P. (“OKS”). Despite Mr. McCarthy’s participation on the board of OKE, theCompany does not believe it is an affiliate of OKE or OKS because the Company’s and other Kayne Andersonfunds’ aggregate ownership of each entity does not meet the criteria described above.
The following table summarizes the Company’s investments in affiliates as of November 30, 2016:
Investment
No. ofShares/Units
(in 000’s)
Dividends andDistributions ReceivedDuring the Fiscal YearEnded November 30,
2016 Value
Clearwater Trust . . . . . . . . . . . . . . . . . . . . . . . . . . . . . . . . . . . . . . . N/A $ 63 $ 90Plains All American Pipeline, L.P. . . . . . . . . . . . . . . . . . . . . . . . . . 8,875 22,400 292,429Plains GP Holdings, L.P. . . . . . . . . . . . . . . . . . . . . . . . . . . . . . . . . . 23 593 817Plains GP Holdings, L.P. — Plains AAP, L.P. . . . . . . . . . . . . . . . . 1,278 3,061 44,918Total . . . . . . . . . . . . . . . . . . . . . . . . . . . . . . . . . . . . . . . . . . . . . . . . . $26,117 $338,254
35
KAYNE ANDERSON MLP INVESTMENT COMPANYNOTES TO FINANCIAL STATEMENTS
(amounts in 000’s, except number of option contracts, share and per share amounts)
6. Income Taxes
The Company’s taxes include current and deferred income taxes. Current income taxes reflect the estimatedincome tax liability or asset of the Company as of a measurement date. Deferred income taxes reflect (i) taxes onnet unrealized gains, which are attributable to the difference between fair market value and tax cost basis, (ii) thenet tax effects of temporary differences between the carrying amounts of assets and liabilities for financialreporting purposes and the amounts used for income tax purposes and (iii) the net tax benefit of accumulated netoperating losses, if any.
During the fourth quarter of fiscal 2016, the Company changed its state tax rate from 1.66% to 1.76% (netof federal benefit) based on updated state apportionment information. During the fiscal year ended November 30,2016, the Company paid $156 of state income taxes. As of November 30, 2016, the components of theCompany’s tax assets and liabilities are as follows.
Income tax receivable . . . . . . . . . . . . . . . . . . . . . . . . . . . . . . . . . . . . . . . . . . . . . . . . . . . . . . . . . . . . . . . $ 18,470
Deferred tax assets:Net operating loss carryforwards — Federal . . . . . . . . . . . . . . . . . . . . . . . . . . . . . . . . . . . . . . . . . . . $ 76,026Net operating loss carryforwards — State . . . . . . . . . . . . . . . . . . . . . . . . . . . . . . . . . . . . . . . . . . . . . 5,538Capital loss carryforwards — State . . . . . . . . . . . . . . . . . . . . . . . . . . . . . . . . . . . . . . . . . . . . . . . . . . 1,396AMT credit carryforwards . . . . . . . . . . . . . . . . . . . . . . . . . . . . . . . . . . . . . . . . . . . . . . . . . . . . . . . . . 3,631
Deferred tax liabilities:Net unrealized gains on investment securities . . . . . . . . . . . . . . . . . . . . . . . . . . . . . . . . . . . . . . . . . . (681,433)
Total deferred income tax liability, net . . . . . . . . . . . . . . . . . . . . . . . . . . . . . . . . . . . . . . . . . . . . . . . . . . $(594,842)
For the fiscal year ended November 30, 2016, the Company generated a net operating loss of $128,314. Inaddition, the Company generated a federal capital loss of $52,848 that expires in 2021 and can be carried back tothe three preceding tax years. It is anticipated that the capital losses generated during the fiscal year endedNovember 30, 2016 will be carried back to offset prior capital gains and taxable income resulting in federalrefunds of approximately $7,740. These carryback claims are expected to be filed shortly after filing the fiscal2016 tax returns in August 2017. The Company is also exploring the ability to carry back claims in various states.
During the fourth quarter of fiscal 2016, the Company filed federal carryback claims related to a netoperating loss in fiscal 2015. On December 27, 2016, the Company received refunds of $10,790 related to thesecarryback claims.
At November 30, 2016, the Company had a federal net operating loss carryforward of $223,104 (deferredtax asset of $76,026). Realization of the deferred tax assets and net operating loss carryforwards are dependent,in part, on generating sufficient taxable income prior to expiration of the loss carryforwards. The federal netoperating loss carryforward begins to expire in 2030. In addition, the Company has state net operating losscarryforwards of $204,542 (deferred tax asset of $5,538). The majority of the state net operating losscarryforwards expires during 2035.
At November 30, 2016, the Company had a state capital loss carryforward of $52,848 (deferred tax asset of$1,396). Realization of the capital loss carryforward is dependent on generating sufficient capital gains prior tothe expiration of the capital loss carryforward in 2021.
At November 30, 2016, the Company had alternative minimum tax (“AMT”) credit carryforwards of$3,631. AMT credits can be used to reduce regular tax to the extent that regular tax exceeds the AMT in a futureyear. AMT credits do not expire.
Although the Company currently has a net deferred tax liability, it periodically reviews the recoverability ofits deferred tax assets based on the weight of available evidence. When assessing the recoverability of itsdeferred tax assets, significant weight is given to the effects of potential future realized and unrealized gains on
36
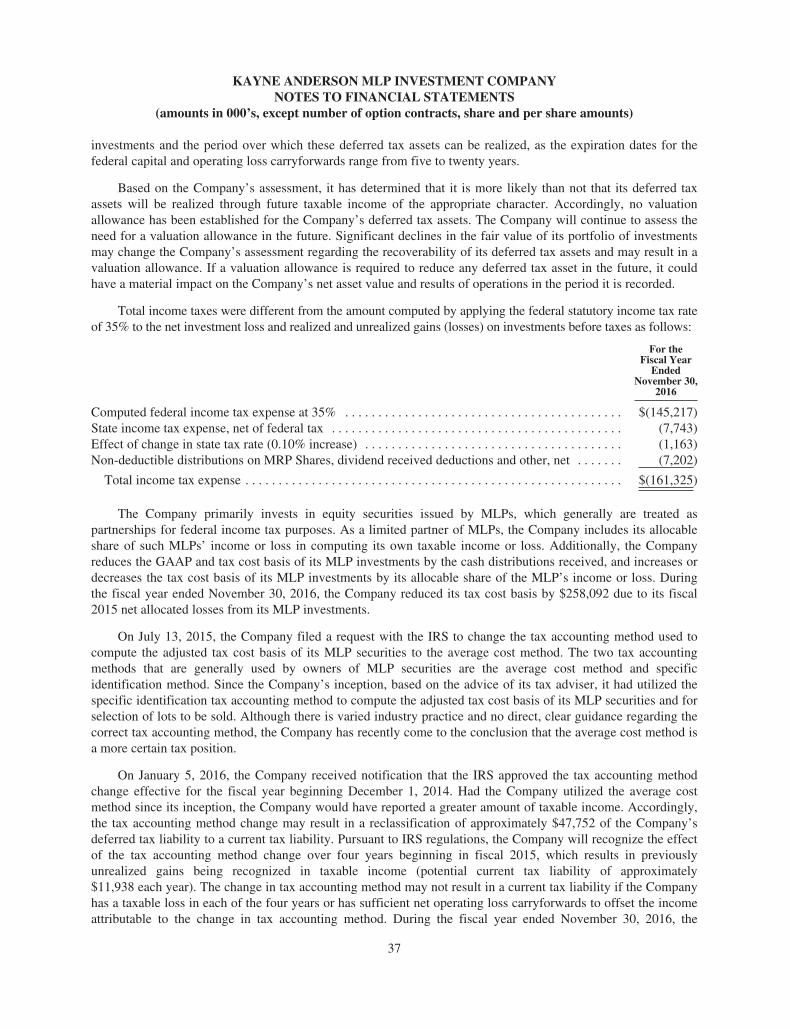
KAYNE ANDERSON MLP INVESTMENT COMPANYNOTES TO FINANCIAL STATEMENTS
(amounts in 000’s, except number of option contracts, share and per share amounts)
investments and the period over which these deferred tax assets can be realized, as the expiration dates for thefederal capital and operating loss carryforwards range from five to twenty years.
Based on the Company’s assessment, it has determined that it is more likely than not that its deferred taxassets will be realized through future taxable income of the appropriate character. Accordingly, no valuationallowance has been established for the Company’s deferred tax assets. The Company will continue to assess theneed for a valuation allowance in the future. Significant declines in the fair value of its portfolio of investmentsmay change the Company’s assessment regarding the recoverability of its deferred tax assets and may result in avaluation allowance. If a valuation allowance is required to reduce any deferred tax asset in the future, it couldhave a material impact on the Company’s net asset value and results of operations in the period it is recorded.
Total income taxes were different from the amount computed by applying the federal statutory income tax rateof 35% to the net investment loss and realized and unrealized gains (losses) on investments before taxes as follows:
For theFiscal Year
EndedNovember 30,
2016
Computed federal income tax expense at 35% . . . . . . . . . . . . . . . . . . . . . . . . . . . . . . . . . . . . . . . . . . $(145,217)State income tax expense, net of federal tax . . . . . . . . . . . . . . . . . . . . . . . . . . . . . . . . . . . . . . . . . . . . (7,743)Effect of change in state tax rate (0.10% increase) . . . . . . . . . . . . . . . . . . . . . . . . . . . . . . . . . . . . . . . (1,163)Non-deductible distributions on MRP Shares, dividend received deductions and other, net . . . . . . . (7,202)
Total income tax expense . . . . . . . . . . . . . . . . . . . . . . . . . . . . . . . . . . . . . . . . . . . . . . . . . . . . . . . . . $(161,325)
The Company primarily invests in equity securities issued by MLPs, which generally are treated aspartnerships for federal income tax purposes. As a limited partner of MLPs, the Company includes its allocableshare of such MLPs’ income or loss in computing its own taxable income or loss. Additionally, the Companyreduces the GAAP and tax cost basis of its MLP investments by the cash distributions received, and increases ordecreases the tax cost basis of its MLP investments by its allocable share of the MLP’s income or loss. Duringthe fiscal year ended November 30, 2016, the Company reduced its tax cost basis by $258,092 due to its fiscal2015 net allocated losses from its MLP investments.
On July 13, 2015, the Company filed a request with the IRS to change the tax accounting method used tocompute the adjusted tax cost basis of its MLP securities to the average cost method. The two tax accountingmethods that are generally used by owners of MLP securities are the average cost method and specificidentification method. Since the Company’s inception, based on the advice of its tax adviser, it had utilized thespecific identification tax accounting method to compute the adjusted tax cost basis of its MLP securities and forselection of lots to be sold. Although there is varied industry practice and no direct, clear guidance regarding thecorrect tax accounting method, the Company has recently come to the conclusion that the average cost method isa more certain tax position.
On January 5, 2016, the Company received notification that the IRS approved the tax accounting methodchange effective for the fiscal year beginning December 1, 2014. Had the Company utilized the average costmethod since its inception, the Company would have reported a greater amount of taxable income. Accordingly,the tax accounting method change may result in a reclassification of approximately $47,752 of the Company’sdeferred tax liability to a current tax liability. Pursuant to IRS regulations, the Company will recognize the effectof the tax accounting method change over four years beginning in fiscal 2015, which results in previouslyunrealized gains being recognized in taxable income (potential current tax liability of approximately$11,938 each year). The change in tax accounting method may not result in a current tax liability if the Companyhas a taxable loss in each of the four years or has sufficient net operating loss carryforwards to offset the incomeattributable to the change in tax accounting method. During the fiscal year ended November 30, 2016, the
37
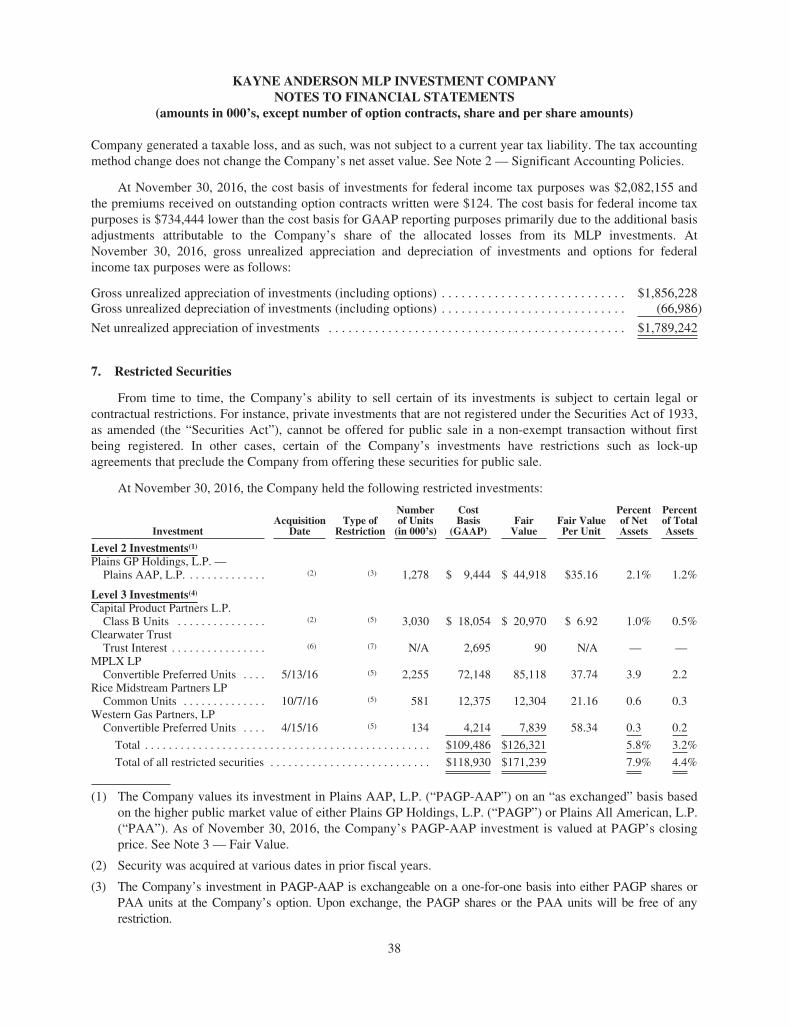
KAYNE ANDERSON MLP INVESTMENT COMPANYNOTES TO FINANCIAL STATEMENTS
(amounts in 000’s, except number of option contracts, share and per share amounts)
Company generated a taxable loss, and as such, was not subject to a current year tax liability. The tax accountingmethod change does not change the Company’s net asset value. See Note 2 — Significant Accounting Policies.
At November 30, 2016, the cost basis of investments for federal income tax purposes was $2,082,155 andthe premiums received on outstanding option contracts written were $124. The cost basis for federal income taxpurposes is $734,444 lower than the cost basis for GAAP reporting purposes primarily due to the additional basisadjustments attributable to the Company’s share of the allocated losses from its MLP investments. AtNovember 30, 2016, gross unrealized appreciation and depreciation of investments and options for federalincome tax purposes were as follows:
Gross unrealized appreciation of investments (including options) . . . . . . . . . . . . . . . . . . . . . . . . . . . . $1,856,228Gross unrealized depreciation of investments (including options) . . . . . . . . . . . . . . . . . . . . . . . . . . . . (66,986)
Net unrealized appreciation of investments . . . . . . . . . . . . . . . . . . . . . . . . . . . . . . . . . . . . . . . . . . . . . $1,789,242
7. Restricted Securities
From time to time, the Company’s ability to sell certain of its investments is subject to certain legal orcontractual restrictions. For instance, private investments that are not registered under the Securities Act of 1933,as amended (the “Securities Act”), cannot be offered for public sale in a non-exempt transaction without firstbeing registered. In other cases, certain of the Company’s investments have restrictions such as lock-upagreements that preclude the Company from offering these securities for public sale.
At November 30, 2016, the Company held the following restricted investments:
InvestmentAcquisition
DateType of
Restriction
Numberof Units
(in 000’s)
CostBasis
(GAAP)Fair
ValueFair ValuePer Unit
Percentof NetAssets
Percentof TotalAssets
Level 2 Investments(1)
Plains GP Holdings, L.P. —Plains AAP, L.P. . . . . . . . . . . . . . (2) (3) 1,278 $ 9,444 $ 44,918 $35.16 2.1% 1.2%
Level 3 Investments(4)
Capital Product Partners L.P.Class B Units . . . . . . . . . . . . . . . (2) (5) 3,030 $ 18,054 $ 20,970 $ 6.92 1.0% 0.5%
Clearwater TrustTrust Interest . . . . . . . . . . . . . . . . (6) (7) N/A 2,695 90 N/A — —
MPLX LPConvertible Preferred Units . . . . 5/13/16 (5) 2,255 72,148 85,118 37.74 3.9 2.2
Rice Midstream Partners LPCommon Units . . . . . . . . . . . . . . 10/7/16 (5) 581 12,375 12,304 21.16 0.6 0.3
Western Gas Partners, LPConvertible Preferred Units . . . . 4/15/16 (5) 134 4,214 7,839 58.34 0.3 0.2
Total . . . . . . . . . . . . . . . . . . . . . . . . . . . . . . . . . . . . . . . . . . . . . . . . $109,486 $126,321 5.8% 3.2%
Total of all restricted securities . . . . . . . . . . . . . . . . . . . . . . . . . . . $118,930 $171,239 7.9% 4.4%
(1) The Company values its investment in Plains AAP, L.P. (“PAGP-AAP”) on an “as exchanged” basis basedon the higher public market value of either Plains GP Holdings, L.P. (“PAGP”) or Plains All American, L.P.(“PAA”). As of November 30, 2016, the Company’s PAGP-AAP investment is valued at PAGP’s closingprice. See Note 3 — Fair Value.
(2) Security was acquired at various dates in prior fiscal years.
(3) The Company’s investment in PAGP-AAP is exchangeable on a one-for-one basis into either PAGP shares orPAA units at the Company’s option. Upon exchange, the PAGP shares or the PAA units will be free of anyrestriction.
38

KAYNE ANDERSON MLP INVESTMENT COMPANYNOTES TO FINANCIAL STATEMENTS
(amounts in 000’s, except number of option contracts, share and per share amounts)
(4) Securities are valued using inputs reflecting the Company’s own assumptions as more fully described inNote 2 — Significant Accounting Policies and Note 3 — Fair Value.
(5) Unregistered or restricted security of a publicly-traded company.
(6) The Company holds an interest in the Clearwater Trust consisting primarily of a coal royalty interest. SeeNote 5 — Agreements and Affiliations.
(7) Unregistered security of a private trust.
8. Derivative Financial Instruments
As required by the Derivatives and Hedging Topic of the FASB Accounting Standards Codification(ASC 815), the following are the derivative instruments and hedging activities of the Company. See Note 2 —Significant Accounting Policies.
Option Contracts — Transactions in option contracts for the fiscal year ended November 30, 2016 were asfollows:
Number ofContracts Premium
Call Options WrittenOptions outstanding at November 30, 2015 . . . . . . . . . . . . . . . . . . . . . . . . . . . . . . . . . . . . — $ —Options written . . . . . . . . . . . . . . . . . . . . . . . . . . . . . . . . . . . . . . . . . . . . . . . . . . . . . . . . . . 41,670 3,927Options subsequently repurchased(1) . . . . . . . . . . . . . . . . . . . . . . . . . . . . . . . . . . . . . . . . . . (24,100) (2,206)Options exercised . . . . . . . . . . . . . . . . . . . . . . . . . . . . . . . . . . . . . . . . . . . . . . . . . . . . . . . . (11,160) (1,012)Options expired . . . . . . . . . . . . . . . . . . . . . . . . . . . . . . . . . . . . . . . . . . . . . . . . . . . . . . . . . . (5,410) (585)
Options outstanding at November 30, 2016(2) . . . . . . . . . . . . . . . . . . . . . . . . . . . . . . . . . 1,000 $ 124
(1) The price at which the Company subsequently repurchased the options was $402 which resulted in netrealized gains of $1,804.
(2) The percentage of long-term investments subject to call options written was 0.1% at November 30, 2016.
Interest Rate Swap Contracts — The Company may enter into interest rate swap contracts to partiallyhedge itself from increasing expense on its leverage resulting from increasing interest rates. At the time theinterest rate swap contracts reach their scheduled termination, there is a risk that the Company would not be ableto obtain a replacement transaction or that the terms of the replacement transaction would not be as favorable ason the expiring transaction. In addition, if the Company is required to terminate any swap contract early, then theCompany could be required to make a termination payment. As of November 30, 2016, the Company did nothave any interest rate swap contracts outstanding.
The following table sets forth the fair value of the Company’s derivative instruments on the Statement ofAssets and Liabilities:
Derivatives Not Accounted for asHedging Instruments Statement of Assets and Liabilities Location
Fair Value as ofNovember 30, 2016
Call options written . . . . . . . . . . . . . . . . . . . . . . Call option contracts written $(281)
39

KAYNE ANDERSON MLP INVESTMENT COMPANYNOTES TO FINANCIAL STATEMENTS
(amounts in 000’s, except number of option contracts, share and per share amounts)
The following table sets forth the effect of the Company’s derivative instruments on the Statement of Operations:
For the Fiscal Year EndedNovember 30, 2016
Derivatives Not Accounted for asHedging Instruments
Location of Gains/(Losses) on DerivativesRecognized in Income
Net RealizedGains/(Losses) on
DerivativesRecognized in
Income
Change inUnrealized
Gains/(Losses) onDerivatives
Recognized inIncome
Call options written . . . . . . . . . . . . . . . Options $2,389 $(157)
9. Investment Transactions
For the fiscal year ended November 30, 2016, the Company purchased and sold securities in the amounts of$516,557 and $795,593 (excluding short-term investments and options).
10. Credit Facility and Term Loan
At November 30, 2016, the Company had a $150,000 unsecured revolving credit facility (the “CreditFacility”) with a syndicate of lenders. The Credit Facility has a two-year term maturing on February 28, 2018.The interest rate on outstanding loan balances may vary between LIBOR plus 1.60% and LIBOR plus 2.25%,depending on the Company’s asset coverage ratios. The Company pays a fee of 0.30% per annum on any unusedamounts of the Credit Facility.
For the fiscal year ended November 30, 2016, the Company did not have any borrowings outstanding underthe Credit Facility. Under the terms of the Credit Facility, the Company is unable to borrow unless its net assetsexceed a minimum net asset value threshold ($800,507 as of November 30, 2016). As of November 30, 2016, theCompany was able to borrow under the Credit Facility because its net asset value ($2,180,781) was above theminimum net asset threshold.
At November 30, 2016, the Company had a $150,000 unsecured term loan (the “Term Loan”). The TermLoan has a five-year commitment maturing on February 18, 2019, and borrowings under the Term Loan bearinterest at a rate of LIBOR plus 1.30%. The Company pays a fee of 0.25% per annum on any unused amount ofthe Term Loan. Amounts borrowed under the Term Loan may be repaid and subsequently reborrowed. For thefiscal year ended November 30, 2016, the average amount outstanding under the Term Loan was $8,880 with aweighted average interest rate of 1.86%. Under the terms of the Term Loan the Company is unable to borrowunless its net assets exceed a minimum net asset threshold ($1,866,600 as of November 30, 2016). As ofNovember 30, 2016, the Company had $43,000 outstanding under the Term Loan at an interest rate of 1.86% andit was able to borrow under the Term Loan because its net asset value ($2,180,781) was above the minimum netasset threshold.
As of November 30, 2016, the Company was in compliance with all financial and operational covenantsrequired by the Credit Facility and Term Loan. See Financial Highlights for the Company’s asset coverage ratiosunder the 1940 Act.
40

KAYNE ANDERSON MLP INVESTMENT COMPANYNOTES TO FINANCIAL STATEMENTS
(amounts in 000’s, except number of option contracts, share and per share amounts)
11. Notes
At November 30, 2016, the Company had $767,000 aggregate principal amount of Notes outstanding.During the first quarter, the Company redeemed $264,000 of Notes. The table below sets forth a summary ofthose redemptions.
Date of Redemption Series Principal Redeemed Redemption Price
12/14/15 R $ 22,000 102.0%12/14/15 S 52,800 102.012/14/15 T 35,200 102.012/14/15 V 70,000 100.71/20/16 W 10,000 106.71/28/16 R 3,000 102.01/28/16 S 7,200 102.01/28/16 T 4,800 102.01/28/16 W 21,000 102.02/18/16 W 38,000 102.0
$264,000
The table below sets forth the key terms of each series of Notes outstanding at November 30, 2016.
Series
PrincipalOutstanding,November 30,
2015PrincipalRedeemed
PrincipalOutstanding,November 30,
2016
EstimatedFair Value
November 30,2016
FixedInterest Rate
MaturityDate
R $ 25,000 $ (25,000) $ — $ — 3.73% 11/9/17S 60,000 (60,000) — — 4.40% 11/9/20T 40,000 (40,000) — — 4.50% 11/9/22V 70,000 (70,000) — — 3.71% 5/26/16W 100,000 (69,000) 31,000 32,500 4.38% 5/26/18Y 20,000 — 20,000 20,300 2.91% 5/3/17Z 15,000 — 15,000 15,500 3.39% 5/3/19
AA 15,000 — 15,000 15,600 3.56% 5/3/20BB 35,000 — 35,000 36,600 3.77% 5/3/21CC 76,000 — 76,000 79,800 3.95% 5/3/22DD 75,000 — 75,000 76,200 2.74% 4/16/19EE 50,000 — 50,000 51,000 3.20% 4/16/21FF 65,000 — 65,000 66,300 3.57% 4/16/23GG 45,000 — 45,000 45,700 3.67% 4/16/25II 30,000 — 30,000 30,500 2.88% 7/30/19JJ 30,000 — 30,000 30,900 3.46% 7/30/21
KK 80,000 — 80,000 82,900 3.93% 7/30/24LL 50,000 — 50,000 50,500 2.89% 10/29/20
MM 40,000 — 40,000 40,300 3.26% 10/29/22NN 20,000 — 20,000 20,000 3.37% 10/29/23OO 90,000 — 90,000 90,100 3.46% 10/29/24
$1,031,000 $(264,000) $767,000 $784,700
Holders of the fixed rate Notes are entitled to receive cash interest payments semi-annually (on June 19 andDecember 19) at the fixed rate. As of November 30, 2016, the weighted average interest rate on the outstandingNotes was 3.46%.
As of November 30, 2016, each series of Notes was rated “AAA” by FitchRatings. In the event the creditrating on any series of Notes falls below “A-”, the interest rate on such series will increase by 1% during the period
41

KAYNE ANDERSON MLP INVESTMENT COMPANYNOTES TO FINANCIAL STATEMENTS
(amounts in 000’s, except number of option contracts, share and per share amounts)
of time such series is rated below “A-”. The Company is required to maintain a current rating from one ratingagency with respect to each series of Notes.
The Notes were issued in private placement offerings to institutional investors and are not listed on anyexchange or automated quotation system. The Notes contain various covenants related to other indebtedness,liens and limits on the Company’s overall leverage. Under the 1940 Act and the terms of the Notes, the Companymay not declare dividends or make other distributions on shares of its common stock or make purchases of suchshares if, at any time of the declaration, distribution or purchase, asset coverage with respect to the outstandingNotes would be less than 300%.
The Notes are redeemable in certain circumstances at the option of the Company. The Notes are also subject to amandatory redemption to the extent needed to satisfy certain requirements if the Company fails to meet an assetcoverage ratio required by law and is not able to cure the coverage deficiency by the applicable deadline, or fails tocure a deficiency as stated in the Company’s rating agency guidelines in a timely manner.
The Notes are unsecured obligations of the Company and, upon liquidation, dissolution or winding up of theCompany, will rank: (1) senior to all of the Company’s outstanding preferred shares; (2) senior to all of the Company’soutstanding common shares; (3) on a parity with any unsecured creditors of the Company and any unsecured seniorsecurities representing indebtedness of the Company; and (4) junior to any secured creditors of the Company.
At November 30, 2016, the Company was in compliance with all covenants under the Notes agreements.
12. Preferred Stock
At November 30, 2016, the Company had 12,000,000 shares of MRP Shares outstanding, with a totalliquidation value of $300,000 ($25.00 per share). On December 16, 2015 and on January 12, 2016, the Companyredeemed a total of 2,400,000 shares of its Series E MRP Shares at a redemption price equal to the liquidationvalue plus accumulated unpaid dividends. On October 3, 2016, the Company redeemed all 2,000,000 shares of itsSeries G MRP Shares with an aggregate liquidation value of $50,000 plus accumulated unpaid dividends.
On November 9, 2016, the Company completed a private placement of $50,000 of Series J MRP Shares. Netproceeds from the offering along with borrowings on the Company’s Term Loan were used to redeem all4,160,000 shares of its Series A MRP Shares ($104,000 liquidation value) at a redemption price equal to theliquidation value plus accumulated unpaid dividends. The table below sets forth the key terms of each series ofthe MRP Shares at November 30, 2016.
Series
LiquidationValue
November 30,2015
LiquidationValue
Redeemed
LiquidationValueIssued
LiquidationValue
November 30,2016
EstimatedFair Value
November 30,2016 Rate
MandatoryRedemption
Date
A $104,000 $(104,000) $ — $ — $ — 5.57% 5/7/17B 8,000 — — 8,000 8,100 4.53% 11/9/17C 42,000 — — 42,000 44,200 5.20% 11/9/20E 60,000 (60,000) — — — 4.25% 4/1/19F(1) 125,000 — — 125,000 127,050 3.50% 4/15/20G 50,000 (50,000) — — — 4.60% 10/1/21H 50,000 — — 50,000 50,400 4.06% 7/30/21I 25,000 — — 25,000 24,700 3.86% 10/29/22J — — 50,000 50,000 48,700 3.36% 11/9/21
$464,000 $(214,000) $50,000 $300,000 $303,150
(1) Series F MRP Shares are publicly traded on the NYSE under the symbol “KYNPRF”. The fair value isbased on the price of $25.41 as of November 30, 2016.
42
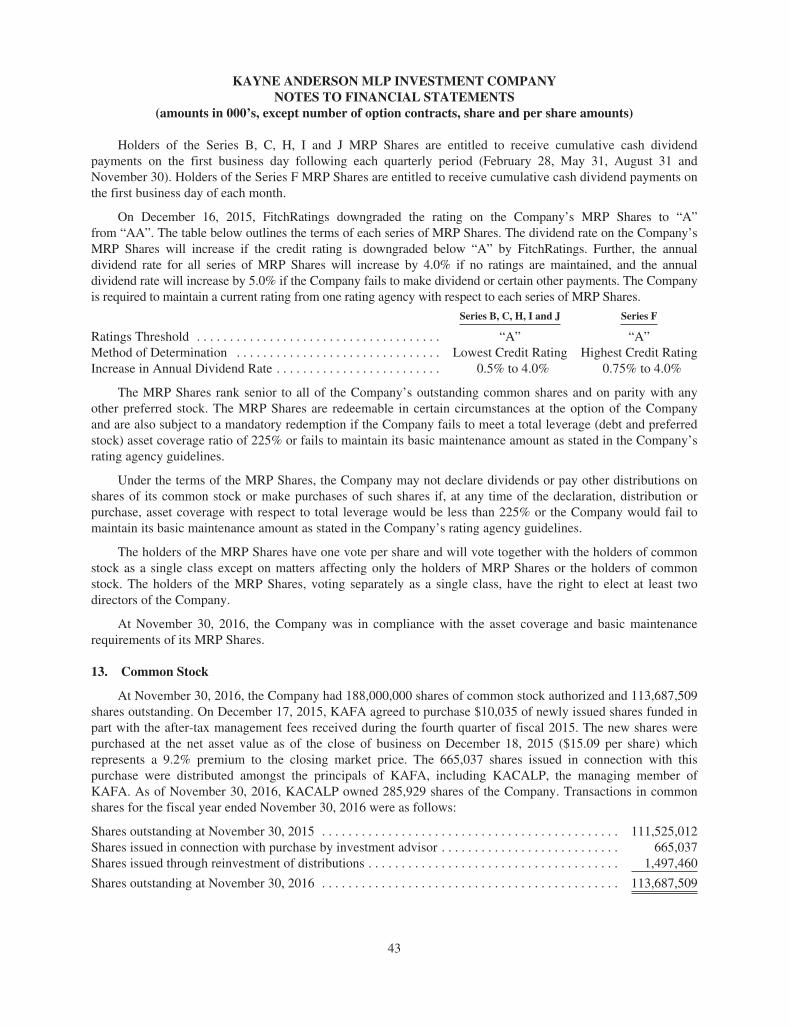
KAYNE ANDERSON MLP INVESTMENT COMPANYNOTES TO FINANCIAL STATEMENTS
(amounts in 000’s, except number of option contracts, share and per share amounts)
Holders of the Series B, C, H, I and J MRP Shares are entitled to receive cumulative cash dividendpayments on the first business day following each quarterly period (February 28, May 31, August 31 andNovember 30). Holders of the Series F MRP Shares are entitled to receive cumulative cash dividend payments onthe first business day of each month.
On December 16, 2015, FitchRatings downgraded the rating on the Company’s MRP Shares to “A”from “AA”. The table below outlines the terms of each series of MRP Shares. The dividend rate on the Company’sMRP Shares will increase if the credit rating is downgraded below “A” by FitchRatings. Further, the annualdividend rate for all series of MRP Shares will increase by 4.0% if no ratings are maintained, and the annualdividend rate will increase by 5.0% if the Company fails to make dividend or certain other payments. The Companyis required to maintain a current rating from one rating agency with respect to each series of MRP Shares.
Series B, C, H, I and J Series F
Ratings Threshold . . . . . . . . . . . . . . . . . . . . . . . . . . . . . . . . . . . . . “A” “A”Method of Determination . . . . . . . . . . . . . . . . . . . . . . . . . . . . . . . Lowest Credit Rating Highest Credit RatingIncrease in Annual Dividend Rate . . . . . . . . . . . . . . . . . . . . . . . . . 0.5% to 4.0% 0.75% to 4.0%
The MRP Shares rank senior to all of the Company’s outstanding common shares and on parity with anyother preferred stock. The MRP Shares are redeemable in certain circumstances at the option of the Companyand are also subject to a mandatory redemption if the Company fails to meet a total leverage (debt and preferredstock) asset coverage ratio of 225% or fails to maintain its basic maintenance amount as stated in the Company’srating agency guidelines.
Under the terms of the MRP Shares, the Company may not declare dividends or pay other distributions onshares of its common stock or make purchases of such shares if, at any time of the declaration, distribution orpurchase, asset coverage with respect to total leverage would be less than 225% or the Company would fail tomaintain its basic maintenance amount as stated in the Company’s rating agency guidelines.
The holders of the MRP Shares have one vote per share and will vote together with the holders of commonstock as a single class except on matters affecting only the holders of MRP Shares or the holders of commonstock. The holders of the MRP Shares, voting separately as a single class, have the right to elect at least twodirectors of the Company.
At November 30, 2016, the Company was in compliance with the asset coverage and basic maintenancerequirements of its MRP Shares.
13. Common Stock
At November 30, 2016, the Company had 188,000,000 shares of common stock authorized and 113,687,509shares outstanding. On December 17, 2015, KAFA agreed to purchase $10,035 of newly issued shares funded inpart with the after-tax management fees received during the fourth quarter of fiscal 2015. The new shares werepurchased at the net asset value as of the close of business on December 18, 2015 ($15.09 per share) whichrepresents a 9.2% premium to the closing market price. The 665,037 shares issued in connection with thispurchase were distributed amongst the principals of KAFA, including KACALP, the managing member ofKAFA. As of November 30, 2016, KACALP owned 285,929 shares of the Company. Transactions in commonshares for the fiscal year ended November 30, 2016 were as follows:
Shares outstanding at November 30, 2015 . . . . . . . . . . . . . . . . . . . . . . . . . . . . . . . . . . . . . . . . . . . . . 111,525,012Shares issued in connection with purchase by investment advisor . . . . . . . . . . . . . . . . . . . . . . . . . . . 665,037Shares issued through reinvestment of distributions . . . . . . . . . . . . . . . . . . . . . . . . . . . . . . . . . . . . . . 1,497,460
Shares outstanding at November 30, 2016 . . . . . . . . . . . . . . . . . . . . . . . . . . . . . . . . . . . . . . . . . . . . . 113,687,509
43

KAYNE ANDERSON MLP INVESTMENT COMPANYNOTES TO FINANCIAL STATEMENTS
(amounts in 000’s, except number of option contracts, share and per share amounts)
14. Subsequent Events
On December 15, 2016, the Company declared its quarterly distribution of $0.55 per common share for thefourth quarter. The total distribution of $62,528 was paid January 13, 2017. Of this total, pursuant to theCompany’s dividend reinvestment plan, $6,035 was reinvested into the Company through the issuance of324,488 shares of common stock.
The Company has performed an evaluation of subsequent events through the date the financial statementswere issued and has determined that no additional items require recognition or disclosure.
44
KAYNE ANDERSON MLP INVESTMENT COMPANYREPORT OF INDEPENDENT REGISTERED PUBLIC ACCOUNTING FIRM
To the Board of Directors and Stockholders ofKayne Anderson MLP Investment Company
In our opinion, the accompanying statement of assets and liabilities, including the schedule of investments, andthe related statements of operations, of changes in net assets applicable to common stockholders, and of cashflows and the financial highlights present fairly, in all material respects, the financial position of the KayneAnderson MLP Investment Company (the “Company”) at November 30, 2016, the results of its operations andits cash flows for the year then ended, the changes in its net assets applicable to common stockholders for each ofthe two years in the period then ended and the financial highlights for each of the ten years in the period thenended, in conformity with accounting principles generally accepted in the United States of America. Thesefinancial statements and financial highlights (hereafter referred to as “financial statements”) are the responsibilityof the Company’s management. Our responsibility is to express an opinion on these financial statements basedon our audits. We conducted our audits of these financial statements in accordance with the standards of thePublic Company Accounting Oversight Board (United States). Those standards require that we plan and performthe audit to obtain reasonable assurance about whether the financial statements are free of material misstatement.An audit includes examining, on a test basis, evidence supporting the amounts and disclosures in the financialstatements, assessing the accounting principles used and significant estimates made by management, andevaluating the overall financial statement presentation. We believe that our audits, which included confirmationof securities at November 30, 2016, by correspondence with the custodian and brokers, provide a reasonablebasis for our opinion.
PricewaterhouseCoopers LLP
Los Angeles, CaliforniaJanuary 27, 2017
45

KAYNE ANDERSON MLP INVESTMENT COMPANYPRIVACY POLICY NOTICE
(UNAUDITED)
Rev. 01/2011
FACTS WHAT DOES KAYNE ANDERSON MLP INVESTMENT COMPANY(“KYN”) DO WITH YOUR PERSONAL INFORMATION?
Why? Financial companies choose how they share your personal information. Federal lawgives consumers the right to limit some but not all sharing. Federal law also requiresus to tell you how we collect, share, and protect your personal information. Pleaseread this notice carefully to understand what we do.
What? The types of personal information we collect and share depend on the product orservice you have with us. This information can include:
� Social Security number and account balances
� Payment history and transaction history
� Account transactions and wire transfer instructions
When you are no longer our customer, we continue to share your information asdescribed in this notice.
How? All financial companies need to share customers’ personal information to run theireveryday business. In the section below, we list the reasons financial companies canshare their customers’ personal information; the reasons KYN chooses to share; andwhether you can limit this sharing.
Reasons we can share your personal information Does KYN share?Can you limitthis sharing?
For our everyday business purposes —such as to process your transactions, maintain your account(s),respond to court orders and legal investigations, or report to creditbureaus
Yes No
For our marketing purposes —to offer our products and services to you
No No
For joint marketing with other financial companies No We don’t share
For our affiliates’ everyday business purposes —information about your transactions and experiences
No We don’t share
For our affiliates’ everyday business purposes —information about your creditworthiness
No We don’t share
For nonaffiliates to market to you No We don’t share
Questions? Call 877-657-3863 or go to http://www.kaynefunds.com
46
KAYNE ANDERSON MLP INVESTMENT COMPANYPRIVACY POLICY NOTICE
(UNAUDITED)
Who we are
Who is providing this notice? KYN
What we do
How does KYNprotect my personal information?
To protect your personal information from unauthorized accessand use, we use security measures that comply with federal law.These measures include computer safeguards and secured filesand buildings.
Access to your personal information is on a need-to-know basis.KYN has adopted internal policies to protect your non-publicpersonal information.
How does KYNcollect my personal information?
We collect your personal information, for example, when you
� Provide account information
� Buy securities from us or make a wire transfer
� Give us your contact information
We also collect your personal information from other companies.
Why can’t I limit all sharing? Federal law gives you the right to limit only
� sharing for affiliates’ everyday business purposes —information about your creditworthiness
� affiliates from using your information to market to you
� sharing for nonaffiliates to market to you
State laws and individual companies may give you additionalrights to limit sharing.
Definitions
Affiliates Companies related by common ownership or control. They canbe financial and nonfinancial companies.
� KYN does not share with our affiliates.
Nonaffiliates Companies not related by common ownership or control. Theycan be financial and nonfinancial companies.
� KYN does not share with nonaffiliates so they can market toyou.
Joint marketing A formal agreement between nonaffiliated financial companiesthat together market financial products or services to you.
� KYN doesn’t jointly market.
Other important information
None.
47
KAYNE ANDERSON MLP INVESTMENT COMPANYDIVIDEND REINVESTMENT PLAN
(UNAUDITED)
Kayne Anderson MLP Investment Company, a Maryland corporation (the “Company”), has adopted thefollowing plan (the “Plan”) with respect to distributions declared by its Board of Directors (the “Board”) onshares of its Common Stock:
1. Unless a stockholder specifically elects to receive cash as set forth below, all distributions hereafterdeclared by the Board shall be payable in shares of the Common Stock of the Company, and no action shallbe required on such stockholder’s part to receive a distribution in stock.
2. Such distributions shall be payable on such date or dates as may be fixed from time to time by theBoard to stockholders of record at the close of business on the record date(s) established by the Board forthe distribution involved.
3. The Company may use newly-issued shares of its Common Stock or purchase shares in the openmarket in connection with the implementation of the plan. The number of shares to be issued to astockholder shall be based on share price equal to 95% of the closing price of the Company’s CommonStock one day prior to the dividend payment date.
4. The Board may, in its sole discretion, instruct the Company to purchase shares of its Common Stockin the open market in connection with the implementation of the Plan as follows: If the Company’sCommon Stock is trading below net asset value at the time of valuation, upon notice from the Company, thePlan Administrator (as defined below) will receive the dividend or distribution in cash and will purchaseCommon Stock in the open market, on the New York Stock Exchange or elsewhere, for the Participants’accounts, except that the Plan Administrator will endeavor to terminate purchases in the open market andcause the Company to issue the remaining shares if, following the commencement of the purchases, themarket value of the shares, including brokerage commissions, exceeds the net asset value at the time ofvaluation. These remaining shares will be issued by the Company at a price equal to the greater of (i) the netasset value at the time of valuation or (ii) 95% of the then current market price.
5. In a case where the Plan Administrator has terminated open market purchases and caused theissuance of remaining shares by the Company, the number of shares received by the participant in respect ofthe cash dividend or distribution will be based on the weighted average of prices paid for shares purchasedin the open market, including brokerage commissions, and the price at which the Company issues theremaining shares. To the extent that the Plan Administrator is unable to terminate purchases in the openmarket before the Plan Administrator has completed its purchases, or remaining shares cannot be issued bythe Company because the Company declared a dividend or distribution payable only in cash, and the marketprice exceeds the net asset value of the shares, the average share purchase price paid by the PlanAdministrator may exceed the net asset value of the shares, resulting in the acquisition of fewer shares thanif the dividend or distribution had been paid in shares issued by the Company.
6. A stockholder may, however, elect to receive his or its distributions in cash. To exercise this option,such stockholder shall notify American Stock Transfer & Trust Company, the plan administrator and theCompany’s transfer agent and registrar (collectively the “Plan Administrator”), in writing so that suchnotice is received by the Plan Administrator no later than the record date fixed by the Board for thedistribution involved.
7. The Plan Administrator will set up an account for shares acquired pursuant to the Plan for eachstockholder who has not so elected to receive dividends and distributions in cash (each, a “Participant”). ThePlan Administrator may hold each Participant’s shares, together with the shares of other Participants, innon-certificated form in the Plan Administrator’s name or that of its nominee. Upon request by a Participant,received no later than three (3) days prior to the payable date, the Plan Administrator will, instead ofcrediting shares to and/or carrying shares in a Participant’s account, issue, without charge to the Participant,a certificate registered in the Participant’s name for the number of whole shares payable to the Participant
48

KAYNE ANDERSON MLP INVESTMENT COMPANYDIVIDEND REINVESTMENT PLAN
(UNAUDITED)
and a check for any fractional share less a broker commission on the sale of such fractional shares. If arequest to terminate a Participant’s participation in the Plan is received less than three (3) days before thepayable date, dividends and distributions for that payable date will be reinvested. However, subsequentdividends and distributions will be paid to the Participant in cash.
8. The Plan Administrator will confirm to each Participant each acquisition made pursuant to the Planas soon as practicable but not later than ten (10) business days after the date thereof. Although eachParticipant may from time to time have an undivided fractional interest (computed to three decimal places)in a share of Common Stock of the Company, no certificates for a fractional share will be issued. However,dividends and distributions on fractional shares will be credited to each Participant’s account. In the event oftermination of a Participant’s account under the Plan, the Plan Administrator will adjust for any suchundivided fractional interest in cash at the market value of the Company’s shares at the time of termination.
9. The Plan Administrator will forward to each Participant any Company related proxy solicitationmaterials and each Company report or other communication to stockholders, and will vote any shares heldby it under the Plan in accordance with the instructions set forth on proxies returned by Participants to theCompany.
10. In the event that the Company makes available to its stockholders rights to purchase additionalshares or other securities, the shares held by the Plan Administrator for each Participant under the Plan willbe added to any other shares held by the Participant in certificated form in calculating the number of rightsto be issued to the Participant.
11. The Plan Administrator’s service fee, if any, and expenses for administering the Plan will be paidfor by the Company.
12. Each Participant may terminate his or its account under the Plan by so notifying the PlanAdministrator via the Plan Administrator’s website at www.amstock.com, by filling out the transactionrequest form located at the bottom of the Participant’s Statement and sending it to American Stock Transferand Trust Company, P.O. Box 922, Wall Street Station, New York, NY 10269-0560 or by calling the PlanAdministrator at (888) 888-0317. Such termination will be effective immediately. The Plan may beterminated by the Company upon notice in writing mailed to each Participant at least 30 days prior to anyrecord date for the payment of any dividend or distribution by the Company. Upon any termination, the PlanAdministrator will cause a certificate or certificates to be issued for the full shares held for the Participantunder the Plan and a cash adjustment for any fractional share to be delivered to the Participant withoutcharge to the Participant. If a Participant elects by his or its written notice to the Plan Administrator inadvance of termination to have the Plan Administrator sell part or all of his or its shares and remit theproceeds to the Participant, the Plan Administrator is authorized to deduct a $15.00 transaction fee plus a$0.10 per share brokerage commission from the proceeds.
13. These terms and conditions may be amended or supplemented by the Company at any time but,except when necessary or appropriate to comply with applicable law or the rules or policies of the Securitiesand Exchange Commission or any other regulatory authority, only by mailing to each Participantappropriate written notice at least 30 days prior to the effective date thereof. The amendment or supplementshall be deemed to be accepted by each Participant unless, prior to the effective date thereof, the PlanAdministrator receives written notice of the termination of his or its account under the Plan. Any suchamendment may include an appointment by the Plan Administrator in its place and stead of a successoragent under these terms and conditions, with full power and authority to perform all or any of the acts to beperformed by the Plan Administrator under these terms and conditions. Upon any such appointment of anyagent for the purpose of receiving dividends and distributions, the Company will be authorized to pay tosuch successor agent, for each Participant’s account, all dividends and distributions payable on shares of the
49

KAYNE ANDERSON MLP INVESTMENT COMPANYDIVIDEND REINVESTMENT PLAN
(UNAUDITED)
Company held in the Participant’s name or under the Plan for retention or application by such successoragent as provided in these terms and conditions.
14. The Plan Administrator will at all times act in good faith and use its best efforts within reasonablelimits to ensure its full and timely performance of all services to be performed by it under this Plan and tocomply with applicable law, but assumes no responsibility and shall not be liable for loss or damage due toerrors unless such error is caused by the Plan Administrator’s negligence, bad faith, or willful misconduct orthat of its employees or agents.
15. These terms and conditions shall be governed by the laws of the State of Maryland.
Adopted: September 27, 2004Amended: December 13, 2005Amended: March 12, 2009
50

KAYNE ANDERSON MLP INVESTMENT COMPANYINFORMATION CONCERNING DIRECTORS AND CORPORATE OFFICERS
(UNAUDITED)
Independent Directors(1)
Name(2),(Year Born)
Position(s)Held with Company,
Term of Office/Time of Service
Principal OccupationsDuring Past Five Years
Other Directorships Held byDirector/Officer During
Past Five Years
Anne K. Costin(born 1950)
Director. 3-year term(until the 2019 AnnualMeeting of Stockholders)/served since inception
Professor at the Amsterdam Institute of Financefrom 2007 to 2013. Adjunct Professor in theFinance and Economics Department of ColumbiaUniversity Graduate School of Business inNew York from 2004 through 2007. As of March1, 2005, Ms. Costin retired after a 28-year careerat Citigroup. During the seven years prior to herretirement, Ms. Costin was Managing Directorand Global Deputy Head of the Project &Structured Trade Finance product group withinCitigroup’s Investment Banking Division.
• Kayne Anderson Energy TotalReturn Fund, Inc. (“KYE”)
Steven C. Good(born 1942)
Director. 3-year term(until the 2018 AnnualMeeting of Stockholders)/served since inception
Independent consultant since February 2010,when he retired from CohnReznick LLP, wherehe had been an active partner since 1976.CohnReznick LLP offers accounting, tax andbusiness advisory services to middle marketprivate and publicly-traded companies, theirowners and their management. Founded Block,Good and Gagerman in 1976, which laterevolved in stages into CohnReznick LLP.
Current:
• KYE• OSI Systems, Inc.
(specialized electronic products)• Rexford Industrial Realty, Inc. (real
estate investment trust)Prior:• California Pizza Kitchen, Inc.
(restaurant chain)• Arden Realty, Inc.
(real estate investment trust)
Gerald I. Isenberg(born 1940)
Director. 3-year term(until the 2017 AnnualMeeting of Stockholders)/served since 2005
Professor Emeritus at the University of SouthernCalifornia School of Cinema-Television since2007. Chief Financial Officer of Teeccino CaffeInc., a privately owned beverage manufacturerand distributor.
Current:
• KYE• Teeccino Caffe Inc.
(beverage manufacturer anddistributor)
• Caucus for Television Producers,Writers & Directors Foundation(not-for-profit organization)
Prior:• Kayne Anderson Rudnick Mutual
Funds(3) from 1998 to 2002
William H. Shea, Jr.(born 1954)
Director. 3-year term(until the 2019 AnnualMeeting of Stockholders)/served since March 2008
Chief Executive Officer of Mainline EnergyPartners, LLC since July 2016. Chief ExecutiveOfficer and President of Niska Gas StoragePartners LLC from May 2014 to July 2016. ChiefExecutive Officer of the general partner of PVRPartners, L.P. (PVR) from March 2010 toMarch 2014. Chief Executive Officer andPresident of the general partner of Penn VirginiaGP Holdings, L.P. (PVG), from March 2010 toMarch 2011. Private investor from June 2007 toMarch 2010. From September 2000 to June2007, President, Chief Executive Officer andDirector (Chairman from May 2004 to June2007) of Buckeye Partners L.P. (BPL). FromMay 2004 to June 2007, President, ChiefExecutive Officer and Chairman of Buckeye GPHoldings L.P. (BGH) and its predecessors.
Current:
• KYE• Mainline Energy Partners, LLC
(midstream energy)• USA Compression Partners, LP
(natural gas compression MLP)Prior:• BGH
(general partner of BPL)• BPL
(midstream MLP)• Gibson Energy ULC
(midstream energy)• Niska Gas Storage Partners LLC
(natural gas storage)• PVG
(owned general partner of PVR)• PVR
(midstream MLP)• Penn Virginia Corporation
(oil and gas exploration andproduction company)
51
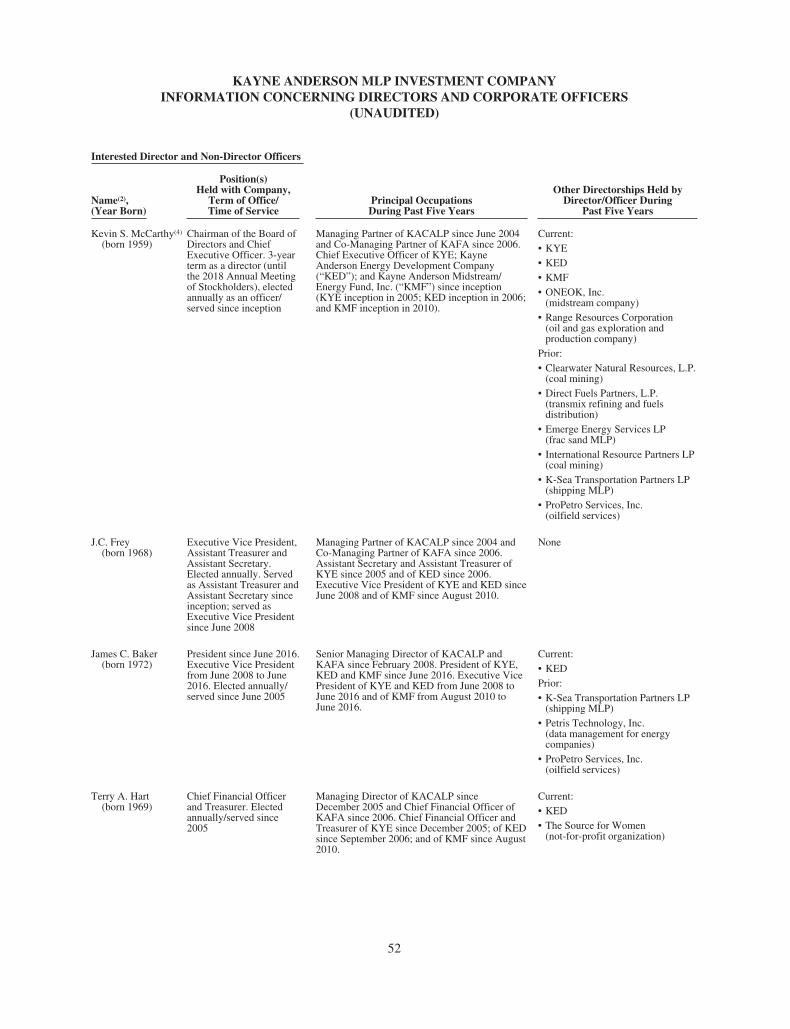
KAYNE ANDERSON MLP INVESTMENT COMPANYINFORMATION CONCERNING DIRECTORS AND CORPORATE OFFICERS
(UNAUDITED)
Interested Director and Non-Director Officers
Name(2),(Year Born)
Position(s)Held with Company,
Term of Office/Time of Service
Principal OccupationsDuring Past Five Years
Other Directorships Held byDirector/Officer During
Past Five Years
Kevin S. McCarthy(4)
(born 1959)Chairman of the Board ofDirectors and ChiefExecutive Officer. 3-yearterm as a director (untilthe 2018 Annual Meetingof Stockholders), electedannually as an officer/served since inception
Managing Partner of KACALP since June 2004and Co-Managing Partner of KAFA since 2006.Chief Executive Officer of KYE; KayneAnderson Energy Development Company(“KED”); and Kayne Anderson Midstream/Energy Fund, Inc. (“KMF”) since inception(KYE inception in 2005; KED inception in 2006;and KMF inception in 2010).
Current:• KYE• KED• KMF• ONEOK, Inc.
(midstream company)• Range Resources Corporation
(oil and gas exploration andproduction company)
Prior:• Clearwater Natural Resources, L.P.
(coal mining)• Direct Fuels Partners, L.P.
(transmix refining and fuelsdistribution)
• Emerge Energy Services LP(frac sand MLP)
• International Resource Partners LP(coal mining)
• K-Sea Transportation Partners LP(shipping MLP)
• ProPetro Services, Inc.(oilfield services)
J.C. Frey(born 1968)
Executive Vice President,Assistant Treasurer andAssistant Secretary.Elected annually. Servedas Assistant Treasurer andAssistant Secretary sinceinception; served asExecutive Vice Presidentsince June 2008
Managing Partner of KACALP since 2004 andCo-Managing Partner of KAFA since 2006.Assistant Secretary and Assistant Treasurer ofKYE since 2005 and of KED since 2006.Executive Vice President of KYE and KED sinceJune 2008 and of KMF since August 2010.
None
James C. Baker(born 1972)
President since June 2016.Executive Vice Presidentfrom June 2008 to June2016. Elected annually/served since June 2005
Senior Managing Director of KACALP andKAFA since February 2008. President of KYE,KED and KMF since June 2016. Executive VicePresident of KYE and KED from June 2008 toJune 2016 and of KMF from August 2010 toJune 2016.
Current:• KEDPrior:• K-Sea Transportation Partners LP
(shipping MLP)• Petris Technology, Inc.
(data management for energycompanies)
• ProPetro Services, Inc.(oilfield services)
Terry A. Hart(born 1969)
Chief Financial Officerand Treasurer. Electedannually/served since2005
Managing Director of KACALP sinceDecember 2005 and Chief Financial Officer ofKAFA since 2006. Chief Financial Officer andTreasurer of KYE since December 2005; of KEDsince September 2006; and of KMF since August2010.
Current:• KED• The Source for Women
(not-for-profit organization)
52
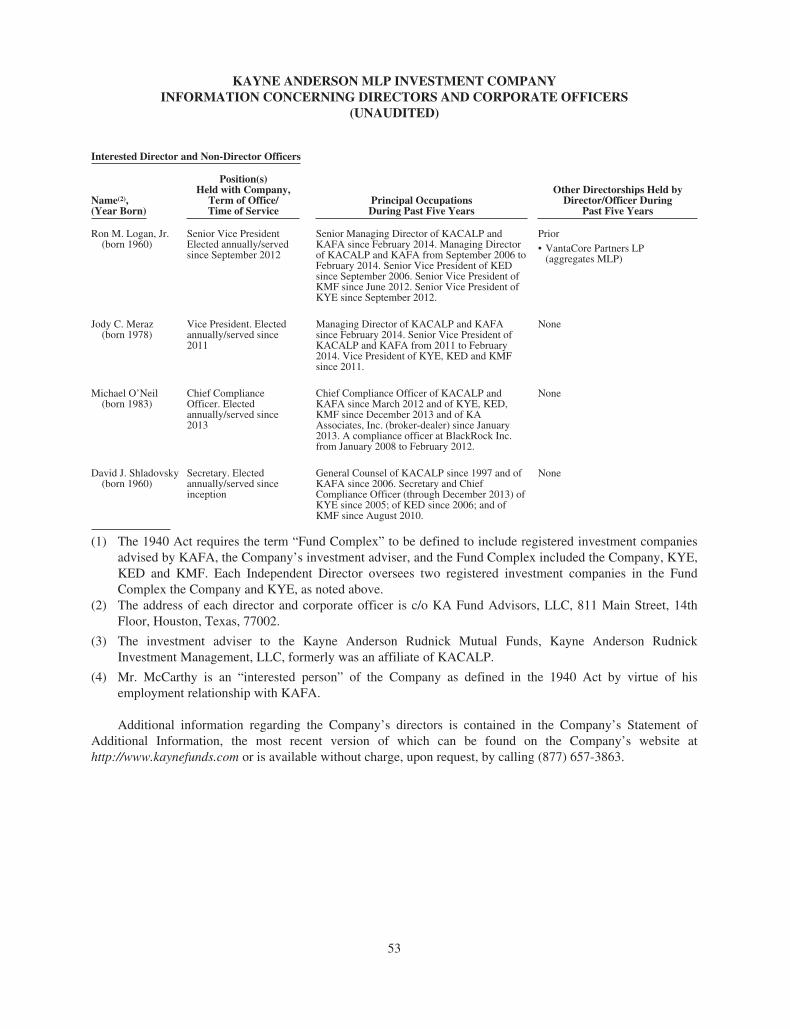
KAYNE ANDERSON MLP INVESTMENT COMPANYINFORMATION CONCERNING DIRECTORS AND CORPORATE OFFICERS
(UNAUDITED)
Interested Director and Non-Director Officers
Name(2),(Year Born)
Position(s)Held with Company,
Term of Office/Time of Service
Principal OccupationsDuring Past Five Years
Other Directorships Held byDirector/Officer During
Past Five Years
Ron M. Logan, Jr.(born 1960)
Senior Vice PresidentElected annually/servedsince September 2012
Senior Managing Director of KACALP andKAFA since February 2014. Managing Directorof KACALP and KAFA from September 2006 toFebruary 2014. Senior Vice President of KEDsince September 2006. Senior Vice President ofKMF since June 2012. Senior Vice President ofKYE since September 2012.
Prior• VantaCore Partners LP
(aggregates MLP)
Jody C. Meraz(born 1978)
Vice President. Electedannually/served since2011
Managing Director of KACALP and KAFAsince February 2014. Senior Vice President ofKACALP and KAFA from 2011 to February2014. Vice President of KYE, KED and KMFsince 2011.
None
Michael O’Neil(born 1983)
Chief ComplianceOfficer. Electedannually/served since2013
Chief Compliance Officer of KACALP andKAFA since March 2012 and of KYE, KED,KMF since December 2013 and of KAAssociates, Inc. (broker-dealer) since January2013. A compliance officer at BlackRock Inc.from January 2008 to February 2012.
None
David J. Shladovsky(born 1960)
Secretary. Electedannually/served sinceinception
General Counsel of KACALP since 1997 and ofKAFA since 2006. Secretary and ChiefCompliance Officer (through December 2013) ofKYE since 2005; of KED since 2006; and ofKMF since August 2010.
None
(1) The 1940 Act requires the term “Fund Complex” to be defined to include registered investment companiesadvised by KAFA, the Company’s investment adviser, and the Fund Complex included the Company, KYE,KED and KMF. Each Independent Director oversees two registered investment companies in the FundComplex the Company and KYE, as noted above.
(2) The address of each director and corporate officer is c/o KA Fund Advisors, LLC, 811 Main Street, 14thFloor, Houston, Texas, 77002.
(3) The investment adviser to the Kayne Anderson Rudnick Mutual Funds, Kayne Anderson RudnickInvestment Management, LLC, formerly was an affiliate of KACALP.
(4) Mr. McCarthy is an “interested person” of the Company as defined in the 1940 Act by virtue of hisemployment relationship with KAFA.
Additional information regarding the Company’s directors is contained in the Company’s Statement ofAdditional Information, the most recent version of which can be found on the Company’s website athttp://www.kaynefunds.com or is available without charge, upon request, by calling (877) 657-3863.
53
KAYNE ANDERSON MLP INVESTMENT COMPANYANNUAL CERTIFICATION
(UNAUDITED)
The Company’s Chief Executive Officer has filed an annual certification with the NYSE that, as of the dateof the certification, he was unaware of any violation by the Company of the NYSE’s corporate governance listingstandards.
PROXY VOTING AND PORTFOLIO HOLDINGS INFORMATION(UNAUDITED)
The policies and procedures that the Company uses to determine how to vote proxies relating to its portfoliosecurities are available:
• without charge, upon request, by calling (877) 657-3863/MLP-FUND;
• on the Company’s website, http://www.kaynefunds.com; and
• on the SEC’s website, http://www.sec.gov.
Information regarding how the Company voted proxies relating to portfolio securities during the most recent12-month period ended June 30 is available without charge, upon request, by calling (877) 657-3863/MLP-FUND,and on the SEC’s website at http://www.sec.gov (see Form N-PX).
The Company files a complete schedule of its portfolio holdings for the first and third quarters of each of itsfiscal years with the SEC on Form N-Q and Form N-30B-2. The Company’s Form N-Q and Form N-30B-2 areavailable on the SEC’s website at http://www.sec.gov and may be reviewed and copied at the SEC’s PublicReference Room in Washington, DC. Information on the operation of the SEC’s Public Reference Room may beobtained by calling 1-800-SEC-0330. The Company also makes its Form N-Q and Form N-30B-2 available on itswebsite at http://www.kaynefunds.com.
REPURCHASE DISCLOSURE(UNAUDITED)
Notice is hereby given in accordance with Section 23(c) of the 1940 Act, that the Company may from timeto time purchase shares of its common and preferred stock and its Notes in the open market or in privatelynegotiated transactions.
54
Directors and Corporate Officers
Kevin S. McCarthy Chairman of the Board of Directors andChief Executive Officer
Anne K. Costin Director
Steven C. Good Director
Gerald I. Isenberg Director
William H. Shea, Jr. Director
James C. Baker President
Terry A. Hart Chief Financial Officer and Treasurer
David J. Shladovsky Secretary
Michael J. O’Neil Chief Compliance Officer
J.C. Frey Executive Vice President,Assistant Secretary and Assistant Treasurer
Ron M. Logan, Jr. Senior Vice President
Jody C. Meraz Vice President
Investment AdviserKA Fund Advisors, LLC811 Main Street, 14th FloorHouston, TX 77002
AdministratorUltimus Fund Solutions, LLC225 Pictoria Drive, Suite 450Cincinnati, OH 45246
1800 Avenue of the Stars, Third FloorLos Angeles, CA 90067
Stock Transfer Agent and RegistrarAmerican Stock Transfer & Trust Company, LLC6201 15th AvenueBrooklyn, NY 11219(888) 888-0317
CustodianJPMorgan Chase Bank, N.A.14201 North Dallas Parkway, Second FloorDallas, TX 75254
Independent Registered Public Accounting FirmPricewaterhouseCoopers LLP601 S. Figueroa Street, Suite 900Los Angeles, CA 90017
Legal CounselPaul Hastings LLP55 Second Street, 24th FloorSan Francisco, CA 94105
Please visit us on the web at http://www.kaynefunds.com or call us toll-free at 1-877-657-3863.
This report, including the financial statements herein, is made available to stockholders of the Company for theirinformation. It is not a prospectus, circular or representation intended for use in the purchase or sale of shares ofthe Company or of any securities mentioned in this report.