Embed Size (px)
Citation preview
Av. da República nº. 79 1050 – 243 Lisboa
Telf: (351) 217998150
Fax: (351) 217998151
Web Site: www.gee.min-economia.pt
GEE Papers
Número 9
Dezembro de 2008
Structural Transformation and the role of Foreign
Direct Investment in Portugal: a descriptive
analysis for the period 1990-2005
Miguel Lebre de Freitas
Ricardo Paes Mamede

Structural Transformation and the role of Foreign Direct Investment in
Portugal: a descriptive analysis for the period 1990-20051
Miguel Lebre de Freitas
UA, GEE, NIPE
Ricardo Paes Mamede
ISCTE, GEE, Dinâmia
Classificação JEL codes: C14, F14
Keywords: International trade, Foreign Direct Investment, The Portuguese
Economy, Structural transformation.
Abstract
In this paper we use a recent measure of the “income level of a country’s exports” proposed by Hausmann et al. (2007) to characterize the structure of the Portuguese export basket, its recent evolution and the role of FDI in this process. We find that between 1990 and 2005 the improvement in the income content of the Portuguese export basket was achieved through a positive “structural transformation effect” that more than offset the negative effect of having a significant share of products exposed to an increasing competition from emerging economies. We find that the weight of exports with “high” and “very high” income content increased considerably in this period, with these two classes explaining more than half of the total export growth. Analysing the presence of FDI in the different export products, we find a higher than average share of foreign affiliated firms in products with “High” and “Very High” income content. These and other pieces of evidence suggest that FDI has played a relevant role both in the growth of Portuguese exports and in the increase of their income content.
1 Corresponding author. Av. República 79 – 1º, 1050-243 Lisboa, Portugal. Tel: 351-21-7998150.
Fax: 351-234-370215. E-mail: [email protected]. A previous version of this paper was presented in the
second Workshop on Portugal and the Challenge of Globalization, held at the Ministry of Economy and
Innovation, Lisbon, November 3, 2008. The authors acknowledge Paulo Inácio, Walter Marques and Luis
Florindo for helpful assistance with the data and João Amador and David Haugh for helpful comments.
GEE Structural Transformation and the role of Foreign Direct Investment in Portugal: a descriptive analysis for the period 1990-
2005 – Miguel Lebre de Freitas e Ricardo Paes Mamede
Index
1. Introduction 2
2. Income content and comparative advantages 6
3. PRODY effect versus structural adjustment effect 10
4. Income content, export shares and export growth in Portugal 12
5. FDI, export growth and structural transformation in Portugal 14
6. Conclusions 21
7. References 24
8. Appendix 29

Structural Transformation and the role of Foreign Direct Investment in
Portugal: a descriptive analysis for the period 1990-2005
Miguel Lebre de Freitas* (UA, GEE, NIPE)
Ricardo Paes Mamede (ISCTE, GEE, Dinâmia)
12/01/2009
Abstract: in this paper we use a recent measure of the “income level of a country’s exports” proposed by Hausmann et al. (2007) to characterize the structure of the Portuguese export basket, its recent evolution and the role of FDI in this process. We find that between 1990 and 2005 the improvement in the income content of the Portuguese export basket was achieved through a positive “structural transformation effect” that more than offset the negative effect of having a significant share of products exposed to an increasing competition from emerging economies. We find that the weight of exports with “high” and “very high” income content increased considerably in this period, with these two classes explaining more than half of the total export growth. Analysing the presence of FDI in the different export products, we find a higher than average share of foreign affiliated firms in products with “High” and “Very High” income content. These and other pieces of evidence suggest that FDI has played a relevant role both in the growth of Portuguese exports and in the increase of their income content.
Key-Words: International trade, Foreign Direct Investment, The Portuguese Economy,
Structural transformation.
JEL: C14, F14.
* Corresponding author. Av. República 79 – 1º, 1050-243 Lisboa, Portugal. Tel: 351-21-7998150. Fax: 351-234-370215. E-mail: [email protected]. A previous version of this paper was presented in the second Workshop on Portugal and the Challenge of Globalization, held at the Ministry of Economy and Innovation, Lisbon, November 3, 2008. The authors acknowledge Paulo Inácio, Walter Marques and Luis Florindo for helpful assistance with the data and João Amador and David Haugh for helpful comments.

2
1. Introduction
In the current debate on the Portuguese economy, there is a view that the
country’s specialization pattern, traditionally dominated by low-skilled labour intensive
products, is a major obstacle to convergence. According to this view, with the emergence
of new trading partners in the international arena, the future performance of the
Portuguese economy will depend critically on its ability to shift its specialization pattern
towards goods with higher productivity content. In this paper, we investigate the extent to
which the Portuguese economy has indeed become increasingly specialized in more
sophisticated goods and whether such shift is more evident in sectors with a high
presence of FDI.
The view that a country’s economic performance is to a large extent linked to
international trade has a long tradition in economic thinking, backing from Adam Smith
and David Ricardo. At the theoretical level, many authors have emphasized the type and
the characteristics of the sectors wherein a country specializes (Prebisch 1950, Singer,
1950, Kaldor, 1966, Thirlwall, 1979, Grossman and Helpman, 1991)2. Empirically,
however, this idea has been difficult to test, because a measure of a country specialization
pattern that reflects the quality of the goods being exported is not easy to define. In a
recent contribution, Hausmann et al. (2007) propose a quantitative index that ranks traded
goods in terms of their “implied income”. This index (PRODY) is estimated as a
weighted average of the per capita GDPs of the countries exporting a product, where the
weights reflect the revealed comparative advantage of each country in that product. The
authors then compute a measure of sophistication of a country export basket (EXPY) by
calculating the export-weighted average PRODY for that country. The authors report a
strong correlation between EXPY and per capita GDPs and also find that EXPY is a
2 A different question is whether the identity of the trade partners matters. The rationale is that a country importing goods primarily from technological leaders receives more technology than a country importing primarily from follower countries (Eaton an Kortum, 1996, 1999). The empirical evidence of this hypothesis remains, however, mixed (see Keller, 2004, for a survey).

3
strong and robust predictor of subsequent economic growth, controlling for standard
covariates3.
In this paper, we compute a new vector of PRODY indexes, using 1995 and 2005
COMTRADE data for 1235 products and 81 countries. We then use this index to
characterise the Portuguese export basket and to assess how well it has moved towards
goods with higher income content. We document that in the period from 1995 to 2005
there has been indeed an upscale move of the Portuguese specialization pattern. Though
using a different methodology, our evidence accords with the recent findings of Caldeira
Cabral (2008) and Amador et al. (2007) who analysed the changing structure of
Portuguese exports following the OECD classification of R&D intensities4.
We then investigate the extent to which foreign direct investment (FDI) has
played a key role in this change. Portuguese governments have made significant efforts to
support FDI inflows, either through financial incentives (EU funds and tax benefits) or by
providing complementary infrastructure. Despite the high year-on-year volatility, FDI net
flows to Portugal have a clear upward trend, from 0,43% of GDP in the 1970s to 1,03%
in the 1980s, 1,085% in the 1990s and 3,65% in the period 2000-2006 (UNCTAD, 2007).
An obvious question is, thus, whether such an effort has helped or impaired the process of
structural transformation.
The relationship between FDI and economic performance is a topic of controversy
in the economic literature. Policymakers and academics often argue that FDI can be a
source of benefits to host countries, through knowledge spillovers or by creating linkages
3 Other relevant contributions include Dalum et al. (1999) and Feenstra and Rose (2000). Dalum et al. (1999) focused on 11 manufacturing sectors in the OECD area for the period 1965-1988, and found that the characteristics of the specialization pattern are important to explain growth differentials. However, the impact seems to be gradually wearing off during the 1980s and their results are sensitive to alternative classifications of sectors into different technological categories that the authors consider. Feenstra and Rose (2000) develop a procedure to rank-order countries and commodities according to the “product-cycle” hypothesis, using disaggregated data on US imports. They find a strong relation between what they dubbed “advanced export structure” and high productivity levels and fast growth rates. 4 Monthly updates using this methodology are available at the GEE homepage, in “Balança de Produtos Industriais Transformados por Grau de Intensidade Tecnológica” (http://www.gee.min-economia.pt/).

4
from multinationals to domestic firms5. Accordingly, governments all over the world
spend large amounts of resources to attract subsidiaries of multinational firms to their
jurisdiction. Empirically, however, the literature has not being able to confirm the
existence of positive externalities from FDI to host countries6. In the specific case of
Portugal, there is anecdotic evidence of training spillovers and quality improvement
effects on domestic suppliers (OECD, 2008, pp. 86-87). However, Flores et al. (2007)
found no robust evidence of intra-sectoral spillover effects in the 1990s, as measured by
the effect of FDI on domestic firm’ labour productivity. Guimarães et al. (2000),
analysing the role of agglomeration effects in the location decisions of establishments
participated by foreign capital between 1982 and 1992, found a positive influence of
industry-specific localization economies but no significant influence of foreign-specific
agglomeration effects. This is suggestive of spillovers, but not necessarily related to the
affiliation of capital.
This paper abstracts from spillovers and other indirect effects of FDI. Simply, we
examine whether there is a tendency for foreign affiliated firms to operate in fast
growing, non-traditional and income content export sectors, thus having a significant
direct contribution to the process of structural transformation in Portugal.
5 Fosfuri et al. (2001) discuss the spillover effects related to the flow of skilled workers trained by multinationals to other firms in the host country. Rodriguez-Clare (1996) and Markusen and Venables (1999) examine the linkage effects between multinationals and domestic firms: the entry of multinationals may raise the demand for intermediate products which would not develop otherwise, triggering the supply of downstream industries and eventually creating the conditions for related upstream industries to develop (a similar reasoning in Trindade, 2005). Other theories pointing to inertia in the specialization patterns (which FDI may help disrupt) include learning-by-doing (Jovanovic and Nyarko, 1996, Hausmann and Klinger, 1997, and Hausmann and Rodrik, 2006) and information externalities (Hausmann and Rodrik, 2003). 6 Many authors remain sceptical about a positive relationship between FDI and economic performance of host countries (e.g., Rodrik, 2007, pp.119-120). Empirically, the evidence has been ambiguous (see Keller, 2004 for a survey). Still, some positive results were found. At the aggregate level, a commonly cited article is Borenztein et al. (1998), who found an important role for FDI in a cross-country growth regression, but only when the host economy has a minimum threshold stock of human capital. This suggests that FDI contributes to economic growth only when a sufficient absorptive capability of the advanced technologies is available in the host economy. Recent evidence with micro-data is also suggestive of important spillovers associated to FDI (Kugler, 2006). In general, empirical assessments face a basic problem of endogeneity: because multinationals are attracted to high-productivity industries and high-performance countries, in the absence of adequate instrumental variables, the direction of causality is difficult to assert (Aitken and Harrison, 1999).

5
The role of FDI in Portuguese exports was examined by Cabral (1996) and
Magalhães and Africano (2007). Cabral (1996), using a panel of 1174 firms between
1986 and 1992 report that foreign firms tend to export more than domestic firms,
everything else constant. Magalhães and Africano (2007), using data on bilateral trade
and FDI flows for the period from 1995 to 2000, found a positive correlation between the
presence of foreign affiliated capital in the Portuguese economy and the volume of
exports to the affiliation country. Gonçalves and Guimarães (1997) do not examine
export data, but report a significant difference between the production patterns of
domestic and foreign firms operating in Portugal, thus concluding that FDI helps increase
the diversification level of the economy7. Our paper adds to the previous analysis in that
it examines the relationship between FDI and the structure of Portuguese exports,
crossing information on export values at the product (SITC-4 rev 2) level and on the
proportion of capital with foreign affiliation at the firm level. We then assess whether
FDI has contributed to improve the specialization pattern of the Portuguese economy,
using the PRODY index as a measure of income content.
The paper proceeds as follows. In Section 2, we analyse the relationship between
RCA and PRODY at the product level from 1995 to 2005, in Portugal and in some other
countries. In Section 3 we decompose the changes in the average income content of each
country’s exports into a “PRODY effect” and a “structural transformation effect”. In
Section 4 we investigate how the composition of the Portuguese export basket has
evolved in terms of classes of PRODY. In Section 5 we evaluate the extent to which the
sectors that most contributed to the Portuguese export growth have a large presence of
FDI and whether the presence of FDI is more significant in products with higher income
content. Section 6 concludes.
7 Other relevant studies addressing FDI in Portugal include Barbosa and Louri (2005), who investigate whether the profitability of foreign firms operating in Portugal differs from that of domestic firms; Barbosa et. al (2004), who examined the determinants of FDI; Mata and Portugal (2004), who compare the patterns of entry, survival and growth of domestic and foreign owned firms operating in Portugal; and Barbosa and Louri (2002), who analyse the determinants of ownership decisions.
6
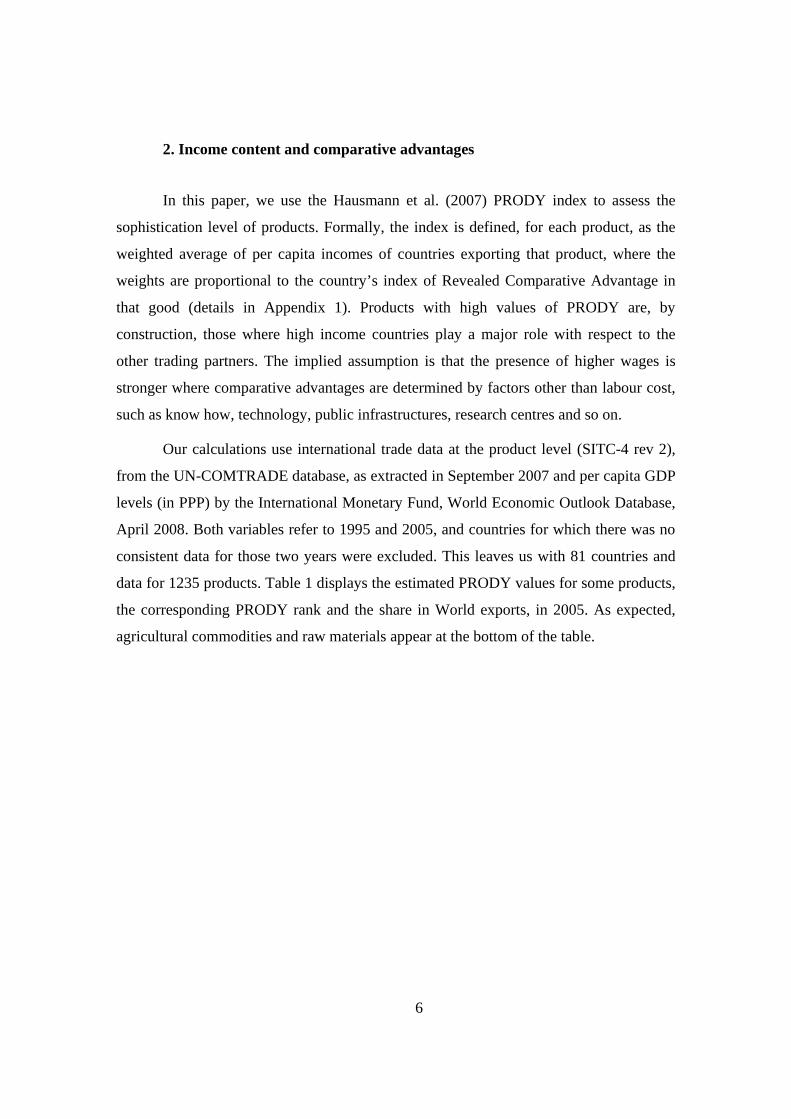
2. Income content and comparative advantages
In this paper, we use the Hausmann et al. (2007) PRODY index to assess the
sophistication level of products. Formally, the index is defined, for each product, as the
weighted average of per capita incomes of countries exporting that product, where the
weights are proportional to the country’s index of Revealed Comparative Advantage in
that good (details in Appendix 1). Products with high values of PRODY are, by
construction, those where high income countries play a major role with respect to the
other trading partners. The implied assumption is that the presence of higher wages is
stronger where comparative advantages are determined by factors other than labour cost,
such as know how, technology, public infrastructures, research centres and so on.
Our calculations use international trade data at the product level (SITC-4 rev 2),
from the UN-COMTRADE database, as extracted in September 2007 and per capita GDP
levels (in PPP) by the International Monetary Fund, World Economic Outlook Database,
April 2008. Both variables refer to 1995 and 2005, and countries for which there was no
consistent data for those two years were excluded. This leaves us with 81 countries and
data for 1235 products. Table 1 displays the estimated PRODY values for some products,
the corresponding PRODY rank and the share in World exports, in 2005. As expected,
agricultural commodities and raw materials appear at the bottom of the table.

7
Table 1: PRODY values for a sample of products
Code Commodity PRODY 05 RankShare of
World exports (per cent)
2933 Heterocyclic compounds with nitrogen hetero-atom(s) only. 33.408 4 0,478411 Turbo-jets, turbo-propellers and other gas turbines. 27.010 82 0,713004 Medicaments (excluding goods of heading 30.02, 30.05 or 30.06) 26.024 108 2,138525 Transmission apparatus for radio-telephony, radio-broadcasting 24.156 196 1,898542 Electronic integrated circuits and microassemblies. 24.047 201 2,819018 Instruments and appliances used in medical, surgical, dental or veterinary ... 23.486 229 0,618473 Parts and accessories for use with machines of heading 84.69 to 84.72 23.244 240 1,898703 Motor cars and other motor vehicles principally designed for the transport ... 22.951 255 5,158471 Automatic data processing machines and units thereof 22.355 292 2,788802 Other aircraft (for example, helicopters, aeroplanes); spacecraft 21.886 330 0,888414 Air or vacuum pumps, air or other gas compressors and fans 21.457 344 0,438708 Parts and accessories of the motor vehicles of headings 87.01 to 87.05. 20.802 382 2,348536 Electrical apparatus for switching or protecting electrical circuits, or fo ... 20.455 401 0,598541 Diodes, transistors and similar semiconductor devices 18.685 512 0,478901 Cruise ships, excursion boats, ferry-boats, cargo ships, barges and similar ... 17.586 584 0,482701 Coal; briquettes, ovoids and similar solid fuels manufactured from coal. 17.237 610 0,448704 Motor vehicles for the transport of goods. 16.900 624 0,878528 Reception apparatus for television 16.114 664 0,587102 Diamonds, whether or not worked, but not mounted or set. 15.347 702 0,852709 Petroleum oils, crude 11.549 914 5,056204 Women's or girls' suits, ensembles, jackets, blazers, dresses, skirts 7.977 1069 0,462401 Unmanufactured tobacco; tobacco refuse. 2.407 1235 0,07801 Coconuts, Brazil nuts and cashew nuts, fresh or dried 2.230 1236 0,021801 Cocoa beans, whole or broken, raw or roasted. 2.097 1238 0,035203 Cotton, carded or combed. 1.414 1242 0,002612 Uranium or thorium ores and concentrates. 1.211 1243 0,015304 Sisal and other textile fibres of the genus Agave, raw or processed but not ... 1.146 1244 0,00905 Vanilla 1.075 1245 0,00 Sources: UN, COMTRADE database; IMF, World Economic Outlook Database
For illustrative purposes, Figure 1 assesses the linear relationship between our
estimated 2005 PRODYs and the Balassa indexes of revealed comparative advantage
(RCA) for 12 countries (China, France, Germany, Greece, Hungary, India, Italy, Korea,
Portugal, Spain, Turkey and USA)8. Despite the high dispersion of the data, plotting a
linear regression line helps in assessing the sign of the correlation between the two
indexes. If significant, a negative correlation indicates a general tendency for a country to
be specialized in goods with low income content. A positive correlation, in turn, indicates
a general tendency for a country to be increasingly specialized in goods with higher
income content.
8 The Balassa RCA index is in Logs. Null coefficients of RCA became missing values..

8
Figure 1: PRODY and Revealed Comparative Advantage in 2005 (China, France, Germany, Greece, Hungary, India, Italy, Korea, Portugal, Spain, Turkey, USA)
0
5.000
10.000
15.000
20.000
25.000
30.000
35.000
-8 -6 -4 -2 0 2 4
RCA 2005 (logs)
PRO
DY
2005
India
Greece
ChinaPortugal
Hungary
Spain
Korea
Italy
France
USA
GermanyTurkey
According to the figure, by 2005 India was the country in this sub-sample with a
more negative correlation between comparative advantage and PRODY values, followed
by Turkey, Greece, and China. The Portuguese specialization pattern was more
favourable than in these countries, but less than those of Hungary and Spain. On the other
hand, Korea, Italy, France, USA and Germany exhibited positive correlations between
RCA and PRODY values, suggesting a tendency to be more specialized in “rich country
goods”.
Moving from a negative correlation towards a positive correlation involves the
country becoming increasingly specialized in products with higher income content. This
is what is meant by structural transformation.

9
Figure 2: EXPY and GDP per capita at PPP (2005, $US)
Portugal
Ireland
China
India
USA
0
5.000
10.000
15.000
20.000
25.000
30.000
35.000
40.000
45.000
0 5.000 10.000 15.000 20.000 25.000
Expy ($US)
GD
P pe
r cap
ita P
PP ($
US)
The data in Figure 1 is silent in respect to sector sizes (the RCA index actually
measures sizes, but relative to the world average). To account for a country total export
mass, Hausmann et al. (2007) proposed the EXPY index. This is the average PRODY in a
country export basket, where the weights are the share of each product in a country
exports (details in Appendix 1). Figure 2 mimics Figure 3 in Hausmann et al. (2007),
relating EXPY values with GDP per capita for the countries in our sample. The figure
confirms the positive relation between the two variables, with GDP per capita growing
exponentially with EXPY. This supports the idea that rich countries export products that
tend to be exported by rich countries, while poor countries export products that tend to be
exported by other poor countries. Hausmann et al. (2007) also found that EXPY is a
strong and robust predictor of subsequent economic growth, controlling for standard

10
covariates9. These findings suggest that the type of goods in which a country specializes
has important implications for subsequent economic performance. That being so,
structural transformation, e.g., the change in the specialization pattern towards products
with higher income content, should be part of the agenda for economic growth.
3. PRODY effect versus structural adjustment effect
PRODY indexes change over time, reflecting the changes in the world structure of
trade and the changes in per capita GDP levels. Hence, EXPY indexes in two different
points in time can either be computed at current PRODY or at base-year PRODY levels.
Changes in EXPY at current PRODYs will, therefore, reflect changes in the country’s
structure of exports and changes in the implied value of exports.
Figure 3 describes how the changes in EXPY at current PRODYs break down into
a “pure PRODY effect” (i.e., the change in EXPY that would have been observed if the
PRODY values of the different products had changed the way they did, while the export
structure remained the same) and other effects (this includes a “pure structural
transformation effect” – i.e., the value of EXPY which would be observed had the
PRODY values remained the same while the structure of exports evolve the way they did
– and a mixed effect). The technical details and the figures for 81 countries are in
Appendix 2.
9 In their central case, the estimation results imply that a 10 percent increase in EXPY boosts growth by half a percentage point (p. 15 and Table 8, in the original). Because these results are not significantly affected by the presence of other variables, such as physical capital, human capital and institutional quality, the authors concluded that EXPY exerts an independent force on economic growth, leading them to conclude that “countries become what they export”.

11
Figure 3: Decomposing the changes in EXPY at current PRODYs
between 1995 and 2005
Portugal
Chile
Zambia
China
MadagascarIreland
Poland
Structural and mixed effects (w.r.t. average)
(Pur
e) P
rody
effe
ct
(w.r.
t. av
erag
e)
DenmarkFranceGermanyItalyJapanNetherlandsSwedenUKUSA
Average change in EXPY
The horizontal and vertical axes in Figure 3 represent the sample average “pure
PRODY effect” and the sample average “pure structural and mixed effects” (respectively)
underlying the changes in EXPY values between 1995 and 2005. The dashed diagonal in
the figure represents the average growth in EXPY across countries (weighted by GDP per
capita in PPP in 2005). Dots to the right of this line represent countries whose EXPY
value has increased above the average; dots to the left of the diagonal correspond to
countries whose exports have experienced a decrease in income content in relative terms.
The figure reveals that the Portuguese EXPY level has increased slightly above
the average, while the reverse happen to most OECD countries (other exceptions include
Australia, Canada, Ireland and Poland). Portugal is located in the lower-right quarter of
the graph, meaning that the change in the income content of its exports is accounted for
by a positive structural transformation (plus mixed) effect, which was big enough to
offset a negative PRODY effect. A negative PRODY effect means that, on average, the
most important Portuguese exports in 1995 did not improve in terms of income content.
In other words, had the Portuguese export basket remained stuck, its average income
content would have grown less than the average. The reason is that a significant

12
component of the Portuguese exports basket corresponds to traditional segments, where
competition by emerging economies has been increasing. The positive structural
transformation effect more than offset this negative effect, allowing the EXPY level in
Portugal to grow above the average.
The Portuguese pattern contrasts with what was observed in other OECD
countries: most developed countries have registered negative PRODY and structural and
mixed effects10. In other words, not only their exports became on average less exclusive,
but also the change in the structure of exports has led to a less ‘rich country goods’ export
profile11. In contrast, Chile and Madagascar, for example, have improved significantly
their EXPY values, due to both positive structural adjustment and value effects.
4. Income content, export shares and export growth in Portugal
Having established the relative importance of the structural transformation effect
in the case of Portugal, we now focus on this component, abstracting from changes in
EXPY caused by changes in PRODY values. Hence, the analysis proceeds at constant
PRODYs12. In this section and in the following, we use trade data from the Portuguese
National Institute of Statistics (INE), which includes data on confidential positions, thus
10 This evidence contrasts with Amador et al. (2007), who report a high persistence of the Portuguese specialization pattern, as compared to Spain and Ireland. However, their analysis does not take into account income contents. Weighting the exports shares with PRODY indexes, our analysis suggests that the structural adjustment effect was more significant in Portugal than in the cases of Ireland and Spain (see Appendix 2). Lebre de Freitas and Salvado (2008) discuss, on a comparative basis, how valuable the current productive experience is in preparing the country for further upscale moves. 11 The analysis for Italy confirms Di Maio and Tamagni (2007). The authors found that the low performance of that country in the last two decades was mainly explained by the fact that Italy remained stuck in a number of products which PRODY values have declined, due to the entry of emerging economies in these markets. In the figure, Italy is on the lower-left corner, meaning lack of structural adjustment and specialization in products of declining value. 12 Restricting attention to 2005 PRODY values, we are no longer constrained with the need to have a consistent sample of countries for the years 1995 and 2005. Therefore, from this point forward the PRODY values are computed using a larger sample of countries (93 instead of 81), allowing the PRODY index to reflect more accurately the world structure of international trade.

13
being more accurate than the COMTRADE database.13 The corresponding estimates of
EXPY and export shares by classes of PRODY are displayed in Table 2. The table
reveals that the average sophistication level of the Portuguese export basket (EXPY) has
increased steadily over time, from 14.041 USD in 1990 to 16.603 USD in 2005. This is
suggestive of future growth.
To get a sense on how this change came about, export volumes at constant
PRODY values are split into 5 classes of PRODY. The 5 classes considered range from
the 20% products with higher PRODY values to the 20% products with lower PRODY
values (figures for 81 countries based on COMTRADE data are in Appendix 3).
Table 2 – The structure of Portuguese Exports by classes of PRODY
Share on Exports EXPY Share on
Exports EXPY Share on Exports EXPY Share on
Exports EXPY
Very High (top 20%) 6,2 1528 8,5 2118 9,4 2363 12,5 3097High 21,6 4457 25,8 5392 32,8 6982 31,8 6727Average 14,4 2390 14,2 2363 14,8 2460 16,3 2692Low 32,1 3743 31,1 3673 27,0 3202 25,6 3049Very low (20% lowest) 25,8 1923 20,4 1517 15,9 1195 13,9 1036
Total 100 14041 100 15063 100 16202 100 16603
PRODY Class1990 1995 2000 2005
Sources: own calculations, based on INE data.
13 A major drawback of COMTRADE is the presence of a sizeable category of miscellaneous products, “9999-Commodities not specified according to kind”, which accounted for 2,9% of the world trade in 2005. This category cannot be ignored while computing RCA indexes, but there is no point in computing its PRODY value. Because this category differs significantly over time and across countries, its presence complicates international and inter-temporal comparisons. In the case of Portugal, a major change in the statistical treatment of confidentiality has occurred in 2005, causing a large number of products previously classified elsewhere to be moved to the class 9999. As a result, the share of exports in this category jumped from nearly zero to 8.7%.
14
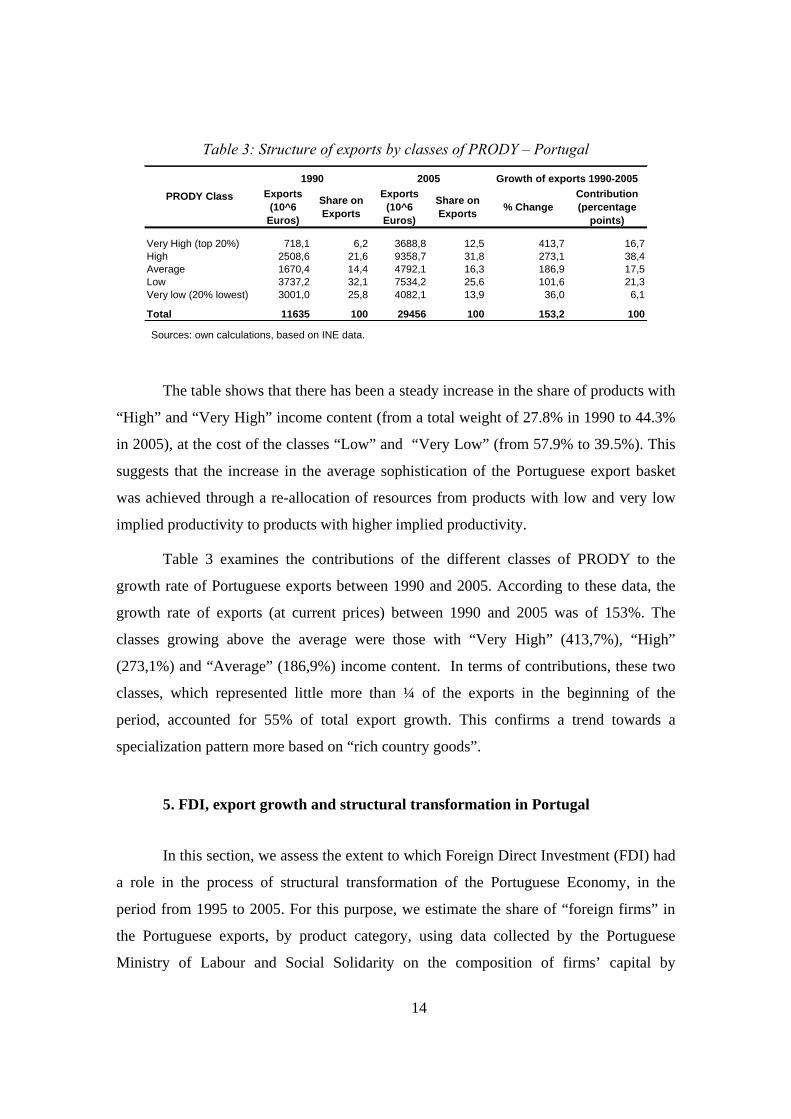
Table 3: Structure of exports by classes of PRODY – Portugal
Exports (10^6
Euros)
Share on Exports
Exports (10^6
Euros)
Share on Exports % Change
Contribution (percentage
points)
Very High (top 20%) 718,1 6,2 3688,8 12,5 413,7 16,7High 2508,6 21,6 9358,7 31,8 273,1 38,4Average 1670,4 14,4 4792,1 16,3 186,9 17,5Low 3737,2 32,1 7534,2 25,6 101,6 21,3Very low (20% lowest) 3001,0 25,8 4082,1 13,9 36,0 6,1
Total 11635 100 29456 100 153,2 100
2005 Growth of exports 1990-20051990PRODY Class
Sources: own calculations, based on INE data.
The table shows that there has been a steady increase in the share of products with
“High” and “Very High” income content (from a total weight of 27.8% in 1990 to 44.3%
in 2005), at the cost of the classes “Low” and “Very Low” (from 57.9% to 39.5%). This
suggests that the increase in the average sophistication of the Portuguese export basket
was achieved through a re-allocation of resources from products with low and very low
implied productivity to products with higher implied productivity.
Table 3 examines the contributions of the different classes of PRODY to the
growth rate of Portuguese exports between 1990 and 2005. According to these data, the
growth rate of exports (at current prices) between 1990 and 2005 was of 153%. The
classes growing above the average were those with “Very High” (413,7%), “High”
(273,1%) and “Average” (186,9%) income content. In terms of contributions, these two
classes, which represented little more than ¼ of the exports in the beginning of the
period, accounted for 55% of total export growth. This confirms a trend towards a
specialization pattern more based on “rich country goods”.
5. FDI, export growth and structural transformation in Portugal
In this section, we assess the extent to which Foreign Direct Investment (FDI) had
a role in the process of structural transformation of the Portuguese Economy, in the
period from 1995 to 2005. For this purpose, we estimate the share of “foreign firms” in
the Portuguese exports, by product category, using data collected by the Portuguese
Ministry of Labour and Social Solidarity on the composition of firms’ capital by

15
nationality of owners. By “foreign firms”, we mean those firms in which the proportion
of capital owned by non-nationals is equal or greater than 50% (details in Appendix 4).14
We first assess the extent to which FDI firms have contributed to the growth of
Portuguese exports. In Table 4, product categories are split into 5 groups of similar
dimensions, according to their contribution to the growth of Portuguese exports in the
period from 1995 to 2005. Here, we see that the top 20% products in terms of
contribution to export growth concentrate 83% of the estimated exports by foreign firms
in 2005. Table 4 also reveals that 12% of the estimated FDI exports are related to
products which exports have declined between 1995 and 2005. Coincidently, this is the
only group of products in which the share of FDI in total exports has diminished (from
32% in 1995 to 25% in 2005). This is suggestive of a strong impact of foreign firms on
the variation of Portuguese exports, both positively and negatively15 16.
14 Due to data limitations, in this section we restrict the analysis to 1.094 product categories (representing 96% of the Portuguese exports in 2005). 15 Actually, the direction of causality cannot be disentangled on the basis of the available data: multinational companies also tend to be attracted by fast exporting sectors. In a formal investigation, Magalhães and Africano (2007) find a significant correlation between the stock of (inward) FDI inflows and exports, thus suggesting at least a causality running from FDI to export growth. 16 It should be noted that these results are influenced by the bigger scale of foreign controlled firms with respect to the nationally controlled ones. To have an idea of the disproportion, in 2005 the average turnover of foreign-controlled firms in Portugal was about 24 times bigger than the average turnover of the remaining firms (source: Quadros de Pessoal database, GEP/MTSS). This figure considers all firms, independently of their involvement in international trade. If we were to consider only exporting firms, the contrast in the scales of foreign-dominated and other firms would surely be lower. Still, if we only consider firms with 50 employees or more, the average turnover of foreign-controlled firms in Portugal in 2005 was about 3.4 times higher than the average turnover of the remaining firms.
16
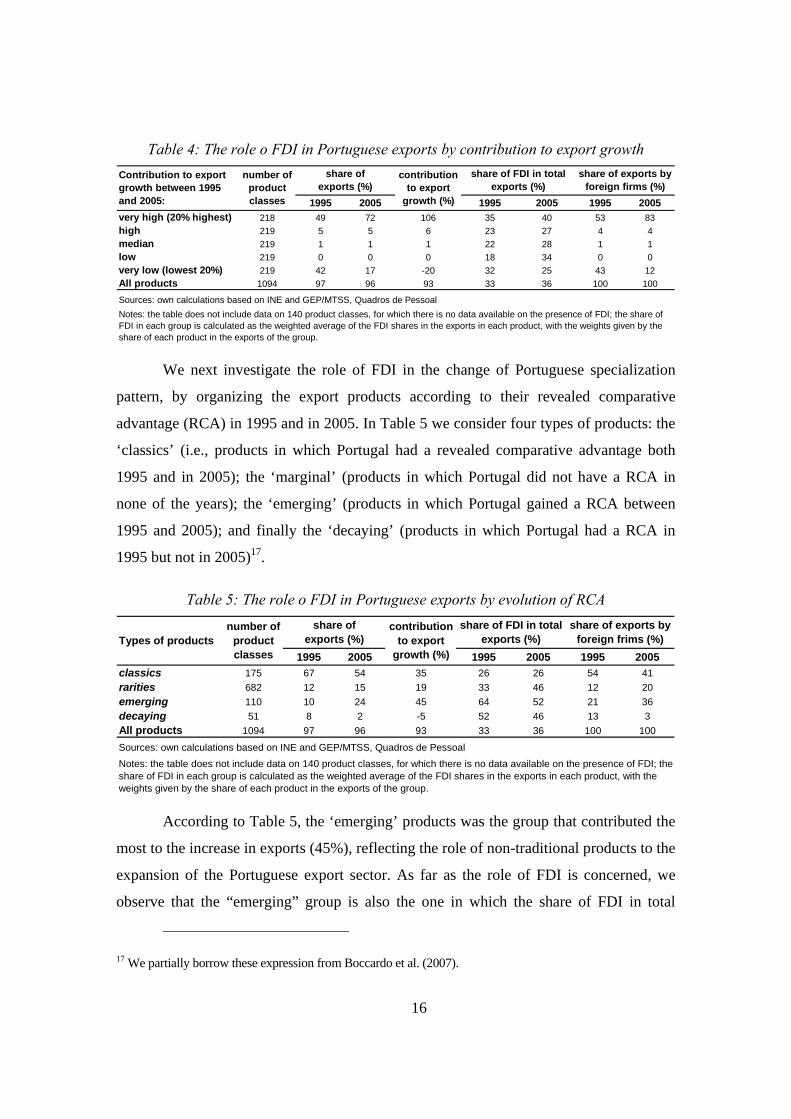
Table 4: The role o FDI in Portuguese exports by contribution to export growth
1995 2005 1995 2005 1995 2005very high (20% highest) 218 49 72 106 35 40 53 83high 219 5 5 6 23 27 4 4median 219 1 1 1 22 28 1 1low 219 0 0 0 18 34 0 0very low (lowest 20%) 219 42 17 -20 32 25 43 12All products 1094 97 96 93 33 36 100 100
Sources: own calculations based on INE and GEP/MTSS, Quadros de Pessoal
Contribution to export growth between 1995 and 2005:
share of FDI in total exports (%)
Notes: the table does not include data on 140 product classes, for which there is no data available on the presence of FDI; the share of FDI in each group is calculated as the weighted average of the FDI shares in the exports in each product, with the weights given by the share of each product in the exports of the group.
number of product classes
share of exports (%)
contribution to export
growth (%)
share of exports by foreign firms (%)
We next investigate the role of FDI in the change of Portuguese specialization
pattern, by organizing the export products according to their revealed comparative
advantage (RCA) in 1995 and in 2005. In Table 5 we consider four types of products: the
‘classics’ (i.e., products in which Portugal had a revealed comparative advantage both
1995 and in 2005); the ‘marginal’ (products in which Portugal did not have a RCA in
none of the years); the ‘emerging’ (products in which Portugal gained a RCA between
1995 and 2005); and finally the ‘decaying’ (products in which Portugal had a RCA in
1995 but not in 2005)17.
Table 5: The role o FDI in Portuguese exports by evolution of RCA
1995 2005 1995 2005 1995 2005classics 175 67 54 35 26 26 54 41rarities 682 12 15 19 33 46 12 20emerging 110 10 24 45 64 52 21 36decaying 51 8 2 -5 52 46 13 3All products 1094 97 96 93 33 36 100 100
Sources: own calculations based on INE and GEP/MTSS, Quadros de Pessoal
share of FDI in total exports (%)
share of exports by foreign frims (%)
contribution to export
growth (%)
Notes: the table does not include data on 140 product classes, for which there is no data available on the presence of FDI; the share of FDI in each group is calculated as the weighted average of the FDI shares in the exports in each product, with the weights given by the share of each product in the exports of the group.
Types of products share of
exports (%)number of
product classes
According to Table 5, the ‘emerging’ products was the group that contributed the
most to the increase in exports (45%), reflecting the role of non-traditional products to the
expansion of the Portuguese export sector. As far as the role of FDI is concerned, we
observe that the “emerging” group is also the one in which the share of FDI in total
17 We partially borrow these expression from Boccardo et al. (2007).

17
exports was larger, both in 1995 (64%) and in 2005 (52%). The last column in the right
hand side of Table 5 examines the distribution of FDI-commanded exports. The table
reveals that the group of “classics” is dominant in FDI exports, but with a loosing weight
(41% in 2005, as compared to 54% in 1995). The non-traditional products (“emerging”
plus “rarities”), in turn, are of increasing importance and, taken together, already
accounted for 56% of the foreign-commanded exports in 2005 (33% in 1995).
We now investigate the role of FDI in the upscale move of the Portuguese
specialization pattern. Table 6 analyses the presence of FDI in exports per class of
income content. According to these estimates, the share of FDI in total exports increased
from 33% in 1995 to 36% in 2005. In 2005, the classes of PRODY with higher presence
of FDI were, respectively, the “High” and “Very High” (weights equal to 56% and 43%,
respectively). Moreover, in that year, 63% of exports by foreign firms were accounted for
by these two classes.
Table 6: The role of FDI in Portuguese exports by classes of PRODY18
1995 2005 1995 2005 1995 2005very high (20% highest) 217 8 10 13 34 43 9 13high 235 25 31 40 50 56 40 50median 216 14 16 19 33 33 14 16low 215 30 25 17 25 17 23 12very low (lowest 20%) 211 20 13 4 23 24 14 9All products 1094 97 96 93 33 36 100 100
Sources: own calculations based on INE and GEP/MTSS, Quadros de Pessoal
contribution to export
growth (%)
share of FDI in total exports (%)
share of exports by foreign frims (%)
Notes: the table does not include data on 140 product classes, for which there is no data available on the presence of FDI; the share of FDI in each group is calculated as the weighted average of the FDI shares in the exports in each product, with the weights given by the share of each product in the exports of the group.
Prody Class in 2005number of
product classes
share of exports (%)
18 In this and in the following tables, the share of FDI in each group is calculated as the weighted average of the FDI shares in the exports in each product, with the weights given by the share of each product in the exports of the group (for further details see appendix 3).

18
Figure 4: Share of exports of different PRODY classes
1995
0
10
20
30
40
50
very low(lowest20%)
low median high very high(20%
highest)
'domestic'exports
'FDI' exports
2005
0
10
20
30
40
50
very low(lowest20%)
low median high very high(20%
highest)
'domestic'exports
'FDI' exports
Source: own calculations based on INE and GEP/MTSS
In Figure 4, we compare the distributions of exports by classes of PRODY, for
domestic firms and foreign firms, in 1995 and in 2005. We observe that the distribution
of FDI-led exports is more biased towards products with higher income content than the
corresponding distribution of domestic firms (a simple Chi-square test rejects the
hypothesis of equal distributions, at a 1 % significance level). Furthermore, while in the
case of ‘domestic’ exports the shape of the distribution is approximately the same in 1995
and in 2005 (though with an increase in the weight of products with higher income
content), in the case of FDI exports there is a visible change in the shape of the
distribution (also confirmed by the Chi-square test). In particular, the distribution of
foreign-commanded exports by class of PRODY has changed from a bi-modal to a one-
modal one, with half of exports concentred in the class of “High” PRODY value.
Finally, we assess whether the increasing role of FDI in exports with high income
content refers to traditional or to non-traditional sectors. In Table 7, we cross the
information on exports by foreign affiliates per historical status (Table 5) with the
information on exports by foreign affiliates per classes of PRODY (Table 6), for the year
2005. We observe that 31% of the FDI commanded exports correspond to “emerging”
products with “High” income content and other 11% correspond to “rarities” with Very
High income content”.

19
Table 7: FDI exports by evolution of RCA and PRODY class
Type of productsvery low (lowest
20%)low median high
very high (20%
highest)Total
classics 6 11 9 14 1 41rarities 0 0 2 6 11 20emerging 2 1 3 31 0 36decaying 0 0 2 0 0 3All products 9 12 16 50 13 100Sources: own calculations based on INE and GEP/MTSS, Quadros de PessoalNotes: the table does not include data on 140 product classes, for which there is no data available on the presence of FDI; the share of FDI in each group is calculated as the weighted average of the FDI shares in the exports in each product, with the weights given by the share of each product in the exports of the group.
Prody Class in 2005
Table 8 illustrates the results discussed in this section by providing information on
the 20 product categories that have contributed the most for the growth in Portuguese
exports between 1995 and 2005 (these were responsible for 60% of the total increase in
exports during this period). In the table we see that FDI accounted for at least 2/3 of the
exports in 2005 in 8 out of those 20 product categories. With two exceptions the share of
FDI in this FDI-dominated products was already significant in 1995. Only 3 of these 8
cases consist in ‘classic’ exports, the others being non-traditional products. And in all but
two of these products (namely, cigarrets and rubber tyres), the income content is either
“High” or “Very High”. This table also illustrates the relevance of the automotive and
related industries in the processes discussed above: Motor cars and Parts and accessories
of motor vehicles, both classified as products with high Prody values, are responsible for
19% of the growth observed in Portuguese exports.

20
Table 8: Top 20 products in terms of contribution to export growth
Code Commodityshare of
exports in 2005 (%)
contribution to export
growth (%)
share of FDI in exports in
1995 (%)
share of FDI in exports in
2005 (%)
Prody value in 2005 RCA class
8.703 Motor cars and other motor vehicles principally designed for the transport ... 7 11 99 84 High emerging8.708 Parts and accessories of the motor vehicles of headings 87.01 to 87.05. 4 8 56 66 High emerging8.473 Parts and accessories for use with machines of heading 84.69 to 84.72 2 5 28 n.a. Very High emerging2.710 Petroleum oils, other than crude 4 5 0 0 Low classics9.401 Seats (other than those of heading 94.02), whether or not convertible into ... 2 3 5 0 Median classics4.802 Uncoated paper and paperboard, of a kind used for writing 2 3 1 0 Very High classics8.527 Reception apparatus for radio-telephony, radio-telegraphy or radio-broadcas ... 3 3 93 98 High classics8.542 Electronic integrated circuits and microassemblies. 2 3 80 95 Very High marginals6.109 T-shirts, singlets and other vests, knitted or crocheted. 2 3 31 33 Very low classics4.011 New pneumatic tyres, of rubber. 1 3 75 93 Median classics7.601 Unwrought aluminium. 1 2 0 12 Median emerging2.402 Cigars, cheroots, cigarillos and cigarettes 1 2 4 85 Very low emerging3.004 Medicaments (excluding goods of heading 30.02, 30.05 or 30.06) 1 2 38 36 Very High marginals8.481 Taps, cocks, valves and similar appliances for pipes, boiler shells 1 1 14 78 High emerging7.214 Other bars and rods of iron or non-alloy steel, not further worked than for ... 1 1 0 0 Low emerging2.204 Wine of fresh grapes, including fortified wines 2 1 31 18 Low classics2.901 Acyclic hydrocarbons. 1 1 5 73 High classics4.504 Agglomerated cork (with or without a binding substance) 1 1 8 8 High classics8.480 Moulding boxes for metal foundry; mould bases; moulding patterns 1 1 4 6 High classics4.503 Articles of natural cork. 1 1 8 8 High classics
Total of 20 products contributing most to export growth 39 60 46 50 - -

21
6. Conclusions
In this paper, we document that the average income content of the Portuguese
exports has grown above the world average in recent years. This evolution is related to a
“structural transformation effect” (that is, a shift in the specialization pattern towards
products with higher income content), rather than to changes in the implied income of
traditional exports. On the contrary, given the increasing competition from emerging
economies in the traditional segments, had the Portuguese export basket remained stuck,
its average income content would have grown less than the average.
Analysing in greater detail the evolution in the Portuguese export structure, we
find an increasing role of the classes of products with “High” and “Very High” income
content, both in terms of growth and in terms of contribution to growth. Between 1990
and 2005, these two classes accounted for 55% of the total export growth. Though using
a different methodology, our evidence accords with the recent findings of Caldeira Cabral
(2008) and Amador et al. (2007) who analysed the changing structure of Portuguese
exports following the OECD classification of R&D intensities.
As far as the role of FDI is concerned, we draw three main conclusions. First,
foreign affiliated firms have played a key role in the growth rate of Portuguese exports. In
particular, we observe that the top 20% of products that most accounted for the growth in
Portuguese exports concentrate 83% of the estimated exports by foreign firms in 2005.
Second, we document that foreign affiliated firms have contributed significantly to the
change in the Portuguese specialization pattern. In particular, we find that the share of
FDI commanded exports in total exports is higher in the category of products in which
Portugal recently achieved comparative advantage. Taken together, the non-traditional
exports (e.g, those products in which Portugal had no revealed comparative advantage in
1995) accounted for 56% of the exports by foreign firms. Third, foreign affiliated firms
have contributed to the upscale move of the Portuguese specialization pattern. For
instance, we find that almost 2/3 of exports by foreign firms in Portugal in 2005
correspond to products with “High” and “Very High” income content. We also observe

22
that the distribution of FDI-led exports is more biased towards products with higher
income content than the corresponding distribution for domestic firms and that this bias
has increased over time. Taken together, this evidence suggests that FDI has played a
relevant role in the Portuguese export performance, both in terms of growth,
diversification and upscale movement.
The evidence found in this paper is consistent with Cabral (1996) and Magalhães
and Africano (2007), in that FDI has contributed to the expansion of Portuguese exports,
and with Gonçalves and Guimarães (1997) in that foreign affiliated firms tend to exhibit a
production pattern that differs significantly from that of domestic firms. The evidence in
this paper does not, support, however, the IMF (2008, pp 97-103) claim that FDI did not
contribute to boosting export performance or to upgrade Portuguese exports. The IMF
conclusion is formulated observing that: (i) the sectors which experienced an increase in
the shares of FDI since the mid-1990s were typically those with a lower growth of
international demand, and (ii) rising FDI flows to “high-tech” sectors were offset by
increasing “low-tech FDI”. A drawback in the IMF analysis is that the authors used a
high level of aggregation and examined FDI financial flows, rather than exports by
foreign affiliated firms, broken down by income content, as we do in this paper.
It should be noted that a higher income content on exports does not necessarily
correspond to a higher content of domestic value added on exports. As pointed out by
Amaral (2006), some low tech traditional industries, like textiles and footwear, have a
larger content of valued added generated domestically than high tech industries, like
motor vehicles, which are more dependent on imports of intermediate inputs. Using the
input-output methodology, Amaral (2006) estimates a decline in the domestic component
of Portuguese exports, from 45% in 1995 to 44% in 2004, due to its changing structure.
These estimates ignore, however, the indirect effects of innovation, including learning by
doing, knowledge spillovers, information externalities and backward and forward
linkages. As mentioned in Section 2, Hausmann et al. (2007) found that the sophistication
of a country export basket is a leading indicator of economic growth, after controlling for
the standard co-variates. That being so, the results we reach in this paper that (i) Portugal
has moved its specialization pattern towards “rich country goods”; and (ii) FDI has

23
played a positive role in this process, seem to imply that FDI is indeed having a positive
impact on the growth prospects of the Portuguese economy.

24
References
Aitken, B., Harrison, A., 1999. “Do domestic firms benefit from direct foreign
investmjent? Evidence from Venezuela”. American Economic Review 89, 605-618.
Amador, J., Cabral, S., Maria, J., 2007. “International Trade Patterns over the Last Four
Decades: How does Portugal Compare with other Cohesion Countries?”, Banco de
Portugal Working Paper Nº14/2007.
Amaral, J. , 2006. “Evolução do comércio externo português de exportação: 1995-2004”,
GEE Papers Nº 1, Gabinete de Estratégia e Estudos, Ministério da Economia e
Inovação, Lisbon.
Balassa, B., 1965. “Trade Liberalization and Revealed Comparative Advantage”. The
Manchester School of Economic and Social Studies 33(2), pp. 99-123.
Barbosa, N., Guimarães, P., Woodward, D. , 2004. “Foreign entry in an open economy:
the case of Portugal”, Applied Economics 36 (5), 465-472.
Barbosa, N., Louri, H., 2002. “On the determinants of multinationals ownership
preferences: evidence from Greece and Portugal”. International Journal of Industrial
Organization 20 (4), 493-515.
Barbosa, N., Louri, H., 2005. “Corporate performance: does ownership matter? A
comparison of foreign- and domestic-owned firms in Greece and Portugal”. Review
of Industrial Organization 27 (1), 73-102.
Boccardo, J. , Chandra, V., Li, Y., Osorio, I., 2007. “Why export sophistication matters
for growth?”. Mimeo.
Borensztein, E., De Gregório, J., Lee, J-W, 1998. “How does foreign direct investment
affect economic growth?”. Journal of International Economics 45, 115–135.
Cabral, S., 1996. Comparative export behaviour of foreign and domestic firms in
Portugal. Banco de Portugal Working Paper Nº 8/96.

25
Caldeira Cabral, M., 2008. “Export diversification and technological improvement: recent
trends in the Portuguese Economy”. GEE Papers Nº 6, Gabinete de Estratégia e
Estudos, Ministério da Economia e Inovação, Lisbon.
Dalum, B., Laursen, K., Verpagen, B., 1999. ”Does specialization matter for growth?”
Industrial and Corporate Change, 8 (2), 267-288.
Di Maio, M., Tamagni, F., 2007. “The Evolution of the World Trade and the Italian
'Anomaly': A New Look”. Università degli Studi di Macerata, mimeo.
Eaton, J., and Kortun, S., 1999. “International patenting and technological diffusion:
theory and measurement”. International Economic Review 40, 537-570.
Eaton, J., and Kortun, S., 1996. “Trade in ideas: patenting and productivity in the
OECD”. Journal of International Economics, 40: 251-278.
Feenstra, R. C. and A. K. Rose, 2000. “Putting things in order: patterns of trade dynamics
and growth”. The Review of Economics and Statistics 82(3), 369-382.
Flores, R., Fontoura, M., Santos, R., 2007. “Foreign Direct Investment Spillovers:
Additional Lessons from a country study”. The European Journal of Development
Research 19 (3), pp. 372-390.
Fosfuri, A., Motta, M., Ronde, T., 2001. “Foreign direct investment and spillovers
through workers’ mobility”. Journal of International Economics 53, pp. 205-22.
Gonçalves, O., and Guimarães, P., 1997. “O investimento directo estrangeiro na industria
transformadora Portuguesa: uma abordagem sectorial e regional através do emprego
para o período 1982-1992”. Estudos de Economia 16-17 (3), 333-58.
Grossman, G., Helpman, E., 1991. “Innovation and growth in the global economy”. MIT
Press, Cambridge.
Guimarães, P., Figueiredo, O., Woodward, D., 2000. “Agglomeration and the Location of
Foreign Direct Investment in Portugal. Journal of Urban Economics 47, 115-135.

26
Hausmann, R. and B. Klinger, 2007. “The structure of the product space and the
evolution of the comparative advantage”. Center for International Development,
Harvard University.
Hausmann, R., Hwang, J. and D. Rodrik, 2007. “What you export matters”. Journal of
Economic Growth 12, 1-25.
Hausmann, R. and D. Rodrik, 2006. “Doomed to choose: industrial policy as
predicament”. Harvard University, mimeo.
Hausmann, R. and D. Rodrik, 2003. “Economic Development as Self-Discovery”.
Journal of Development Economics 72, 603-633.
International Monetary Fund, 2007. World Economic Outlook Database, April.
International Monetary Fund, 2008. “France, Greece, Italy, Portugal, and Spain –
Competitiveness in the Southern Euro Area”. IMF Country Report No. 08/145.
Jovanovic, B., Nyarko, Y. , 1996. “Learning by doing and the choice of technology”.
Econometrica 64 (6), 1299-1310.
Kaldor, N., 1966. “Causes of the Slow Rate of Growth of the United Kingdom”.
Cambridge University Press.
Keller, W., 2004. “International Technological Diffusion”, Journal of Economic
Literature 42: 752-782.
Kugler, M., 2006. “Spillovers from foreign direct investment: within or between
industries?”. Journal of Development Economics 80, pp 444-477.
Lebre de Freitas, M., Susana Salvado, 2008. “Industry similarities, comparative
advantage and upscale opportunities for Portugal in the process of structural
transformation: an empirical assessment based on 2005 trade data”. Mimeo, paper
presented at the 2008 meeting of the European Economic Association.

27
Magalhães, M., and Africano, A., 2007. “A Panel Analysis of the FDI impact on
International Trade”. NIPE WP 6, Universidade do Minho.
Markusen, J., 2002. “Multinational firms and the theory of international trade”.
Cambridge MIT Press.
Markusen, J., Venables, T., 1999, Foreign direct investment as a catalyst for industrial
development. European Economic Review, 335-356.
Mata, J., Portugal, P., 2004. "Patterns of entry, post-entry growth and survival: A
comparison between domestic and foreign owned firms," Small Business
Economics, 22 (3,4), 283-298.
Murphy, K., Shleifer, A, Vishny, R., 1989. Industrialization and the big push.
Journal o Political Economy 97, 1003-1026.
OECD, 2008. “OECD Economic Surveys: Portugal”. OECD, Paris.
Prebisch, R., 1950. “The Economic Development of Latin America and its Principal
problems”. United Nations, Lake Success, New York.
Singer, H., 1950. “The distribution of trade between investing and borrowing countries”.
American Economic Review 40, 473-485.
Rodriguez-Clare, A., 1996. “Multinationals, linkages, and economic development”.
American Economic Review 86, pp. 852-873.
Rodrik, D., 2007. “One Economics, Many Recipes: Globalization, Institutions, and
Economic Growth”. Princeton University Press, Princeton.
Thirlwall, A. P., 1979. “The Balance of Payments constraint as an explanation of
international growth differences”. Banca Nazionale del Lavoro Quarterly Review,
vol. 3, 245-253.
Trindade, V. 2005, The Big Push, Industrialization and International Trade: the role of
exports, Journal of Development Economics 78 (1), 22-48.

28
UNCTAD, United Nations Conference on Trade and Development, 2007. World
Investment Report 2007.

29
Appendix 1: Definitions of PRODY and EXPY
The PRODY index measures the “income content” of each product, as a weighted
average of per capita incomes of the countries that export it. For each product i, the
PRODY index is computed as:
∑∈
=Cc
ccii YPRODY σ , where ∑∈
=
Cdid
icic RCA
RCAσ , XXXXRCA
i
cicic = , { }MC ,....,2,1= ,
where CY is real GDP per capita in the c-th country, M is the number of countries and the
the weights ciσ normalize the Balassa (1958) index of Revealed Comparative Advantage
(RCA) of the c-country with respect to all the countries exporting in the same sector.
EXPY: measures the “sophistication level” of a country export basket, as an
weighted average of the PRODYs of the products exported by that country. The income
content of a country export basket, EXPY, is computed, for each country, as:
∑=i
iic PRODYsEXPY , where c
ici X
Xs = is the share of product i in the exports of
country c.

30
Appendix 2 – Decomposing the growth of EXPY at current PRODY
Let tiE be the value of EXPY of country i in year t, t
ijs the share of product j in
the total exports of country i in year t, and tPj the PRODY value of product j in year t.
The change in EXPY from t to t+n can be decomposed as follows:
( )
( ) ( )[ ]
( ) ( )
( ) ( ) ( )∑∑∑
∑ ∑
∑
∑
∑∑
−+−−++−=
−+−=
−+−=
−=
−=−
++++++
+++
+++
++
+++
j
tj
ntj
tij
j
ntj
tij
tj
ntij
tj
tij
ntj
ntij
j
tj
tij
ntij
j j
tj
ntj
tij
ntj
tij
ntij
j
tj
ntj
tij
ntj
tj
ntij
j
tj
tij
ntj
ntij
j
tj
tij
j
ntj
ntij
ti
nti
PPsPsPsPsPsPss
PPsPss
PPsPss
PsPs
PsPsEE
......
..
..
..
..
The first component of this expression is the pure “structural transformation
effect” (it tells how the EXPY would have changed if the PRODY values of the different
products did not change between 1995 and 2005), the last component gives the pure
“PRODY effect” (it shows how the EXPY of a country would have changed if there had
been no transformation in its export structure), and the component in the middle is the
“mixed effect” (which takes into account the fact that the impact of changes in PRODY
values on the country’s EXPY are amplified when they refer to products which have
gained weight in the country’s export basket and vice-versa). The following table
displays the results of this decomposition for 81 countries.

31
rate rankArgentina 9.909 12.964 31% 73 29% 2% -1%Australia 11.328 16.762 48% 33 42% 4% 2%Austria 13.656 18.599 36% 67 35% 2% -1%Belize 5.731 7.150 25% 81 42% -7% -10%Bolivia 6.825 11.038 62% 13 29% -1% 34%Brazil 10.231 15.063 47% 35 39% 1% 6%Cameroon 6.681 11.054 65% 12 46% -7% 27%Canada 9.200 14.537 58% 19 42% 6% 9%Chile 9.012 17.340 92% 6 70% -20% 42%China 6.875 9.736 42% 47 49% -3% -4%Colombia 8.835 17.240 95% 4 31% 12% 52%Costa Rica 10.981 13.794 26% 80 39% -3% -10%Cote d'Ivoire 6.963 13.918 100% 3 39% 5% 56%Croatia 10.800 15.478 43% 44 37% -1% 7%Cyprus 10.540 17.699 68% 11 35% 7% 25%Czech Rep. 12.360 18.053 46% 38 38% 0% 7%Denmark 13.468 18.578 38% 61 36% 2% 0%Dominica 5.680 8.071 42% 46 32% -13% 23%Ecuador 7.418 12.810 73% 8 41% 7% 25%Estonia 10.810 16.380 52% 29 39% -2% 14%Finland 14.324 19.569 37% 66 35% -1% 2%France 13.077 18.493 41% 48 37% 3% 2%Germany 14.054 19.363 38% 62 36% 1% 1%Greece 9.828 15.363 56% 23 37% 9% 11%Guatemala 6.419 10.376 62% 14 41% -5% 26%Honduras 4.365 9.321 114% 2 47% -2% 69%Hong Kong SAR 11.293 17.337 54% 26 34% 3% 16%Hungary 11.332 18.071 59% 16 37% 0% 22%Iceland 13.440 18.952 41% 52 31% 6% 4%India 9.322 14.455 55% 25 43% 4% 8%Ireland 14.585 23.438 61% 15 39% 16% 6%Israel 12.411 18.550 49% 31 43% 6% 0%Italy 12.880 17.886 39% 59 36% 2% 1%Japan 14.547 19.575 35% 70 34% 1% 0%Jordan 8.314 11.962 44% 43 46% -12% 10%Kazakhstan 9.216 14.460 57% 21 56% -9% 11%Kiribati 4.527 5.854 29% 77 55% -60% 35%Kyrgyzstan 6.968 9.237 33% 72 80% -62% 14%Latvia 10.023 15.236 52% 28 49% -5% 8%Lithuania 10.177 15.041 48% 34 45% -2% 5%Madagascar 4.205 9.458 125% 1 50% -5% 80%Malawi 2.921 4.589 57% 20 38% -5% 24%Malaysia 12.387 17.095 38% 60 31% 0% 7%Maldives 7.396 12.827 73% 7 49% -13% 37%Malta 13.293 18.710 41% 53 31% 5% 5%Mauritius 7.582 11.988 58% 18 34% 1% 23%Mexico 12.152 16.998 40% 54 35% 0% 5%Morocco 6.791 10.775 59% 17 42% -6% 22%Mozambique 4.692 6.528 39% 58 55% -86% 70%Netherlands 13.044 17.928 37% 63 35% 1% 1%New Zealand 11.848 17.120 44% 40 41% 0% 3%Nicaragua 5.901 8.213 39% 57 57% -31% 13%Niger 3.985 5.159 29% 76 35% -22% 17%Norway 12.673 16.532 30% 75 36% -3% -3%Oman 11.195 15.379 37% 64 37% -4% 4%Panama 6.111 10.357 69% 9 44% -14% 39%Paraguay 6.713 9.031 35% 71 36% -10% 8%Peru 6.233 8.984 44% 42 54% -12% 2%Poland 10.916 16.730 53% 27 39% 1% 13%Portugal 11.058 16.394 48% 32 35% 5% 9%Rep. of Korea 12.787 18.280 43% 45 34% 0% 9%Rep. of Moldova 8.213 10.547 28% 78 41% -15% 2%Romania 10.241 14.465 41% 50 39% -2% 4%Saudi Arabia 10.863 15.360 41% 49 41% -1% 2%Singapore 13.903 18.792 35% 69 32% 3% 1%Slovakia 11.472 17.148 49% 30 39% 2% 8%Slovenia 12.629 18.561 47% 36 41% 3% 4%Spain 12.507 17.475 40% 55 38% 1% 1%Sweden 14.143 19.332 37% 65 37% 1% -1%Switzerland 15.117 21.842 44% 41 38% 6% 0%TFYR of Macedonia 8.939 12.107 35% 68 42% -8% 2%Thailand 11.246 16.484 47% 37 32% 3% 11%Togo 6.153 8.039 31% 74 42% -40% 28%Trinidad and Tobago 8.994 14.064 56% 22 52% -9% 13%Tunisia 8.683 12.668 46% 39 31% 4% 12%Turkey 9.124 14.247 56% 24 33% 6% 17%Uganda 4.493 8.732 94% 5 34% -8% 68%United Kingdom 13.689 19.312 41% 51 38% 2% 2%Uruguay 10.645 13.523 27% 79 28% 2% -3%USA 13.700 19.078 39% 56 35% 2% 2%Zambia 3.376 5.701 69% 10 76% -87% 80%
Mixed effect Pure structural effect
EXPY growth EXPY 1995 EXPY 2005 Pure Prody
effect

32
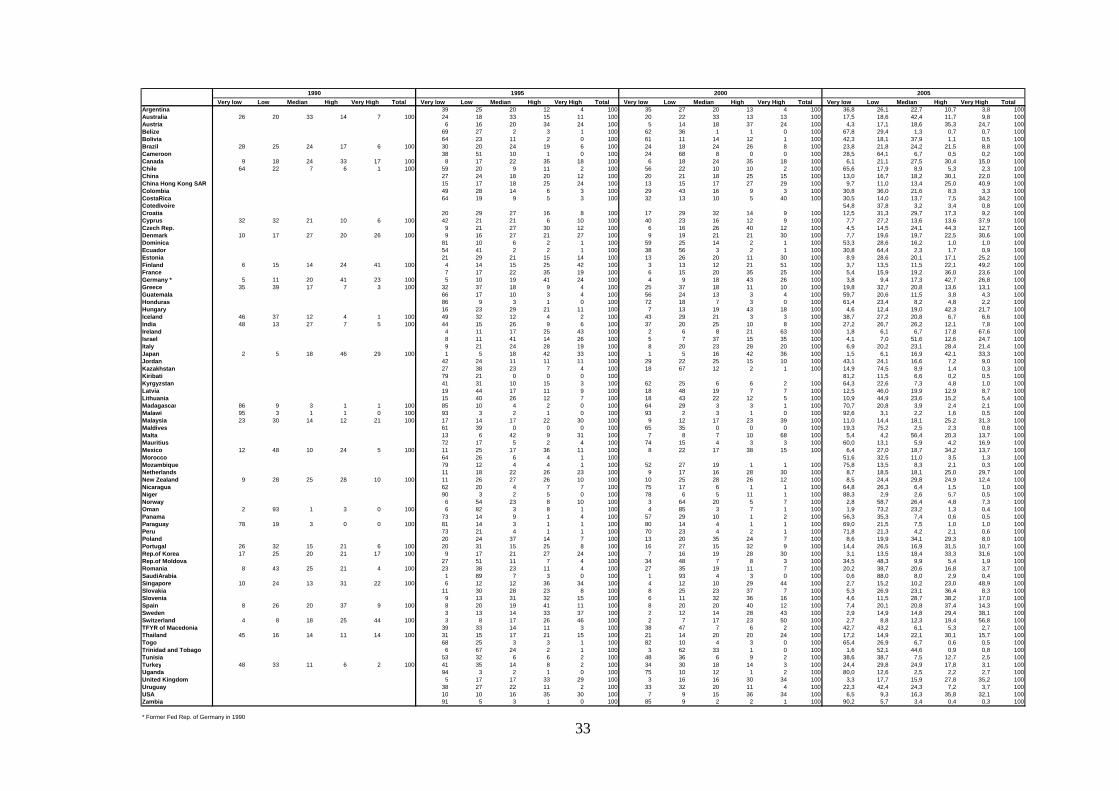
Appendix 3 – Export shares by class of PRODY
33
Very low Low Median High Very High Total Very low Low Median High Very High Total Very low Low Median High Very High Total Very low Low Median High Very High TotalArgentina 39 25 20 12 4 100 35 27 20 13 4 100 36,8 26,1 22,7 10,7 3,8 100Australia 26 20 33 14 7 100 24 18 33 15 11 100 20 22 33 13 13 100 17,5 18,6 42,4 11,7 9,8 100Austria 6 16 20 34 24 100 5 14 18 37 24 100 4,3 17,1 18,6 35,3 24,7 100Belize 69 27 2 3 1 100 62 36 1 1 0 100 67,8 29,4 1,3 0,7 0,7 100Bolivia 64 23 11 2 0 100 61 11 14 12 1 100 42,3 18,1 37,9 1,1 0,5 100Brazil 28 25 24 17 6 100 30 20 24 19 6 100 24 18 24 26 8 100 23,8 21,8 24,2 21,5 8,8 100Cameroon 38 51 10 1 0 100 24 68 8 0 0 100 28,5 64,1 6,7 0,5 0,2 100Canada 9 18 24 33 17 100 8 17 22 35 18 100 6 18 24 35 18 100 6,1 21,1 27,5 30,4 15,0 100Chile 64 22 7 6 1 100 59 20 9 11 2 100 56 22 10 10 2 100 65,6 17,9 8,9 5,3 2,3 100China 27 24 18 20 12 100 20 21 18 25 15 100 13,0 16,7 18,2 30,1 22,0 100China Hong Kong SAR 15 17 18 25 24 100 13 15 17 27 29 100 9,7 11,0 13,4 25,0 40,9 100Colombia 49 28 14 6 3 100 29 43 16 9 3 100 30,8 36,0 21,6 8,3 3,3 100CostaRica 64 19 9 5 3 100 32 13 10 5 40 100 30,5 14,0 13,7 7,5 34,2 100CotedIvoire 54,8 37,8 3,2 3,4 0,8 100Croatia 20 29 27 16 8 100 17 29 32 14 9 100 12,5 31,3 29,7 17,3 9,2 100Cyprus 32 32 21 10 6 100 42 21 21 6 10 100 40 23 16 12 9 100 7,7 27,2 13,6 13,6 37,9 100Czech Rep. 9 21 27 30 12 100 6 16 26 40 12 100 4,5 14,5 24,1 44,3 12,7 100Denmark 10 17 27 20 26 100 9 16 27 21 27 100 9 19 21 21 30 100 7,7 19,6 19,7 22,5 30,6 100Dominica 81 10 6 2 1 100 59 25 14 2 1 100 53,3 28,6 16,2 1,0 1,0 100Ecuador 54 41 2 2 1 100 38 56 3 2 1 100 30,8 64,4 2,3 1,7 0,9 100Estonia 21 29 21 15 14 100 13 26 20 11 30 100 8,9 28,6 20,1 17,1 25,2 100Finland 6 15 14 24 41 100 4 14 15 25 42 100 3 13 12 21 51 100 3,7 13,5 11,5 22,1 49,2 100France 7 17 22 35 19 100 6 15 20 35 25 100 5,4 15,9 19,2 36,0 23,6 100Germany * 5 11 20 41 23 100 5 10 19 41 24 100 4 9 18 43 26 100 3,8 9,4 17,3 42,7 26,8 100Greece 35 39 17 7 3 100 32 37 18 9 4 100 25 37 18 11 10 100 19,8 32,7 20,8 13,6 13,1 100Guatemala 66 17 10 3 4 100 56 24 13 3 4 100 59,7 20,6 11,5 3,8 4,3 100Honduras 86 9 3 1 0 100 72 18 7 3 0 100 61,4 23,4 8,2 4,8 2,2 100Hungary 16 23 29 21 11 100 7 13 19 43 18 100 4,6 12,4 19,0 42,3 21,7 100Iceland 46 37 12 4 1 100 49 32 12 4 2 100 43 29 21 3 3 100 38,7 27,2 20,8 6,7 6,6 100India 48 13 27 7 5 100 44 15 26 9 6 100 37 20 25 10 8 100 27,2 26,7 26,2 12,1 7,8 100Ireland 4 11 17 25 43 100 2 6 8 21 63 100 1,8 6,1 6,7 17,8 67,6 100Israel 8 11 41 14 26 100 5 7 37 15 35 100 4,1 7,0 51,6 12,6 24,7 100Italy 9 21 24 28 19 100 8 20 23 28 20 100 6,9 20,2 23,1 28,4 21,4 100Japan 2 5 18 46 29 100 1 5 18 42 33 100 1 5 16 42 36 100 1,5 6,1 16,9 42,1 33,3 100Jordan 42 24 11 11 11 100 29 22 25 15 10 100 43,1 24,1 16,6 7,2 9,0 100Kazakhstan 27 38 23 7 4 100 18 67 12 2 1 100 14,9 74,5 8,9 1,4 0,3 100Kiribati 79 21 0 0 0 100 81,2 11,5 6,6 0,2 0,5 100Kyrgyzstan 41 31 10 15 3 100 62 25 6 6 2 100 64,3 22,6 7,3 4,8 1,0 100Latvia 19 44 17 11 9 100 18 48 19 7 7 100 12,5 46,0 19,9 12,9 8,7 100Lithuania 15 40 26 12 7 100 18 43 22 12 5 100 10,9 44,9 23,6 15,2 5,4 100Madagascar 86 9 3 1 1 100 85 10 4 2 0 100 64 29 3 3 1 100 70,7 20,8 3,9 2,4 2,1 100Malawi 95 3 1 1 0 100 93 3 2 1 0 100 93 2 3 1 0 100 92,6 3,1 2,2 1,6 0,5 100Malaysia 23 30 14 12 21 100 17 14 17 22 30 100 9 12 17 23 39 100 11,0 14,4 18,1 25,2 31,3 100Maldives 61 39 0 0 0 100 65 35 0 0 0 100 19,3 75,2 2,5 2,3 0,8 100Malta 13 6 42 9 31 100 7 8 7 10 68 100 5,4 4,2 56,4 20,3 13,7 100Mauritius 72 17 5 2 4 100 74 15 4 3 3 100 60,0 13,1 5,9 4,2 16,9 100Mexico 12 48 10 24 5 100 11 25 17 36 11 100 8 22 17 38 15 100 6,4 27,0 18,7 34,2 13,7 100Morocco 64 26 6 4 1 100 51,6 32,5 11,0 3,5 1,3 100Mozambique 79 12 4 4 1 100 52 27 19 1 1 100 75,8 13,5 8,3 2,1 0,3 100Netherlands 11 18 22 26 23 100 9 17 16 28 30 100 8,7 18,5 18,1 25,0 29,7 100New Zealand 9 28 25 28 10 100 11 26 27 26 10 100 10 25 28 26 12 100 8,5 24,4 29,8 24,9 12,4 100Nicaragua 62 20 4 7 7 100 75 17 6 1 1 100 64,8 26,3 6,4 1,5 1,0 100Niger 90 3 2 5 0 100 78 6 5 11 1 100 88,3 2,9 2,6 5,7 0,5 100Norway 6 54 23 8 10 100 3 64 20 5 7 100 2,8 58,7 26,4 4,8 7,3 100Oman 2 93 1 3 0 100 6 82 3 8 1 100 4 85 3 7 1 100 1,9 73,2 23,2 1,3 0,4 100Panama 73 14 9 1 4 100 57 29 10 1 2 100 56,3 35,3 7,4 0,6 0,5 100Paraguay 78 19 3 0 0 100 81 14 3 1 1 100 80 14 4 1 1 100 69,0 21,5 7,5 1,0 1,0 100Peru 73 21 4 1 1 100 70 23 4 2 1 100 71,8 21,3 4,2 2,1 0,6 100Poland 20 24 37 14 7 100 13 20 35 24 7 100 8,6 19,9 34,1 29,3 8,0 100Portugal 26 32 15 21 6 100 20 31 15 25 8 100 16 27 15 32 9 100 14,4 26,5 16,9 31,5 10,7 100Rep.of Korea 17 25 20 21 17 100 9 17 21 27 24 100 7 16 19 28 30 100 3,1 13,5 18,4 33,3 31,6 100Rep.of Moldova 27 51 11 7 4 100 34 48 7 8 3 100 34,5 48,3 9,9 5,4 1,9 100Romania 8 43 25 21 4 100 23 38 23 11 4 100 27 35 19 11 7 100 20,2 38,7 20,6 16,8 3,7 100SaudiArabia 1 89 7 3 0 100 1 93 4 3 0 100 0,6 88,0 8,0 2,9 0,4 100Singapore 10 24 13 31 22 100 6 12 12 36 34 100 4 12 10 29 44 100 2,7 15,2 10,2 23,0 48,9 100Slovakia 11 30 28 23 8 100 8 25 23 37 7 100 5,3 26,9 23,1 36,4 8,3 100Slovenia 9 13 31 32 15 100 6 11 32 36 16 100 4,6 11,5 28,7 38,2 17,0 100Spain 8 26 20 37 9 100 8 20 19 41 11 100 8 20 20 40 12 100 7,4 20,1 20,8 37,4 14,3 100Sweden 3 13 14 33 37 100 2 12 14 28 43 100 2,9 14,9 14,8 29,4 38,1 100Switzerland 4 8 18 25 44 100 3 8 17 26 46 100 2 7 17 23 50 100 2,7 8,8 12,3 19,4 56,8 100TFYR of Macedonia 39 33 14 11 3 100 38 47 7 6 2 100 42,7 43,2 6,1 5,3 2,7 100Thailand 45 16 14 11 14 100 31 15 17 21 15 100 21 14 20 20 24 100 17,2 14,9 22,1 30,1 15,7 100Togo 68 25 3 3 1 100 82 10 4 3 0 100 65,4 26,9 6,7 0,6 0,5 100Trinidad and Tobago 6 67 24 2 1 100 3 62 33 1 0 100 1,6 52,1 44,6 0,9 0,8 100Tunisia 53 32 6 6 2 100 48 36 6 9 2 100 38,6 38,7 7,5 12,7 2,5 100Turkey 48 33 11 6 2 100 41 35 14 8 2 100 34 30 18 14 3 100 24,4 29,8 24,9 17,8 3,1 100Uganda 94 3 2 1 0 100 75 10 12 1 2 100 80,0 12,6 2,5 2,2 2,7 100United Kingdom 5 17 17 33 29 100 3 16 16 30 34 100 3,3 17,7 15,9 27,8 35,2 100Uruguay 38 27 22 11 2 100 33 32 20 11 4 100 22,3 42,4 24,3 7,2 3,7 100USA 10 10 16 35 30 100 7 9 15 36 34 100 6,5 9,3 16,3 35,8 32,1 100Zambia 91 5 3 1 0 100 85 9 2 2 1 100 90,2 5,7 3,4 0,4 0,3 100
* Former Fed Rep. of Germany in 1990
20051990 1995 2000
34
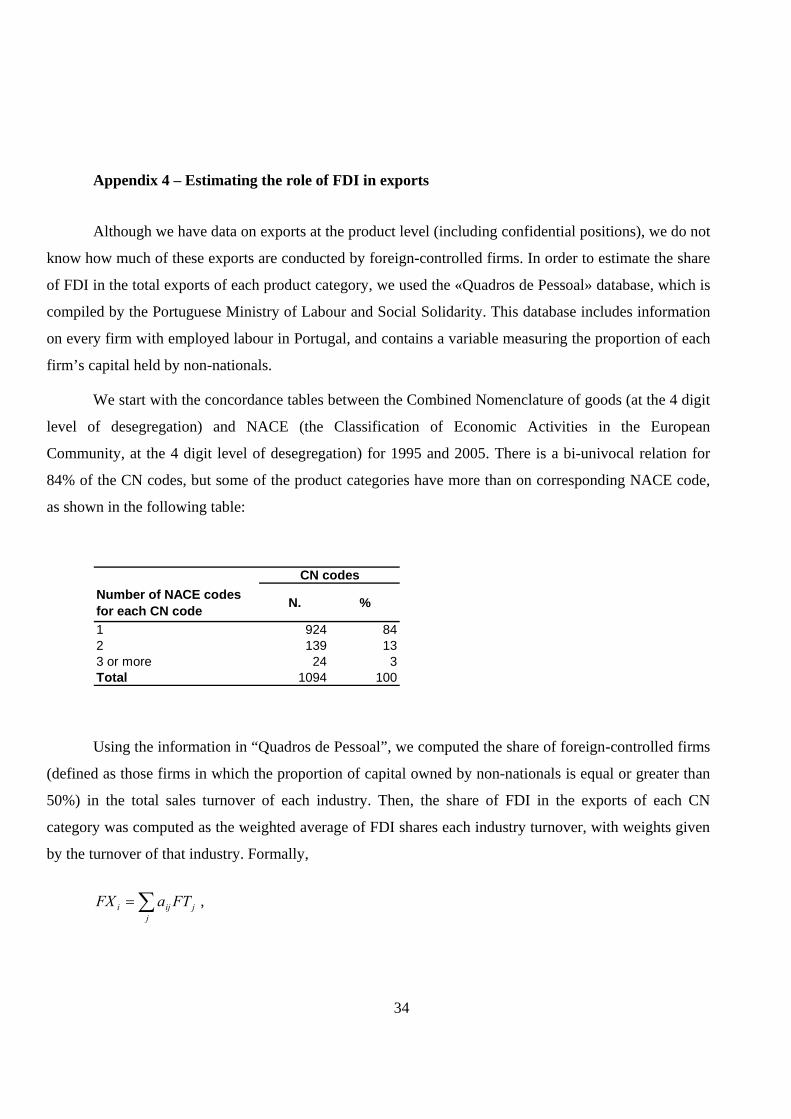
Appendix 4 – Estimating the role of FDI in exports
Although we have data on exports at the product level (including confidential positions), we do not
know how much of these exports are conducted by foreign-controlled firms. In order to estimate the share
of FDI in the total exports of each product category, we used the «Quadros de Pessoal» database, which is
compiled by the Portuguese Ministry of Labour and Social Solidarity. This database includes information
on every firm with employed labour in Portugal, and contains a variable measuring the proportion of each
firm’s capital held by non-nationals.
We start with the concordance tables between the Combined Nomenclature of goods (at the 4 digit
level of desegregation) and NACE (the Classification of Economic Activities in the European
Community, at the 4 digit level of desegregation) for 1995 and 2005. There is a bi-univocal relation for
84% of the CN codes, but some of the product categories have more than on corresponding NACE code,
as shown in the following table:
Number of NACE codes for each CN code N. %
1 924 842 139 133 or more 24 3Total 1094 100
CN codes
Using the information in “Quadros de Pessoal”, we computed the share of foreign-controlled firms
(defined as those firms in which the proportion of capital owned by non-nationals is equal or greater than
50%) in the total sales turnover of each industry. Then, the share of FDI in the exports of each CN
category was computed as the weighted average of FDI shares each industry turnover, with weights given
by the turnover of that industry. Formally,
∑=j
jiji FTaFX ,

35
where FXi is the share of FDI in the exports of product i; FTj is the proportion of foreign-affiliated firms’
turnover in the total turnover of industry j; and αij is the weight of industry j in the total turnover of
industries associated with the product i (according the concordance tables), i.e.,
∑=j
ijijij TTa ,
where otherwise. 0
iproduct with associated is j if jindustry of turnover
⎩⎨⎧
=ijT