Embed Size (px)
Citation preview

Deep-Sea Research, Vol 38. Suppl 2. pp S72>-S745. 1991.Pnnted 10 Great Bntam
019~149191 53.00 + 0.00© 1991Pergamon Press pic
Mixing between oxic and anoxic waters of the Black Sea astraced by Chernobyl cesium isotopes
KEN O. BUESSELER,* HUGH D. LIVINGSTON* and SUSAN A. CASSO*
(Received 14 August 1989; in revised form 16 November 1990; accepted 28 November 1990)
Abstract- The Chernobyl nuclear power station accident in 1986 released readily measureablequantities of fallout 134CS and 137Cs to Black Sea surface waters. This pulse-like input of tracers canbe used to follow the physical mixing of the surface oxic waters, now labeled with the Chemobyltracers, and the deeper anoxic waters, which were initially Chemobyl free. By 1988, there is clearevidence of Chernobyl Cs penetration below the oxic/anoxic interface at deep water stations in thewestern and eastern basins of the Black Sea. This rapid penetration of surface waters across thepycnocline cannot be explained by vertical mixing processes alone. Data from profiles at the mouthof the Bosporus suggest that significant ventilation of intermediate depths can occur as theoutflowmg Black Sea waters are entrained with the inflowing Mediterranean waters, forming asub-surface water mass which is recognized by its surface water characteristics, i.e. initially arelatively high oxygen content and Chernobyl Cs signal. The lateral propagation ofthis signal alongisopycnals into the basin interior would provide a rapid and effective mechanism for ventilatingintermediate depths of the Black Sea. This process could also account for the lateral injection ofresuspended margin sediments into the basin interior. The temperature and salinity data suggestthat the entrainment process occurs at depths of 50-80 rn, mixing waters from the ColdIntermediate Layer with the incoming, denser Mediterranean waters.
INTRODUCTION
THE deep waters of the Black Sea currently form the largest reservoir of permanentlyanoxic waters in the oceans. This feature is primarily a result of restricted mixing betweenthe surface and deep waters. Vertical mixing is limited due to a strong density gradientwhich exists between the upper less saline waters (= 180/00) and the saltier deep waters(=22%0). The pycnocline which separates these two layers is generally dome-shaped,being found at greater depths near the margins (150-200 m) than in the center of theeastern and western basins (80-120 m; MURRAY et al., 1991). The salinity gradient ismaintained through a balance between continued fluvial and fresh water inputs, evaporative losses, and the restricted outflow of surface waters from the basin and the inflow of highdensity Mediterranean waters into the basin through the narrow and shallow BosporusStraits (GUNNERSON and OZTURGUT, 1974; LATIF et al., 1991).
The boundary that exists between the surface oxic waters and the deep anoxic waters is asite of considerable scientific interest, since it is here that the sharpest chemical, biologicaland physical gradients exist. One of the most basic questions which can be asked is to what
*Woods Hole Oceanographic Institution, Woods Hole, MA 02543, U.S.A.
S725

S726 K. O. BUESSELER et al.
extent and under what conditions does mixing occur between the oxic and anoxic layers.On a geological time-scale we know from sediment cores that anoxic conditions were likelyestablished in the Black Sea some 5000-7000 years ago (Ross et al., 1970; DEUSER, 1972;DEGENS et al., 1978; CALVERT et al., 1987). On shorter time-scales there is considerabledebate about changes in the last few decades in the depth and properties at the oxic/anoxicinterface (TOLMAZIN, 1985; FASHCHUK and AYZATULLIN, 1986; BRYANTSEV et al., 1988;MURRAY et al., 1989; MURRAY and IZOAR, 1989).
In this manuscript, we present data on the depth distribution of the Cs isotopes, 134Cs(t1l2 = 2.07 y) and l37Cs (t1l2 = 30.17 y) in the Black Sea. These radioactive tracers havebeen introduced to this basin primarily from fallout due to the Chernobyl nuclear powerstation accident which started on 26 April 1986, as well as from fallout due to atmosphericnuclear weapons testing programs which occurred predominantly in the 1950s and 1960s.The samples were collected as part of a larger geochemical study wherein the Cs isotopicdata are used to separate physical mixing from scavenging and removal processes of themore particle-reactive Chernobyl tracers, such as 144Ce and lO6Ru. The sampling scheme istherefore focused around the oxic/anoxic interface and was limited by the ship timeavailable on short notice after the accident. While the Cs data were not collected as part ofa detailed physical oceanographic study of the Black Sea, the features in this data set aloneallow us to make some basic and important conclusions regarding the mixing of surfaceBlack Sea waters to depth on annual time-scales, which are presented here.
BACKGROUND
Cesium isotopes have been used in a variety of oceanographic studies as tracers ofphysical mixing. The studies began after atmospheric nuclear weapons testing programsdelivered approximately 1.3 x 10¹⁸ Bq of l37Cs worldwide (JOSEPH et al., 1971). Thedelivery of Cs isotopes from weapons testing sources ~eaked in the early 1960s. In general,oceanic residence times for Cs are long, and fallout 13 Cs has been used along with 90Sr andtritium as a tracer of physical mixing processes (VOLCHOK et al., 1971; BOWEN andROETHER, 1973; BOWEN et al., 1980; COCHRAN et al., 1987). In addition to the falloutsources, localized releases of Cs isotopes from the Sellafield nuclear fuel reprocessingplant in the U.K. have been used to follow the mixing of waters from the Irish Sea into theNorwegian/Greenland Seas and the Arctic basin (LMNGSTON et al., 1982a,b, 1985).
With the Chernobyl accident in April 1986, a new pulse of fallout Cs was added to theenvironment. The bulk of the Chernobyl Cs fallout appears to have originated during thereactor fire due to volatilization of Cs. A second possible release pathway would have beendirect fallout deposition of particulate reactor material originating from the explosionwhich occurred at the onset of the accident. Infrequent hot particles (20-100 ,urn) havebeen found which are thought to originate from this latter source (VAN DER VEEN et al.,1986), but data are scarce and particle deposition would be highly localized. The behaviorof Cs in the Black Sea carried by intact hot particles may be different than the bulk Csfallout; for instance, the hot particles may not release soluble Cs but rather sink unalteredto the sea floor. This study focuses on soluble Cs in the water column and as such isconcerned with the bulk fallout and the evolution of Cs water column distributions.
The total quantity of l37Cs released from Chernobyl is an order of magnitude smallerthan that from weapons testing sources (1 x 10¹⁷ Bq; GOLDMAN, 1987). The radioactivefallout from this accident is a significant source of activity to the environment due to the
Oxic and anoxic water mixing in the Black Sea S727
high fallout activities in localized tropospheric fallout deposition observed during therelatively short duration of the releases (10 days from Chemobyl vs more than 15 yearsfrom weapons testing). In our studies the 134CS isotope provides a highly specific tracer ofthe Chemobyl fallout for two main reasons. First , there is essentially no 134CS in theenvironment from the 1960s weapons testing inputs due to its low production ratio inweapons sources and its relatively short half-life (0.02% remains after 25 years). Secondly,the 134Csl137Cs ratio of the Chemobyl releases remained fairly constant during theaccident, such that a pure Chernobyl fallout signal will have an easily identifiable134Csl137Cs activity ratio-approximately 0.5 at the time of input in 1986 (DEVELL et al.,1986; AARKROG, 1988; MITCHELL and STEELE, 1988; and following discussion) . Also , giventhat Cs is efficiently removed in fresh-water systems, the pulse of Chemobyl atmosphericfallout that reached the Black Sea between -1-5 May 1986 (ALEXANDRAPOULOS et al.,1986; WIRTH et al., 1987; MISAELIDES et al., 1987), would be the only significant source ofthis tracer to Black Sea surface waters, i.e. runoff and riverine Cs inputs are negligible(POLIKARPOV et al., 1991).
In this manuscript all Cs tracer activity data will be decay corrected to an input date of1 May 1986, such that waters labeled with Cs isotopes of a predominantly Chernobyl originwould have a high 134Csl137Cs activity ratio (approaching one-half) and those waterslabeled by earlier weapons testing sources would have a 134Csl137Cs ratio of zero. Waterswhich had remained isolated from surface fallout inputs since the early 1950s would showneither tracer. The 134Csl137Cs ratio will always refer to an activity ratio (in contrast to amass or atom abundance ratio) and the units of activity will be Bq (= Becquerel, ordisintegrations per second).
SAMPLING AND ANALYSES
The samples for the Cs isotopic profiles discussed here were collected on three cruises.The first and second cruises were conducted aboard the R.V. K. Piri Reis of the DokuzEyliil Universitesi in Izmir, Turkey during 19-23 September 1986 and 11-13 May 1987.The third cruise occurred during 21 June-8 July 1988 as part of cruise 4 of the R.V. KnorrBlack Sea Expedition.
Cesium samples were collected in one of two ways. The first method involved a largevolume pumping system, whereby 200-1500 I of sea water were passed first through aprefilter cartridge (0.5-,um polypropylene CUNO Microwynd) and then sequentiallythrough two CuFe(CN)6 adsorber cartridges for the collection of dissolved Cs . Oncecollected, these Cs adsorbers are ashed and gamma-counted at Woods Hole for 1-3 dayson a Ge(Li) detector. 134CS and 137Cs are measured directly by their corresponding gammapeaks at 796 keV and 662 keV, respectively (the 134CS peak is corrected for backgroundcontribution from 228Ac at 795 keV by the measurement of 228Ac at 911 keV). The secondCs adsorber in-line is used to calculate the absolute collection efficiency of the Csadsorbers, using the equation: collection eff. = 1 - BIA , where A and B are the Csactivities on the first and second adsorbers, respectively (MANN and CASSO, 1984;LIVINGSTON and COCHRAN, 1987). Absolute activities are obtained by comparison tostandards of known activity and similar geometry. This technique is described in detail inBUESSELER et al. (1990a). This procedure has been calibrated against existing betacounting techniques and in international calibration exercises conducted by the IAEA(BALLESTRA et al. , 1989). In 1986 and 1987 this chemisorption procedure was carried out
S728 K. O. BUESSELER et al.
only in surface waters using a deck mounted pumping system. On the R.V. Knorr cruise in1988, seven insitubattery powered pumps with Cs adsorbers were used, which when hungon the trawlwire allowed for the collection of samples from multiple depths on a single cast(flow rates averaged 51 min - 1over 4-h pumping intervals).
The second technique for obtaining the Cs isotopic distributions is based uponradiochemical procedures developed during the 1960s (YAMAGATA, 1965; WONG et al.,1970), and uses discrete 10-20-1 water samples collected from wire mounted samplingbottles (10- or 30-1 Niskins in 1986and 1987).The unfiltered Niskin samples are transferredinto clean sample containers and processed by radiochemical techniques to separate andpurify the Cs isotopes. The samples are mounted on a filter as Cs chloroplatinateprecipitates and counted by radiometric techniques (details can be found in BUESSELER etal., 1990a). Given the relatively high activities of the Chernobyl-Iabeled samples, therurified Cs samples mounted in this manner can be counted on a gamma detector for the34CS and 137Cs isotopes similar to that described above for the ashed adsorbers, but with a
higher gamma detection efficiency due to geometry considerations. A more sensitivedetermination of total Cs activity is obtained by beta counting the precipitate. With betacounting the 134CS/137Cs ratio cannot be determined as the beta signals from the two Csisotopes are not resolved . We used beta counting primarily on those samples from the deepwaters which were free of Chernobyl P''Cs . Typically, the highest precision was obtainedusing the Cs adsorber cartridges due to the much larger sample size, and hence larger totalsample signal.
In addition to the Cs isotopic analyses, comparisons will be made to salinities,temperatures and densities as well as to the basic chemical parameters, oxygen and sulfide.In these measurements considerable differences exist between the cruises , due to thenature of the sampling programs and the capabilities of the Turkish and U.S. researchvessels. In 1986and 1987, salinities were obtained from the same Niskin bottles which wereused to collect the Cs samples . In this case , 125-ml salinity bottles were filled, sealed andtransported to WHOI for subsequent salinity analysis using an autosalinometer facility atWoods Hole. On the same cruises , our Turkish colleagues from Izmir deployed a separateCTD package either before or after the Niskin casts at three of the four stations (within afew hours of the Niskin cast). The oxygen and sulfide data in 1986and 1987were obtainedby standard titrimetric techniques and via an oxygen probe on the Turkish CTD package.The data are somewhat limited and are only used to define the relative depths of theoxygen and sulfide boundaries.
The 1988 hydrographic data which are used here are described in this volume (MURRAYet al., 1991). As in the earlier years, the CfD data were collected on a separate cast fromthe Cs casts. The 1988 oxygen and sulfide determinations were made using the deckmounted pumping system and techniques described by CODISPOTI et al. (1991) .
Itshould be noted that the hydrographic and Cs data were collected on casts separated intime by up to 2-3 h at a given station. This may be especially important near the mouth ofthe Bosporus (Sta . 24; Fig. 1), where spatial and temporal variability in physical processescan make comparisons between replicate casts quite difficult . Fortunately, the features tobe examined here across the pycnocline are so strong in this basin that errors introduced incomparing separate CTD and Niskin casts are not of major significance in the interpretation of our data set.
Particulate 23~h, Mn and Fe data also will be shown from one station in 1988 where astrong minimum in light transmission was found during the CTD cast. In this case, the

Oxic and anoxic water mixing in the Black Sea
Fig.!. Station location map. Locations sampled for surface water 134Cs/137Cs ratios in 1986areshown by open squares. The 1987and 1988sampling sites are shown by open circles and triangles,respectively. Stations 24, 10, 9 and 19 were the primary locations sampled for the vertical
distributions of the Chernobyl radionuclides.
S729
particulate 231'h data were obtained by direct gamma counting of the ashed prefilters fromthe large volume samples. Particulate Mn and Fe samples came from a 1% by weight splitof the same ashed prefilter samples and were analysed using an Inductively CoupledPlasma-Atomic Emission Spectrometer at Woods Hole.
RESULTS
Surfacewaters
Surface water data were used to calculate the pure Chernobyl end-member 134CS/137Csratio (which was reported to be around one-half) and the pre-Chernobyllevel of surfacewater 137CS from weapons testing. The coverage of stations used in this analysis is shownin Fig. 1, and the total surface water 137CS activity is plotted vs the measured 134Cs/137Cs
ratio in Fig. 2. As discussed in the previous section, there are only two significant sourcesof fallout Cs in the Black Sea: wea~ons testing fallout (137Cs
w t ) and Chernobyl fallout(137CS
Ch)' Furthermore, the 134Cs/1 7CS ratio in weapons testing fallout today is zero,and in Chernobyl fallout (decay corrected to 1 May 1986) some constant value (134CS/137CSCh = Rch) · Therefore, the measured Cs isotopic ratio e34Cs/137Cs of sample = Rtot ) isrelated to these quantities by the equation:
Rtot =RCh (137CSCh/137CStot). (1)

S730 K. O. BUEssELER et al.
Substituting [1 - (137CSwt, 137Cstot)] in equation (1) for the percentage of Chernobyl P?Cs
in the total , and rearranging we have :
Rtot =RCh - [(RCh * l37CSwt)/137CStol]' (2)
A best fit through the data in Fig. 2 (137 CStot vs Rtot) will therefore provide an estimate ofthe two constants in this equation , RCh and l37Cswt, since we assume that the 137CSwt signalwas constant in southern Black Sea surface waters prior to the Chernobyl accident. We fitthe data (using a statistical package in the software program "RS1 " from BBN SoftwareProd. Corp.) in this manner from 28 surface water samples collected during 1986 (Fig . 2)and found RCh' i.e . the end-member 134Cs/l37Cs ratio in Chernobyl fallout, to be 0.53 ±0.01. This agrees very well with other measurements of this ratio in fallout samples directlyafter the accident (DEVELL et al., 1986; AARKROG, 1988). The pre-existing surface waterl37Cs activity (137Cs
wt) was found to be 9 ± 1 Bq m- 3• This also agrees well with earlier
estimates of the Black Sea surface water l37Cs signal prior to the Chernobyl accident(10-12 Bq m-3 corrected to May 1986; VAKULOVSKIY et al., 1982). Note that the total 137CSsignal post-Chernobyl can be as high as 360 Bq m- 3, and samples above 100 Bq m- 3 have134Cs/l37Cs ratios very close to the 0.53 end-member (Fig . 2).
Vertical distributions
Vertical profiles of Cs isotopes were obtained in 1986 and 1987 at two stations: Sta . 24 atthe mouth of the Bosporus north of the shelf break at a water depth of TOughly 500 m, andSta . 10, at a depth of 2100 m in the interior of the SW Black Sea (Fig. 1). Station 10 wasresampled in 1988 (==BS4 Sta. 7) along with two other deep water stations (BS4 Stas 9 and19; Fig. 1). Station 24 was not resampled for Cs isotopes in 1988.
0 00.5
IIIU
0.4r-~....';no 0.3U~ty) 0.2....
0.1
00 100 200 300 400
137Cs (BqJm3)
Fig. 2. TOlal 137Cs vs 134Cs/137CS ratios in surface waters of the Black Sea in 1986. The one sigmaerrors on the 134Cs/137Cs rat io are shown if larger than the symbol. All 137Cs activity errors aresmaller than the symbol size. The solid line represents a model fit to a two end-member fallout Cs
source model as described in the text.

Oxic and anoxic water mixing in the Black Sea S731
The vertical F'Cs distributions and 134CS/l37Cs ratios from these cruises are shown inFig. 3a-f, and the data are provided in Table 1. The Cs data are compared to the ancillaryhydrographic, oxygen and sulfide data in the same figures and tables.
In 1986, at the interior Sta. 10, Chernobyl Cs, as defined by the presence of 134CS, hadnot penetrated below the upper 50 m (Fig. 3a). The depth resolution and sensitivity in theratio data (detection limit =0.05) is not sufficient to estimate the exact depth of Chernobyltracer penetration. The total l37Cs activities of 10-11 Bq m-3 in the 134CS free watersbetween 70 and 100 m support our earlier estimate of a pre-Chernobyl weapons testing137CS activity in surface waters of 9 ± 1 Bq m-3.
In the upper 50 m at the margin Sta. 24, the picture looks very similar, with a strongChernobyl signal in the upper 20 m, a hint of 134Cs at 50 m, and no evidence of Chernobyl134CS by the 80 m sample (Fig. 3b). The CTD temperature data suggest that the depth ofthe summer thermocline was 35 m at this site. A somewhat different feature is seen in thedata below 100m at this margin site, however. The 150 m sample had a 134CS/l37Cs ratio of0.13 ± 0.08. The large associated error is due to the small sample size and relatively lowtotal activity observed. The water samples directly above and below this depth did notshow any evidence of Chernobyl P'Cs (134Cs/137CS < 0.05). The CTD data also showed asub-surface oxygen peak at a depth of 110m (Fig. 3b). Since the CTD data were taken on aseparate cast from the Cs cast, the significance in the difference in absolute depth of thisfeature (40 m) cannot be evaluated at this time. With a strongly varying hydrographicstructure in this region with space and time, the depth of specific features seen on replicatecasts may be quite different. The main point is that in both the 134CS/137Cs data and theoxygen profile at this margin station in 1986, there is an indication of sub-surface injectionof waters with surface water characteristics at intermediate depths.
By May of 1987, 134Cs/ l37Cs ratios indicate deeper penetration of the Chernobyllabeledwaters. At Sta. 10, 134Cs/l37CS ratios of close to the 0.53 end-member are found down to65 m (Fig. 3c). By the next sample at 80 m, 134Cs/137Cs ratios are again below detection.These data suggest that winter mixing alone between 1986 and 1987 was insufficient tocause the penetration of surface waters across oxygen zero (here at somewhere between 80and 90 m). Total surface water l37Cs levels also have decreased between 1986 and 1987(note the scale change in l37Cs between Fig. 3a,b and 3c-f) due to continued mixing of theChernobyl-Iabeled waters to depth.
In 1987 at the margin site, the surface waters show deeper 134CS/l37Cs penetration,similar to Sta. 10 (down to at least 50 m; Fig. 3d). As in the previous fall, we also see asubsurface 134CS peak at 150 m, this time with a 134CS/ 137CS ratio ofOA1 ± 0.08. The totall37Cs activity profile at this depth also shows a significant increase in activity compared tosamples just above and below this 150 m feature. The Sta. 24 CTD data in 1987 show asecondary oxygen maximum (at 135-145 m), consistent with the sub-surface 134Cs peak.and accompanied by slightly cooler temperatures.
The 1988Cs data are more precise, due to the larger sample size obtained by our in situpumps. A surprising feature in the 1988 data was the penetration of 134CS down to depthsof at least 150m, much deeper than in previous years (Fig. 3e,f). The 134CS/l37Cs profilesand activity data in the upper 150m at the two stations in the western basin are very similar.The sample spacing below 150m does not allow us to accurately estimate the depth of zero134CS. By400 mat Sta. 9 and 600 m at Sta. 10 the 134CS/ l37CS ratio was below detection.The supporting data suggest that oxygen had reached zero by 80 m at Sta. 10 and 90 matSta. 9, with the onset of sulfide occurring about 15-20 m below oxygen zero. At Sta. 19,

5732 K. O. B UESSELER et al.
a 137c. (5 'l!m 3)
110 180 Z40 3Z0
Salinity (ppt)
17 18 19 ZO 21 Z2 23
!~ 100...uo
1110
Sta 10- Sept. '118
200 +---t--_--+---+--+
,, ,,,,
\;e ..;, .
"-'\,
s
Sa linity (ppl)
17 16 19 ZO 2 1 22 23,,
_ ..0'
---
137C• (B'l!m3)
L80 Z40 32080
b
., '",
i? - - e·-110I
I ,a ~ <,-; 100 ~
\l ? " \I,
150 ~ ~.-.T
~St. 24- Sept 'ee S
ZOO0 4 8 I Z 18 ZO Z4 211Tem p (oC) or OxYa. n x2 (m a/l)
c0
0
80
! r~ 100 ?Do P•
~Q
1110 ~II,
ZOO
131C• (Bo/ID3)
20 40 eo eo,
,.A'
St. 10- lla, '87
134 CS/ 137 C.reo 0.1 0.. 0 .0 re
II
•\.'t-_.......
Salinity (ppl)
17 18 19 ZO 2 1 22 23
s
o 4 8 12 18 20 24 28Tamp. (OC) or Oxnen x2 (mill)
Fig. 3. Composite figure showing all Cs and ancillary data at Stas 24, 10 and 9. In a-f, the leftpanel represents total 137Cs activity vs depth, the middle panel 134Cs/137Cs ratio vs depth, and theright panel ancillary hydrographic and oxygen data when available. The data are provided in TableI, and the errors are plott ed if larger than the symbol size. The 1986 data are shown for Sta . 10 (a)and 24 (b) , the 1987data for Sta. 10 (c) and 24 (d), and the 1988 data for Stas 10 (e) and 9 (f); seeFig. I for slation locations. The salinity data in all years are from bottl e casts, potenti al temperaturedata are from the CTD , and oxygen profiles in 1986 and 1987 are from an oxygen probe on theTurkish CTD package. Note that the oxygen zero is offset , due to calibration problems with the
probe.

Oxic and anoxic water mixing in the Black Sea S733
d 13 7Ct (DVm 3) 134Cs/ 137C. Salinity (ppt)
0 20 40 60 80 100 01 O.S 0& III 17 16 19 20 21 22 230 I ,
I,
,6 ,e·I
60 ..0,
Je·
:! p' r~ 100 ~e,
".. ~Q ,, ,
',:.~160 ,0 ,, , ,, SI. 24- "., ' 87 ,T 5, ,, ,
ZOO20 24 280 4 8 12 III
Tamp. (OC) or O"1&an x2 (mall)
4 6 12 16 20 24 26Tamp (OC)
K.,"'.\ \
T S
e 137Ca (Dqjm3) 134Cs/137Cs
0 20 40 eo 80 100 0 .1 O.S 0.& 160
7',•~,.oI
60 ..0' I·,0' •! 0 •
f ••~ 100 •Q, •.. IQ I I,
I160 ~ •I
51. 10- luna ' llllIII
2000
22 23
SAlinity (ppt)
16 19 20 21
51. 9- Juna '66
. 0 '
,0
137Ct (Dqjm 3)
20 40 60 80
P
60
l~r
I
160 ~I
II
f
!~ 100Q,..
Q
200 +'--+---t---+---+---+o 4 6 12 16 20 24 26
Tamp (OC)
Fig. 3. Continued .
near the edge of the eastern basin , 134Cs is clearly evident down to 185 m (Table 1). Thesample spacing at Sta. 19was not as dense as at the other two 1988 sites , and the data arenot plotted in Fig. 3. Slightly higher 134CSactivities were found vs depth, but if plott ed vsdensity, Sta , 19 is very similar to Sta. 7.
5734 K. 0. BUESSELER et 01.
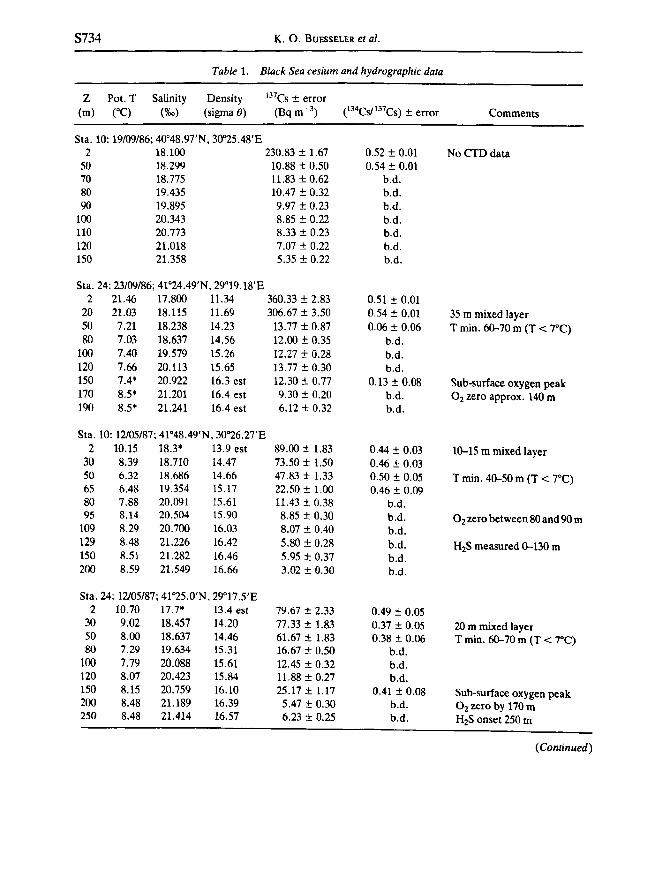
Table 1. Black Sea cesium and hydrographic data
Z Pot. T(m) ("C)
Salinity(%0)
Density(sigma 0)
137Cs ± error(Bq m') Comments
Sta. 10: 19/09/86;4Oo48.97'N. 30"25.48'E2 18.100 230.83 ± 1.67
50 18.299 10.88 ± 0.5070 18.775 11.83 ± 0.6280 19.435 10.47 ± 0.3290 19.895 9.97 ± 0.23
100 20.343 8.85 ± 0.22110 20.773 8.33 ± 0.23120 21.018 7.07 ± 0.22150 21.358 5.35 ± 0.22
Sta. 24: 23/09/86; 41OZ4.49'N, 29°19.18'E2 21.46 17.800 11.34 360.33 ± 2.83
20 21.03 18.115 11.69 306.67 ± 3.5050 7.21 18.238 14.23 13.77 ± 0.8780 7.03 18.637 14.56 12.00 ± 0.35
100 7.40 19.579 15.26 12.27 ± 0.28120 7.66 20.113 15.65 13.77 ± 0.30150 7.4* 20.922 16.3 est 12.30 ± 0.77170 8.5* 21.201 16.4 est 9.30 ± 0.20190 8.5* 21.241 16.4 est 6.12 ± 0.32
0.52 ± 0.010.54 ± 0.01
b.d.b.d .b.d .b.d.b.d,b.d .b.d .
0.51 ± 0.010.54 ± 0.010.06 ± 0.06
b.d.b .d.b .d,
0.13 ± 0.08b.d.b.d.
No ern data
35 m mixed layerT min. 60-70 m (T < 7°C)
Sub-surface oxygen peakO2 zero approx. 140 m
Sta . 10: 12105/87; 41°48.49'N . 30"26.27'E2 10.15 18.3* 13.9 est
30 8.39 18.710 14.4750 6.32 18.686 14.6665 6.48 19.354 15.1780 7.88 20.091 15.6195 8.14 20.504 15.90
109 8.29 20.700 16.03129 8.48 21.226 16.42150 8.51 21.282 16.46200 8.59 21.549 16.66
Sta . 24: 12105/87; 41OZ5 .0'N . 29"17.5'E2 10.70 17.7* 13.4 est
30 9.02 18.457 14.2050 8.00 18.637 14.4680 7.29 19.634 15.31
100 7.79 20.088 15.61120 8.07 20.423 15.84ISO 8.15 20.759 16.10200 8.48 21.189 16.39250 8.48 21.414 16.57
89.00 ± 1.8373.50 ± 1.5047.83 ± 1.3322.50 ± 1.0011.43 ± 0.388.85 ± 0.308.07 ± 0.405.80 ± 0.285.95 ± 0.373.02 ± 0.30
79.67 ± 2.3377.33 ± 1.8361.67 ± 1.8316.67 ± 0.5012.45 ± 0.3211.88 ± 0.2725.17 ± 1.17
5.47 ± 0.306.23 ± 0.25
0.44 ± 0.030.46 ± 0.Q30.50 ± 0.050.46 ± 0.09
b.d.b .d.b .d .b.d.b.d .b.d,
0.49 ± 0.050.37 ± 0.050.38 ± 0.06
b.d.b.d.b.d .
0.41 ± 0.08b.d .b.d.
10-15 m mixed layer
T min. 40-50 m (T < 7°C)
O2 zero between 80and 90 m
H2S measured 0-130 m
20 m mixed layerT min. 60-70 m (T < rC)
Sub-surface oxygen peakO2 zero by 170 mH2S onset 250 m
(Continued)

Oxic and anoxic water mixing in the Black Sea
Table 1. Continued
5735
Z Pot. T(m) ("C)
Salinity(%0)
Density(sigma 8)
137CS ± error(Bq m-3) Comments
Sta. 10 (=BS47): 24/06188; 41°SO.5'N,30"21.04'E5 20.191 18.348 12.065 77.94 ± 0.86
30 9.495 18.494 14.165 68.06 ± 0.5550 6.991 18.944 14.801 41.26 ± 0.4062 7.782 19.891 15.460 20.46 ± 0.3572 8.138 20.318 15.754 13.15 ± 0.2282 8.304 20.587 15.945 8.73 ± 0.2092 8.429 20.778 16.078 11.94 ± 0.27
102 8.451 20.914 16.182 9.05 ± 0.28112 8.519 21.034 16.268 9.88 ± 0.18150 8.673 21.338 16.486 3.57 ± 0.32400 8.846 21.982 16.966 0.15 ± 0.07
Sta 9: 26106188; 42°09.62'N. W18.0'E5 20.941 18.294 11.842
30 7.820 18.485 14.35650 6.989 19.046 14.88265 7.846 19.951 15.50075 8.120 20.294 15.73785 8.301 20.558 15.92295 8.419 20.769 16.073
105 8.514 20.942 16.196120 8.606 21.146 16.344150 8.674 21.334 16.483600 8.845 22.148 17.096
Sta. 19: 01107/88; 41°30.28'N, 4Qo44.47'E3 22.866 17.516 10.766
30 7.922 18.187 14.11280 6.833 18.464 14.440
110 7.094 19.068 14.888135 7.850 20.047 15.575185 8.519 21.005 16.245
73.08 ± 0.6667.03 ± 0.6043.99 ± 0.3118.77 ± 3.9213.55 ± 0.3510.42 ± 0.289.29 ± 0.25
12.02 ± 0.195.66 ± 0.222.46 ± 0.12
b.d.
63.48 ± 0.5777.31 ± 0.4663.44 ± 0.5742.47 ± 0.4723.69 ± 0.959.16 ± 0.23
0.431 ± 0.005 7 m mixed layer0.424 ± 0.0050.361 ± 0.005 T min. 44-51 m (T < rC)0.224 ± 0.0080.162 ± 0.0070.144 ± 0.011 O2 zero 80 m0.163 ± 0.0120.147 ± 0.013 H2S onset 100 m0.163 ± 0.0090.112 ± 0.019
b.d.
0.427 ± 0.006 9 m mixed layer0.414 ± 0.0040.395 ± 0.004 T min. 35-50 m (T < 7"C)0.250 ± 0.0060.170 ± 0.0090.143 ± 0.012 O2 zero 90 m0.113 ± 0.0100.109 ± 0.0070.114 ± 0.017 H2S onset 110 m0.078 ± 0.018
b.d.
0.438 ± 0.006 5 m mixed layer0.428 ± 0.0040.432 ± 0.005 T min. 55-105 m (T < 7°C)0.416 ± 0.0060.311 ± 0.006 O2 zero 175 m0.141 ± 0.009 H2S onset 109 m
All activity data decay corrected to 1 May 1986.Error on 137Cs activity reported as 2 sigma calculated from counting statistics and sample collecting efficiency;
error on 134Cst137Cs ratio reported as 1 sigma counting uncertainty.b.d, = below detection.·est = In many cases hydrographic data in 1986and 1987were not complete. Those data marked with an • were
estimated from other sources, and hence the calculated densities are listed as "est". or estimated values.Specific comments on each cruise are as follows:1986 Sta, 24 pot. temp. from> 150 m were estimated from 1987data at these depths.1987Sta. 10 surface water salinity is estimated from 1988 data.1987 Sta. 24 surface water salinity is estimated from 1988 data.1988 Sta. 10 hydrographic data from BS47 cast 3 (WHITE et al., 1989).1988 Sta, 9 hydrographic data from BS49 cast 1.1988 Sta. 19 hydrographic data from BS419 cast 1.

S736 K. O. BUESSELER et al.
DISCUSSION
We believe the data presented above provide direct evidence of two main processes.First, the depth of winter mixing at the interior Sta . 10 can be shown to be no deeper than50--65 m as evidenced by the changes in the upper water column Cs distributions between1986 and 1987. Secondly, and on which the remainder of this manuscript will focus, is theevidence for the rapid penetration of surface water to depths well below the pycnoclinebetween 1987 and 1988at all of the sites .
Between May 1987and July 1988, the data at the interiorSta. 10clearly show a change inthe depth of 134CS penetration by about 85 m (from 65 m in 1987 to 150 m in 1988). Wepropose that this vertical propagation of the Chernobyl Cs signal is driven by physicaltransport processes and not particle removal processes for the following reasons. First , thetotal percentage of the Cs isotopes found on particles in the Black Sea has been shown tobe quite small «0.2% of total retained on 0.5-,um filter; LIVINGSTON et al ., 1988). Also, asediment trap moored at this same Sta. 10, showed that less than 0.1% of the 137Csinventory in the upper water column was removed by large-particle scavenging processeswithin the first year since the tracers were introduced (BUESSELER et al., 1990b).Furthermore , in this same study it was found that there was no evidence of the release ofCsisotopes back into the water column from sinking material which carries the 137Cs signal.So while a small percentage of Cs may be removed to sediments (particularly at oceanmargins), the behavior of fallout Cs is dominated by advection and diffusion over timescales of years to decades.
The observed penetration of Chernobyl Cs into the deep anoxic waters would appear tofollow a physical process which rapidly transports and mixes surface waters to intermediate depths on an annual time-scale. Strictly vertical advective processes seem unlikely dueto the strong vertical gradient in density which must be overcome. The density gradientbetween 65 and 150 m is close to one sigma theta unit (15.5-16 .5 sigma e, Table 1) andquite stable over this time-scale. The absolute magnitude of this subsurface mixing eventcan be calculated (eauation 1) from the measured 134Cs/137Cs ratios at depth in 1988, ourend-member 134Cs/1 7CS ratios of 0.53 for pure Chernobyl-Iabeled waters in 1986, and 0for pre-Chemobyl waters. With these end-members, the percentage of total 137Csoriginating from Chernobyl and found at depth at Stas 10and 9 in 1988is 28-38% between65-85 m (134CS/ 137Cs ratios of 0.15-0.20) and 15-27% for the waters between 85 and 150 me34Cs/ 137Cs ratios of 0.08-0.14").
The flushing of these intermediate depths with surface waters would have majorimplications for other non-conservative water properties as well, such as oxygen andsulfide. The 20-30 m gap found in 1988 between oxygen zero and the sulfide interface atthese sites would be consistent with a recent flushing event (MURRAY et al., 1989; CODISPOTIet al., 1991). Surface waters carrying the 134Cs signal to depth would also carry oxygen withthem, which would be consumed in the conversion of sulfide to sulfate. This type offlushing event has been used to account for the separation of the oxygen and sulfideinterfaces in similar studies of anoxic fjords (EMERSON et al ., 1982). Although detailedoxygen and sulfide profiles are not available for 1986 and 1987, the CTD oxygen data andsulfide analyses from the R.V. K . Piri Reis suggest a separation of 40 m in the oxygen andsulfide boundaries at Sta. 10 in 1987 and even greater separation at Sta . 24 (Table 1comments). This feature may be quite transient, and without more complete time-series

Oxic and anoxic water mixing in the Black Sea S737
(3)
data it will be difficult to establish if this process occurs throughout the year, and how longit takes for the interface to re-establish itself.
We propose that the physical mixing event traced by the Cs isotopes is one that occurspredominantly at the Bosporus region along the SW margin and is transported laterallyacross the entire Black Sea basin. The process which is envisioned is one whereby theoutflowing surface waters are entrained in a return flow by the inflowing Mediterraneanwaters, forming plumes of water with intermediate densities which are then laterallytransported into the basin along density gradients. The evidence for this process can beseen in the margin Sta . 24 data in 1986 and 1987, where a sub-surface signal of Chernobyllabeled waters is seen at intermediate depths. The densities of the samples at 150 m at Sta .24 which contain the Chernobyl signal in 1986 and 1987 are within the range of 16-16.5sigma theta (Table 1). If the feature followed isopycnal surfaces into the interior, thesewaters would correspond to depths between 80 and 150 m at Stas 9 and 10, precisely thedepths where in 1988 we find evidence of recent surface water injection. The measuredsub-surface currents in the range of tens of centimeters per second (BOGUSLAVSKIY et al.,1976; SOROKIN, 1983) would easily be sufficient to transport the margin-derived signal tothe interior stations within 1 year.
Given the measured properties of the waters at the margin Sta. 24 that show the subsurface Chernobyl signal , it should be possible to estimate the simple end-members of atwo-component mixing process which results in the observed sub-surface feature. Thistwo-component model must hold for the Cs isotopes as well as other conservativeproperties such as salinity and temperature. The equation for a two component conservative mixing process is simply:
pss = FoPo + (1 - Fo)Pj,
where P50 = the property measured in the sub-surface feature,Po = the property in the outflowing end-member waters,Pi = the property in the inflowing end-member waters,Fa = the fraction of outflowing waters in the sub-surface feature,
1 - Fa = the fraction of inflowing waters in the sub-surface feature.In Table 2, we have used this equation and a range of measured salinities to estimate themixing ratio between the inflowing and outflowing waters. The wide range of salin itiesbetween the two end-members and the observed salinity in the sub-surface Cs peak allowsus to tightly constrain the mixing ratio, Fa, which is 88.92% (Table 2). On a T-S plot (Fig .4), it becomes clear that in order to have the final salinities measured in the sub-surfaceoxygen and Cs peak, the outward flowing water which is entrained must be relatively cool.The only waters with the correct salinity and low temperature are those at depths of 40-80mat Sta. 24, at depths of the so-called Cold Intermediate Layer (CIL). While it is beyondthe scope of this work to postulate on the origin of the CIL, it would appear from thissimple calculation that entrainment occurs at the base of the outward-flowing Black Seawaters (at depths of the CIL) and the inward-flowing Mediterranean waters. This processwould be entirely consistent with the observed Bosporus sill depth of35 m. The 134Cs/lJ7CSdata in the sub-surface peak have a rather large associated error, and hence cannot be usedto tightly constrain the mixing ratio, Fa. It can be seen, though, that waters from depths inthe range of 50-60 m would have the necessary Cs isotopic signature, salt and temperatureneeded for this simple mixing model to hold.

S738 K. O . BUESSELER et al.
Table 2. Calculated mixing ratios and properties from two-component conservative mixingmodel
Salinity:
134CS/ 137CS:
Temperature :
Measured" Calculatedt
Po* P, Pss r;18.5-19. 2 ppt, 38.1-38.6 ppt. 20.76 ppt. 88--92%
From salinit y Measured " Calculatedt
r; P, P" Po88--92% 0 0041 ± 0.08 0.36 ± 0.5688--92% 14.7-14.lJOC 7.8--8.1°C 6.8--7.5°C
*Measured properties for Po and P" are from Sta . 24, 1987 (Ta ble 1). Sea of Marmaraproperties are used for P, [values from 3D-1oom, 1986 (unpublished Cs results and CTD dataR.V. K. Piri RelS) and 1988 (MURRAY et al.. 1991)J.
tCalculated from equation (3) in text.*Po , P, and P" are the property of ou tfiowing, inflowing and sub-surface wate rs, respect
ively. Fa is the fraction of outflowin g surface waters entrained in the sub-surface feature. Seeequation (3) in text for details.
The entrainment process we are proposing need not be continuous, nor is it likely to belimited to a single mixing ratio and density . It would appear that this is just one facet ofdeep-water renewal in the Black Sea . The major implications ofthis process are numerous.For instance, since rapid ventilation across the oxic/anoxic interface can occur on quiteshort time-scales, this will necessitate a lateral , rather than a one-dimensional verticalinterp retation of much of the biological and geochemical water column data. Therefore ,features in vertical profiles m 9Y be related to margin sources and sinks and not in situprocesses. Depending upon the relative reaction vs transport rates , with increasingdistance from the SW margin entrainment region , biological and chemical mechanismswould work on erasing, for example , the sub-surface oxygen peaks. Only the more
20
u- Pie, 15III...;:j..III...IIIl108 10 PIII BBE-< P
0
5t5 20 25 30 35 40
Salinity (ppt.)
Fig. 4. Temperature and salinity plot for Sta, 24 data in 1987. p. represents the inftowin gMediterran ean waters, P" the entrained waters at 150 m which show a sub-surface peak in
134Cs/ 137Cs, and Po the outftowing Black Sea waters. See text and Table 2 for details.

Oxic and anoxic water mixing in the Black Sea S739
conservative tracers of this mixing process, such as the Cs isotopes , would remainunaltered . Not only may waters move laterally quite rapidly , but suspended sediment fromthe margin may be transported into the interior by the same mechanism.
Assuming our hypothesis is correct and entrainment of surface waters occurs in theBosporus region, then one would expect the other R.V. Knorr data to show similarentrainment features . In an analysis of hydrographic data from R. V. Knorr cruise 4 in1988, OZSOY et al. (1991) examined the complete set of potential temperatures and salinitydata and found cold anomalies at Sta, 7 between 70 and 200 m consistent with the injectionof CIL oxic waters into anoxic intermediate depths. OZSOY et al. (1991) claim to havefound similar cold anomalies at intermediate depths at four stations near the SW margin.Using a recent data set from a large number of Turkish cruises in 1987-1989 along the SWmargin , OGUZ et al. (1991) also report evidence of similar hydrographic anomalies . Theseworkers spotted the entrained waters both by the observed temperature anomaly and byusing an oxygen probe mounted on the CTD. They found over 35 sites between theBosporus and 32°Ewhere relatively cold and/or oxygen-rich waters were found at depthsbetween 100 and 500 m. In general , since the entrained waters would tend to seek out theirown density level, searching for hydrographic evidence of sub-surface mixing is onlypossible near the source region.
As mentioned earlier, the evidence of CODISPOTI et al. (1991) showing an oxygen "nullzone" basin-wide during the R.V. Knorr cruises is consistent with our Cs data. Uponexamination of Codispoti's detailed oxygen, sulfide and nutrient profiles, these authorsalso find direct evidence of interleaving of waters in the observed wavy patterns ofammonium, phosphate, silicate and sulfide (CODISPOTI et al., 1991). Interestingly, they seesuch features predominantly along the SW margin and at the BSK2 site which lies in thecenter of the Black Sea between the eastern and western gyres. This BSK2 site wouldappear to be strongly influenced by margin-related mixing processes which are thenrapidly transported with the western gyre currents into this central basin site . Similar to thecold temperature anomalies , the nutrient and oxygen peaks are smoothed at the interiorstations.
When the three R .V . Knorr stations sampled for Cs isotopes are compared, Sta. 10stands out as having the strongest ancillary evidence (nutrients, CTD, etc.) in support ofrecent entrainment of surface waters to depth. When the 134CS/ 137CS ratios are examinedvs density , Sta. 10 also stands out from Sta. 9 as having slightly higher 134CS/ 137Cs ratios atequivalent densities. Interestingly, this site along the SW margin shows a strong suspendedparticulate maximum at depths of 95-125 m. These data are shown in Fig. 5 where lighttransmission and particulate Mn, Fe and 234Th are plotted. The decrease in lighttransmission below oxygen zero and at the depth of H 2S onset stands out at this and otherR .V. Knorr margin stations and is absent, or much diminished at the interior basinstations. The source of this feature could be related to in situ biological or chemicalprocesses which are perhaps tied to the onset of H 2S in the water column. Equallyplausible, and suggested here , is that this feature originates at the margins, and perhapsrepresents the resuspension of originally oxic margin sediments and subsequent lateralinjection of this material along isopycnals into the basin interior. This would be consistentwith the observed high particulate Mn and Fe content and elevated 234Thactivities. OZSOYand AYDIN (1991)provide evidence that suggests that abrupt changes in topography, suchas the canyons along the SW margin , can trigger vertical motions or internal waves whichlead to the resuspension of margin sediments.

S740 K. O. BUESSELER et al.
1000o
Black Sea Parliculales- 19BB statron 10\in (nM)
500
o Th
o loin
a Fe
o J,a 0\ l
50 a,,\].<: 100....Co.,
0
150
200 -1-o 25 50 75 70 80 90 100Fe (nU) Ughl Trans (~)
~I I I Io 5 10 15 20
234Th (Bqjm3)
Fig. 5. Particulate Mn, Fe and 234Th e34Th decay corrected to time of sampling) profiles and
percentage transmission vs depth for Sta. 10 in 1988(B547).
Since Mn oxides would be expected to undergo reductive resolubilization in anoxicwaters, the particulate Mn peak found below oxygen zero would not be expected to bestable over time. Indeed, Sta. 9 prefilters and light transmission profiles do not show astrong particle maximum in the region of H2S onset. In a detailed trace metal studyconducted on R.Y. Knorr cruise 3, LEWIS and LANDING (1991) see more than an order ofmagnitude lower particulate Mn values at the interior stations where they performed theirwork relative to our Sta . 10. Their data show a peak in particulate Mn just above oxygenzero, consistent with in situ chemical processes and a smaller secondary particulate Mnpeak some 20 m below. Ifour hypothesis is correct l then this lower peak would represent arelic Mn feature that originated at the margins but is much reduced at the interior stationsdue to reductive release ofMn and/or settling of the material during lateral transit into thebasin.
It is interesting to note that in the 1969 R.V. Atlantis-Il particulate trace metal data(SPENCER et al. , 1972; BREWER and SPENCER, 1974), the stations closest to the Black Seashelf showed particulate Mn peaks of similar magnitude as seen here in Fig. 5 and asimilarly much reduced maximum at interior sites . Particulate Fe in the 1969 data wasfound to be especially elevated at a shelf station just off the mouth of the Bosporus. Whilethe SPENCER et af. (1972) Fe peak was at or below oxygen zero, their Mn peak was typicallyshallower than oxygen zero . As suggested by SPENCER et af. (1972), the lower Fe at themargin may reflect detrital material and the upper Mn peak oxidation and precipitation ofMn oxides. The major difference, however, between our findings and those of SPENCER etal, (1972) is that both Fe and Mn peak below oxygen zero at our Sta. 10. This rules out insitu oxidation of Mn at this site driven by vertical advection diffusion as the source of Mnrich particles. It does not rule out oxidation of Mn at the shelf-edge and subsequent lateraltransport to this site .

Oxic and anoxic water mixing in the Black Sea S741
We feel that the R.V. Knorr data discussed above, as well as the Turkish studies in thelate 1980s, would all support the existence of significant entrainment and lateral transportof water and sediments. A final point to be addressed is whether or not this process is new,or is entrainment and lateral mixing a general feature consistent with earlier data.
While entrainment was not typically incorporated into earlier interpretations of BlackSea data, the general idea of ventilation of intermediate Black Sea waters by anentrainment process is not completely new. Early observations of hydrographic data in theBosporus region, for example , led BOGDANOVA (1961) to postulate that the incomingMediterranean water had to be mixed significantly with surface waters, and would not beexpected to sink to the bottom but rather to intermediate depths. Koczy and OSTLUND(1966), studying the hydrographic data from the R.V. John Elliot Pillsbury cruise in 1965to the Black Sea, specifically suggest that entrainment occurs at a ratio of about 4-5 partssurface water between 40 and 60 m and 1 part incoming Mediterranean water. Certainly ithas also been argued from theoretical grounds and early 14C data that deep-waterventilation must include "entraining convective boundary currents with random termination depths" (RoOTH, 1986). Furthermore, ROOTH (1986) speculated that conditions fordeep convection in the Black Sea occur only during a few months or less during the year,and that in other periods entrainment plume terminations would be in the region ofsignificant density gradients (i.e . the oxic/anoxic interface).
Data in support of entrainment and the layering of water masses with differing lateralsource terms are not obvious in earlier studies. This may simply be a result of the relativelycoarse vertical sampling intervals over which much of the earlier data were collected.Modern CTDs allow for essentially continuous vertical sampling of hydrographic data,and the continuous pumping system of CODISPOTI et al. (1991) allows for water sampling onvertical scales of less than 1 m. Upon re-examination of oxygen profiles from the R.V.Atlantis-II, one does find sub-surface oxygen maxima at Sta. 1438 (GRASSHOFF, 1975, fig.15.68). This station is located off the southern margin and contrasts with his smoothoxygen profile at interior sites . In an early tracer data set, Top and CLARKE (1983) sawdistinct sub-surface maxima in both helium and neon data at 65, 215 and 322 m at their Sta .1355in the central Black Sea . These features were not believed to be artifacts, but rather tohave resulted from distinct plumes of water masses related again to the input ofMediterranean water which settled to different horizons (after mixing with Black Seawaters).
If a consequence of entrainment is the establishment of the oxygen "null zone " , thenearlier studies suggesting an overlap at the pycnocline where oxygen and sulfide co-exist(the so-called "S layer", e .g, FASHCHUK and AYZATULLlN, 1986), may be in error. Theoverlap may result as a sampling artifact due to atmospheric contamination as suggested byGRASSHOFF (1975) and CODISPOTI et al. (1991).
We feel that earlier studies support our view that entrainment and lateral mixing of oxicwaters into anoxic depths is not a new or unique process. If it were, in the absence ofcontinuing entrainment, the depth of the oxygen and sulfide boundaries should movecloser together, while the Chernobyl Cs tracers will remain at depth and continue to bemixed both vertically and laterally by advective and diffusive processes. Following134CS/137CS ratios and the oxygen and sulfide boundaries over time would therefore bequite useful in furthering our understanding of the regularity and extent of mixing at theseintermediate depths.
S742 K. O. BUESsELER et ai.
SUMMARY AND CONCLUSIONS
The data presented above for the Cs isotopes suggest that the waters between 50 and150 m in the interior of the Black Sea can be rapidly ventilated by surface waters via anentrainment process and lateral isopycnal transport. This process is thought to occur in theBosporus region along the SW margin and is supported by the observation of sub-surface134CS/ 137Cs peaks in this region in 1986 and 1987. This is consistent with the growing bodyof R. V. Knorr hydrographic and tracer data sets. Being a conservative tracer of recentsurface water origin, Chernobyl Cs is ideally suited to study this entrainment process .
Multiple interleaving layers of water masses with differing histories must therefore beconsidered in the interpretation of any vertical profile. The chemocline, rather than a siteof one-dimensional transport, as currently used in most models, is a region of strong lateralventilation. For example, the separation between the depth of oxygen zero and sulfideonset (MURRAY et al., 1989; CODISPOTI et al., 1991) is likely a reflection of lateral processes.Both waters and suspended particulates would be affected by this process. This is seen inparticulate data, where peaks in Mn, Fe and 23~ are found in anoxic waters at marginsites and are absent or much reduced in the basin interior. It would appear that thesesuspended sediments originate from the oxic margin shelf and are transported laterallyacross the basin. Subsequent reduction and settling losses diminish this margin signal atinterior sites. A final point is that budgets and models for deep Black Sea ventilation mayneed to increase the entrainment fluxes if this feature is as strong and regular as the 19861988 Cs data suggest (such as the entrainment flow, W'J, in BOUDREAU and LEBLOND'S(1989) evolutionary model for water and salt in the Black Sea).
Future analysis of the Cs tracer data in conjunction with other tracers measured on theR.V. Knorr cruise (such as freons, tritium, I4C, etc.) may allow for more quantitativemodeling to be attempted which includes this entrainment process in Black Sea ventilationmodels. It would also be very useful if more complete long-term tracer and hydrographicmonitoring in follow-up studies could establish the true driving forces which determine theextent and timing of this process. The dynamics of overflow processes and entrainment arelikely to be very complex, and snapshots of vertical distributions at single points in spaceand time are not likely to be sufficient for gaining a more complete understanding ofventilation processes in this basin . Recent reductions in riverine inputs to the Black Sea(AL'TMAN, 1982; TOLMAZIN, 1985) may also severely change the intensity and dynamics ofintermediate and deep water ventilation in the near future.
Acknowledgements-This work. and the rapid international support which was needed to initiate our studies ofChernobyl fallout, could not have been completed without the kind assistance of numerous colleagues. including:E. Izdar, T. Konuk and co-workers from the Dokuz Eyliil Universitesi in Izmir, Turkey; E. Degens,S. Kempe. V. Ittekkot and co-workers from the University of Hamburg, Germany; and S. Honjo, B. Hay ,J. Nicholson and their group at WHOI. We also thank the officers and crew of the R.V. K. Piri Reis and theR .V. Knorr . We thank M. C. Hartman for her sampling assistance in 1988 and help back at WHOI, as wellas J. Palmieri and L. Ball for their assistance in the ICP analyses . Comments by the reviewers helped improve thefinal version of this manuscript , and we are greatly indebted to all of the U.S. and Turkish PIs whose work wewere allowed to include in our discussions.
This work was funded directly by our grants from the U.S . National Science Foundation (OCE-8700715) andthe Coastal Research Center of Woods Hole . Funding for sampling in 1986and 1987came from the U.S. Office ofNaval Research (contract NOOO14·85·C·OO7), the Turkish Research Council and the German Federal Ministryfor Research and Technology. This is contribution no . 7376 from the Woods Hole Oceanographic Institution.

Oxic and anoxic water mixing in the Black Sea
REFERENCES
8743
AARKROG A. (1988)The radiological impact of the Chernobyl debris compared with that from nuclear weaponsfallout. Journal of Environmental Radioactivity, 6, 151-162.
ALEXANDROPOULOS N. G., T. ALEXANDROPOULOU, D. ANAGNOSTOPOULOS , E. EVANGELOU, K. T. KOSIS andI. THEODORIDOU (1986)Chemobyl fallout on Ioannina, Greece . Nature, 322, 799.
AL'TMAN E. N. (1982)Possiblesalinitychanges of northwestern Black Sea upon diversion of some river waterforeconomic needs. Hydrobiological Journal , 4, 80-83.
BALLESTRA S., D. VAS, J. J . LOPEZ and V. NOSHKIN (1989) Intercomparison of radionuclide measurements inmarine sediment sample IAEA-306. Report IAENAU013, International Laboratory of Marine Radioactivity, Monaco.
BOGDANOVA A. K. (1%1) The distribution of Mediterranean waters in the Black Sea. Deep-Sea Research, 10,665--672.
BOGusLAVSKIY S. G., A. S. SARKISYAN, T. Z. DZHIOYEV and L. A. KOVESHNIKOV (1976) Analysis of Black Seacurrent calculations. Atmospheric and Ocean Physics , 12, 337-340.
BOUDREAU B. P. and P. H. LEBLOND (1989) A simple evolutionary model for water and salt in the Black Sea.Paleoceanography, 4,157-166.
BOWEN V. T. and W. ROETHER (1973) Vertical distribution of strontium 90, cesium 137, and tritium near 45·North in the Atlantic. Journal of Geophysical Research, 78, 6277-6285.
BOWEN V. T., V. E. NOSHKIN, H. D. LIVINGSTON and H. L. VOLCHOK (1980) Fallout radionuclides in the PacificOcean: vertical and horizontal distributions, largely from GEOSECS stations. Earth and Planetary ScienceLetters, 49, 411-434.
BREWER P. G . and D. W. SPENCER (1974)Distribution of some trace elements in Black Sea and their fluxbetweendissolved and particulate phases. In: The Black Sea-geology, chemistry and biology, Memoir 20, E. T.DEGENS and D. A. Ross , editors , American Association ofPetroluem Geologists, Tulsa, OK, pp. 137-143.
BRYANTSEV V. A., D. VA. FASHCHUK, T. A. AYZATULLlN , S. V. BAGOTSKtY and A. V. LEONNOV (1988)Variationin the upper boundary of the hydrogen sulfide zone in the Black Sea: analysis of field observations andmodeling results. Oceanology, 28, 180-185.
BUESSELER K. O. , S. A. CASSO, M. C. HARTMAN and H. D. LIVINGSTON (1990a)Determination of fission-productsand actinides in the Black Sea following the Chernobyl accident. Journal of Radioanalytical and NuclearChemistry Articles, 138, 33-47.
BUESSELER K. 0., H. D. LIVINGSTON , S. HONJO, B. J . HAY, T. KONUK and S. KEMPE (1990b) Scavenging andparticle deposition in the southwestern Black Sea-evidence from Chernobyl radiotracers. Deep-SeaResearch, 37, 413-430.
CALVERT S. E., J . S. VOGEL and J. R. SOUTHON (1987)Carbon accumulation rates and the origin of the Holocenesapropel in the Black Sea. Geology, IS, 91S-921.
COCHRAN J. K., H. D. LIVINGSTON, D. J. HIRSCHBERG and L. D. SURPRENANT (1987) Natural and anthropogen icradionuclide distributions in the northwest Atlantic Ocean . Earth and Planetary Science Letters, 84, 135152.
CODISPOTI L. A., G. E. FRIEDERICH, J. W. MURRAY and C. SAKAMOTO (1991)Chemicalvariability in the Black Sea:implications of data obtained with a continuous vertical profiling system that penetrated the oxidanoxicinterface. Deep-Sea Research , 38 (Suppl)., S691-S710.
DEGENS E. T., P. STOFFERS, S. GOLUBIC and M. D. DICKMAN (1978) Varve chronology: estimated rates ofsedimentation in the Black Sea Deep Basin. In: Initial reports ofthe deep sea drilling project, Vol. 42, Part 2,D. A. Ross, Y. P. NEPROCHNOV et al., editors, U.S. Government Printing Office, Washington DC, pp. 499508.
DEUSER W. G. (1972) Late-Pleistocene and Holocene history of the Black Sea as indicated by stable-isotopestudies. Journal ofGeophysical Research, 77,1071-1077 .
DEVELL L., H. TOVEDAL, U. BERGSTROM, A. ApPELGREN, J. CHYSSLER and L. ANDERSSON (1986) Initialobservations of fallout from the reactor accident at Chernobyl. Nature , 321, 192-193.
EMERSON S., S. KALHORN, L. JACOBS , B. M. TEBO, K. H. NEALSON and R. A. ROSSON (1982) Environmentaloxidation rate of manganese (II): bacterial catalysis. Geochimica et Cosmochimica Acta, 46, 1073-1079.
FASHCHUK D. VA. and T. A. AYZATULLIN (1986) A possible transformat ion of the anaerobic zone of the BlackSea. Oceanology, 26, 171-178.
GOLDMAN M. (1987) Chernobyl: A radiobiological perspective . Science , 238. 622-623.

5744 K. O. BUESSELER et al.
GRAssHoFFK. (1975) The hydrochemistry of landlocked basins and fjords . In : Chemical oceanograph y. Vol. 2.J . P. RILEY and G. SKIRROW. editors, Academic Press. New York, 647 pp.
GUNNERSON C . G . and E OZTURGUT (1974) The Bosporus. In : The Black Sea-geology. chemistry . and biology ,Memoir 20, E . T. DEGENS and D . A. Ross. editors, American Association of Petroleum Geologists . Tulsa .
OK, pp . 99-114 .JOSEPH A . B., P. F. GUSTAfSON , I. R. RUSSELL. E. A . SCHUERT. H. L. VOLCHOK and A . TAMPLIN (1971) Sources
of radioactivity and their characteristics. In : Radioactivity in the marine envirronment, Chapter 2 . National
Academy of Sciences, pp . 6--41.Koczy F. F. and H. G. OSTLUND (1966) Vertical transfer processes and the age of deep waters in the Black Sea.
In : Abstract of Papers. 2nd International Oceanographic Congress. Moscow, p. 200.LATIF M. A. , E. OZSOY. T . OGUZand U. UNLUATA (1991) Observations of the Mediterranean inflow into the
Black Sea . Deep-Sea Research , 38 (Supp!. ), S711-S723 .LEWIS B. L. and W. M. LANDING(1991) TIle biogeochemistry of manganese and iron in the Black Sea. Deep-Sea
Research, 38 (Supp!.) , S773-S803 .LIVINGSTON H. D . and J. K. COCHRAN ( 1987) Determination oftransuranic and thorium isotopes in ocean waterin
solution and in filterable particles. Journal of Radioanalyucal Nuclear Chemistry, 115.299-308.LIVINGSTON H. D ., V . T . BOWEN and S. L. KUPFERMAN (1982a) Radionuclides from Windscale discharges I:
nonequilibrium tracer experiments in high-latitude oceanography. Journal of Marine Research. 40, 253
272.LIVINGSTON H. D. , V. T. BOWEN and S. L. KUPFERMAN (l982b) Radionuclides from Windscale discharges II: their
dispersion in Scottish and Norwegian coastal circulation. Journal of Marine Research, 40, 1227-1258.LIVINGSTON H . D ., J . H . SWIFT and H. G. OSTLUND (1985) Art ificial rad ionuclide tracer supply to the Denmark
Strait Overflow between 1972 and 1981. Journal of Geophysical Research. 90. 6971--{)982.LIVINGSTON H . D ., K. O . BUESSELER, E. IZOAR and T . KONUK (1988) Characteristics of Chernobyl fallout in the
southern Black Sea . In : Radionuclides: a tool for oceanography. J . C. G UARY, P . GUEGUENIAT and R . J.PENTREATH, editors, Elsevier. Essex, U .K .. pp . 204-216.
MANN D . R. and S. A . CASSO (1984) In situ chemisorption of radiocesium from seawater. Marine Chemistry . 14,307-318.
MISAELIDES P., C. SIKALIDIS, R . TSITOURIDOU and C. ALEXIADES (1987) Distribution of fission products in dustsamples from the region of Thessaloniki, Greece, after the Chernobyl nuclear accident. EnvironmentalPollution, 47.1-8.
MITCHELL N. T . and A . K. STEELE (1988) The marine impact ofcaesium -134 and -137 from the Chernobyl reactoraccident. Journal of Environmental Radioactivity. 6,163-175 .
MURRAY J. W . and E . (WAR (1989) The 1988 Black Sea Oce anographic Expedition: overview and newdiscoveries. Oceanography, 2, 15-21.
MURRAY J. W. , H. W . JANNASCH, S. HONIO, R . F. ANDERSON , W. S. REEBURGH, Z. Top , G. E. FRIEDERICH, L. A .CODISPOTI and E. (ZOAR (1989). Unexpected changes in the oxic/anoxic interface in the Black Sea. Nature.338.411-413.
MURRAY J. W., Z . Top and E . OZSOY (1991) Temperature and salinity distributions in the Black Sea . Deep-SeaResearch , 38 (Suppl.), S663-S689.
OGuzT., M. A. LATIF, E. OZSOY, H. I. Sua and U. ONLOATA (1991)On the dynamics ofthe southern Black Sea.NATO Advanced Research Workshop on Black Sea Oceanography, Cesrne, Turkey (23-27 October 1989),submitted.
OZSOY E. and A . Y. AYDIN (1991) An intermediate nepheloid layer near Sakarya Canyon (Black Sea) . Deep-SeaResearch ,
OZSOY E ., Z. Top . G . WHITE and J. W . MURRAY (1991) Double diffusive intrusions, mixing and and deep seaconvection processes in the Black Sea. NATO Advanced Research Workshop on Black Sea Oceanography,Cesme , Turkey (23-27 October 1989). submitted .
POLIKARPOV G . G ., L. G. KULEBAKINA. V. I. TIMOSHCHUK and N. A. STOKOZOV (1991) \lOSr and 137 Cs in surfacewaters of the Dnieper River, the Black Sea and the Aegean Sea in 1987and 1988. Journal of EnvironmentalRadioacti vity, 13,25-38.
ROOTH C. G . H. (1986) Comments on circulation diagnostics and implications for chemical studies of the BlackSea. In: Report on the chemistry of seawater XXXIII (Proceedings "Th e Chemical and Physical Oceanography of the Black Sea"), University of Goteborg, Sweden.
Ross D. A., E. T . DEGENS and J. MAcILVAINE (1970) Black Sea : recent sedimentary history. Science, 170,163-165 .
Oxic and anoxic water mixing in the Black Sea 8745
SOROKIN YU. I. (1983) The Black Sea. In: Ecosystems ofthe world 26. Estuaries and enclosed seas, Elsevier, NewYork, Chapter 11, pp. 253-275.
SPENCER D. W., P. G. BREWER and P. L. SACHS (1972) Aspects of the distributions and trace element compositionof suspended matter in the Black Sea. Geochimica et Cosmochimica Acta, 36, 71-86.
TOLMAZIN D. (1985) Changing coastal oceanography of the Black Sea. I. Northwestern shelf. Progress inOceanography, 15,217-276.
Top Z. and W. B. CLARKE (1983) Helium, neon, and tritium in the Black Sea. Journal of Marine Research, 41,1-17.
VAKULOVSKIY S. M., Yu. V. KRASNOPEVfSEV, A. I. NIKITIN and V. B. CHUMICHEV (1982) Distribution of 137Csand 90Sr between water and bottom sediments in the Black Sea, 1977. Oceanology, 22, 712-715.
VAN DER VEEN J., A. VAN DER WUK, W. G. Moox and R. J. DE MEIJER (1986) Core fragments in Chernobylfallout. Nature, 323, 399-400.
VOLCHOK H. L., V. T. BOWEN, T. R. FOLSOM, W. S. BROECKER, E. A. SCHUERT and G. S. BIEN (1971) Oceanicdistributions of radionuclides from nuclear explosions. In: Radioactivity in the marine environment, Chapter3, National Academy of Sciences, pp. 42-89.
WHITE G., M. RELANDER, J. POSTAL and J. W. MURRAY (1989) Hydrographic data from the 1988 Black Seaoceanographic expedition. Special Report No. 109, University of Washington, School of Oceanography,Seattle.
WIRTH E., N. D. VAN EGMOND and M. J. SUESS, editors (1987) Assessment of radiation dose commitment inEurope due to the Chernobyl accident. Report ISH-Heft 108, Institut fur Strahlenhygiene des Bundesgesundheitsamtes, Munchen.
WONG K. M., V. E. NOSH KIN and V. T. BOWEN (1970) Radiochemical procedures. In: Reference methods formarine radioactivity studies, Report 118, Y. NISH1WAKI and R. FUKAI, editors, International Atomic EnergyAgency, pp. 119-127.
YAMAGATA N. (1965) Review of the analytical methods for the stable and radioactive caesium. Bulletin of theInstitute of Public Health (Tokyo), 14,59-86.


![Oxic and ?anoxic deposits of the Pannonian E (Late Miocene ...1].pdf · Oxic and ?anoxic deposits of the Pannonian E (Late Miocene) from the Vienna Basin (sedimentological and micropaleontological](https://img.dokumen.tips/doc/110x75/5c95340109d3f29c7b8c4be9/oxic-and-anoxic-deposits-of-the-pannonian-e-late-miocene-1pdf-oxic-and.jpg)