Embed Size (px)
Citation preview
MixedMixed--Signals Signals Integrated Circuit TestingIntegrated Circuit Testing
Salvador MIRTIMA Laboratory
46 Av. Félix Viallet38031 Grenoble
Montpellier, 27th March 2007 1
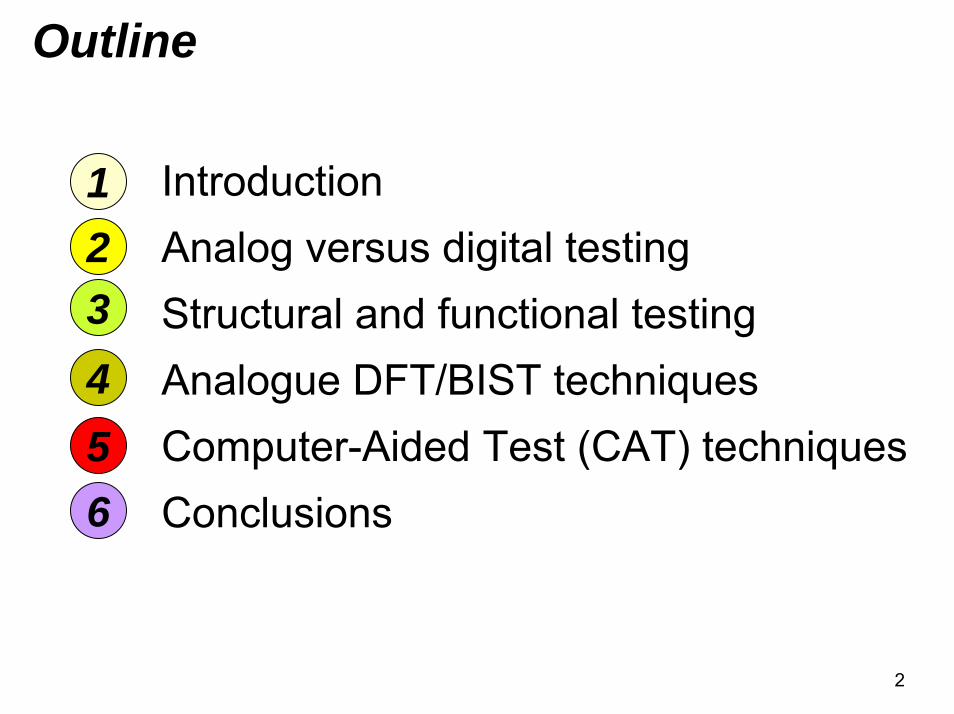
Outline
Introduction Analog versus digital testing Structural and functional testingAnalogue DFT/BIST techniquesComputer-Aided Test (CAT) techniquesConclusions
123456
2
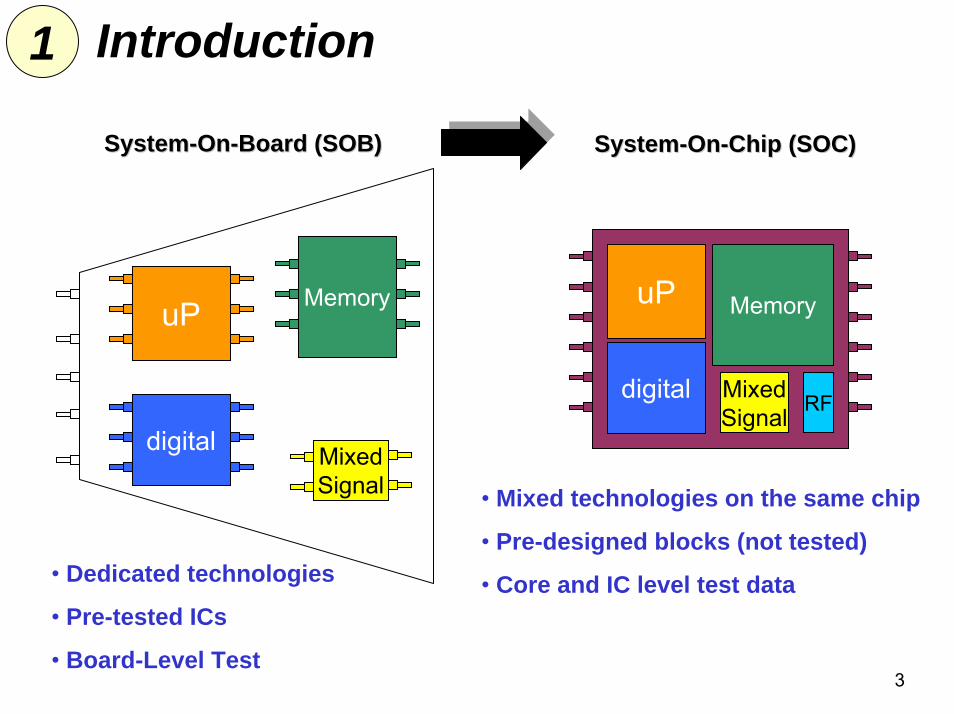
1 Introduction
SystemSystem--OnOn--Board (SOB)Board (SOB)
3
• Dedicated technologies
• Pre-tested ICs
• Board-Level Test
uP Memory
MixedSignal
digital
SystemSystem--OnOn--Chip (SOC)Chip (SOC)
• Mixed technologies on the same chip
• Pre-designed blocks (not tested)
• Core and IC level test data
uP Memory
MixedSignal
digital RF
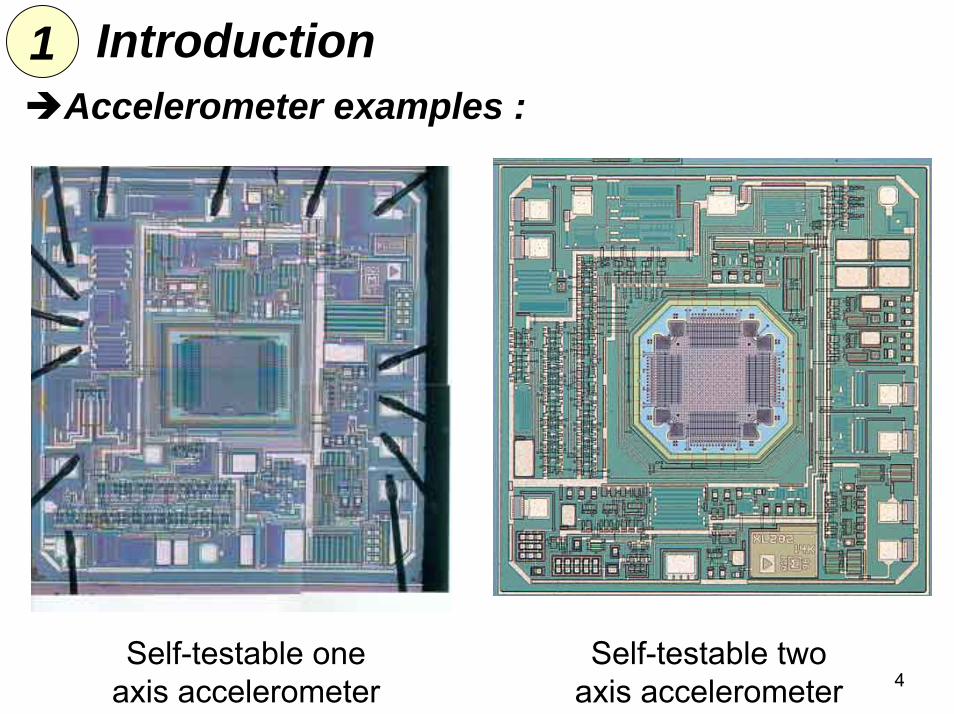
1 IntroductionAccelerometer examples :
Self-testable one axis accelerometer
Self-testable two axis accelerometer 4
1 Introduction
Motivation of mixed-signals testing :
Growth in mixed-signals ICs : efforts to combine analog, digital and memories to provide SoC solutions
Driven by communication and consumer markets
In mixed-signal systems, over 90% is often digital but 90% test cost can be analogue
Communications and biomedical applications are demanding new SoC and SiP devices
Testing mixed-signals devices is very different from digital testing
5

1 Introduction
What are we testing for ? Physical defects
Cause : process disturbances- Local (silicon defects, photolithography spots …)- Global (mask misalignment, bad micromachining …)Fault types :
- Structural faults : opens, shorts, …- Parametric faults : variations in device parameters have a more important impact on analogue testingFailures :
- Hard (incorrect performance, large performance error)- Soft (marginal out-of-spec performance)
6
1 Introduction
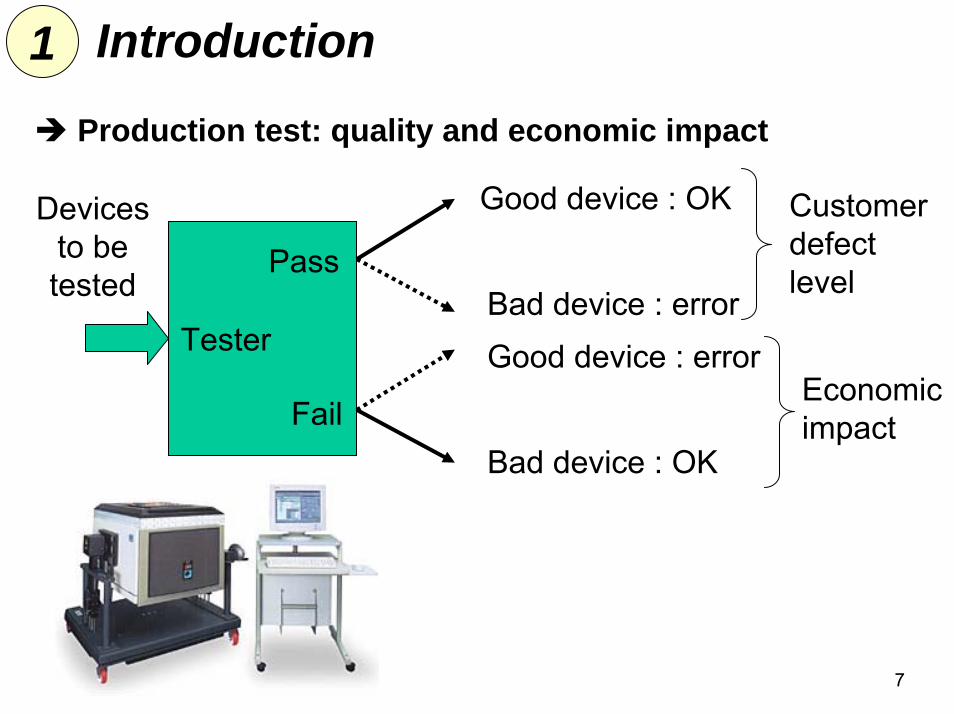
Production test: quality and economic impact
7
Tester
Devices to be tested
Pass
Fail
Good device : OK
Bad device : errorGood device : error
Customer defect level
Economicimpact
Bad device : OK

Analog versus digital testing
8
2Digital Testing :♠ Discrete binary values (0/1)♠ Truth tables (exact)♠ Simple parametric testing (e.g. current consumption at wafer level)♠ Fault-based (structural) or functional testing based on exact logic behaviour at chip and package levels
Analog Testing :♠ Continuous values♠ Differential equations (approx)♠ Specification-based testing considering acceptance ranges for design parameters
Nominal behaviour
Tolerance rangeIn
Out
X1 X2 X3 X4 Y0 0 0 0 10 0 0 1 00 0 1 0 1
G
fc
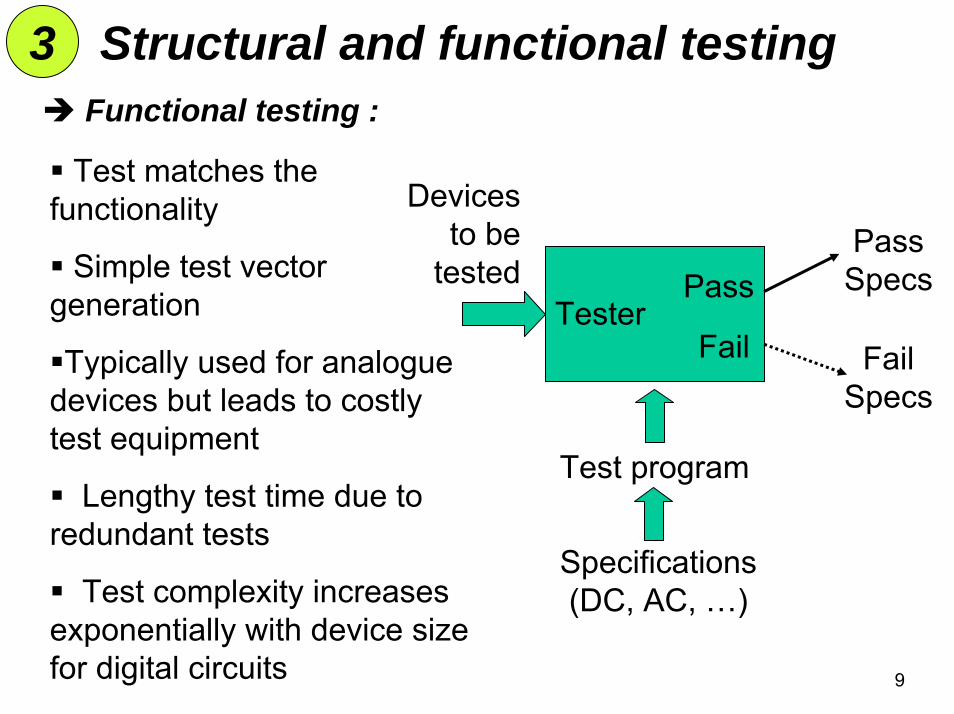
3 Structural and functional testingFunctional testing :
Test matches the functionality
Simple test vector generation
Typically used for analogue devices but leads to costly test equipment
Lengthy test time due to redundant tests
Test complexity increases exponentially with device size for digital circuits
Tester
PassSpecs
FailSpecs
Specifications(DC, AC, …)
Test program
Pass
Fail
Devices to be
tested
9
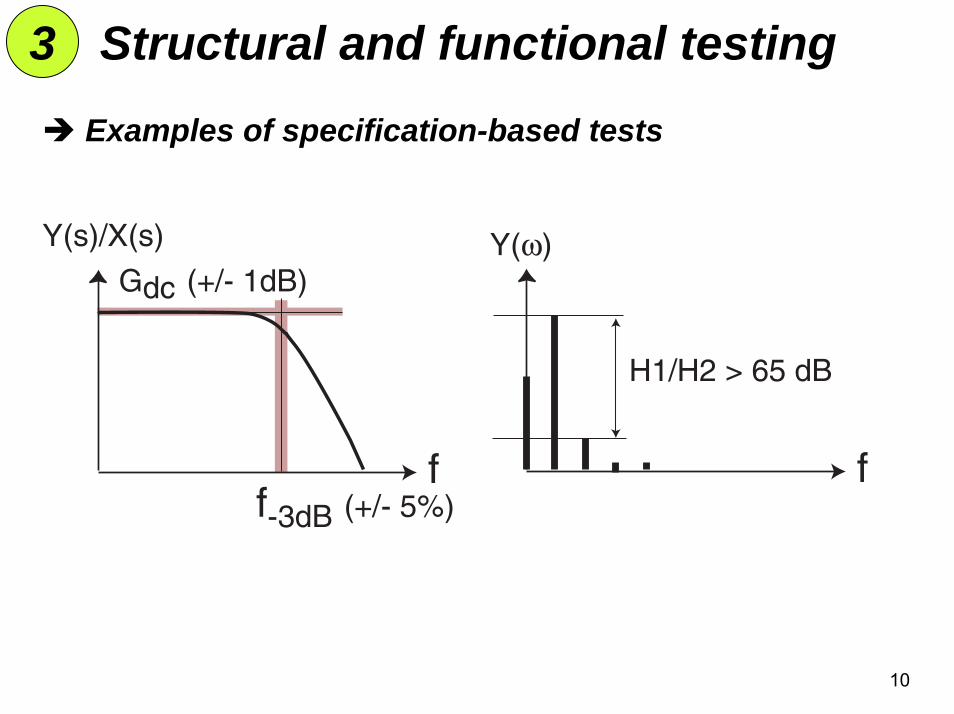
3 Structural and functional testingExamples of specification-based tests
f-3dB (+/- 5%)
Gdc (+/- 1dB)
f f
Y(s)/X(s) Y(ω)
H1/H2 > 65 dB
10
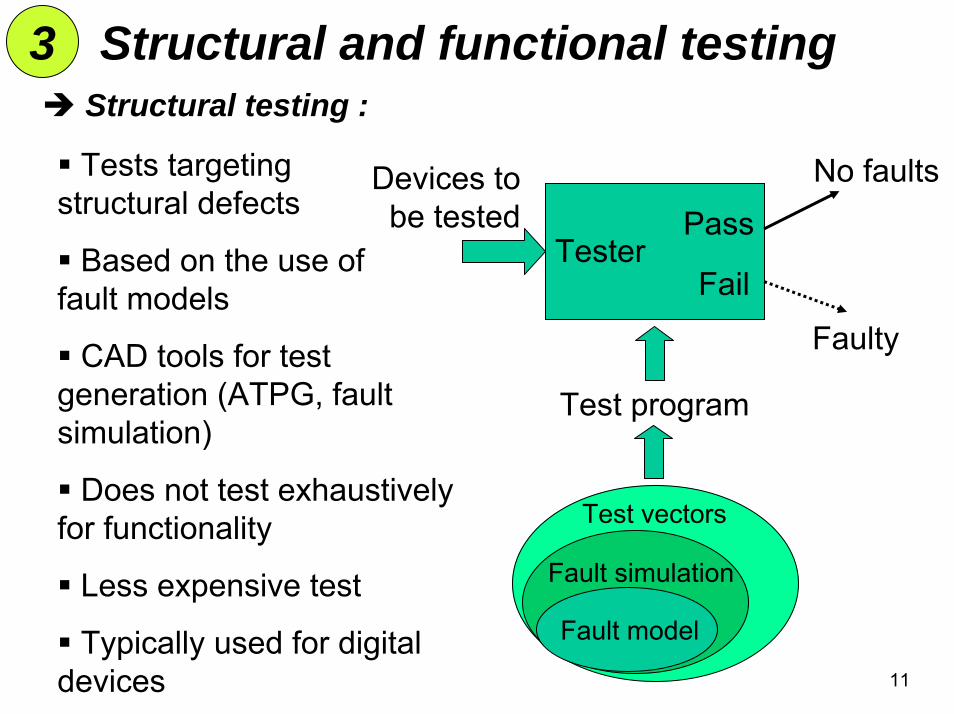
3 Structural and functional testingStructural testing :
Tests targeting structural defects
Based on the use of fault models
CAD tools for test generation (ATPG, fault simulation)
Does not test exhaustively for functionality
Less expensive test
Typically used for digital devices
Tester
No faults
Faulty
Test program
Pass
Fail
Devices to be tested
Fault model
Fault simulation
Test vectors
11
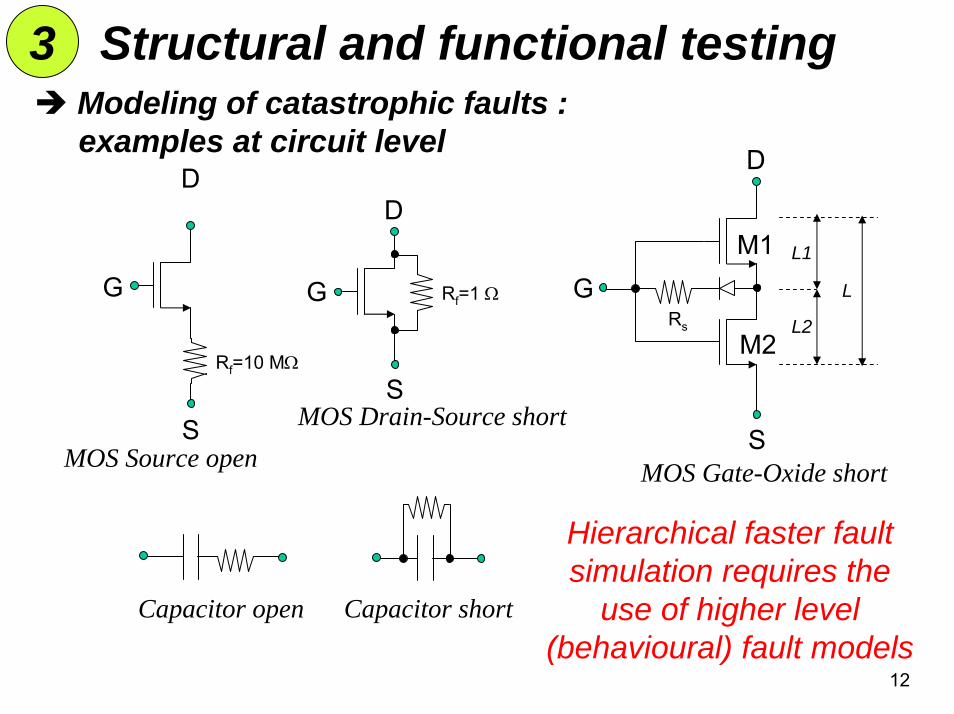
3 Structural and functional testingModeling of catastrophic faults : examples at circuit level
12
Rf=10 MΩ
MOS Source open
Rf=1 Ω
MOS Drain-Source short
D
SS
G G
D
G
D
L1
L2
MOS Gate-Oxide short
Rs
M1L
M2
S
Hierarchical faster fault simulation requires the
use of higher level (behavioural) fault models
Capacitor open Capacitor short
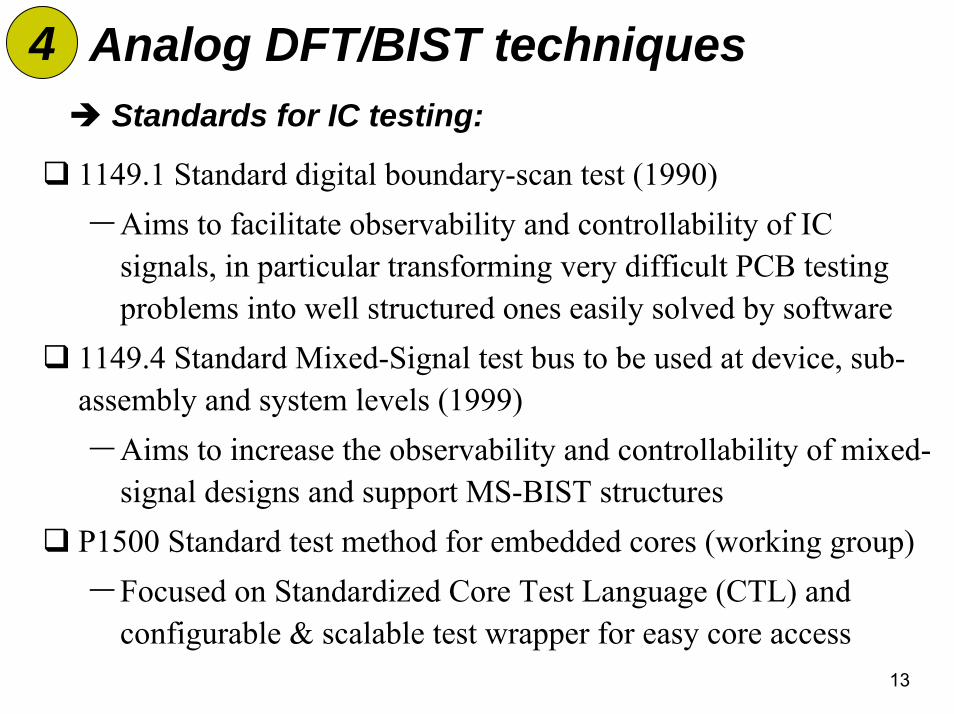
4 Analog DFT/BIST techniquesStandards for IC testing:
1149.1 Standard digital boundary-scan test (1990)– Aims to facilitate observability and controllability of IC
signals, in particular transforming very difficult PCB testing problems into well structured ones easily solved by software
1149.4 Standard Mixed-Signal test bus to be used at device, sub-assembly and system levels (1999)– Aims to increase the observability and controllability of mixed-
signal designs and support MS-BIST structuresP1500 Standard test method for embedded cores (working group) – Focused on Standardized Core Test Language (CTL) and
configurable & scalable test wrapper for easy core access13
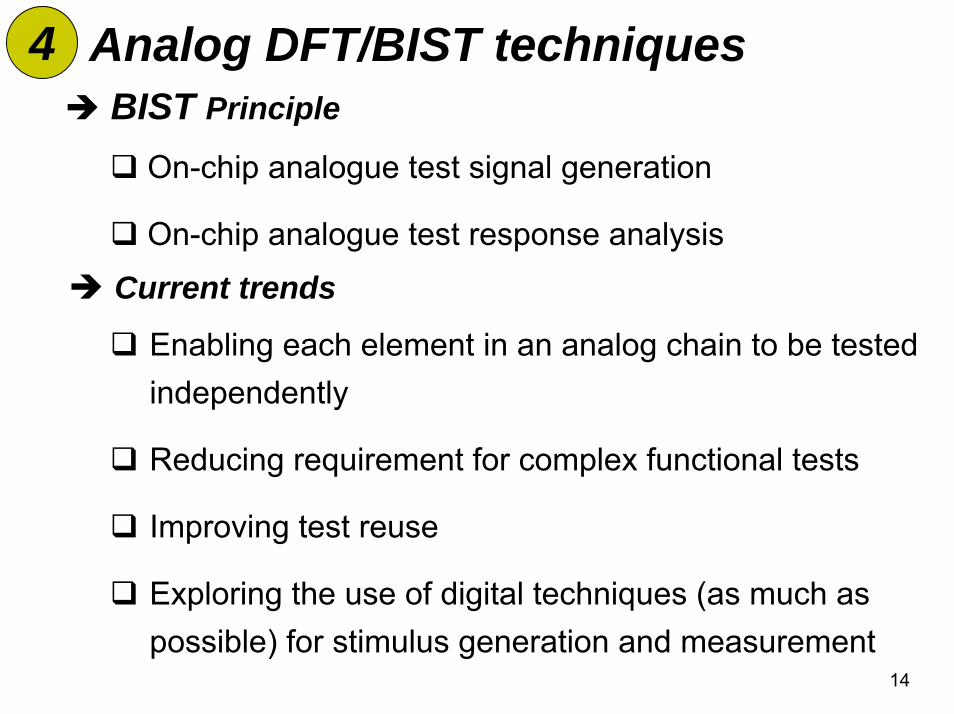
4 Analog DFT/BIST techniquesBIST Principle
On-chip analogue test signal generation
On-chip analogue test response analysis
Current trends
Enabling each element in an analog chain to be tested independently
Reducing requirement for complex functional tests
Improving test reuse
Exploring the use of digital techniques (as much as possible) for stimulus generation and measurement
14
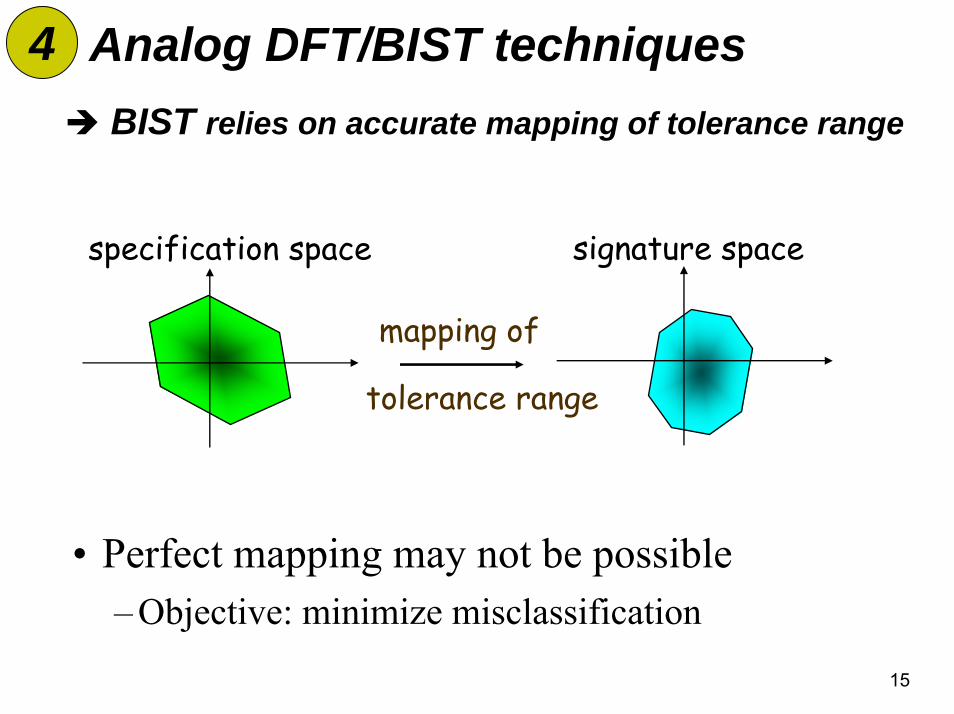
4 Analog DFT/BIST techniquesBIST relies on accurate mapping of tolerance range
specification space signature space
mapping of
tolerance range
• Perfect mapping may not be possible– Objective: minimize misclassification
15
4 Analog DFT/BIST techniques
16
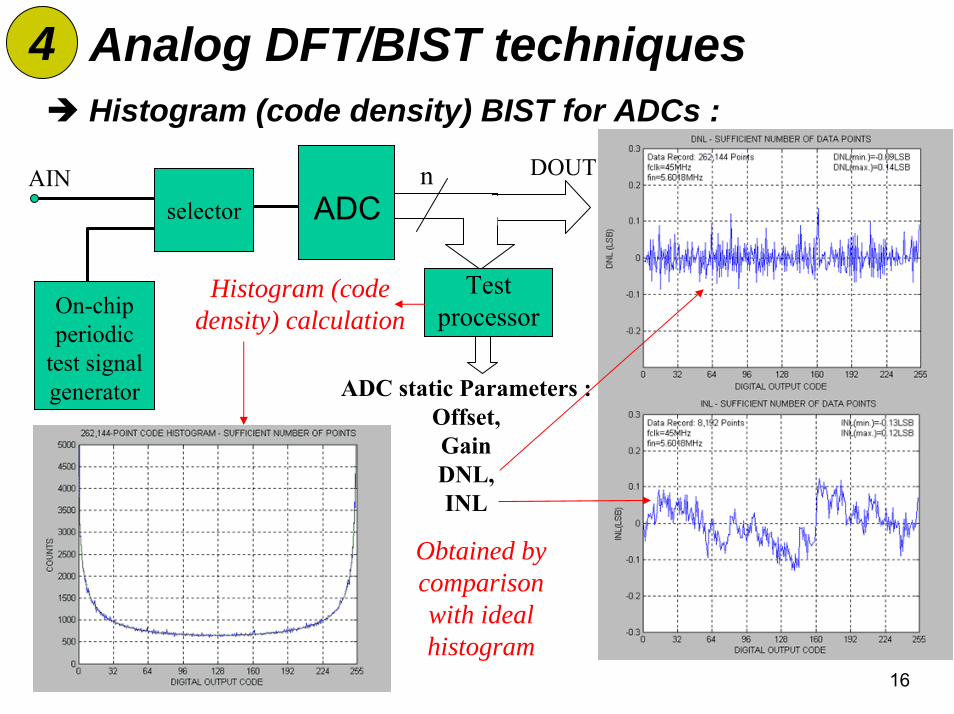
Histogram (code density) BIST for ADCs :
selector
On-chip periodic
test signal generator
AIN n DOUT
ADC
Test processor
ADC static Parameters : Offset, GainDNL, INL
Histogram (code density) calculation
Obtained by comparison with ideal histogram
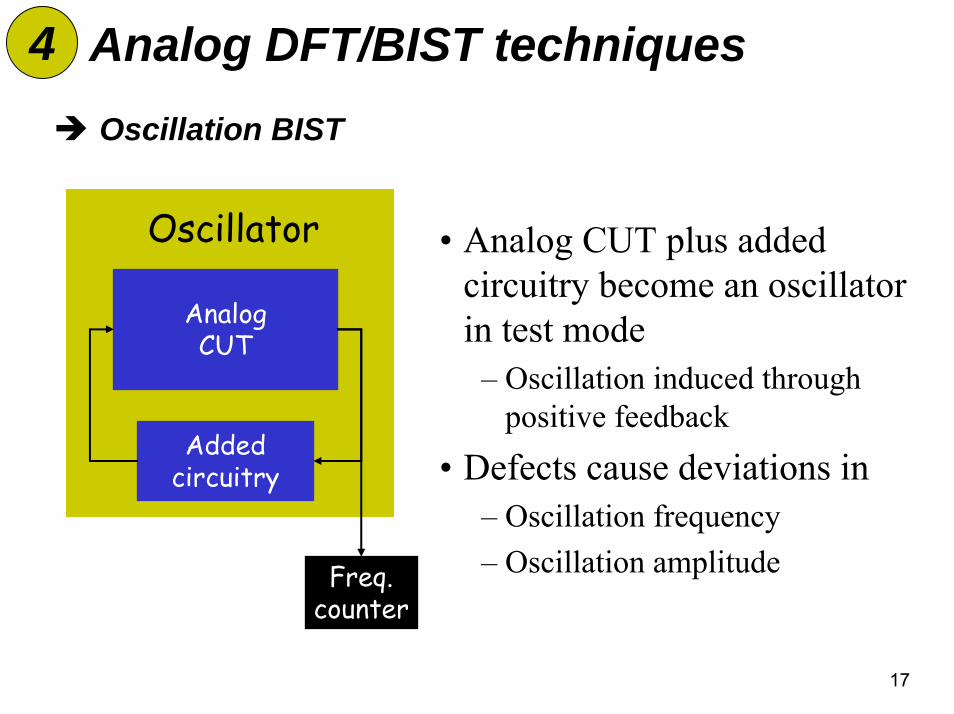
4 Analog DFT/BIST techniquesOscillation BIST
• Analog CUT plus added circuitry become an oscillator in test mode
– Oscillation induced through positive feedback
• Defects cause deviations in– Oscillation frequency– Oscillation amplitude
AnalogCUT
Addedcircuitry
Freq.counter
Oscillator
17
18
0 10 20 30 40 50 60-0.1
0
0.1
0.2
0.3Impulse Response IR(k)
0 10 20 30 40 50 60-0.1
0
0.1
0.2
0.3
k
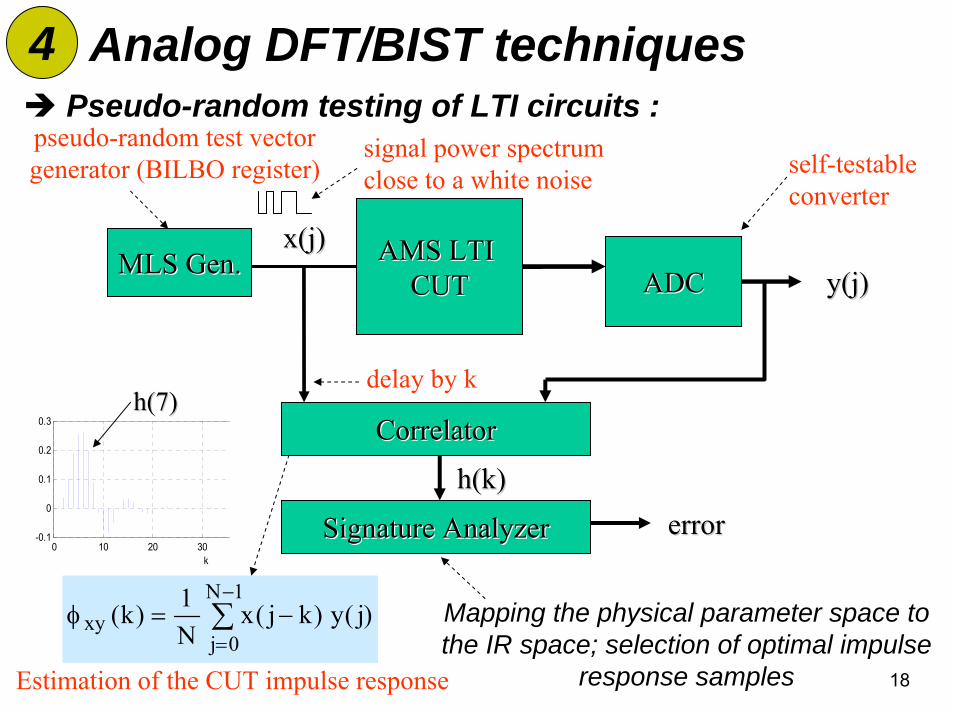
Pseudo-random testing of LTI circuits :
∑−
=−=φ
1N
0jxy )j(y)kj(x
N1)k(
MLS MLS GenGen.. AMS LTI AMS LTI CUTCUT ADCADC
x(j)x(j)y(j)y(j)
h(k)h(k)CorrelatorCorrelator
Signature Signature AnalyzerAnalyzer errorerror
self-testable converter
Mapping the physical parameter space to the IR space; selection of optimal impulse
response samples
pseudo-random test vector generator (BILBO register)
Estimation of the CUT impulse response
signal power spectrum close to a white noise
h(7)h(7)delay by k
Analog DFT/BIST techniques4
5 Computer-Aided Test (CAT)
Computer aided testing :
Efficient design and test integration by using Computer-Aided Test (CAT) techniques
Estimation of test metrics and setting of test limits
Efficient determination of test patterns :- optimisation of functional tests - automatic generation of structural tests (ATPG)
ATPG requires :- fault modelling techniques for analogue components- fault simulation of mixed-signal mixed-domain devices and calculation of fault coverage figures 19
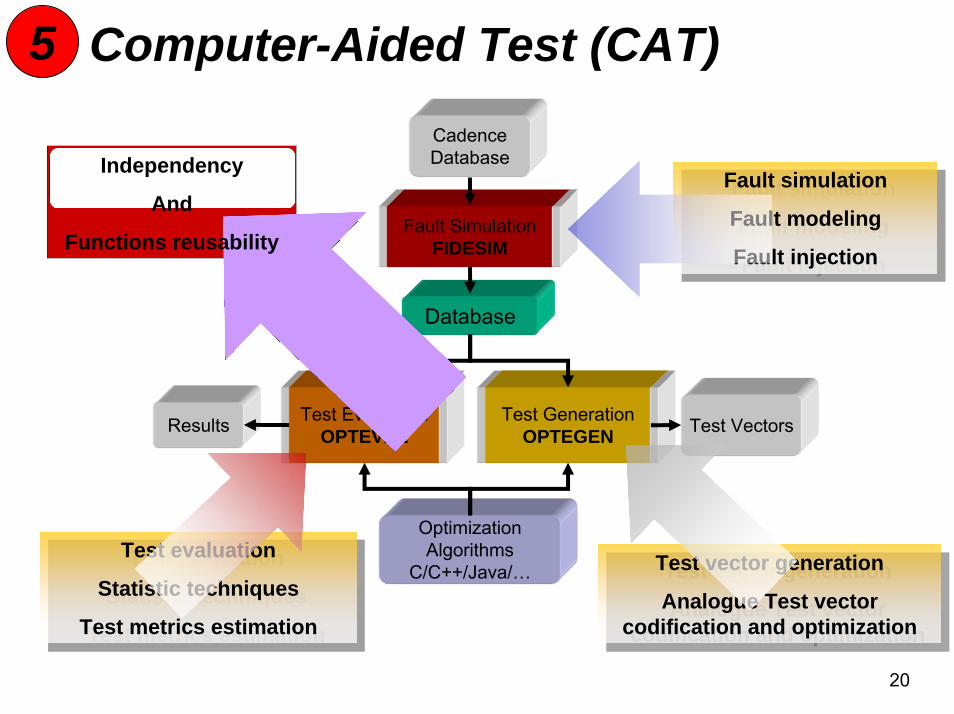
5 Computer-Aided Test (CAT)
Test GenerationOPTEGEN
Test EvaluationOPTEVAL
Fault SimulationFIDESIM
Database
Results Test Vectors
OptimizationAlgorithms
C/C++/Java/…
CadenceDatabase
Fault simulation
Fault modeling
Fault injection
Fault simulation
Fault modeling
Fault injection
Test evaluation
Statistic techniques
Test metrics estimation
Test evaluation
Statistic techniques
Test metrics estimation
Test vector generation
Analogue Test vector codification and optimization
Test vector generation
Analogue Test vector codification and optimization
Independency
And
Functions reusability
20

5 Computer-Aided Test (CAT)Estimation of test metrics:
It is necessary to work out the relationship between performances and test criteria.The metrics are used in order to set test limits.
A s
fS(s)
B t
fT(t)
Performance Test criterion
Test limitSpecification
P(Pass) = P(t∈B)P(Functional) = P(s∈A)P(Fail) = 1-P(Pass)
= 1-P(t∈B)P(Faulty) = 1-P(Functional)
= 1-P(s∈A) 21
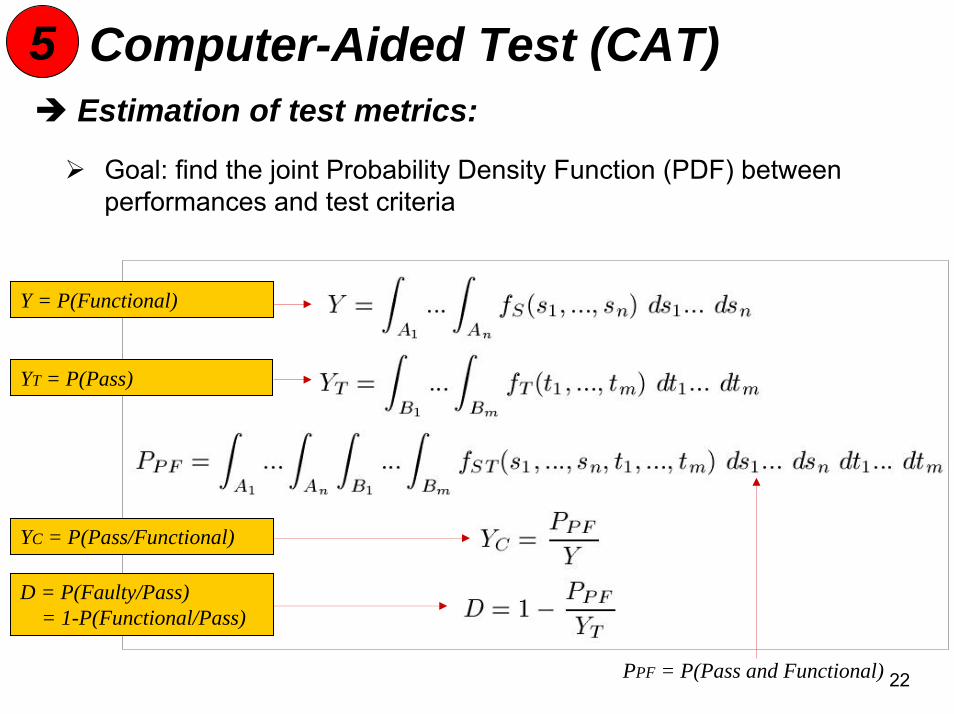
5 Computer-Aided Test (CAT)Estimation of test metrics:
Goal: find the joint Probability Density Function (PDF) between performances and test criteria
22PPF = P(Pass and Functional)
Y = P(Functional)
YT = P(Pass)
YC = P(Pass/Functional)
D = P(Faulty/Pass)= 1-P(Functional/Pass)
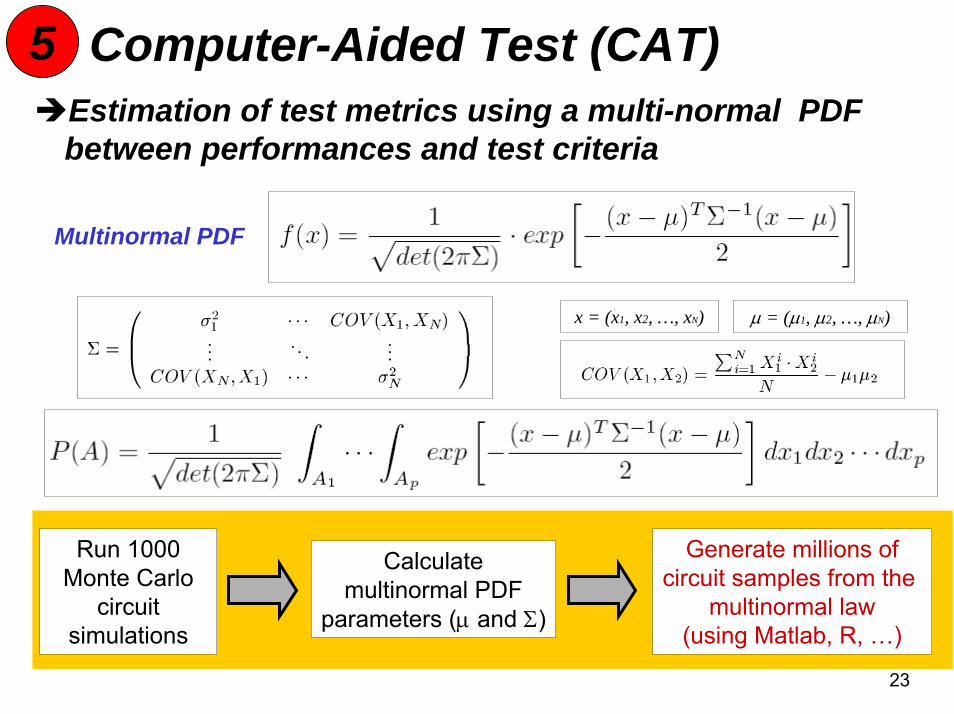
5 Computer-Aided Test (CAT)Estimation of test metrics using a multi-normal PDF between performances and test criteria
Multinormal PDF
x = (x1, x2, …, xN) µ = (µ1, µ2, …, µN)
Run 1000 Monte Carlo
circuitsimulations
Calculatemultinormal PDF
parameters (µ and Σ)
Generate millions ofcircuit samples from the
multinormal law(using Matlab, R, …)
23

24
[ µ-4.0σ , µ+4.0σ ]
[ µ-4.1σ , µ+4.1σ ]
SNDR
IDD
5Setting test limits as a function of test metrics:
Computer-Aided Test (CAT)
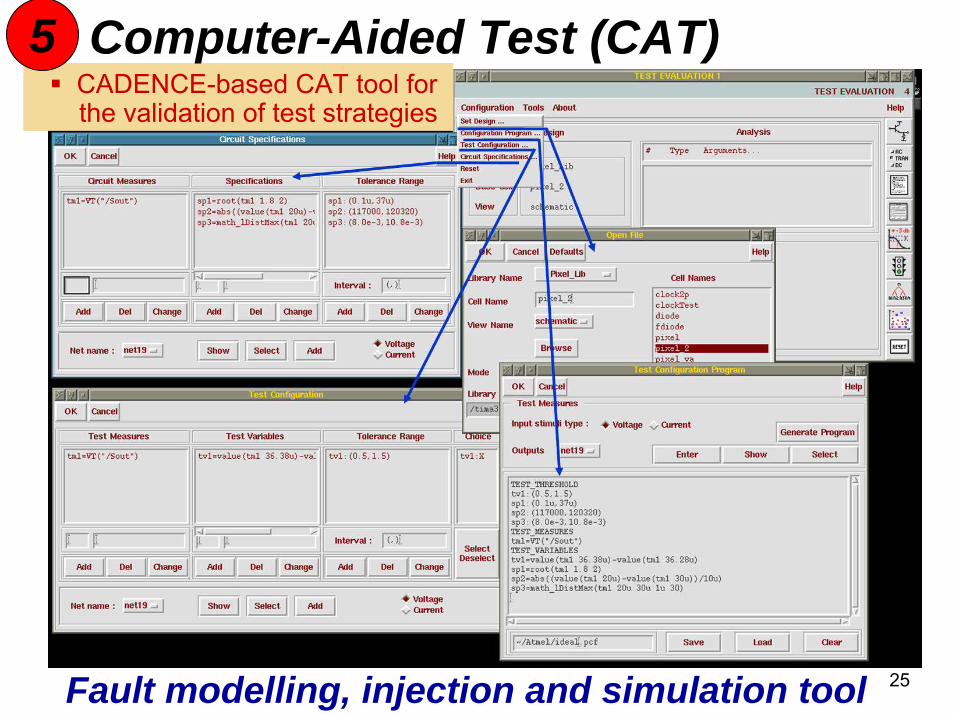
25Fault modelling, injection and simulation toolFault modelling, injection and simulation tool
CADENCE-based CAT tool for the validation of test strategies
5 Computer-Aided Test (CAT)
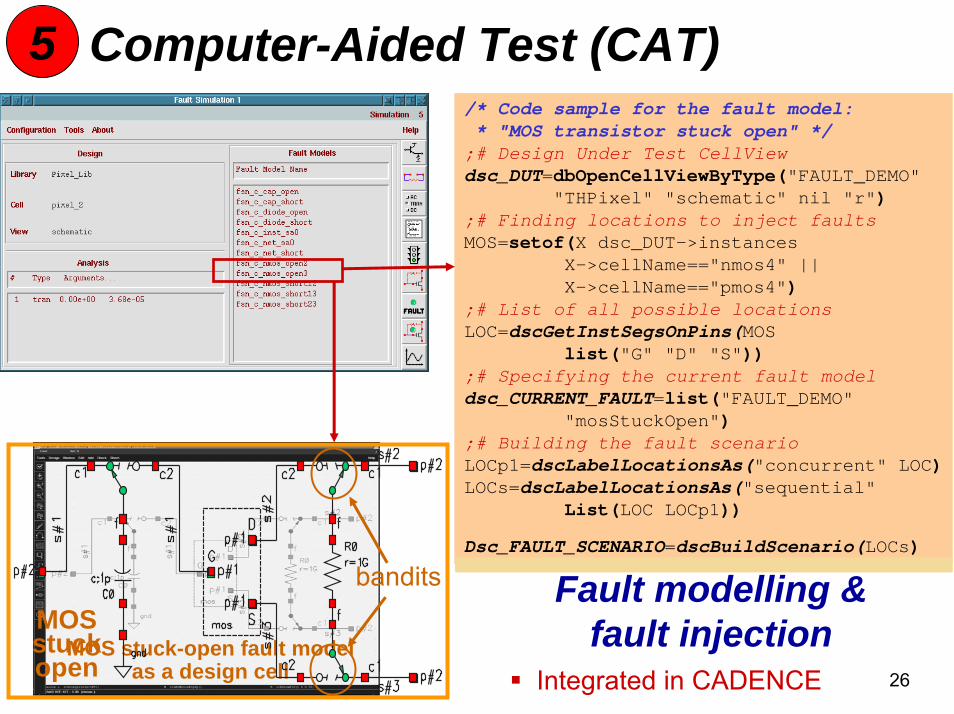
26MOS stuck-open fault model
as a design cell
Fault modelling & fault injection
Fault modelling & fault injection
/* Code sample for the fault model:* "MOS transistor stuck open" */
;# Design Under Test CellViewdsc_DUT=dbOpenCellViewByType("FAULT_DEMO"
"THPixel" "schematic" nil "r");# Finding locations to inject faultsMOS=setof(X dsc_DUT->instances
X->cellName=="nmos4" || X->cellName=="pmos4")
;# List of all possible locationsLOC=dscGetInstSegsOnPins(MOS
list("G" "D" "S"));# Specifying the current fault modeldsc_CURRENT_FAULT=list("FAULT_DEMO"
"mosStuckOpen");# Building the fault scenarioLOCp1=dscLabelLocationsAs("concurrent" LOC)LOCs=dscLabelLocationsAs("sequential"
List(LOC LOCp1))
Dsc_FAULT_SCENARIO=dscBuildScenario(LOCs)
banditsMOS stuck open Integrated in CADENCE
5 Computer-Aided Test (CAT)
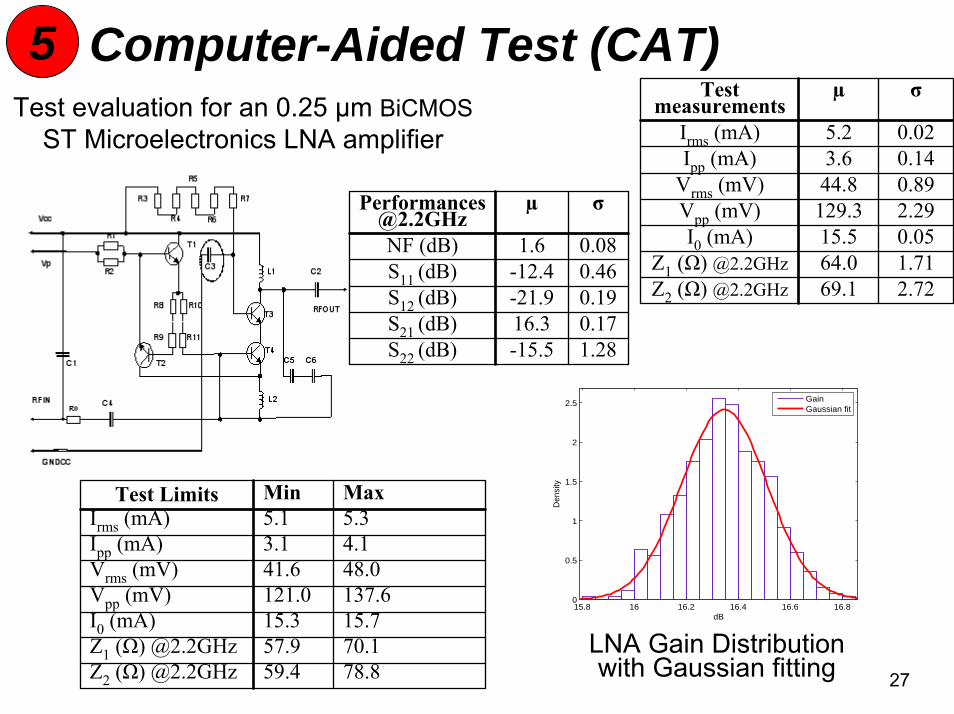
5Test
measurementsµ σ
Irms (mA) 5.2 0.02Ipp (mA) 3.6 0.14
Vrms (mV) 44.8 0.89Vpp (mV) 129.3 2.29I0 (mA) 15.5 0.05
Z1 (Ω) @2.2GHz 64.0 1.71Z2 (Ω) @2.2GHz 69.1 2.72
27
Test evaluation for an 0.25 µm BiCMOSST Microelectronics LNA amplifier
Performances @2.2GHz
µ σ
NF (dB) 1.6 0.08S11 (dB) -12.4 0.46S12 (dB) -21.9 0.19S21 (dB) 16.3 0.17S22 (dB) -15.5 1.28
Computer-Aided Test (CAT)
15.8 16 16.2 16.4 16.6 16.80
0.5
1
1.5
2
2.5
dB
Den
sity
GainGaussian fit
Test Limits Min MaxIrms (mA) 5.1 5.3Ipp (mA) 3.1 4.1Vrms (mV) 41.6 48.0Vpp (mV) 121.0 137.6I0 (mA) 15.3 15.7Z1 (Ω) @2.2GHz 57.9 70.1Z2 (Ω) @2.2GHz 59.4 78.8
LNA Gain Distribution with Gaussian fitting

5 Computer-Aided Test (CAT)Test evaluation for an LNA amplifier
76,1%82,6%
89,1%82,6%
0%
20%
40%
60%
80%
100%
Z1+Z2 NF+S11+S21 Vpp+Irms Specs
Fault coverage evaluation for catastrophic faults considering performances (specs) and test measurements: LNA output voltage (Vpp) and current consumption (Irms) achieve high fault coverage than circuit performances
28
Test N° Test criteria Defects F Y YT Yc D
1 Irms 1, 3, 6 9.2% 89.9% 99.0% 100% 9.2%
2 Ipp None 0% 89.9% 100% 100% 10.0%
3 Vrms 1, 3, 6, 8, 9 58.7% 89.9% 92.1% 98.0% 4.3%
4 Vpp 1, 3, 6, 8, 9 60.6% 89.9% 88.9% 94.7% 4.1%
5 I0 3, 6 12.8% 89.9% 98.6% 100% 8.8%
6 Z1 1, 3, 6, 7, 8, 9
63.5% 89.9% 80.4% 86.0% 3.8%
7 Z2 1, 3, 6, 7, 8, 9
16.9% 89.9% 94.4% 96.1% 8.4%
8 All test criteria
1, 3 ,6, 7, 8, 9
64.2% 89.9% 77.3% 82.7% 3.7%
Fault coverage for most probable single parametric faults has been considered. Measuring of input impedance (Z1) is necessary in addition to Vpp and Irms to have at least partial coverage of all faults
Conclusions6Test techniques for digital circuits (including DFT, BIST)
are today well established.
For analogue and mixed-signal circuits, much research is still required.
The nature of analogue signals, the variety of analogue circuits and performances, the difficulty to provide fault models with wide acceptance, the difficulty to evaluate the quality of the tests, make mixed-signal testing a difficult topic.
The basic analogue test approaches have been presented and DFT/BIST techniques introduced.
Analogue testing techniques are largely multidisciplinary: techniques from signal processing, statistics, optimisation, machine learning, … are required.
29