Embed Size (px)
Citation preview
Missouri Data Team Model and Student Proficiency Levels
Amy M. Cordova
B.A., Missouri Western State College, 1997
M.S., Baker University, 2004
Submitted to the Graduate Department and Faculty of the School of Education of
Baker University in partial fulfillment of the requirements for the degree of
Doctor of Education in Educational Leadership
_________________________________
Dr. James Robins, Ed.D.
Major Advisor
_________________________________
Dr. Dennis King, Ph.D.
Committee Member
_________________________________
Dr. Alicia Wilson, Ed.D.
Committee Member
Date Defended:
November 30, 2017
Copyright 2017 by Amy M. Cordova

ii
Abstract
The use of the Missouri data team model by third, fourth, and fifth grade teachers
in one public school district (School District XYZ) in Missouri was the focus of this
study. Four research questions were utilized as a guide when conducting the research.
Each research question examined whether a statistically significant change in proficiency
levels was experienced by students in one of two subgroups: all students and students
with an IEP. These subgroups were defined by No Child Left Behind (2001).
Additionally, the research questions focused on either mathematics and reading
proficiency levels. Proficiency levels were measured through the use of archived student
assessment data on the STAR Enterprise assessments. A quasi-experimental framework
was followed. Archived assessment data from 985 students in grades 3, 4, and 5 were
analyzed. The archived data were from the 2015-2016 school year. The results of a
multiple measures ANOVA test revealed significant differences across all three waves of
data for all students in grades 3, 4, and 5. The results of a multiple measure ANOVA test
revealed significant differences between the fall and winter wave and the fall and spring
wave of data for students with an IEP in grades 3, 4, and 5. The study provided an
introductory examination into the effectiveness of the data team model as a framework
for teacher collaboration on teaching and learning.

iii
Dedication
To Ryan, your endless love and continued support have provided me with the
courage to continue through this journey despite all the bumps we experienced along the
way.
To Drew, Keegan, Katie and Aaron, I hope that I have stood tall as an example
for you. I hope I have provided you with a glimpse of the joys one can experience when
becoming a lifelong learner. I hope to have inspired you to look towards the sky and
walk the path towards the goals you most desire. Finally, I hope to have demonstrated
how important it is to ask questions and dig deep for the answers to those questions along
life’s journey.
To Dorothy, Bernard, and Dad, even though you are no longer here, thank you for
always believing in me. I know you will be watching and cheering from the other side of
those pearly gates.

iv
Acknowledgements
The credit for the completion of this dissertation must be shared with many. I
have been blessed with a husband and children, whose love and support have made it
possible for me to complete my doctoral degree. They have cooked dinner, drove kids to
practice, and listened to my many thoughts and ideas. They have encouraged the
completion of my dissertation when they could have complained that I was writing
instead of spending time with them.
I appreciate the guidance of my assistance superintendent, Dr. Mike Brown, who
encouraged me to pursue my doctoral degree. Dr. Brown was also there any time I had a
question or needed direction from someone outside of the university. Finally, Dr. Brown
offered his guidance when selecting the focus of the study conducted in this dissertation.
I appreciate the guidance of my major advisor, Dr. James Robins, who was
always my cheerleader. His questions and support, as I sought to ask just the right
questions, helped me to focus my topic on what mattered most. He acted as an anchor
when my ideas grew bigger than the timespan and length of this study. I would also like
to thank the remaining members of my committee, Dr. Li Chen-Bouk, Dr. Dennis King,
and Dr. Alicia Wilson, for investing their time to offer feedback and guidance. The
successful completion of this dissertation would not have been possible without all of
you.

v
Table of Contents
Abstract ............................................................................................................................... ii
Dedication .......................................................................................................................... iii
Acknowledgements ............................................................................................................ iv
Table of Contents .................................................................................................................v
List of Tables ................................................................................................................... viii
List of Figures .................................................................................................................... ix
Chapter 1: Introduction ........................................................................................................1
Background ..............................................................................................................3
Statement of the Problem .......................................................................................12
Purpose of the Study ..............................................................................................13
Significance of the Study .......................................................................................13
Delimitations ..........................................................................................................13
Assumptions ...........................................................................................................14
Research Questions ................................................................................................14
Definition of Terms................................................................................................15
Organization of the Study ......................................................................................17
Chapter 2: Review of the Literature ...................................................................................18
A Focus on Teaching and Learning through Collaboration: A Collaborative
Culture....................................................................................................................22
A Focus on Student Learning ................................................................................25
A Focus on Teaching .............................................................................................31
Staff Development .................................................................................................34

vi
Changing the Culture of Education ........................................................................35
Additional Characteristics of Effective Schools ...................................................35
Data-Based Decision Making in Education ...........................................................37
State Impact ...........................................................................................................39
Chapter 3: Methods ............................................................................................................44
Research Design.....................................................................................................44
Selection of Participants ........................................................................................45
Measurement ..........................................................................................................45
Data Collection Procedures ...................................................................................47
Data Analysis and Hypothesis Testing ..................................................................48
Limitations .............................................................................................................49
Summary ................................................................................................................50
Chapter 4: Results ..............................................................................................................51
Descriptive Statistics ..............................................................................................52
Hypothesis Testing.................................................................................................52
Summary ................................................................................................................58
Chapter 5: Interpretation and Recommendations ..............................................................59
Study Summary ......................................................................................................59
Findings Related to the Literature..........................................................................63
Conclusions ............................................................................................................64
Concluding Remarks ..............................................................................................66
References ..........................................................................................................................68
Appendices .........................................................................................................................75

vii
Appendix A. Percentage of Students Scoring Proficient or Advanced .................76
Appendix B. IRB Documentation ..........................................................................79
Appendix C. Graphics from Missouri Department of Elementary and Secondary
Education - Unpublished .................................................................85
Appendix D. Graphics from Missouri Department of Elementary and Secondary
Education .........................................................................................87
Appendix E. Permission from MO DESE to use Graphics from MOEdu-Sails
Website ............................................................................................91

viii
List of Tables
Table A1. Percentage of Students from the All Subgroup Scoring Proficient or
Advanced on the English Language Arts MAP Assessment ........................76
Table A2. Percentage of Students from the IEP Subgroup Scoring Proficient or
Advanced on the English Language Arts MAP Assessment ........................76
Table A3. Percentage of Students from the All Subgroup Scoring Proficient or
Advanced on the Mathematics MAP Assessment ..........................................77
Table A4. Percentage of Students from the IEP Subgroup Scoring Proficient or
Advanced on the Mathematics MAP Assessment ..........................................77
Table A5 STAR Enterprise Assessment Data Mean Scores ..........................................78

ix
List of Figures
Figure C1. Missouri Collaborative Work: Focused on Effective Teaching/Learning
Practices Bridging Professional Development to Practice .........................85
Figure C2. Visual Representation of Collaborative Data Team Components. ............86
Figure D1. Process Map for Implementation of Collaborative Work Grant ................87
Figure D2. Common Formative Assessment ...............................................................88
Figure D3. Data-based Decision Making .....................................................................89
Figure D4. Synthesis of Collaborative Work Grant 90 No Child Left
Behind (2001) defined the subgroup of all students as every student enrolled in the
school. No Child Left Behind (2001) defined the subgroup, students with an IEP, as
every student who had an IEP, regardless of the area of disability.
1
Chapter 1
Introduction
Data. No matter where one looked, data could be found. Consumer Reports
routinely reported the safety rankings of automobiles. Pharmaceutical companies
advertised their products, including data about success rates and risk factors.
Entertainment and Sports Network (ESPN) broadcasted the latest statistics in every major
league and college sport. Education followed this trend. Much school data were
available for public consumption. School data were collected and statistics were
available on topics such as graduation and dropout rates, teacher salaries, sources of
funding, and student achievement (Snyder & Hoffman, 2002).
No Child Left Behind Act (2001) changed the public perception of educational
data. This law mandated that all school districts use data in the form of testing
accountability to improve student learning. The law also required that student
achievement be measured against state determined goals of proficiency and be reported
publicly. The public report required by the No Child Left Behind Act (2001) was called
the Annual Yearly Progress (AYP). AYP was used as an indicator of student achievement
and an indicator of a school district’s success. Student achievement in AYP was broken
into 10 subgroups: all, American Indian, Asian, Hispanic, Black, White, Limited English
Proficient (LEP), Individual Education Plan (IEP), migrant, and free and reduced lunch
(No Child Left Behind Act, 2001).
Missouri reports indicated that many subgroups in school districts across the state
were not successful in meeting the AYP criteria. The Missouri Department of
Elementary and Secondary Education (MO DESE) responded to the failure in meeting

2
AYP across all subgroups by designing the Collaborative Work Grant (CWG) to improve
student achievement. Through the CWG, Missouri school districts were trained on the
Missouri data team model. The Missouri data team model synthesized the research of
Hattie (2012), Reeves (2004), DuFour & Eaker (1998), Ainsworth (2003), and Schmoker
(1999). Even though multiple subgroups were reported in AYP reports, Missouri chose
to focus the CWG on the proficiency levels of two subgroups, all and IEP. The goal of
training Missouri school districts in the use of the Missouri data team model was to
improve student learning and close the disparity between general education students and
students with disabilities (MO DESE, 2014a). Missouri school districts that met AYP in
the all subgroup, but did not meet AYP in the IEP subgroup, were strongly encouraged to
participate in the CWG (MO EduSail, n.d.a). No Child Left Behind (2001) defined the
subgroup of all students as every student enrolled in the school. No Child Left Behind
(2001) defined the subgroup, students with an IEP, as every student who had an IEP,
regardless of the area of disability.
School District XYZ was one of the Missouri school districts that met the criteria
for the CWG. Data indicated reading and mathematics proficiency levels of general
education student were meeting AYP, while reading and mathematics proficiency levels
in the subgroup, students with an IEP, were not (MO DESE, 2013). School District
XYZ agreed to be part of the CWG, which would provide teachers with training on the
use of the Missouri data team model. The goal of the district participation in the CWG
was to assist students in making academic gains while also diminishing the disparity
between the general education student and the student with an IEP (M. Brown, personal
communication, August 10, 2014).
3
School District XYZ was a typical educational setting filled with data reflecting
student proficiency levels. Some of this data included, but was not limited to, ACT
scores, state testing proficiency levels, local benchmark assessment data, and student
grades. The Missouri data team model provided a collaborative framework for teachers,
guiding the analysis of student data and modification of instruction based upon the
analysis. The study was conducted as a preliminary examination of the effect of
classrooms utilizing the Missouri data team model on reading and mathematics
proficiency levels of students in grades 3-5 attending School District XYZ. Data were
analyzed in the two subgroups, all students and students with an IEP, since these
subgroups were the focus of the CWG (M. Brown, personal communication, August 10,
2014).
Background
In Reflections on a Half-Century of School Reform: Why Have We Fallen Short
and Where Do We Go From Here?, Jennings (2012) discussed three major changes that
happened in public education in the 1960s: mandatory schooling, changes in national
segregation and discrimination, and changes in special education laws and procedures.
Jennings further explained that as a result of these changes, many reform movements
followed with the expectation of increasing student achievement levels. These reform
movements included Site Based Management, Montessori schools, vouchers, Afro-
centered Schools, and homeschooling. The systematic level of impact expected from
these movements was not realized, and student growth remained stagnant (Jennings,
2012).

4
In the 1990s and early 2000s educational theorists began to publish additional
research on school reform. This research required a shift away from the original model
of education, one in which schools were akin to factories, where teachers fulfilled their
duty to present the curriculum and where students were sponges, receiving their
education at the same pace as everyone else, to a new model as a learning organization
that centered around teaching and learning (DuFour & Eaker,1998). DuFour & Eaker
(1998) described characteristics of schools that operated as learning organizations or
Professional Learning Communities (PLC). PLCs had a laser-like focus on learning
where teachers collaboratively sought to answer the following four essential questions.
What do we want our students to learn? How will we know when they learn it? How
will we respond when they don’t learn it? How will we respond if they already know it
(DuFour & Eakers, 1998)? Marzano (2003) described effective schools that made an
impact on the achievement of students. Marzano (2003) outlined the characteristics of
these effective schools as having a guaranteed and viable curriculum, setting challenging
goals and providing meaningful feedback, involving parents and the community,
establishing classrooms that are safe and orderly, and providing ongoing professional
development for staff (Marzano, 2003). Schmoker (1999) described the benefits of data-
based decision-making. In data-based decision-making, educators used student
achievement data as a basis for changes in instruction (Schmoker, 1999). Finally, Hattie
(2016) completed a meta-analysis of 1,137 research studies. Hattie listed the top 150
teaching practices discovered in his meta-analysis and ranked them by effect (Hattie,
2012).

5
Reeves (2004) provided a framework for teacher collaboration which was labeled
as data teams. This framework attempted to create a systemic approach to improve
teaching and learning. As part of the framework, current student data were analyzed by
teacher teams to determine strengths and weaknesses of student performance in the
identified skill or standard. The analysis was followed by an alignment of best teaching
practices to identified weaknesses, targeting instruction to the needs of the learner.
Professional development for teachers was embedded within the entire framework,
allowing teachers to improve their craft, thus improving student learning. Student data
was systematically collected and monitored to determine student progress towards
identified goals, and teaching strategies were adapted to meet the needs of the students at
specified points in the framework. Reeves (2004) purported that when the data team
process was followed with fidelity, all students would make gains. An additional benefit
of the data team process, according to Reeves, was the early identification of students
who might benefit from special education services. By identifying students earlier in
their academic struggles, help could be provided, preventing the current academic failure,
often beyond repair, that students have been required to experience before being assessed
for special education services (Reeves, 2004).
The No Child Left Behind Act (2001) added a sense of urgency to the public
education system and its lack of growth. This act mandated school districts to publicly
report the percentage of students meeting AYP goals. The legislation defined the goal for
student achievement as all students in the United States would become proficient in
reading and mathematics by the year 2020 as measured by state achievement tests. The
No Child Left Behind Act (2001) further stated that state-level achievement tests were to

6
be administered in grades 3-12. Schools not making AYP risked losing continued federal
funding.
After the No Child Left Behind Act (2001) was enacted, a new era of data-based
decision-making began. Educators and other educational leaders were expected to use
student assessment data to inform and guide teaching. Data analysis could be used to
“identify and correct gaps in the curriculum” (Goldring & Berends, 2008, p. 13). Once
these gaps were identified, educational leaders could set and prioritize student learning
goals. These goals were tightly aligned to the curriculum. As instruction took place,
educators would monitor student progress and adapt instruction accordingly. When
inadequate progress was made with individual students or small groups of students,
educational leaders could implement remedial instruction as an intervention to help these
identified students succeed. The various components of the data based decision making
progress moved the school district toward continued improvement and “built a sense of
learning through community” (Goldring & Berends, 2008, p. 7).
The Missouri Department of Elementary and Secondary Education (2014b) stated
that Missouri sub-groups, as defined by No Child Left Behind (2001), were reaching the
achievement level of proficiency at a rate of approximately one out of every three
students. Missouri students who were only part of the all student subgroup, as defined by
No Child Left Behind (2001), were reaching proficiency at a rate of approximately two
out of every three students. Missouri’s national testing ranked anywhere from 18 to 33 in
student proficiency (MO DESE, 2014b). Additionally, the overall proficiency levels of
students in Missouri school districts, as measured by state-level end-of-year testing, was
7
starting to become stagnant, illustrating a lack of continuous improvement towards
federally mandated goals (Williams & Henry, 2013).
Data Teams, also known to Missouri educators as Teacher Collaboration Teams,
were created as a state initiative to address the lack of continuous improvement and were
intended to assist districts to realize the student growth mandated by the No Child Left
Behind Act (2001) in the state of Missouri (MO DESE, Office of Special Education,
2013). Missouri Data Teams synthesized the PLC Model (DuFour & Eaker, 1998),
research on visible learning (Hattie, 2012), research on best practices for effective
schools (Marzano, 2013), and research on data-based decision-making (Schmoker, 1999)
to provide a framework that guided teacher teams through a collaborative conversation
centered around teaching and learning (MO DESE, Office of Special Education, 2013).
Missouri modeled its own framework after the framework for data teams published by
Reeves (2004) and the work on identifying power standards (Ainsworth, 2003) and the
use of common formative assessments (CFAs) for continuous improvement published by
Ainsworth (Ainsworth & Viegut, 2006) according to the Missouri Department of
Elementary and Secondary Education (MO DESE, Office of Special Education, 2013).
Reeves’ (2004) model blended the professional collaboration found in a PLC with
data-based decision-making. Reeves’s systemic framework could be applied to all levels
in the education system, starting at the classroom level and proceeding all the way up to
the district administrative level. The framework was made up of five steps and often
included a sixth step. Step one was collecting and charting data. Step two was analyzing
the data to prioritize need. Step three was to set, review, and revise specific, measurable,
agreed upon, realistic and time-based (SMART) goals. Step four was to select research-

8
based common strategies that correlated with the prioritized needs identified in step two.
Step five was to determine the indicators that measured success. The sixth step, which
was often used in correlation with the other five steps, was to monitor and evaluate the
results of the first five steps (Scott, n.d.).
Ainsworth and Viegut (2006) published work on common formative assessment.
Ainsworth and Viegut identified formative assessments as measures for learning. They
measured students’ current learning and allowed teachers to adjust teaching to meet the
needs of the student. Formative assessments were given routinely throughout a unit of
study. By making assessments common, they would be used by a team or grade level.
These assessments may have been commercially, district, or teacher made (Ainsworth &
Viegut, 2006).
Prior to creating common formative assessments, Ainsworth and Viegut (2006)
identified steps for teachers and administrators to follow in order to identify and
“unwrap” power standards. First, standards were prioritized based on “endurance,
leverage, and ability to prepare students for readiness at the next level of learning”
(Ainsworth, 2003, p. 13). Standards were also evaluated based upon the state end-of-year
test. Next, the power standards were “unwrapped” using a four-step process. The steps
were as follows:
(1) identifying the key concepts and skills embedded in the wording of the
standards; (2) creating a graphic organizer to represent the “unwrapped” concepts
and skills; (3) determining the Big Ideas inherent in the “unwrapped” standards;
and (4) writing Essential Questions to guide and focus classroom instruction and
assessment. (Ainsworth & Viegut, 2006, chapter 4, section 1, para. 2)

9
Ainsworth and Viegut (2006) synthesized the work of Reeves and Schmoker on
data teams and continuous improvement, combining and refining the synthesis to create
his own data team framework. The first step was to show the data graphically using a
chart. The second step was to evaluate student data to determine strengths and
opportunities for improvement. The third step was to set a specific and measurable goal.
The fourth step was to align teaching strategies to the areas for improvement. The final
step was to identify the indicators of success. These meetings were to be held after the
pre-assessment and the post-assessment (Ainsworth & Viegut, 2006).
Missouri Department of Elementary and Secondary Education (2014a)
implemented a five-year Collaborative Work Grant (CWG) with the intent of closing the
gap between two subgroups: all students and students with an IEP. Teacher teams across
the state would be trained to follow the Missouri data team model. The success of data
team models in many school districts across the nation was cited in support of the
investment of time and resources in the CWG (MO DESE, 2014a, 2014b). Specific
school districts in Missouri were strongly encouraged to participate in the CWG. These
were school districts whose subgroup, students with an IEP, had proficiency levels in
reading and mathematics that fell short of AYP target scores while the subgroup, all
students, met the AYP target scores. Districts that chose to participate were required to
make a three-year commitment to the training and implementation of the data team
process (MO DESE, 2014a, 2014b).
School District XYZ was one of the schools that chose to participate in the CWG.
Data provided by the school district (Platte County R-III, 2017) demonstrated that in the
years 2010-2012, 58% to 65% of all students scored in the two top levels on Missouri’s

10
state assessment – the Missouri Assessment Program (MAP) – in mathematics and
English Language Arts. Only 17%-23% of students with an IEP scored in the top two
levels. School District XYZ met AYP requirements for the general education student
population, but not in the sub-group of students with an IEP (see Tables A1, A2, A3, and
A4 in Appendix A).
Missouri utilized the Regional Professional Development Centers (RPDC)
through a common learning package to train teacher teams in districts participating in the
CWG on the use of the Missouri data team model (MO DESE, 2014a) (see Figure C1 in
Appendix C and Figure D1 in Appendix D). Teachers in School District XYZ
collaboratively followed the Missouri data team framework provided in the training.
Student assessments were aligned to selected power standards. Teacher teams analyzed
student performance on the assessments and altered teaching practices to meet student
need as determined by the data analysis (MO DESE, 2014b).
Three years into the CWG commitment, students in School District XYZ took a
new MAP assessment aligned to the newly adopted Missouri Learning Standards. The
results of the test revealed that students in grade 3 were over 65% proficient, while the
results of grades 4-5 were closer to 55% (Platte County R-III, 2017). These results did
not match the expectations of leaders within School District XYZ. Seeking a cause for
this difference, leaders of School District XYZ identified two key differences between
grades 3 and grades 4-5. The first difference was identified after all teachers took a self-
assessment measuring the perceived level of proficiency in the data team model. Grade 3
teachers perceived themselves as having participated in highly proficient data teams,
while grades 4-5 survey results revealed a lower level of self-perception in the

11
proficiency of the data team process (Wilson, 2014). The district identified the second
key difference between grades 3 and grades 4-5 teachers as one of instructional resources
and strategies. Grade 3 teachers agreed upon and used similar curricular resources and
instructional strategies while grades 4-5 teachers varied significantly in their curricular
resources and instructional strategies (M. Brown, personal communication, August 10,
2014). School District XYZ (2014) then implemented a consistent Tier 1 model of
instruction across the K-5 grade levels. In this Tier 1 model of instruction, teachers used
identified curriculum resources and followed a consistent scope and sequence.
School District XYZ believed that teachers had been adequately trained to follow
the data team model and expected teachers to implement the Missouri data team model
with fidelity (M. Brown, personal communication, August 10, 2014). By implementing
the Missouri data team model, it was believed that both non-subgroup and subgroup
student populations would make significant academic achievement (M. Brown, personal
communication, August 10, 2014). Additionally, it was believed that the disparity
between subgroup and non-subgroup academic proficiency levels would begin to be
mitigated (M. Brown, personal communication, August 10, 2014). Measuring the
success of the Missouri data team model became important as allocations were made of
both district time and resources for the Missouri data team model implementation.
Unfortunately, Missouri’s state level testing was in a state of flux and could not be
compared from one year to the next (M. Brown, personal communication, August 10,
2014). A decision was made to use the district’s Tier 1 assessment in mathematics and
reading as a preliminary measure of student success. STAR Enterprise assessments were
chosen because they were nationally normed and consistent from one year to the next.

12
Additionally, strong evidence supported the fidelity of the scale scores presented by
STAR Enterprise assessments (M. Brown, personal communication, August 10, 2014).
The Every Student Succeeds Act (2015) reauthorized the Elementary and
Secondary Education Act (1965). The legislation added an expectation “that all students
in America be taught to high academic standards that will prepare them to succeed in
college and careers” (U.S. Department of Education, 2015, para. 8). Students continued
to participate in statewide assessments that were aligned to the high academic standards.
Results of assessments were available to educators, families, students, and community
members. Funding was no longer tied to student proficiency levels as measured through
these assessments. Local control over evidence-based innovations was granted. Future
investments which provided access to high-quality preschool education were sustained.
Finally, the Every Student Succeeds Act (2015) “maintain[ed] an expectation that there
[would] be accountability and action to effect positive change in our lowest-performing
schools, where groups of students [were] not making progress, and where graduation
rates [were] low over extended periods of time” (U.S. Department of Education, 2015,
para. 8).
Statement of the Problem
School District XYZ believed that the implementation of a consistent Tier 1
model of instruction and the consistent use of the Missouri data team model would
improve student achievement (M. Brown, personal communication, August 10, 2014).
School District XYZ was able to mandate the use of consistent curriculum resources and
a scope and sequence for grades 3-5 in mathematics and reading. School District XYZ
had not examined the effect of the data team process on student achievement. A study of

13
student achievement in mathematics and reading, both in the subgroup and non-subgroup
population, was examined to explore the difference between student achievement before
and after the full implementation of the data team model.
Purpose of the Study
The purpose of this study was to determine the change in academic achievement
in mathematics and reading as measured by STAR Enterprise assessments. Additionally,
the change of academic achievement in reading and mathematics in the subgroup,
students with an IEP, as measured by STAR Enterprise assessments, was studied. These
measurements would be taken at the beginning, middle, and end of the year to determine
if a statistically significant change occurred while students were in classrooms that
participated in the Missouri Collaborative Work Grant and implemented the Missouri
data team model initiative.
Significance of the Study
This study is significant because it may add to a growing body of research on the
data team school improvement model. This study is one of the first to explore the impact
of the data team process on the academic growth of both the general education population
and the students with an IEP population. As one of the initial districts to implement the
data team model, the study may also provide an avenue to explore when looking for ways
to improve student achievement.
Delimitations
The following delimitations were set for this study:
● School year data from 2015-2016 were used.
● Only grades 3-5 data were used.

14
● Tier 1 assessment data of STAR Enterprise reading and STAR Enterprise
mathematics assessments collected by the district were used.
● The only subgroups examined were all students and students with an IEP
Assumptions
The following assumptions were made when this study was conducted:
● The STAR assessments are valid.
● Teachers followed the data team framework with fidelity.
● Teachers in grades 3-5 followed the district-provided scope and sequence.
● Teachers used the curriculum resources provided according to the scope and
sequence.
● Students put forth their best effort when taking all of the assessments used in
this study.
Research Questions
RQ1. To what extent was there a change in student achievement after
implementing the data team model as measured in the fall, winter, and spring assessments
windows of the STAR Reading testing?
RQ2. To what extent was there a change in student achievement after
implementing the data team model as measured in the fall, winter, and spring assessments
windows of the STAR Mathematics testing?
RQ3. To what extent was there a change in student achievement in the subgroup
of students with an IEP after implementing the data team model as measured in the fall,
winter, and spring assessments windows of the STAR Reading testing?

15
RQ4. To what extent was there a change in student achievement in the subgroup
of students with an IEP after implementing the data team model as measured in the fall,
winter, and spring assessments windows of the STAR Mathematics testing?
Definition of Terms
Data team. The data team is comprised of group of professionals, such as
teachers and principals, who collaborate on student data using the Data Team Process
(MO DESE, 2014a & 2014b).
Data team process. A six-step process is used by a collaborative data team to
collect and analyze data. This analysis is then used to inform instruction (MO DESE,
2014b).
Tier 1 Instruction. Tier 1 instruction is given to all students. It is evidence-
based and scientifically researched. Typically, the term tier 1 instruction is used
interchangeably with core reading and mathematics instruction when the curriculum is
aligned with state standards (RTI Action Network, 2017).
SMART goal. SMART is an acronym. The S represents specific. The M
represents measurable. The A represents agreed upon. The R represents realistic. The T
represents time-based. SMART goals are set throughout the data-team process and are
used as a measure of success (Conzemius & O’Neil, 2001).
Common formative assessment. Common formative assessments are
assessments that are created to be given as a pre- and post- assessment. The assessments
are used to compare student growth. These assessments are designed by a collaborative
team and are administered periodically. Common formative assessments blend question
types and mimic the format of district and state assessments (Ainsworth, 2003).

16
Standardized assessment. A standardized assessment is “a test that requires all
test takers to answer the same set of questions, or a selection of questions from a common
bank of questions in the same way and is scored in a standard manner” (Glossary of
Educational Reform, 2015, para. 1).
Data-based decision-making. Data-based decision-making is a collaborative
process to solve educational problems through which teams follow a step-by-step
framework to analyze, reflect, and revise student data with a goal of improving teaching
and learning (MO EduSail, n.d.a, para 1).
Student with disability. The Individuals with Disabilities in Education Act
(2004) defines a child with a disability as a child with “mental retardation, hearing
impairments (including deafness), speech or language impairments, visual impairments
(including blindness), serious emotional disturbance, orthopedic impairments, autism,
traumatic brain injury, other health impairments, or specific learning disabilities; and
who, by reason thereof, needs special education and related services.”
Individualized education plan. The Individualized Educational Plan (IEP) is “a
written statement for each child with a disability” that outlines the student’s achievement
level, goals, and plans to meet those goals in the educational setting. The IEP also
includes the special services the students receives to meet the written plan. The IEP is a
legal document that is created by a team of educators and parents. (Definition of
Individualized Education Plan, 2001).
Next generation assessment. Assessments that are designed to assess a student’s
achievement level, regardless of ethnic or economic background, against the Common
Core State Standards. These assessments are computer-based and interactive. Next

17
generation assessments are purported to assess “higher-order skills such as critical
thinking, problem-solving, and analyzing sources to write arguments and informational
essays” (Partnership for Assessment of Readiness for College and Career Readiness,
2017, section 2 paragraph 2.)
Power standards. A power standard is a standard that has been prioritized above
other standards for its endurance in life, necessity for future grade level success, and
alignment to state tests (Ainsworth, 2003).
Progress monitoring. Progress monitoring is a systematic process in which
student learning is tracked through data on student performance. The data is collected
from formative assessments that measure the level of student understanding against
established levels of learning. The use of the data helps the educator align future lessons
to the needs of the student (Fisher & Frey, 2015).
Organization of the Study
This study is organized into five chapters. Chapter 1 is an introduction and
overview of the study. Chapter 2 reviews the historic literature available in regards to the
data team model in Missouri. Chapter 3 identifies the participants of the study and the
research design and states the four research questions, the hypothesis for each, and the
statistical analysis that was run on the data to determine statistical significant. Chapter 4
reports the results of the analysis. Chapter 5 identifies implications of the study and
future considerations in relationship to this study.

18
Chapter 2
Review of the Literature
Modern day school reform grew out of the teachings and philosophy of John
Dewey. Dewey believed that a free public education should be provided for all children
from kindergarten through 12th grade. Dewey believed in equity of education for all
children, unlike the reality of late 1800s, when children of privilege were the primary
recipients of education. Dewey contended that without an education, children in less
fortunate homes would repeat the same patterns of poverty as their parents. Dewey
emphasized that schools should train all students to be productive, cooperative members
of society, regardless of their background (Warde, 1960).
During the first half of the 20th century, several major social events influenced
American education and highlighted the need for reform. Many soldiers returned home
from The Great War, which later became known as World War I, with no career, no
home, no education, and no way to support themselves. As a result, many were
unemployed and homeless (Ford, 2008). Following The Great War, the country plunged
into the Great Depression, “the deepest and longest-lasting economic downturn in the
history of the Western industrialized world” (A & E Television Network, 2017, para 1).
The United States began to emerge from the Great Depression when it entered World
War II. Fearing a repeat of the economic problems in the aftermath of World War I, the
Servicemen’s Readjustment Act (1944) provided an education for veterans of World War
II (U.S. Department of Veteran Affairs, 2013).
The Union of Soviet Socialist Republics launched its first artificial satellite,
Sputnik I, in 1957. Sputnik’s “beeping signal from space galvanized the United States to

19
enact reforms in science and engineering education so that the nation could regain the
technological ground it appeared to have lost to its Soviet rival” (Powell, 2007, para. 2).
The reforms were left to scientists instead of educators. Many science practices,
including hands-on laboratory experiments, introduced by these scientists, continued to
be used in modern-day classrooms (Garber, 2007).
Political events in the mid-1900s were the catalyst for additional school reform.
Two such examples were the civil rights movement and women’s suffrage. These
political events migrated into the education field. One such example occurred in the
court case of Brown vs. Board of Education of Topeka (1954). The Supreme Court
declared that segregation in education was illegal. The initial result of the ruling was the
busing of students in and out of predominantly African American urban schools. Soon
after, other types of segregation were also ruled illegal, including native language,
disability, and economic status (Pankake & Littleton, 2012).
As a result of this lawsuit and others that followed, Congress began passing laws
that dramatically changed the education frontier. One of those acts was the Elementary
and Secondary Education Act (1965). This act declared that an equal education for all
resulted in a better life and less poverty. Funding for Title 1 programs enabled school
districts to meet the needs of the economically disabled and comply with the criterion of
the Elementary and Secondary Education Act (1965). The Elementary and Secondary
Education Act (1965) was amended two years later and provided funding for English
Language Learners (Social Welfare History Project, 2016). Congress amended the
Elementary and Secondary Education Act two more times by 1980. Each reauthorization

20
assisted educationally disadvantaged students with low socioeconomic status
(McDonnell, 2005).
The Education for All Handicapped Children Act (1975) was the culmination of
several pieces of educational legislation and key landmark court cases. The Education
for All Handicapped Children (1975) was amended to the Individuals with Disabilities
Education Act of 1977. Commonly referred to as PL 92-142, the Individuals with
Disability Education Act supported “states and localities in protecting the rights of,
meeting the individual needs of, and improving the results for … infants, toddlers,
children, and youth with disabilities and their families” (U.S. Office of Special Education
Programs, n.d, p. 2). A free, appropriate public education was guaranteed to every child
no matter the disability or location within the United States.
President Reagan’s National Commission on Excellence in Education (1983)
delivered a report entitled A Nation at Risk: The Imperative for Educational Reform. The
report stated that education was “presently being eroded by a rising tide of mediocrity
that threaten[ed] our very future as a Nation and a people” (para. 2) The contents of the
report also sought “to generate reform of [the] educational system in fundamental ways
and to renew the Nation’s commitment to schools” (National Commission on Excellence
in Education, 1983, para. 4). The contents of the report sparked educational reform
across the nation, which became known as the Excellence Movement (DuFour & Eaker,
1998).
Eleven years later, the United States government passed the Improving America’s
Schools Act (1994) which tied federal funding to state-administered end-of-year test
scores in an attempt to make school districts accountable for the learning of all students.

21
No Child Left Behind (2001) further tied school district funding to state administered
end-of-year test scores with the goal that all students would become proficient in reading
by 2020. The Individuals with Disabilities Act (2004) ensured education for all children
by providing funding for students with disabilities from birth through age three and age
three through 21.
While the various legislative acts were enacted and court decisions made, many
schools began their own reform movements that strived to restructure schools. The goal
of these movements was to give schools and parents more choices. Voucher programs
allowed students to choose the school they would attend through the use of public
education dollars. Afro-centered, Waldorf, Montessori, progressive, religious, and
charter schools provided different approaches towards education. Homeschooling
allowed parents to educate their children at home. Site-based management allowed
individual schools to be the decision makers. Many of these reform movements are still
alive in public education today (Jennings, 2012).
With limited success realized in educational reform, President George Bush
convened a summit meeting with state governors to address education in 1989 (DuFour
& Eaker, 1998). The result of this summit was a set of six national educational goals
geared towards closing “the skill-and-knowledge gap” (U.S. Department of Education,
1991, p. 5). These six educational goals were later amended to include eight educational
goals (DuFour & Eaker, 1998). Congress created the National Education Standards and
Improvement Council in 1994 to “review and endorse state and national standards”
(DuFour & Eaker, 1998, chapter 1, section 3, para. 4). National control of the standards
was transferred to state control in 1996 (DuFour & Eaker, 1998).

22
Educational experts started examining more student focused approaches in the
late 1900s as a practical means to accomplish the philosophical, political, and theoretical
changes expected in education. The outcomes-based education movement guided
teachers in determining what students needed to learn and how they would learn it.
Marzano (2003) studied and reported the characteristics of effective schools. DuFour &
Eaker (1998) developed the framework for professional learning communities from the
work of previous researchers. Hattie (2016) completed over 1,137 meta-analyses and
discovered the teaching strategies with the highest effect sizes.
A Focus on Teaching and Learning through Collaboration: A Collaborative Culture
DuFour & Eaker (1998), Marzano (2003, 2007), Hattie (2012), and Schmoker
(1999) investigated school improvement and discovered the importance of collaboration
among teachers. DuFour & Eaker (1998) stated, “if schools [were] to be significantly
more effective, they must break from the industrial model upon which they were created
and embrace a new model that enable[d] them to function as learning organizations”
(chapter 1, section 5, para. 2). Embracing a school model centered around teaching and
learning required each individual in the school to participate in deliberate collaboration.
Through collaboration, the focus on teaching and learning could be accomplished and the
school could function as a learning organization (DuFour & Eaker, 1998).
Research showed that one of the largest effects of teacher collaboration was
student academic growth (Schmoker, 1999). Since schools were designed to assist
students in achieving academic growth, there was a continued need for teacher
collaboration. Developing and nurturing teacher collaboration required teachers to
possess an understanding of collaboration. Teacher collaboration was based on teams,
23
had a collegial atmosphere, and included the willingness to share knowledge and wisdom
(November, 1998; Schmoker, 1999). Schmoker (1999) expanded the characteristics of
teacher collaboration to include goal-oriented teaching and environments of collegial
support.
DuFour & Eaker (1998) defined the collaborative inquiry process of teacher
collaboration as one focused on teaching and learning. The collaborative inquiry process
expected participants to ask reflective questions. The practice of asking questions
occurred regularly. The answers to the reflective questions changed the instruction that
occurred within the classroom. Reflections on student learning that revealed expected
proficiency levels yielded a desire to improve teaching practices and continuously
improve learning. Reflections that revealed students were struggling to learn resulted in
the research and use of new instructional methods aligned to student needs (DuFour &
Eaker, 1998).
Highly collaborative teacher teams resulted in measurable improvements in
student achievement and superior resolutions for student learning problems (Little, 1990;
Schmoker, 1999). Schmoker found that teachers on collaborative teams supported each
other’s weaknesses with their own strengths and provided regular aid to novice teachers.
Finally, research revealed “an expanded pool of ideas, materials, and methods” (Little,
1990, p. 527) were developed through the regular collaboration of teacher teams.
Student growth was realized through a focus on continuous improvement
(Schmoker, 1999). Educators communicated and collaborated to build a culture of
continuous improvement (DuFour & Eaker, 1998.) DuFour & Eaker stated that the
culture of continuous improvement

24
[was] more likely to be sustained when teachers participate[d] in reflective
dialogue: observe[d] and react[ed] to one another’s teaching; jointly develop[ed]
curriculum and assessment practices; work[ed] together to implement new
programs and strategies; share[d] lesson plans and materials, and collectively
engage[d] in problem solving, action research, and continuous improvement.
(DuFour & Eaker, 1998, chapter 6, section 3, para. 12)
The continuous improvement realized through collaboration required structure.
The structures for collaboration were carefully planned and cultivated (DuFour & Eaker,
1998). The structures helped teachers foster a sense of continuous improvement (DuFour
& Eaker, 1998). The structures were cyclical and repeatable. The cycles included
“setting goals, reflecting, planning, experimenting, analyzing results, and revising plans”
(DuFour & Eaker, 1998, chapter 12, section 5, para. 22).
While the results of collaboration are positive and desired, DuFour & Eaker
(1998) cautioned that a substantive change of this kind would be difficult due to “an
existing system with a well-entrenched structure and culture” (chapter 3, section 1, para.
21). One hurdle to effective schools was the isolation felt by teachers (DuFour & Eaker,
1998). This was a tradition ingrained in traditional schools (DuFour & Eaker, 1998).
This isolation needed to be replaced by collaboration. The purpose of the collaboration
needed to be explicit (DuFour & Eaker, 1998, chapter 6, section 5, para. 20).
Creating a collaborative culture in the school required a significant investment of
time and resources within the organization (DuFour & Eaker, 1998). “The schools that
are successful in implementing significant change regard[ed] teacher collaborative time
for teachers as a critical resource – an essential tool that enable[d] teachers to enhance

25
their individual and collective effectiveness” (Louis, Kruse, & Marks, 1996, cited in
DuFour & Eaker, 1998). The school district needed to address public perception, because
“Americans tend[ed] to regard any time that a teacher is not standing in front of a class as
‘down time’” (DuFour & Eaker, 1998, chapter 6, section 5, para. 15).
Collaborative teams were formed with a purpose (DuFour & Eaker, 1998).
Collaborative teams may have shared students. DuFour & Eaker (1998) further stated
that collaborative teams may be comprised of teachers who taught a common grade level
or who taught a common content area. Teacher teams may also be created as task forces
or for professional development.
A Focus on Student Learning
DuFour & Eaker (1998) stated that the goal of education should be “to help every
child live a successful and satisfying life and make a contribution to community and
country” (chapter 4, section 2, para. 3). DuFour & Eaker (1998), Marzano (2003, 2007),
and Hattie (2012) offered guidance on the most effective ways to meet this goal. DuFour
& Eaker stated that “teachers collectively increase[d] the effectiveness of their schools
when they collectively identif[ied] and work[ed] toward the result they desire[d],
develop[ed] collaborative strategies to achieve their goals, and create[d] systems to assess
student learning” (DuFour & Eaker, 1998, chapter 8, section 1, para. 1 ). While
continuing to search for a model of instruction that could be replicated in the classroom,
Marzano (2007) discovered no succinct framework of instruction. Marzano discovered
that there were common characteristics of effective instruction. They were effective
instructional setting, effective curriculum design, and effective classroom management.

26
Goal setting. Meeting the goal of student achievement required educators to
define the goals for student learning (DuFour & Eaker, 1998). Marzano (2003) ranked a
guaranteed and viable curriculum as having high impact on student learning. Such a
curriculum clearly identified essential learning standards that could be delivered within
the duration of learning available throughout a school year These learning standards
were sequenced in such a way that students were given “ample opportunity to learn”
(Marzano, 2003, p. 30).
Once learning goals were defined, educators engaged in a cycle that used
assessment to guide instruction and fostered a commitment for continuous improvement
(DuFour & Eaker, 1998). Monitoring the progress of students through this cycle ensured
that the focus stayed on student learning (DuFour & Eaker, 1998). Monitoring also
allowed for the timely feedback of student achievement towards the learning goals
(Marzano, 2003).
Assessment. “Testing typically happen[ed] at the end of the year, [was] evaluative
in nature, and the feedback [was] almost always too late to help the student or the teacher
make meaningful use of the information (Reeves in Ainsworth & Viegut, 2006,
Foreword, section 1, para. 1). “However, by coupling large-scale assessment measures
with a powerful in-classroom assessment system, educators [could] utilize the building
blocks needed to make a profound difference in the achievement of entire classes of
individuals” (Ainsworth & Viegut, 2006, Foreword, section 2, para. 2). Assessment,
when used within the curriculum design, allowed teachers to evaluate the proficiency
levels of students before and during teaching and adjust instruction to the needs of the
student (DuFour & Eaker, 1998).

27
Hattie (2012) supported this research when he published the results of his meta-
analysis, providing four components to effective lesson planning. Hattie defined one
component of effective lesson planning as teachers having knowledge about student
academic abilities before beginning a new lesson. Teachers measured student proficiency
through various methods. One way was through the administration of common formative
assessments. Common formative assessments could be given formally through the use of
paper and pencil tests or informally through classroom observations during a lesson.
Measurement could also be taken through individual student conferencing where teachers
participated in one-on-one conversations with students about student learning. Records
of the student’s level of success were recorded and used as a planning board (Hattie,
2012).
Marzano (2010) reported his findings on formative assessments. According to
Marzano (2010), both teachers and students benefitted from formative assessments in the
classroom. Students were given feedback on specific skills or content. This allowed
students to target their learning and seek continuous improvement of the skill or content
being taught. Assessment results provided teachers’ feedback on student proficiency
levels. Teachers then knew what needed to be reviewed or retaught before moving
forward with lessons.
Marzano (2010) described some assessments as obtrusive. Obtrusive assessments
include multiple-choice, matching, alternative choice, true/false, multiple response, fill in
the blank, or short response. Obtrusive assessments also included oral responses, formal
oral reports, probing discussions, and demonstrations. Marzano (2010) described other
assessments as unobtrusive. Unobtrusive assessments included student-generated

28
assessments Regardless of the type, formative assessments provided both teachers and
students with important feedback on current student proficiency levels. Similar to the
research of Hattie (2012), Marzano (2010) found that it was important to track student
progress on learning goals using the formative assessments. The tracking provided a
written record that could be used as a reference when planning lessons.
Hattie (2012) described an additional characteristic of the effective classroom as
one where teachers adjusted teaching based on the learning rate of students.
Differentiation took place in small groups or individual conferences. The differentiation
in the effective classroom was purposeful. The use of common formative assessments
throughout the lesson delivery provided teachers with immediate data used to determine
who needed small group instruction or individual conferences (Ainsworth & Viegut,
2006).
Assessments needed to be aligned to the goals of learning and used to effectively
monitor a student’s progress towards mastery of the goals (DuFour & Eaker, 1998).
Teacher awareness of the rate of student learning as students progressed throughout the
lesson was another component of effective lesson planning (Hattie, 2012). Teachers used
daily formative assessments to assist in this measurement. The formative assessment
allowed a teacher to monitor which students met and did not meet the daily expectations
of the lessons (Hattie, 2012). Marzano (2017) gave examples of effective formative
assessments and included voting techniques and response boards that were repeated
multiple times throughout a lesson. These assessments could be administered to the
whole class or to individual students (Marzano, 2017). Teachers then adapted lessons to

29
meet the students’ needs, constantly moving student achievement closer to the identified
educational outcome (Hattie, 2012).
Planning for learning. Hattie (2012) reported that another component to effective
instruction was the careful analysis of learning standards to determine the expected level
of student proficiency. The selection of materials and methods of instruction aligned to
student need and clearly taught the stated goals (DuFour & Eaker, 1998). The framework
of the lesson was designed upon research-based strategies (Marzano, 2003).
Marzano (2017) described a process that teachers could follow when planning for
instruction. The first step was “to unpack the standard, identify what is essential, and
organize the content into a proficiency scale” (Marzano, 2017, chapter 1, section 6, para.
5). The teacher would then determine what the student needed to know and how the
student was expected to show the learning (Hattie, 2012; Marzano, 2003). Once the
criteria of student mastery was defined, the teacher carefully planned instruction that was
aligned to the expected student outcomes (Hattie, 2012). The planned “instruction should
be clear and focused” (DuFour & Eaker, 1998, chapter 10, section 4, para. 32) on the
criteria.
Teacher collaboration in lesson planning. The collaboration that occurred on
effective teams supported the lesson planning and was “really action research – carefully
conducted experimentation with new practices and assessments of them” (Schmoker,
1999, chapter 1, section 5, para. 1). Schmoker’s research indicated that to conduct the
action research, teams must work within a specific framework. Schmoker defined the
framework for teacher collaboration as beginning with a question. The beginning
question examined the effectiveness of decisions made at the end of the previous

30
collaborative meeting. For example, a team might examine the effectiveness of an agreed
upon strategy or a team might examine difficulties that team members experienced while
implementing an agreed upon research based strategy. Once the question was answered,
the team proceeded with the “most urgent learning problem” (Schmoker, 1999, chapter 1,
section 8, para. 6). The meeting ended with a plan and commitment to address the urgent
learning problem identified in the previous step of the collaborative framework. This
cycle was repeated at every team meeting and often only required a 30-minute
commitment per week (Schmoker, 1999).
In order for the framework of meetings to be successful, Schmoker (1999) stated
that it must be centered around student performance data. Teacher teams analyzed the
student performance and set meaningful goals. Then, teachers monitored students’
progress towards those goals by regularly analyzing new student performance data.
Schmoker contended that this goal-oriented focus on student performance through the use
of data resulted in large-scale, substantial gains in a short time. These successes
energized the team into implementing alternative instruction on a regular basis, instead of
reverting back to the less effective teaching methods often found in the classroom
(Schmoker, 1999).
Selection of teaching methods and material. The meta-analysis of Hattie (2012)
revealed that specific teaching practices yielded high effect sizes during lesson delivery.
One teaching practice was for students to collaborate and engage in meaningful dialogue.
Another was student engagement in learning through teacher invitation. Goal setting was
another quality of the highly effective classroom. These goals were transparent and

31
resulted in student awareness of the criteria for academic success. Students were able to
evaluate themselves based on the pre-determined criteria.
Classrooms with highly effective teachers provided explicit instruction and
deliberate practice based on student need. Specific feedback was given frequently to
assist students in moving closer to success. Hattie’s research demonstrated the
importance of lesson delivery and the correlation between effective teaching practices
and higher levels of student achievement (Hattie, 2012).
A Focus on Teaching
As Marzano (2007) conducted his research on effective schools, he discovered
that “the one factor that surfaced as the single most influential component of an effective
school is the individual teachers within the school” (Marzano, 2007, Introduction, section
1, para. 2). Marzano (2003) researched the difference in student achievement based on
teacher effectiveness and discovered that the least effective teachers have students who
only gain 14 percentile points in one year contrasted to highly effective teachers, whose
students gain 53 percentile points in one year. An average student gains 34 percentile
points in achievement in one school year. These results in student achievement are
compounded over a three-year period. Students in classrooms with highly effective
teachers gained 83 percentile points in three years, contrasted to students in classrooms
with the least effective teachers who only gained 29 percentile points in three years
(Marzano, 2003). Marzano synthesized the research of many others to identify three
factors that assist teachers in becoming high effective. Effective teachers used effective
instructional strategies, had good classroom management, and utilized a classroom
curriculum design (Marzano, 2003).

32
Collaborative reflections upon teaching and learning allowed teachers to learn
beside each other (DuFour & Eaker, 1998). These reflections developed collegiality
(Marzano, 2003). This was extremely important when considering the expectation for
new teachers to teach at the same level as veteran teachers (DuFour & Eaker, 1998).
Hattie’s (2012) research revealed that a component of effective lesson planning occurred
when teachers worked together, having conversations about student learning. Teacher
lesson planning was directly impacted. Teachers were able to collaborate on the most
effective teaching strategies to use in the classroom and align those strategies to the
lessons delivered in the classroom. The collaboration created a culture where
“professional teachers are students of teaching and consumers of research” (DuFour &
Eaker, 1998, chapter 10, section 4, para. 23).
Ainsworth and Viegut (2006) provided a model teachers could follow to assess
student learning and collaboratively learn from one another. First teachers would
“unwrap” the power standard.
The four-step “unwrapping” process include[d] a simple technique for (1)
identifying the key concepts and skills embedded in the wording of the standard;
(2) creating graphic organizers to represent the unwrapped content and skills; (3)
determining the Big Ideas inherent in the “unwrapped” standards, and (4) writing
Essential Questions to guide and focus classroom instruction and assessment.
(Ainsworth & Viegut, 2006, chapter 4, section 1, para. 2)
The development of common formative assessments followed the “unwrapping”
process and included a timeline for implementation. An analysis of the student
performance on the common formative assessments indicated student strengths and

33
weaknesses. Reflection of the analysis led to the selection of best practices that were
research-based and aligned to student needs. Teachers agreed upon strategies to use in
the classroom and timelines for re-assessment. The result was a cycle of continuous
improvement focused on teaching and learning (Ainsworth & Viegut, 2006).
Schmoker conducted research on continuous school improvement. Schmoker
(1999) illustrated the positive impact of educators who utilized and analyzed student
results to guide instruction. Furthermore, Schmoker pointed out that this analysis should
be conducted frequently in order to reap the largest benefits for students. Schmoker
advocated for teacher collaboration as a key in the analysis process. According to
Schmoker, effective teacher collaboration resulted in exponentially more effective
teaching practices in the classroom.
Hattie’s (2012) research also revealed the importance of teacher reflection.
Reflection was also part of Ainsworth and Viegut’s (2006) model. Hattie (2012) further
explained that actions occurring after lessons were delivered resulted in high effect sizes.
During effective moments, teachers dialogued with other teachers about their teaching
experiences. They examined the extent to which students learned the expected content.
They determined the skills students still needed to acquire. Teachers then looked at their
own teaching to determine which practices had the highest effect on student learning and
shared the identified practices with their colleagues. Finally, teachers engaged in debates
with their peers about the effect strategies had on student learning, agreeing on the most
effective ones to use in the future.

34
Staff Development
Teachers were an important resource for schools. As such, schools invested time
and resources in high quality staff development. DuFour & Eaker (1998) defined staff
development as “content [that] expand[ed] the repertoire of teachers to meet the needs of
student who learn[ed] in different ways” (DuFour & Eaker, 1998, chapter 12, section 6,
para. 4). Quality staff development was based on the research behind the qualities of
good teaching and could be addressed in collaborative teams (DuFour & Eaker, 1998).
DuFour & Eaker (1998) stated that “the attention to different learning styles, focus on
authentic problems, opportunities for guided practice, and chance to work with others that
reflect good teaching also reflect[ed] good staff development and were evident in the
professional learning community” (chapter 12, section 7, para. 3). Members of
collaborative teams following a framework for collaboration were able to coach each
other towards the mastery of new skills (DuFour & Eaker, 1998).
Teacher collaboration also provided opportunities for “enhancing the pedagogical
skills in a reflective, cooperative manner” (Marzano & Waters, 2009, p. 56). Teachers
followed the framework of collaboration to systematically evaluate the effectiveness of
instructional strategies. Collaborative discussions resulted in common lesson plan design
and common instructional language. Observing master teachers utilizing effective
instructional strategies was another component of professional development built into
collaborative teacher teams. Action research was conducted on instructional strategies
when collaborative teams evaluated assessment data (Marzano & Waters, 2009).

35
Changing the Culture of Education
Research supported the development of collaborative teams that followed a cycle
of continuous improvement to meet the learning needs of their students. DuFour & Eaker
(1998) explained that an urgency must be presented but that urgency “does not require a
persistent state of panic” (chapter 3, section 3, para. 3). DuFour & Eaker (1998)
cautioned that sustaining a change in practice at this level would be difficult. DuFour &
Eaker (1998) also stated that “the most effective strategy for influencing and changing an
organization’s culture [was] simply to identify, articulate, model, promote, and protect
the shared values” (chapter 7, section 2, para. 1). This simple strategy offered a strategy
to overcome the difficulty expected when attempting to effect a cultural change within a
building.
DuFour & Eaker (1998) stated that a collaborative culture could be sustained
through common goals and procedures. Common goals and procedures included
reflecting upon teaching and learning at an individual level. Individual reflection and
refinement of teaching practices led educators to a deeper level of analysis and
refinement of their own craft. The refinement of teaching practices at an individual level
in a collaborative environment provided the opportunity for the analysis and refinement
of teaching at the team level. Ultimately, this culture of continuous improvement created
a culture of true professionalism.
Additional Characteristics of Effective Schools
Marzano (2003) defined additional characteristics of effective schools that
indirectly affected student learning. These characteristics are supported by numerous
studies. Marzano (2003) defined one such characteristic as parent and community

36
involvement. Parents and schools had open pathways for communication. Parents were
involved in the day-to-day operations of the school. Parents and community members
were able to have “some voice in key school decisions” (Marzano, 2003, p. 48).
Marzano (2003) further explained that these avenues for communication created a sense
within the family that education was important. When one perceived something as
important, the person spent more time caring for the important item. In this case, school
became important to the student and parent.
Another component of effective schools was a safe and orderly environment
(Marzano, 2003). Clear rules and expectations for school behavior were established.
Consequences for not following school rules were established and followed. Students
were taught self-discipline. Detection systems for students prone to violence were
developed. By creating a safe and orderly environment, students and teachers had the
necessary psychological energy to attend to teaching and learning (Marzano, 2003).
Effective schools were also described as ones where teachers established a safe
and orderly environment in the classroom. This was accomplished by “establishing and
enforcing rules and procedures” (Marzano, 2003, p. 89). Consequences for inappropriate
behavior were established and enforced. Relationships between students and teachers
were developed and nurtured. An awareness of the characteristics of students was
developed by teachers and “helped them maintain a healthy emotional objectivity with
their students” (Marzano, 2003, p. 102). Research revealed that classrooms that were
safe and orderly were not chaotic. These classrooms enhanced student learning.
Classrooms with ineffective classroom management were chaotic and often inhibited
student learning (Marzano, 2003).

37
Data-Based Decision-making in Education
Data analysis could be used to “identify and correct gaps in the curriculum”
(Goldring & Berends, 2008, p. 13). Once these gaps were identified, educational leaders
could set and prioritize student learning goals. These goals were tightly aligned to the
curriculum. Next, as instruction took place, building level administrators would monitor
student progress and adapt instruction accordingly. When inadequate progress was made
with individual students or small groups of students, educational leaders would
implement remedial instruction as an intervention to help these identified students
succeed. This process moved the school district toward continuous improvement and
“built a sense of learning through community” (Goldring & Berends, 2008, p. 7).
The process. Initially, data-based decision-making began as a top down approach
with the administrators and involved teachers later in the later steps. The first three steps
were completed by a few building leaders selected by the administrator. These few
individuals were responsible for the data. This team would collect and aggregate the
data. They would also disaggregate the data into subgroups that aligned with the No
Child Left Behind Act (2001). Once the data were aggregated and disaggregated, the
team would create a structured warehouse of data. Finally, the team would compile
graphics that displayed the data needed for teachers to use (Boudett, City & Murnane,
2007).
The next step in the process was analyzing the data. During this process the
administrator either led the meeting or appointed a leader. The meeting was attended by
all teachers who were responsible for educating the students and whose data were being
examined. Teachers sought to understand how the students were thinking and they

38
analyzed the assessment data. The teacher attempted to see the data through the students’
eyes. Digging into the data was the next step in the process. Administrators asked
teachers to challenge assumptions about teaching and learning. They did this by looking
at each data set. The teacher team, under the leadership of the administration, would
triangulate all data points to identify common vocabulary and learner centered problem(s)
that were preventing proficiency (Boudett et al., 2007).
After understanding learning, educators examined their own instruction.
Administrators had to be very careful when analyzing teaching practices so teachers did
not feel inadequate. Instead, administrators ensured that this step was viewed as an
opportunity to refine the craft of teaching. By examining both internal and external
resources, teachers were asked to determine the most effective teaching strategies that
aligned with previously identified learner-centered problems. Once these strategies were
identified, teachers agreed on their implementation (Boudett et al., 2007).
The development of an action plan followed. All parts of the action plan were
recorded. The administrator assisted educators in aligning student-centered problems
with agreed upon teaching strategies and the curriculum. The time and duration of each
teaching strategy was agreed upon (Boudett et al., 2007).
Creating an assessment plan was the next component of the data-based decision-
making cycle. Assessments measuring progress towards the goal were chosen for the
short, medium, and long term. Teachers agreed to administer these assessments. A
calendar of assessment administration was be developed and recorded for future use.
Finally, the team would set SMART goals for each assessment (Boudett et al., 2007).

39
The final step of the data-based decision-making process was to set the plan in
action. Teachers were expected to follow the plan. The administrators were tasked with
checking in on the teachers, ensuring that teacher performance followed the recorded
plan. Administrators also checked in with teachers to make sure learning outcomes were
being met. Teachers were given the opportunity to inform administrators about what
additional resources and support they needed. Administrators reminded the teachers
often of the expected student outcomes. Finally, when the goals were met, administrators
celebrated with teachers and students (Boudett et al., 2007).
State Impact
Research conducted by Marzano (2003, 2007, 2017) and Hattie (2012) revealed
the positive impact that teachers could have on student learning. DuFour & Eaker’s
(1989) research provided a framework that school leaders could use to guide teachers in
creating larger effect sizes in their instruction. Various data-based decision-making
models provided school districts a step-by-step process to follow when using student data
to implement the framework of the PLC. The packet adopted by Missouri and many
other states was based on research of the National Center on Educational Outcomes
(University of Minnesota, 2016).
Missouri Collaborative Work Grant. In 2012-2013, the Office of Special
Education of MO DESE initiated the Collaborative Work Grant (CWG) as a response to
an achievement imbalance between students with disabilities and students without
disabilities. Missouri districts that had an imbalance in proficiency levels between
students with disabilities and without disabilities, that had a measurable number of
students with disabilities, that were not a priority or focus school due to not meeting AYP

40
standards, and were not in a district that had lost accreditation, were invited to participate.
The CWG, as defined by MO DESE, was “an educational framework designed to
improve teaching and learning practices at the classroom level with the goal of improved
outcomes for all students, especially students with disabilities” (MO DESE, 2015, p. 1)
(see Figure C2 in Appendix C). The CWG was based upon the work of Hattie, DuFour
& Eaker, Marzano, and others. However, the main focus was on the work of Visible
Teaching and Learning by Hattie (2012). The CWG’s desired outcome was to create and
maintain a teacher/learner relationship through the use of a building-wide model. This
relationship would be developed through the following key components: “collaborative
culture, data-based decision-making, common formative assessment, and effective
teaching/learning practices” (MO DESE, 2015, p. 2). Additionally, all work conducted at
the building level through the CWG would be aligned to Missouri Learning Standards
(MO DESE, 2015) (see Figure D1 in Appendix D).
MO DESE published the following eight frames of mind as expectations of the
collaborative work. These were based upon the work of Hattie (2012) in Visible
Learning for Teachers: Maximizing Impact on Learning.
1. Teachers/leaders believe that their fundamental task is to evaluate the
effect of their teaching on students’ learning and achievement.
2. Teachers/leaders believe that success and failure in student learning is
about what they, as teachers or leaders, did or did not do… We are
change agents!
3. Teachers/leaders want to talk more about the learning than the
teaching.

41
4. Teachers/leaders see assessment as feedback about their impact.
5. Teachers/leaders engage in dialogue not monologue.
6. Teachers/leaders enjoy the challenge and never retreat to “doing their
best.”
7. Teachers/leaders believe that it is their role to develop positive
relationships in classrooms/staffroom.
8. Teachers/leaders inform all about the language of learning. (MO Edu-
Sail, n.d.b, para. 6)
Six key practices were identified as part of the data team model. These
practices were based upon the research and publications of the National Center on
Educational Outcomes. When implemented with fidelity, these six practices
resulted in the largest amount of student academic improvement.
Key Practice 1: Use Data Well
Key Practice 2: Focus Your Goals
Key Practice 3: Select and Implement Shared Instructional Practices
Key Practice 4: Implement Deeply
Key Practice 5: Monitor and Provide Feedback and Support
Key Practice 6: Inquire and Learn. (MO DESE, 2015, page 2)
MO DESE set additional guidelines for districts participating in the CWG.
Building administrators were expected to support the data team process. All teachers
were expected to participate in the data team process. Each building selected an area in
either English Language Arts or mathematics as the focus of the collaborative team work.
Each team would follow the framework provided in the CWG. Teachers would support

42
each other in all parts of the collaborative team process. One hundred percent
implementation of the collaborative data team model was expected or the building would
be removed from participation (MO DESE, 2015).
MO DESE defined the expected practices of the collaborative work to be
completed in teams. Building staff would learn more effective teaching practices through
the collaborative work of the data team. A common research-based teaching strategy
would be used to teach the identified area of either English Language Arts or
mathematics. Common Formative Assessments (CFA) would be developed and aligned
to the selected standards (see Figure D2 in Appendix D). All students, including those
with an Individualized Education Plan, would be administered the CFA. The results of
these CFAs would then be used as a tool by the collaborative team to measure the
effectiveness of the common teaching strategies (MO DESE, 2015).
The Missouri Department of Elementary and Secondary Education then partnered
with the Professional Development Network (PDN) of Missouri to develop a set of
common training packages to be delivered to the school districts that committed to the
Collaborative Work Grant (see Figure C1 in Appendix C). The training packages taught
teachers and administrators to be an effective data team by following a common
framework. As part of the framework, data teams identified effective teaching and
learning practices to be implemented in classrooms (see Figure D3 in Appendix D). Data
teams also developed CFAs to measure the effect of instruction. Teachers in the data
team were expected to administer the CFAs and use the results in data-based decision-
making (MO DESE, Office of Special Education, 2013).

43
MO DESE described the data-based decision-making cycle as a combination of
the work of Reeves and Ainsworth. In Missouri’s cycle, data teams began by collecting
and charting data. Afterwards, they analyzed the data and prioritized learning targets.
The next step in the process was to set SMART goals. Once the SMART goals were
established, teams decided upon agreed upon research-based instructional methods (e.g.,
reciprocal teaching). Finally, teams determined indicators for results. At that point, the
teams implemented the plan and monitored results. The process could be revisited at any
step as teams determined need during the monitoring phase (MO Edu-Sail, 2017a) (see
Figure D3 in Appendix D).
The PDN also created checklists for districts to use as an implementation fidelity
check. The intent of these checklists was to provide districts with a quantitative
measurement that could be used to ensure that districts were consistently implementing
the data team process. The checklists were rubrics that described expected criteria of the
collaborative team. Districts could use these short and focused fidelity checklists to self-
monitor and adjust implementation. The checklists were based upon the following pillar
topics: collaborative data teams, data-based decision-making, common formative
assessments, and effective teaching/learning practices. Supplemental topics were
available for using technology in classroom instruction and school-based implementation
of coaching. Finally, schools could use the checklists to evaluate teaching and learning in
the following topics: assessment of capable learners, feedback, reciprocal teaching,
student teacher relationships, spaced versus massed practice, metacognition, and direct
instruction (MO Edu-Sail, 2017b) (see Figure D4 in Appendix D).

44
Chapter 3
Methods
This dissertation study had two purposes. The first purpose was to determine if
there was a change of student achievement in reading and mathematics after the full
implementation of the data team model as measured by a nationally standardized
achievement test. The second purpose was to determine if there was a change of
academic achievement in the subgroup, students with an IEP, as measured by a nationally
standardized achievement test. To investigate these issues, the researcher collected
archived student achievement data from third through fifth grade students on the STAR
Enterprise Reading assessment and the STAR Enterprise Mathematics assessment.
Students were administered these tests during the 2015-2016 school year. The study was
designed to examine whether students experienced a change in achievement levels
between the fall, winter, and spring testing windows after the implementation of the data
team model. The results were used as a preliminary examination into the effectiveness of
the data team model upon student achievement. Chapter 3 contains an explanation of
research methodology for this study. This chapter also includes a description of the
research design, selection of participants, measurement, data collection procedures, data
analysis, and hypothesis testing and limitations.
Research Design
A quasi-experimental quantitative research design including archival data was
utilized for this study. The variables included in the research were the achievement test
scores in STAR reading and STAR mathematics. These assessments were administered

45
three times, including the fall, winter, and spring assessment windows. These windows
were established by Renaissance Learning as national testing windows.
Selection of Participants
The population for the study included all students in grades 3, 4, and 5 attending a
Missouri public school that implemented the data team model to address curricular areas
in need of improvement. The sample consisted of all students in grades 3, 4, and 5
attending School District XYZ during the 2015-2016 school year. These students were
members of classrooms whose teachers implemented the data team model. Students in
the sample were given the same district-defined Tier 1 instruction as other students in the
grade level. All students in the sample were assessed using nationally standardized
STAR reading and mathematics assessments.
Measurement
The instrumentation used in this study included the STAR reading and STAR
mathematics assessments. These measurements were used to monitor the academic
achievement of the elementary schools in School District XYZ.
STAR Enterprise. Renaissance Learning (2013) stated that STAR Enterprise
assessments are computer adaptive tests given in an online setting and designed to assist
teachers in quickly assessing student learning in reading and mathematics. Because the
assessments are adaptive in nature, each question’s difficulty is adjusted based on the
student’s answer to the previous question. STAR Enterprise assessments base their
adaptive testing on item response theories. Questions asked during the assessment are
skills-based. Results are reported as scale scores and allow educators to print various
reports. Those reports can then be used to modify classroom instruction, predict student
46
achievement, or progress monitor student achievement based on Response to Intervention
frameworks. The size of the test item bank allows educators to choose how often
students take the assessment (Renaissance Learning, 2013).
STAR Enterprise reading assessment. Renaissance Learning (2013) further
stated that the STAR Enterprise reading assessment consisted of 34 questions
administered online in an average 15-minute timeframe. This assessment evaluated
reading skills appropriate for grades K-12 based on Common Core reading standards.
The evaluation was composed from an item bank with more than 5,000 questions,
allowing for multiple assessments per year (Renaissance Learning, 2013).
To estimate the reliability of the STAR Reading Enterprise assessment, two
statistical analysis were conducted on a random national sampling of more than 1.2
million students who completed the STAR Reading Enterprise assessment between
September 2012 and June 2013. An internal consistency reliability analysis yielded a
combined internal reliability of 0.97 with a range from 0.93-0.95. A test-retest
correlation coefficients analysis yielded a combined estimate of 0.90 for all grade levels
with a range of 0.54-0.85 (Renaissance Learning, 2013).
The STAR Reading Enterprise assessment was used to measure both “reading
comprehension and a broad range of other reading skills” (Renaissance Learning, 2013,
p. 22). In order to ensure the validity of this measure, the content of the assessments was
aligned to state and national curriculum standards, including the Common Core State
Standards. The average correlation between the content of the STAR Reading Enterprise
assessment and state and national curriculum standards ranged from 0.60-0.87, which is
considered strong (Renaissance Learning, 2013)

47
STAR Enterprise mathematics assessment. Renaissance Learning (2013) further
published that the STAR Enterprise Mathematics assessment consisted of 34 questions
administered online in an average 20-minute timeframe. This assessment evaluated
mathematics achievement appropriate for grades K-12 based on the Common Core
mathematics standards. The evaluation came from an item bank with more than 5,000
questions, allowing for multiple assessments per year (Renaissance Learning, 2013).
To estimate the reliability of the STAR Math Enterprise assessment, two
statistical analyses were conducted on a random national sampling of more than 1.2
million students who completed the STAR Math Enterprise assessment between
September 2012 and June 2013. An internal consistency reliability analysis yielded a
combined internal reliability of 0.97 with a range from 0.90-0.95. A test-retest
correlation coefficients analysis yielded a combined estimate of 0.93 for all grade levels
with a range of 0.76-0.84 (Renaissance Learning, 2013).
The STAR Math Enterprise assessment was used to measure “a broad range of
mathematics skills” (Renaissance Learning, 2013, p. 25). In order to ensure the validity
of this measure, the content of the assessments was aligned to state and national
curriculum standards, including the Common Core State Standards. The average
correlation between the content of the STAR Math Enterprise assessment and state and
national curriculum standards ranged from 0.55-0.80, which is considered moderate to
strong (Renaissance Learning, 2013)
Data Collection Procedures
Prior to the statistical analysis of the data, the researcher asked the district on June
3, 2017 (see Appendix B) for permission to use the student data. Next, the researcher

48
submitted a proposal on July 5, 2017, for research to the Baker University Institutional
Review Board (see Appendix B). This review board served as a safeguard to the human
subjects of this study. The approval from IRB was received on July 24, 2017 (see
Appendix #B. Once approved, archived STAR assessment data in reading and
mathematics were made available to the researcher. Archived STAR assessment data
were obtained from School District XYZ’s data base on STAR Enterprise assessments by
the Director of Informational Services on September 4, 2017. The data were collected
and organized on an Excel spreadsheet and imported into IBM® SPSS® Statistics
Faculty Pack 21 for Windows for statistical analysis.
Data Analysis and Hypothesis Testing
RQ1. To what extent was there a change in student achievement after
implementing the data team model as measured in the fall, winter, and spring assessments
windows of the STAR Reading testing?
H1. There was a change in student achievement after implementing the data team
model as measured in the fall, winter, and spring assessments windows of the STAR
Reading assessment.
RQ2. To what extent was there a change in student achievement after
implementing the data team model as measured in the fall, winter, and spring assessments
windows of the STAR Mathematics testing?
H2. There was a change in student achievement after implementing the data team
model as measured in the fall, winter, and spring assessments windows of the STAR
Mathematics assessment.

49
RQ3. To what extent was there a change in student achievement in the subgroup
of students with an IEP after implementing the data team model as measured in the fall,
winter, and spring assessments windows of the STAR Reading testing?
H3. There was a change in student achievement in the subgroup of students with
an IEP after implementing the data team model as measured in the fall, winter, and spring
assessments windows of the STAR Reading assessment.
RQ4. To what extent was there a change in student achievement in the subgroup
of students with an IEP after implementing the data team model as measured in the fall,
winter, and spring assessments windows of the STAR Mathematics testing?
H4. There was a change in student achievement in the subgroup of students with
an IEP after implementing the data team model as measured in the fall, winter, and spring
assessments windows of the STAR Mathematics testing.
For RQ1-RQ4, a repeated measures ANOVA test was used to address each of the
four research questions. This statistical test was used as there was a categorical variable
with three categories: fall, winter, and spring assessment window. The fall assessment
window occurred before students participated in the data team process. The winter
assessment window occurred mid-way through the data team process. The spring
assessment window occurred at the end of the school year when students had been part of
the data team process for the entire school year. The significance level was set at .05.
Limitations
The samples of this study were taken from students attending School District
XYZ in the third, fourth, and fifth grade, so caution should be utilized when generalizing
the results of this study to other grade levels and other school districts. Since this study

50
was quasi-experimental in nature, no causality conclusion should be reached between
student achievement and the data team model. Other factors that may have impacted this
study include student anxiety level upon being administered a computer-based
assessment and student health conditions.
Summary
For this study, students in grades 3-5 completed the STAR Enterprise Reading
and STAR Enterprise Math assessments. STAR Enterprise assessments results were
chosen as a part of this study because School District XYZ administered the assessments
as a measure of student achievement. The results of the statistical analysis upon these
assessments were used to explore the influence of the data team model on student
mathematics and reading achievement of students in grades 3-5. These results are
reported in Chapter 4.

51
Chapter 4
Results
This dissertation study had two purposes. The first purpose was to
determine if there was a change of student achievement as measured by a nationally
standardized achievement test. The second purpose was to determine if there was a
change of academic achievement in the subgroup, students with an IEP, as measured by a
nationally standardized achievement test. No Child Left Behind (2001) defined the
subgroup of all students as every student enrolled in the school. No Child Left Behind
(2001) defined the subgroup, students with an IEP, as every student who had an IEP,
regardless of the area of disability.
The STAR Enterprise Reading Assessment and the STAR Enterprise
Mathematics Assessment were utilized in this study. Grades 3, 4, and 5 students
attending School District XYZ were administered the STAR Enterprise Reading
Assessment and the STAR Enterprise Mathematics Assessment in three waves
that corresponded with STAR Enterprise’s national testing windows: fall, winter,
and spring. The research was conducted in an attempt to explore the difference
between student achievement before and after the full implementation of the data
team model in School District XYZ. The results of this study were intended to
explore the impact of the data team process on the academic growth of the all
subgroup and the subgroup composed of students with an IEP. Finally, the results
of this study could be used as an avenue to explore when looking for ways to
improve student achievement. Chapter 4 presents the results of the data analysis

52
for the hypotheses associated with each of the research questions posed in the
study.
Descriptive Statistics
The target population for this research study was limited to all third,
fourth, and fifth grade student attending School District XYZ during the 2015-2016
school year. The sample consisted of 985 students, of which 315 (32.0%) were third
grade students, 324 (32.9%) were fourth grade students, and 346 (35.1%) were fifth grade
students. The 985 students were comprised of 489 (49.6%) male and 496 (50.4%)
females. One hundred of the students (10.2%) comprised the subgroup of students:
students with an IEP. No Child Left Behind (2001) defined the subgroup, students with
an IEP, as every student who had an IEP, regardless of the area of disability.
Hypothesis Testing
The results of the hypothesis testing to address the four questions that
guided this study are discussed in this section. Each research question is followed
by its corresponding hypothesis statement. The method used to test each
hypothesis is described as well as the results of each test. The significance level of
p = .05 was utilized for all statistical analysis. Repeated measures ANOVA tests
were used to test the research hypotheses. The variables for research questions 1-4
were the fall, winter, and spring assessment window. The IBM® SPSS®
Statistics Faculty Pack 21 for Windows was utilized to analyze the assessment
data for this research study.

53
RQ1. To what extent was there a change in student achievement after
implementing the data team model as measured in the fall, winter, and spring assessments
windows of the STAR Reading testing?
H1. There was a change in student achievement after implementing the data team
model as measured in the fall, winter, and spring assessments windows of the STAR
Reading assessment.
Outliers were detected, and 105 outliers were found. The outliers were excluded
from the following analysis. A one-way repeated measures ANOVA was conducted to
compare student reading achievement in fall wave of testing, winter wave of testing, and
spring wave of testing conditions. Sphericity was assumed (χ2(2) = 2.953, p = .228).
There was a significant difference of reading achievement across the three times, F
(2,1162) = 204.904, p < .001. Bonferroni-corrected paired-samples t tests were used to
make post hoc comparisons between conditions. A first paired sample t test indicated that
there was a significant difference between the fall testing window (M = 518.33, SD =
168.78) and the winter testing window (M = 575.34, SD = 172.61). A second paired
sample t test indicated that there was a significant difference between the winter testing
window (M = 575.34, SD = 172.61) and the spring testing window (M = 605.65, SD =
189.99). A third paired sample t test indicated that there was a significant difference
between the fall testing window (M = 518.33, SD = 168.78) and the spring testing
window (M = 605.65, SD = 189.99) (see Table A5 in Appendix A).
The results indicated that students’ scores grew in reading achievement from the
fall testing window to the winter testing window to the spring testing window.
Additionally, there was a statistically significant increase in student reading achievement

54
between the fall testing window and the winter testing window, between the winter
testing window and the spring testing window, and between the fall testing window and
the spring testing window. These results indicated that there was an increase in student
reading achievement after implementing the data team model between each of the
assessment windows: fall, winter, and spring.
RQ2. To what extent was there a change in student achievement after
implementing the data team model as measured in the fall, winter, and spring assessments
windows of the STAR Mathematics testing?
H2. There was a change in student achievement after implementing the data team
model as measured in the fall, winter, and spring assessments windows of the STAR
Mathematics assessment.
Outliers were detected and 65 outliers were found. The outliers were excluded
from the following analysis. A one-way repeated measures ANOVA was conducted to
compare student mathematics achievement in fall wave of testing, winter wave of testing,
and spring wave of testing conditions. Or for the ANOVA, results indicated that the
sphericity assumption was violated (χ2(2) = 16.578, p < .001), and thus the degrees of
freedom associated with the F tests were adjusted based on Huynh-Feldt ε-correction
values. There was a significant difference of mathematics achievement across the three
times, F (1.964, 1549.626) = 891.664, p < .001. Bonferroni-corrected paired-samples t
tests were used to make post hoc comparisons between conditions. A first paired sample t
test indicated that there was a significant difference between the fall testing window (M =
642.17, SD = 89.49) and the winter testing window (M = 679.29, SD = 81.83). A second
paired sample t test indicated that there was a significant difference between the winter

55
testing window (M = 679.29, SD = 81.83) and the spring testing window (M = 717.59,
SD = 85.39). A third paired sample t test indicated that there was a significant difference
between the fall testing window (M = 642.17, SD = 89.49) and the spring testing window
(M = 717.59, SD = 85.39) (see Table A5 in Appendix A).
The results indicated that students’ scores in mathematics grew from the fall
testing window to the winter testing window to the spring testing window. Additionally,
there was a statistically significant increase in student mathematics achievement between
the fall testing window and the winter testing window, between the winter testing
window and the spring testing window, and between the fall testing window and the
spring testing window. These results indicated that there was an increase in student
mathematics achievement after implementing the data team model between each of the
assessment windows: fall, winter, and spring.
RQ3. To what extent was there a change in student achievement in the subgroup
of students with an IEP after implementing the data team model as measured in the fall,
winter, and spring assessments windows of the STAR Reading testing?
H3. There was a change in student achievement in the subgroup of students with
an IEP after implementing the data team model as measured in the fall, winter, and spring
assessments windows of the STAR Reading assessment.
Among 100 IEP students, four outliers were found and excluded from the
following analysis. A one-way repeated measures ANOVA was conducted to compare
student reading achievement in fall wave of testing, winter wave of testing, and spring
wave of testing conditions. Sphericity was assumed (χ2(2) = 2.960, p =.228). There was a
significant difference of the reading achievement across the three times, F (2,126) =

56
5.087, p = .008. Bonferroni-corrected paired-samples t tests were used to make post hoc
comparisons between conditions. A first paired sample t test indicated that there was a
significant difference between the fall testing window (M = 264.25, SD = 132.78) and the
winter testing window (M = 293.33, SD = 134.49). A second paired sample t test
indicated that there was a significant difference between the fall testing window (M =
264.25, SD = 132.78) and the spring testing window (M = 294.06, SD = 157.58) (see
Table A5 in Appendix A).
The results indicated that students’ reading achievement scores grew from the fall
testing window to the winter testing window to the spring testing window. Additionally,
there was a statistically significant increase in student reading achievement between the
fall testing window and the winter testing window and between the fall testing window
and the spring testing window. Furthermore, the results indicate there was no statistically
significant change between the winter testing window and the spring testing window.
These results indicated that there was an increase in student reading achievement after
implementing the data team model between each of the assessment windows except
between the winter and spring assessment window.
RQ4. To what extent was there a change in student achievement in the subgroup
of students with an IEP after implementing the data team model as measured in the fall,
winter, and spring assessments windows of the STAR Mathematics testing?
H4. There was a change in student achievement in the subgroup of students with
an IEP after implementing the data team model as measured in the fall, winter, and spring
assessments windows of the STAR Mathematics testing.

57
Among 100 IEP students, nine outliers were detected and excluded from the
following analysis. A one-way repeated measures ANOVA was conducted to compare
student mathematics achievement in fall wave of testing, winter wave of testing, and
spring wave of testing conditions. Sphericity was assumed (χ2(2) = 5.176, p = .075).
There was a significant difference of mathematics across the three times, F (2,144) =
29.526, p < .001. Bonferroni-corrected paired-samples t tests were used to make post hoc
comparisons between conditions. A first paired sample t test indicated that there was a
significant difference between the fall testing window (M = 491.47, SD = 105.11) and the
winter testing window (M = 542.81, SD = 92.27). A second paired sample t test indicated
that there was a significant difference between the fall testing window (M = 491.47, SD =
105.11) and the spring testing window (M = 564.48, SD = 111.32) (see Table A5 in
Appendix A).
The results indicated that students’ mathematics scores grew from the fall testing
window to the winter testing window to the spring testing window. Additionally, there
was a statistically significant increase in student mathematics achievement between the
fall testing window and the winter testing window and between the fall testing window
and the spring testing window. Furthermore, the results indicate there was no statistically
significant increase between the winter testing window and the spring testing window.
These results indicated that there was a change in student mathematics achievement after
implementing the data team model between each of the assessment windows except
between the winter and spring assessment window.

58
Summary
This chapter utilized descriptive statistics to describe the demographics of the
sample including gender, grade level, and the sub-population of students with an IEP.
The results of a repeated measures ANOVA were presented to provide evidence of
change in student achievement in reading and mathematics achievement. Chapter 5
includes the study summary, overview of the problem, purpose statement and research
questions, review of the methodology, major findings, and findings related to the
literature, conclusions, implications for actions, and recommendations for future research.

59
Chapter 5
Interpretation and Recommendations
Education experienced many reform movements throughout the last century. The
focus of reform evolved from compulsory education to school structure to teaching and
learning. Legislation and social movements served as the catalyst for this educational
reform. The most recent reform, focusing on teaching and learning, yielded positive
results in student achievement yet required a paradigm shift in school structure. Such a
shift contrasted with the deeply ingrained practices of the past. Modern day researchers
provided school districts, schools, and teachers evidence-based frameworks and strategies
to use when effecting such a shift. The Missouri Department of Elementary and
Secondary Education provided Missouri school districts with the Missouri data team
model, a framework purported to guide teachers, schools, and school districts in
implementing the most current research on teaching and learning. However, little
research had been completed on the effect of the Missouri data team model on student
learning. This study examined the effect of the Missouri data team model on the reading
and mathematics proficiency levels of students attending grades 3-5 in School District
XYZ after the full implementation of the Missouri data team model. This chapter
provides a summary of the findings and recommendations for future research related to
the effect of the Missouri data team model on student proficiency levels in reading and
mathematics.
Study Summary
The purpose of this study was to determine the change in academic
achievement in mathematics and reading as measured by STAR Enterprise assessments

60
after full implementation of the Missouri data team model. Additionally, the change of
academic achievement in reading and mathematics in the subgroup, students with an IEP,
as measured by STAR Enterprise was studied. No Child Left Behind (2001) defined the
subgroup of all students as every student enrolled in the school. No Child Left Behind
(2001) defined the subgroup, students with an IEP, as every student who had an IEP,
regardless of the area of disability. The following section summarizes the current study.
An overview of the problem, the purpose of the study and research questions, review of
methodology, the study’s major findings, conclusions, and recommendations for future
research are provided.
Overview of the problem. A reflection on the accomplishments of school reform
prior to the 1990s by politicians and educators resulted in “a startling conclusion: There
weren’t any” (Fiske, 1992, p. 24, cited in DuFour & Eaker, 1998). The Restructuring
Movement of the 1990s reaped much of the same result, “leaving students virtually
untouched and [schools] unable to make a real difference in meeting the challenges they
faced” (DuFour & Eaker, 1998, chapter 1, section 3, para. 11). DuFour & Eaker (1998),
Hattie (2012), and Marzano (2003) offered hope and guidance for meeting the challenges
that American schools faced. A description of effective schools emerged from their
research. Creating a culture in the classrooms of today that was effective had its own set
of challenges. “The way that teachers were trained, the way the hierarchy operated, and
the way education was treated by political decision makers resulted in a system that was
more likely to retain the status quo than to change” (Fullan, 1993, p. 3). A framework for
collaboration and the use of data-based decision-making in the school was developed
from the additional research of Ainsworth (2003), Schmoker (1999) and Reeves (2004).

61
Little research was available to determine the consistent effectiveness of the framework
in helping educators meet the challenges of students today.
Purpose statement and research questions. The study in this dissertation was
conducted for two purposes: (1) to determine the change in academic achievement in
mathematics and reading as measured by STAR Enterprise assessments in reading and
mathematics and (2) to determine the change in academic achievement of reading and
mathematics in the subgroup, students with an IEP, as measured by STAR Enterprise.
Archived data from the assessments administered at the beginning, middle, and end of the
year was analyzed to determine if a statistically significant change occurred while
students were in classrooms that participated in the Missouri data team initiative. Four
research questions guided this study to investigate these ideas.
1. To what extent was there a change in student achievement after implementing
the data team model as measured in the fall, winter, and spring assessments
windows of the STAR Reading testing?
2. To what extent was there a change in student achievement after implementing
the data team model as measured in the fall, winter, and spring assessments
windows of the STAR Mathematics testing?
3. To what extent was there a change in student achievement in the subgroup of
students with an IEP after implementing the data team model as measured in
the fall, winter, and spring assessments windows of the STAR Reading
testing?
4. To what extent was there a change in student achievement in the subgroup of
students with an IEP after implementing the data team model as measured in

62
the fall, winter, and spring assessments windows of the STAR Mathematics
testing?
Review of the methodology. A quasi-experimental quantitative research design
including archival data was utilized for this study. The variables included in the research
were the achievement test scores in STAR reading and STAR mathematics. These
assessments were administered three times, including the fall, winter, and spring
assessment window. Archived assessment data for students in grades 3, 4, and 5
attending a Missouri public school that implemented the data team model during the
2015-2016 school year were collected. A repeated measures ANOVA test was used to
address each of the four research questions. The significance level was set at .05.
Major findings. Findings of the current study are presented relative to the
research questions. Results of hypothesis testing for research question one were
significant. The results indicated that students in the subgroup, all students, experienced
a statistically significant change from the fall to winter, from winter and spring, and from
fall to winter waves of testing in reading achievement.
Results of hypothesis testing for research question two were significant. The
results indicated that students in the subgroup, all students, experienced a statistically
significant change from the fall to winter, from winter and spring, and from fall to winter
waves of testing in mathematics achievement. Results of hypothesis testing for research
question three were significant. The results indicated that students in the subgroup,
students with an IEP, experienced a statistically significant change from the fall to winter
and from fall to spring waves of testing in reading achievement. Results of hypothesis
testing for research question three were significant. The results indicated that students in

63
the subgroup, students with an IEP, experienced a statistically significant change from the
fall to winter and from fall to spring waves of testing in mathematics achievement.
Findings Related to the Literature
This section examines the study’s findings as they relate to the literature
connected to the Missouri data team model and student achievement. Specifically, the
research focused the impact of the reform on teaching and learning. Key findings in
research are presented that resulted in the current understanding of evidence-based or
research-supported best practices in teacher collaboration and effective schools. The
Missouri data team model attempted to synthesize this research and provide a framework
for teachers to follow when improving teaching and learning.
The results of the study support an expectation that students will show growth
throughout the year when attending classrooms that implement the Missouri data team
model. The results of this study provided support that the implementation of the
Missouri data team model may have a correlation with continuous improvement in
student proficiency levels. While not directly related, the study also supported the work
of DuFour & Eaker (1998), Marzano (2003, 2017) and Hattie (2012), which served as the
foundation of the Missouri data team model. At the heart of all three bodies of research
is the assumption that best practices in teaching are centered around student needs for
learning and are met best through a collaboration of educators. Schmoker (1999) further
purports that continuing a framework of data analysis leads to changes in teaching to
meet the needs of students. Schmoker (1999) and Ainsworth (2003, 2006) served as the
guide for the Missouri data team model. While not directly related, the Missouri data
team model further supports the learning of students by synthesizing the work of DuFour
64
& Eaker (1998), Marzano (2003), Hattie (2012), Reeves (2004), Ainsworth (2003), and
Schmoker (1999) into a cycle of continuous improvement based on action research. This
study shows a possible correlation between student learning and continued improvement
of student proficiency levels when students attend classrooms that implement the
Missouri data team model.
Conclusions
This section provides conclusions drawn from the current study. Implications for
action, recommendations for future research, and concluding remarks are provided.
Implications for action. The findings from this study have implications for
School District XYZ as well as other schools and districts in the state of Missouri. The
implications of this study could be used as a preliminary support for the implementation
of the Missouri data team model in classrooms and its effect on student proficiency
levels. The results of this study indicated that the subgroup of students, all, who were in
classrooms with full implementation of the Missouri data team model experienced
continuous improvement throughout the school year. The results of this study indicated
that the subgroup of students, students with an IEP, who were in classrooms with full
implementation of the Missouri data team model experienced continuous improvement
from fall to winter, but did not experience continuous improvement from winter to
spring. In an attempt to determine why student proficiency levels in this subgroup were
stagnant from winter to spring, education leaders need to evaluate the choice of power
standards made by teachers and their alignment to the assessment tools utilized in the
Missouri data team model. Ainsworth (2003) and Schmoker (1999) provided guidance
on choosing the best standards, developing assessments, and evaluating student

65
performance on the assessments. Another assessment that needs to be made by education
leaders in an attempt to determine the cause for stagnant scores in students with an IEP
from winter to spring is the impact each teaching strategy had upon student learning
throughout the use of the Missouri data team model. This study will allow educators to
study the alignment and success of each strategy to the needs of individual students in
these classrooms. DuFour & Eaker (1998) and Hattie (2012) provided support for these
practices when targeting continuous improvement of student proficiency. Finally,
education leaders need to assess if each step in the data team model was followed
collaboratively and whether it impacted student proficiency levels on achievement tests.
Gaps in student achievement, especially those not making continuous improvement, will
likely continue without purposeful collaboration (DuFour & Eaker, 1998).
Recommendations for future research. The current study allowed the
researcher to evaluate whether students in classrooms with full implementation of the
Missouri data team model experience a change in reading and mathematics proficiency
levels from the beginning to the end of the school year. This study was unique as it was
one of the first to examine proficiency levels within School District XYZ once the
curriculum scope and sequence was mandated and district level resources were identified.
The study was a preliminary examination of the Missouri data team model on student
proficiency levels using Tier 1 assessment data. Because the study featured one public
school district during the 2015-2016 school year, additional research would be necessary
to make generalizations to a broader population. The first recommendation would be to
extend the current study by expanding the sample to include multiple years of student
data. A multi-year sample would allow for the examination of change in student

66
proficiency levels across years and from spring to the following fall. The second
recommendation is to extend the current study by comparing growth of student
proficiency with other Missouri school districts following the Missouri data team model.
The third recommendation is to extend the current study by comparing growth of student
proficiency with other Missouri school districts who are and are not utilizing the data
team framework for collaboration.
While this study addressed student growth in reading and mathematics
achievement, the study cannot determine definitively if the growth was caused by the
Missouri data team model implementation. The fourth recommendation is to expand this
study to include a more comprehensive examination of the effect of each step of the
Missouri data team model on student growth. As part of this examination, the proportion
of time spent on each step should be examined and compared. The fifth recommendation
is to include other variables related to student achievement and school effectiveness.
Concluding Remarks
School leaders across our nation have large amounts of student data available but
“lack the knowledge about how to transform mountains of data on student achievement
into an action plan that will improve instruction and increase student learning” (Boudett
et al., 2007, p. 1). As schools attempt to meet the evolving and challenging needs of
students, educational leaders must build capacity among teachers to collaborate, analyze
this data and use it to improve teaching. This analysis must be completed by
collaborative teacher teams. These collaborative teams must be provided with a
framework to follow, one that guides teaching through the process of selecting and
analyzing standards, developing assessments to assess learning, and choosing research-

67
based teaching strategies to use in the classroom. A collaborative culture should be
fostered by school leaders throughout the district and built within both the district and
building level policies and procedures. Teachers must be expected to use instructional
strategies with high effect sizes and work towards continuous improvement. The success
of every student ultimately must serve as the litmus test for every educational decision.

68
References
A & E Television Network. (2017). The great depression. Retrieved from
http://www.history.com/topics/great-depression
Ainsworth, L. (2003). Power standards: Identifying the standards that matter most.
Englewood, CO: Lead and Learn Press.
Ainsworth, L., & Viegut, D. (2006). Common formative assessments: How to connect
standards-based instruction and assessment [Kindle version]. Thousand Oaks,
CA: Corwin Press.
Boudett, K., City, E., & Murnane, J. (Eds.). (2007). Data wise: A step-by-step guide to
using assessment results to improve teaching and learning. Cambridge, MA:
Harvard Education Press.
Brown v. Board of Education of Topeka, 347 U.S. 483 (1954).
Conzemius, A., & O’Neil, J. (2001). Building shared responsibility for student learning.
Alexandria, VA: Association for Supervision and Curriculum Development.
Definition of Individualized Education Plan. 34 C.F.R. § 300 (2001).
DuFour R., & Eaker, R. (1998). Professional learning communities at work: Best
practices for enhancing student achievement [Kindle version]. Bloomington, IN:
Solution Tree.
Education for All Handicapped Children Act. Pub. L. No. 94-142 § 773 Stat. 89 (1975).
Elementary and Secondary Education Act of 1965. Pub. L. No. 89-10 § 203 Stat. 79
(1965).
Every Student Succeeds Act of 2015. Pub. L. No. 114-95 § 114 Stat. 1177 (2015).

69
Ford, N. (2008). The great war and America: Civil-military relations during world war I.
Westport, CT: Greenwood Publishing Group.
Fisher, D., & Frey, N. (2015). Checking for understanding: Formative assessment
techniques for your classroom. Alexandria, VA: Association for Supervision &
Curriculum Development.
Fullan, M. (1993). Change forces: Probing the depths of educational reform (Vol. 10).
Hove, UK: Psychology Press.
Garber, S. (2007). Sputnik and the dawn of the space age. Retrieved from
http://history.nasa.gov/sputnik/
Glossary of Educational Reform. (2015, November 12). Standardized test. Retrieved
from http://edglossary.org/standardized-test/
Goldring, E., & Berends, M. (2008). Leading with data: Pathways to improve your
school. Thousand Oaks, CA: Corwin.
Hattie, J. (2012). Visible learning for teachers: Maximizing impact on learning [Kindle
version]. New York, NY: Routledge.
Hattie, J. (2016). Visible learning in action: International case studies of impact [Kindle
version]. New York, NY: Routledge.
Improving America’s Schools Act of 1994. (1994). Pub. L. No. 103-382 (1994).
Individuals with Disabilities Education Act of 2004. 20 U.S.C. § 1400 (2004).
Jennings, J. (2012). Reflections on a half-century of school reform: Why have we fallen
short and where do we go from here? Center for Education Policy. Retrieved
from http://www.cep-
dc.org/cfcontent_file.cfm?Attachment=Jennings_Paper_Reflections_1.27.12.pdf

70
Marzano, R. (2003). What works in schools: Translating research into action.
Alexandria, VA: Association for Supervision & Curriculum Development.
Marzano, R. (2007). The art and science of teaching: A comprehensive framework for
effective instruction [Kindle version]. Alexandria, VA: Association for
Supervision & Curriculum Development.
Marzano, R. (2010). Formative assessments & standards based grading. Alexandria,
VA: Association for Supervision & Curriculum Development.
Marzano, R. (2017). The new art of science and teaching. Bloomington, IN: Association
for Supervision and Curriculum Development.
Marzano, R., & Waters, T. (2009). District leadership that works: Striking the right
balance. Bloomington, IN: Solution Tree Press.
McDonnell, L. M. (2005). No Child Left Behind and the federal role in education:
Evolution or revolution? Peabody Journal of Education, 80(2), 19-38.
Missouri Department of Elementary and Secondary Education. (2013). Missouri
collaborative work (CW) and state personnel development grant (SPDG).
Retrieved from https://dese.mo.gov/sites/default/files/se-mocase-cw-mospdg.pdf
Missouri Department of Elementary and Secondary Education. (2014a). Common
understandings document - Missouri collaborative work. Retrieved from
https://dese.mo.gov/sites/default/files/se-admin-seap-collaborativework
commonunderstandings.pdf
Missouri Department of and Secondary Education. (2014b). The data team process.
Unpublished PowerPoint presentation.

71
Missouri Department of Elementary and Secondary Education. (2015). Common
understandings document - Missouri collaborative work. Retrieved from
https://dese.mo.gov/sites/default/files/se-ep-cw-common-understandings-
document.pdf
Missouri Department of Elementary and Secondary Education, Office of Special
Education. (2013). Missouri state personnel development grant learning
packages, framework, and content. Kansas City, MO: University of Missouri-
Kansas City, Institute for Human Development.
MOEdu-Sail. (2017a). Data-based decision making. Retrieved from http://www.moedu-
sail.org/wp-content/uploads/2016/08/DBDM-Infographic-May-2017.pdf
MOEdu-Sail. (2017b). The self-assessment practice profile workbook. Retrieved from
http://www.moedu-sail.org/professional-learning-resources/
MOEdu-Sail. (n.d.a). Data-based decision making is … Retrieved from
https://www.moedu-sail.org/courses/data-based-decision-making/
MOEdu-Sail. (n.d.b). Visible teaching and learning in Missouri with collaborative work.
Retrieved from https://www.moedu-sail.org/courses/data-based-decision-making/
National Commission on Excellence in Education. (1983). A nation at risk: The
imperative for educational reform. Retrieved from https://www2.ed.gov/pubs/
NatAtRisk/risk.html
No Child Left Behind (NCLB) Act of 2001, Pub. L. No. 107-110, § 115, Stat. 1425
(2002).

72
November, A. (1998). Creating a new culture of teaching and learning. Restructuring
Brief 18. Santa Rosa, CA: North Coast Professional Development Consortium.
Retrieved from NCEO.org/info
Pankake, A., & Littleton, M. (2012). The administration & supervision of special
programs in education (3rd ed.). Dubuque, IA: Kendall Hunt.
Partnership for Assessment of Readiness for College and Career Readiness. (2017).
Assessments: Next generation assessments. Retrieved from http://parcc-
assessment.org/assessments
Platte County R-III. (2014). Curriculum, instruction, and assessment plan: 2014-2015.
Retrieved from https://drive.google.com/a/platteco.k12.mo.us/file/d/
0B57yfgx_5wQUZUlVdzNHeFhlYnlNa1hzM0dqYi1qU0taeTY0/view?usp=shari
ng
Platte County R-III. (2017). PCR-3 strategic planning: Longitudinal report. [Data file
and code book]. Retrieved from http://204.185.224.216/GOSMR/long/MAP.php
Powell, A. (2007, October 11). How Sputnik changed US education. Harvard Gazette.
Retrieved from http://news.harvard.edu/gazette/story/2007/10/how-sputnik-
changed-u-s-education/
Reeves, D. (2004). Accountability for learning: How teachers and school leaders can
take charge. Alexandria, VA: Association for Supervision and Curriculum
Development.
Renaissance Learning. (2013). The research foundation for STAR Assessments: The
science of STAR. Wisconsin Rapids, WI: Renaissance Learning. Retrieved from
http://doc.renlearn.com/KMNet/R001480701GCFBB9.pdf

73
RTI Action Network. (2017). What is RTI? Retrieved from http://www.rtinetwork.org/
learn/what/whatisrti
Schmoker, M. (1999). Results: The key to continuous school improvement (2nd ed.)
[Kindle version]. Alexandria, VA: Association for Supervision and Curriculum
Development.
Scott, J. (n.d.). The data team process PowerPoint. Retrieved from https://dese.mo.gov/
sites/default/files/thedatateamProcessppt.pdf
Servicemen’s Readjustment Act of 1944. Pub. L. No. 346-268 § 1767 (1944).
Snyder, T., & Hoffman, C. (2002). Digest of education statistics, 2001. Jessup, MD: U.S.
Department of Education, National Center for Education Statistics.
Social Welfare History Project. (2016). Elementary and Secondary Education Act of
1965. Social welfare history. Retrieved from https://socialwelfare.library.vcu.
edu/programs/education/elementary-and-secondary-education-act-of-1965/
University of Minnesota. (2016). National Center on Educational Outcomes [website].
Retrieved from https://nceo.info/
U.S. Department of Education. (1991, April 18). America 2000: An educational strategy.
Retrieved from http://files.eric.ed.gov/fulltext/ED327009.pdf
U.S. Department of Education. (2015). Every student succeeds act. Retrieved from
https://www.ed.gov/esea
U.S. Department of Veteran Affairs. (2013). Education and training: History and
timeline. Retrieved from http://www.benefits.va.gov/gibill/history.asp

74
U.S. Office of Special Education Programs. (n.d.). History: Twenty-five years of progress
in educating children with disabilities through IDEA. Retrieved from
http://www2.ed.gov/policy/speced/leg/idea/history.pdf
Warde, W. (1960, Winter). John Dewey’s theories of education. Internationalist Socialist
Review, 21(1). Transcribed by D. Gairdo (2005). Retrieved from
https://www.marxists.org/archive/novack/works/1960/x03.htm
Williams, P., & Henry, G. (2013). Missouri collaborative work (CW) and state personnel
development grant (SPDG). Retrieved from https://dese.mo.gov/sites/default/files/
se-mocase-cw-mospdg.pdf
Wilson, A. (2014). Teacher perception of data team proficiency. Unpublished raw data.

75
Appendices

76
Appendix A: Percentage of Students Scoring Proficient or Advanced
Table A1.
Percentage of Students from the All Subgroup Scoring Proficient or Advanced on the
English Language Arts MAP Assessment
2010 2011 2012 2013 2014
3rd
Grade 58.7% 54.7% 63.4% 67.8% 66.3%
4th
Grade 60.9% 65.5% 64.7% 66.3% 60.6%
5th
Grade 64.9% 66.3% 63.3% 64.6% 60.9%
Note: Adapted from PCR-3 Strategic Planning – Longitudinal Report by Platte County
R-III. (2017). [Data File and Code Book]. Retrieved from
http://204.185.224.216/GOSMR/long/MAP.php.
Table A2.
Percentage of Students from the IEP Subgroup Scoring Proficient or Advanced on the
English Language Arts MAP Assessment
2010 2011 2012 2013 2014
3rd
Grade 14.3% 10% 26.9% 21.1% 25%
4th
Grade 33.4% 14.3% 23.5% 30% 9.6%
5th
Grade 19.3% 35.2% 31.8% 14.3% 33.3%
Note: Adapted from PCR-3 Strategic Planning – Longitudinal Report by Platte County
R-III. (2017). [Data File and Code Book]. Retrieved from
http://204.185.224.216/GOSMR/long/MAP.php.
.

77
Table A3.
Percentage of Students from the All Subgroup Scoring Proficient or Advanced on the
Mathematics MAP Assessment
2010 2011 2012 2013 2014
3rd
Grade 59.9% 59.3% 63.4% 68.3% 72.1%
4th
Grade 50.2% 50.4% 50.7% 53.7% 52.4%
5th
Grade 57.6% 56.1% 55.2% 62% 60.9%
Note: Adapted from PCR-3 Strategic Planning – Longitudinal Report by Platte County
R-III. (2017). [Data File and Code Book]. Retrieved from
http://204.185.224.216/GOSMR/long/MAP.php.
Table A4.
Percentage of Students from the IEP Subgroup Scoring Proficient or Advanced on the
Mathematics MAP Assessment
2010 2011 2012 2013 2014
3rd
Grade 19% 19% 30.8% 26.4% 15%
4th
Grade 33.4% 9.6% 29.4% 26.7% 23.8%
5th
Grade 16.2% 23.5% 18.1% 23.8% 20.8%
Note: Adapted from PCR-3 Strategic Planning – Longitudinal Report by Platte County
R-III. (2017). [Data File and Code Book]. Retrieved from
http://204.185.224.216/GOSMR/long/MAP.php.

78
Table A5.
STAR Enterprise Assessment Data Mean Scores
Fall Winter Spring
Reading: All 518.33 575.34 605.65
Math: All 642.17 679.29 717.59
Reading: IEP 264.25 293.33 294.06
Math: IEP 491.47 542.48 564.48
Note: Adapted from IBM SPSS Statistics Faculty Pack 21 analysis of archived data
utilized in the study.

79
Appendix B: IRB Documentation
Date:
School of education IRB PROTOCOL NUMBER _________________
Graduate department (irb USE ONLY)

80
IRB Request
Proposal for Research
Submitted to the Baker University Institutional Review Board
I. Research Investigator(s) (Students must list faculty sponsor first)
Department(s) School of Education Graduate Department
Name Signature
1. Dr. James Robins ____________________, Major Advisor
2. Dr. Li Chen-Bouck ____________________, Research Analyst
3. Dr. Dennis King _____________________, University Committee Member
4. TBD _____________________, External Committee Member
Principal Investigator: Amy Cordova
Phone: 816.916.6221
Email: [email protected]
Mailing address: 101 Roller Ct
Platte City, MO 64079
Faculty sponsor: Dr. James Robins
Phone: 913.344.1222
Email: [email protected]
Expected Category of Review: ___Exempt X Expedited _ __Full
II: Protocol: (Type the title of your study)
Data Team Effectiveness and Student Growth in STAR Assessment Data

81
Summary
In a sentence or two, please describe the background and purpose of the research.
The Platte County School District believed that the implementation of a consistent
Tier 1 model of instruction and the consistent use of the data team model would improve
student achievement. The Platte County School District was able to mandate the use of
consistent curriculum resources and a scope and sequence for grades 3-5 in mathematics
and reading. However, the Platte County School District had not examined the effect of
the data team process on student achievement. Therefore, a study of student
achievement, both in the subgroup and non-subgroup population, should be examined in
an attempt to explore the difference between student achievement before and after the full
implementation of the data team model.
The purpose of this study was to determine the change in academic
achievement in mathematics and reading as measured by a nationally standardized
achievement test. Additionally, the change of academic achievement in the subgroup,
students with an IEP, was also determined in mathematics and reading as measured by a
nationally standardized achievement test. These measurements would be taken at the
beginning, middle, and end of the year to determine if a statistically significant change
occurred while students were in classrooms that participated in the data team initiative.
Briefly describe each condition or manipulation to be included within the study.
There are no conditions or manipulations in this study
What measures or observations will be taken in the study? If any questionnaire or
other instruments are used, provide a brief description and attach a copy.
The investigator has received permission to analyze archival STAR Reading and STAR
Mathematics data from the STAR Assessment website from the 2015-2016 school year at
Platte County R-III School District in Platte City, MO at the third, fourth, and fifth grade
level. Documentation of permission to use archival STAR Reading and STAR
Mathematics data is attached.
Will the subjects encounter the risk of psychological, social, physical, or legal risk?
If so, please describe the nature of the risk and any measures designed to mitigate
that risk.
There are no psychological, social, physical, or legal risks involved in this study.
Will any stress to subjects be involved? If so, please describe.
There will be no stress on subjects involved in this study.

82
Will the subjects be deceived or misled in any way? If so, include an outline or
script of the debriefing.
The participants will not be deceived or misled in this study.
Will there be a request for information which subjects might consider to be personal
or sensitive? If so, please include a description.
There will be no requests for personal or sensitive information for this study.
Will the subjects be presented with materials which might be considered to be
offensive, threatening, or degrading? If so, please describe.
There will be no materials that might be considered offensive, threatening, or degrading
presented to study participants.
Approximately how much time will be demanded of each subject?
No time will be required of any subject due to the use of archival STAR Reading and
STAR Mathematics data from the STAR Assessment website.
Who will be the subjects in this study? How will they be solicited or contacted?
Provide an outline or script of the information which will be provided to subjects
prior to their volunteering to participate. Include a copy of any written solicitation
as well as an outline of any oral solicitation.
The subjects in this study will be 1,080 in the third, fourth, and fifth grade during the
2015-2016 academic school years. All identifying information related to the research has
been redacted to ensure and protect the privacy of subjects.
What steps will be taken to insure that each subject’s participation is voluntary?
What if any inducements will be offered to the subjects for their participation?
Archival STAR Reading and STAR Mathematics data will be used from subjects in this
research. Therefore, there was no pursuit of participation or inducement of any kind to
participate.
How will you insure that the subjects give their consent prior to participating? Will
a written consent form be used? If so, include the form. If not, explain why not.
Permission was sought and granted to use archival STAR Reading and STAR
Mathematics data from the STAR Assessment website for this research. It was made
clear in this request that all identifying information related to this study would be
redacted to ensure and protect the privacy of every subject.

83
Will any aspect of the data be made a part of any permanent record that can be
identified with the subject? If so, please explain the necessity.
The archival STAR Reading and STAR Mathematics data collected and analyzed in this
study will not be part of any permanent record.
Will the fact that a subject did or did not participate in a specific experiment or
study be made part of any permanent record available to a supervisor, teacher or
employer? If so, explain.
Given that archival STAR Reading and STAR Mathematics data was used for this
research every "subject" has already participated in the computer based assessment
during the 2015-2016 school year. Therefore, for the purposes of this study, 100% of
subjects participated in the STAR Reading and STAR Mathematics assessment.
What steps will be taken to insure the confidentiality of the data? Where will it be
stored? How long will it be stored? What will be done with it after the study is
completed?
To ensure the confidentiality of the subjects within the study, individual and school
names will not be collected, recorded, or stored. The data that is collected will be stored
through the defense of the dissertation and will be removed afterward.
If there are any risks involved in the study, are there any offsetting benefits that
might accrue to either the subjects or society?
There are no known risks for participants involved in the study.
Will any data from files or archival data be used? If so, please describe.
Archival STAR Reading and STAR Mathematics data served as the basis of this study of
study academic growth in classrooms participating in the data team process. Permission
was sought and granted from Dr. Mike Brown, Assistant Superintendent of Curriculum
and Instruction in the Platte County School District to use archival STAR Reading and
STAR Mathematics data from STAR Assessments for this research. It was made clear to
Dr. Brown in my request that all identifying information related to this study would be
redacted to ensure and protect the privacy of every subject involved.

84
Baker University Institutional Review Board
July 24, 2017
Dear Amy Cordova and Dr. Robins,
The Baker University IRB has reviewed your research project application and
approved this project under Exempt Status Review. As described, the project
complies with all the requirements and policies established by the University for
protection of human subjects in research. Unless renewed, approval lapses one
year after approval date.
Please be aware of the following:
1. Any significant change in the research protocol as described should be
reviewed by this Committee prior to altering the project.
2. Notify the IRB about any new investigators not named in original application.
3. When signed consent documents are required, the primary investigator must
retain the signed consent documents of the research activity.
4. If this is a funded project, keep a copy of this approval letter with your
proposal/grant file.
5. If the results of the research are used to prepare papers for publication or oral
presentation at professional conferences, manuscripts or abstracts are requested
for IRB as part of the project record.
Please inform this Committee or myself when this project is terminated or
completed. As noted above, you must also provide IRB with an annual status
report and receive approval for maintaining your status. If you have any questions,
please contact me at [email protected] or 785.594.7881.
Sincerely,
Erin Morris PhD
Chair, Baker University IRB
Baker University IRB Committee
Joe Watson PhD
Nate Poell MA
Susan Rogers PhD
Scott Crenshaw

85
Appendix C: Graphics from Missouri Department of Elementary
and Secondary Education - Unpublished
Figure C1. Missouri Collaborative Work: Focused on Effective Teaching/Learning
Practices Bridging Professional Development to Practice. Missouri Collaborative Work:
and State Personnel Development Grant (SPDG), power point presentation 2013 at
Special Education Administrator’s Conference at Tan-Tar-A Resort and Conference
Center. Slide/page 29.

86
Figure C2. Visual Representation of Collaborative Data Team Components. Missouri
Collaborative Work (CW) and State Personnel Development Grant (SPDG), power point
presentation 2013 at Special Education Administrator’s Conference at Tan-Tar-A Resort
and Conference Center. Slide/page 31.

87
Appendix D: Graphics from Missouri Department of Elementary
and Secondary Education
Figure D1. Process Map for Implementation of Collaborative Work Grant. Adapted from
https://dese.mo.gov/sites/default/files/se-ep-cw-common-understandings-document.pdf
with permission from Missouri Department of Elementary & Secondary Education,
Office of Special Education. (2013). Missouri State Personnel Development Grant
Learning Packages. Framework & Contents. Kansas City, Missouri: University of
Missouri-Kansas City, Institute for Human Development (see Appendix E)

88
Figure D2. Common Formative Assessment. From http://www.moedu-sail.org/wp-
content/uploads/2016/07/CFA-Infographic-5-2017.pdf with permission from Missouri
Department of Elementary & Secondary Education, Office of Special Education.
(2013). Missouri State Personnel Development Grant Learning Packages. Framework &
Contents. Kansas City, Missouri: University of Missouri-Kansas City, Institute for
Human Development (see Appendix E)
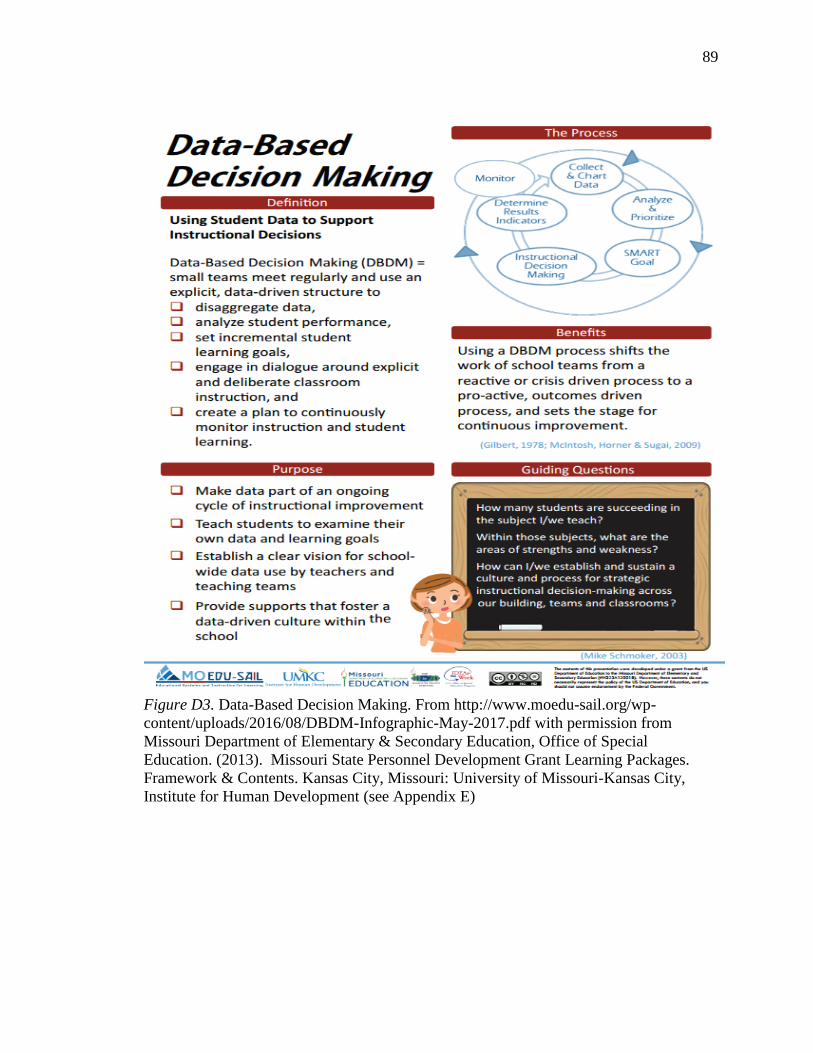
89
Figure D3. Data-Based Decision Making. From http://www.moedu-sail.org/wp-
content/uploads/2016/08/DBDM-Infographic-May-2017.pdf with permission from
Missouri Department of Elementary & Secondary Education, Office of Special
Education. (2013). Missouri State Personnel Development Grant Learning Packages.
Framework & Contents. Kansas City, Missouri: University of Missouri-Kansas City,
Institute for Human Development (see Appendix E)

90
Figure D4. Synthesis of Collaborative Work Grant. Adapted from
https://dese.mo.gov/sites/default/files/se-ep-cw-common-understandings-document.pdf
with permission from Missouri Department of Elementary & Secondary Education,
Office of Special Education. (2013). Missouri State Personnel Development Grant
Learning Packages. Framework & Contents. Kansas City, Missouri: University of
Missouri-Kansas City, Institute for Human Development (see Appendix E)

91
Appendix E: Permission from MO DESE to use Graphics from MO Edu-Sail
Website