Embed Size (px)
Citation preview
8/9/2019 Mishra 2009 Plasma Processes and Polymers
http://slidepdf.com/reader/full/mishra-2009-plasma-processes-and-polymers 1/5
8/9/2019 Mishra 2009 Plasma Processes and Polymers
http://slidepdf.com/reader/full/mishra-2009-plasma-processes-and-polymers 2/5
developed a phenomenal model for the HiPIMS discharge
and suggested that attraction of metal ions back to the
target might be a possible cause of the lower deposition
rates.[8] Konstantinidis et al.[9] demonstrated the impor-
tance of plasma conductivity and Bohlmark et al.[3]
showed that the magnetic field arrangement may beresponsible for the lower deposition rate. Recently,
Emmerlich et al.[10] pointed out that the nonlinear
sputtering yield may also contribute to the low deposition
rate.
The ion energy distribution function (IEDF) at the
substrate is a crucial discharge parameter that determines
the properties of the deposited thin films. Bohlmark
et al.[11] carried out time-resolved IEDFs measurements
and found that in the initial phase of the discharge, Tiþ
ions featured a high-energy tail of the form of the
Sigmund–Thomson sputter distribution. A number of
works have reported that two waves of plasma arrive at
the substrate,[2,9] namely a noble gas rich plasma followed
by metal-rich plasma. Further time-resolved IEDFs mea-
surements have been reported,[7] demonstrating similar
time evolution of IEDFs in reactive and non-reactive
ambient during HIPIMS operation. Vlcek et al.[6] performed
time-average measurements and found that metal ions are
strongly dominant (up to 92%) in the total ion flux onto the
substrate and the energy distribution is pressure depen-
dent with a broadened low energy peak at low pressure. [6]
Ehiasarian et al.[7] demonstrated that metal ion flux in
HiPIMS was five times larger than in conventional
sputtering techniques. Hecimovic et al.[12] realized time-
averaged IEDF measurements at various discharge cur-rents and pressures and demonstrated that the high
energy tail of metal ions increases with discharge current.
They also demonstrated that at high pressure the IEDFs of
the sputtering gas show a single peak while at lower
pressure it shows a bi-Maxwellian distribution. Burcalova
et al.[13] showed that the efficiency of magnetron
sputtering process and transport of the sputtered particle
to the substrate decreases with increasing average target
power loading. Recently, Andersson et al.[14] carried out
experiments with a titanium target at peak current
density 3.3 A cm2, repetition rate 100 Hz, and pulse
width 150 ms. They found Ti4þ ions in HIPIMS discharge. It
was concluded that these multi-charged ions are formed
under a certain condition, i.e. sufficiently long discharge
pulses to allow a runaway process to be developed. Most of
these measurements are time-averaged and thus provide a
static picture of the discharges used.
Few publications on time-resolved measurements of
IEDFs, carried out up to date, have very low resolution (two
or three different times during the discharge pulse) and,
consequently, do not provide a full picture of the IEDF
evolution. The present work is original in the following
sense: it demonstrates a newly developed gating techni-
que in order to achieve IEDF measurements in HIPIMS
discharges with time resolution better than 2 ms over the
entire cathode voltage pulse period.
Experimental Part
All the experiments were carried out in a purpose built stainless
steel vacuum chamber (provided by Gencoa Ltd, UK) of 60 cm in
length and 40 cm in diameter, pumped by rotary and turbo
molecular pump to give a base pressure of 2 104 Pa. It was
equipped with a V-TECH 150 planar circular magnetron having
titanium cathode target (99.995% purity and diameter 150 mm)
and was driven by a SINEX 3.0 (Chemfilt IonSputtering AB2)
HIPIMS power supply at an average power of 680 W. The
repetition frequency was 100 Hz with pulse width of 100 ms. The
experiments were performed in non-reactive mode at argon gas
pressure of 0.26 Pa and flow rate of 30 sccm, regulated by a
Baratron feedback (MKS 627) and a mass flow controller (MKS247), respectively.
Voltage and current waveforms were recorded using a 100:1
voltage probe (P5100 Tektronix) and a 20:1 current probe (TCP04
Tektronix) in conjunction with a 10:1 current probe (TCP202
Tektronix), respectively, all attached between the power supply
and the magnetron.
An electrostatic ion shuttering technique in conjunction with
HIDEN EQP 300 [Electrostatic Quadrupole Plasma (EQP) analyser]
energy-resolved mass spectrometer[6] was used for time-resolved
IEDFs measurements. The spectrometer was equipped with 458
energysector andSEM (secondary electron multiplier) to count the
ions. It provides energy resolution up to 0.1 eV but in the present
experiments a 0.5eV energy resolution waschosen dueto thelong
acquisition times (3 min) in a single scan. Before choosing this
energyresolution setting, theIEDFs were scanned at 0.1and 0.5eV
energy resolutions and no significant changes, in counts or in the
shape of IEDFs, were observed. The mass spectrometer barrel was
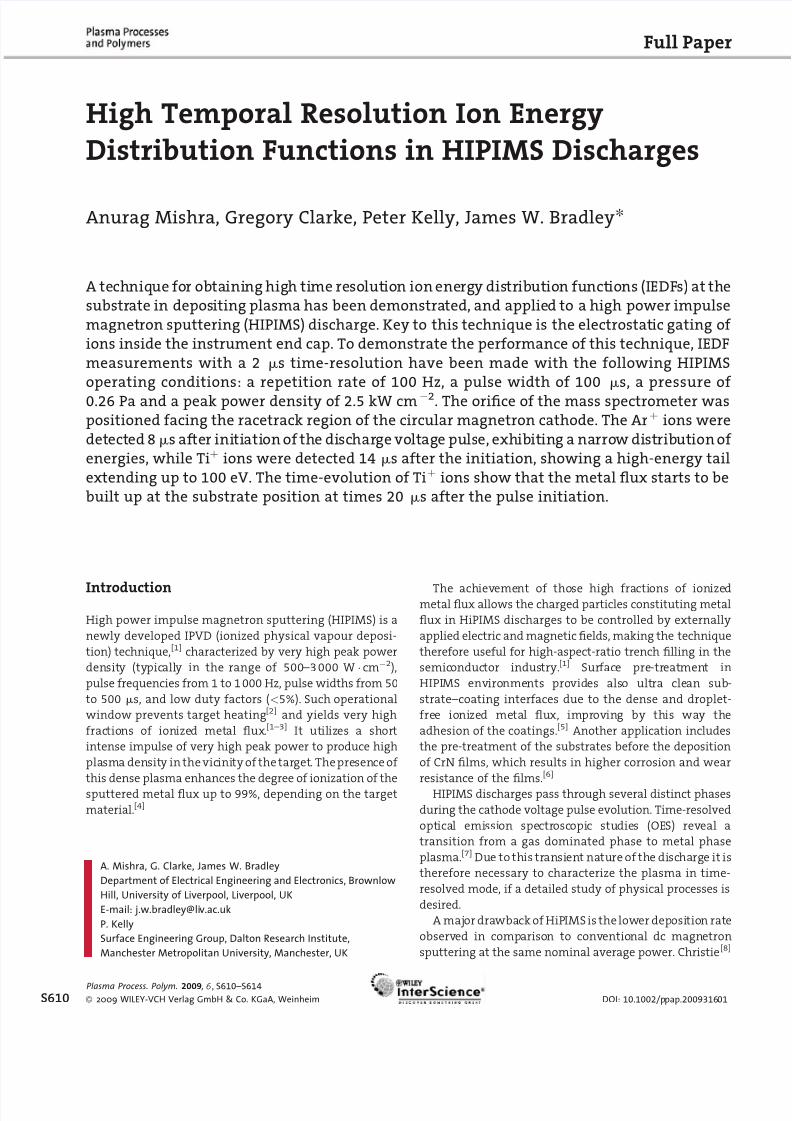
located opposite the racetrack at a distance of 10cm (see Figure 1).
This orientation provides direct line-of-sight between the instru-
ment and surface of thecathode, increasing the probability for the
sputtered target material to enter the instrument without
undergoing any collisions. The plasmaions were sampled through
High Temporal Resolution Ion Energy Distribution Functions . . .
Figure 1. A schematic diagram of the experimental setup with themagnetron and the mass spectrometer.
Plasma Process. Polym. 2009, 6 , S610–S614 2009 WILEY-VCH Verlag GmbH & Co. KGaA, Weinheim www.plasma-polymers.org S611
8/9/2019 Mishra 2009 Plasma Processes and Polymers
http://slidepdf.com/reader/full/mishra-2009-plasma-processes-and-polymers 3/5
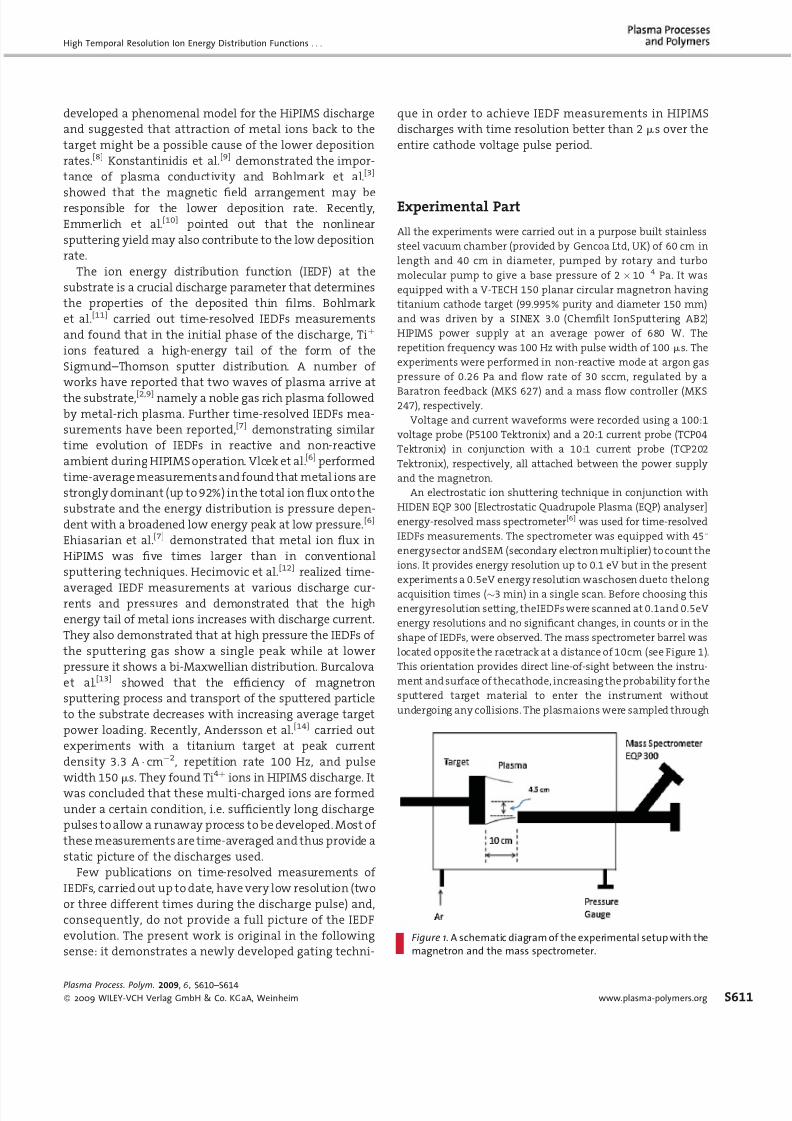
100 mm in diameter orifice drilled on the grounded end cap of theinstrument.
The electrostatic shutter[15] was made from a stainless steel
mesh having57 wires/inch anda 45%geometricaltransparency. It
was situated 0.5 mm behind the orifice (see Figure 2). An
electrostatic pulse, produced by an external pulse generator, was
biasing the mesh via a feedthrough. Both the grid and the detector
were gated by an external delay generator at a prescribed time
delay. The time t ¼ 0 position was defined as the zero cutting edge
of the target voltage pulse at the off-to-on transition.
Duringion counting,the grid wasbiased at þ150 V torepel all the
positive ions. During the ion acquisition, the grid voltage was
ramped and maintained at 22 V for a duration t g (the time
resolution window), allowing the ions to reach the detector via
spectrometer’s ion optics (see Figure 3). It was experimentally foundthat the best setting of grid and extractor biases were 22 and 25
V, respectively, to achieve the highest count rates. The fall and rise
times of the gate pulse were 40 and 70 ns, respectively, and these
were considerably shorter than the shuttering window width used
in these experiments (i.e. 2 ms).
At a time of 2 ms after the end of the mesh gating pulse, the
detector enabling pulse wassent by the EQP signalboard allowing
the digital ion counting pulses to be counted within this pulse, as
Figure 3 shows. The detector gating pulse was chosen to be 250 ms
so that the heaviest (300 amu) and the least energetic (1 eV) ions,
which need 200 ms to reach the detector (SEM) starting from the
orifice of the instrument, could readily be detected during the
pulse period. The time lag (2 ms) between the end of the mesh
gatingand thebeginningof thedetectorgating pulse prevents any
false ion detection at the SEM due to electromagnetic interference
generated by large rapid change of the grid biasing (from 22 to
150 V in about 20 ns).
Experimental Results and Discussion
As mentioned in Experimental Set-Up Section, all time-
resolved measurements of the IEDFs were performed at an
argon pressure of 0.26 Pa, a repetition rate of 100 Hz, a
pulse width of 100 ms and an average power of 680 W. The
peak current and power density were 2.6 A cm2 and 2.5
kW cm2, respectively.
The cathode voltage pulse V d and current pulse I d are
shown in Figure 4. Two phases of the voltage pulse can be
clearly identified. These are a transient on-phase and a
stable off-phase. Average power was calculated as follows:
Pav ¼ ð1=t Þ
Z I dðt ÞV dðt Þdt ð1Þ ð1Þ
where I (t ) is target current and V (t ) target voltage as
functions of time and t is the pulse period.
Before performing the detailed experiments, a pre-
liminary experiment was carried out to assess the
performance of the electrostatic shuttering technique.
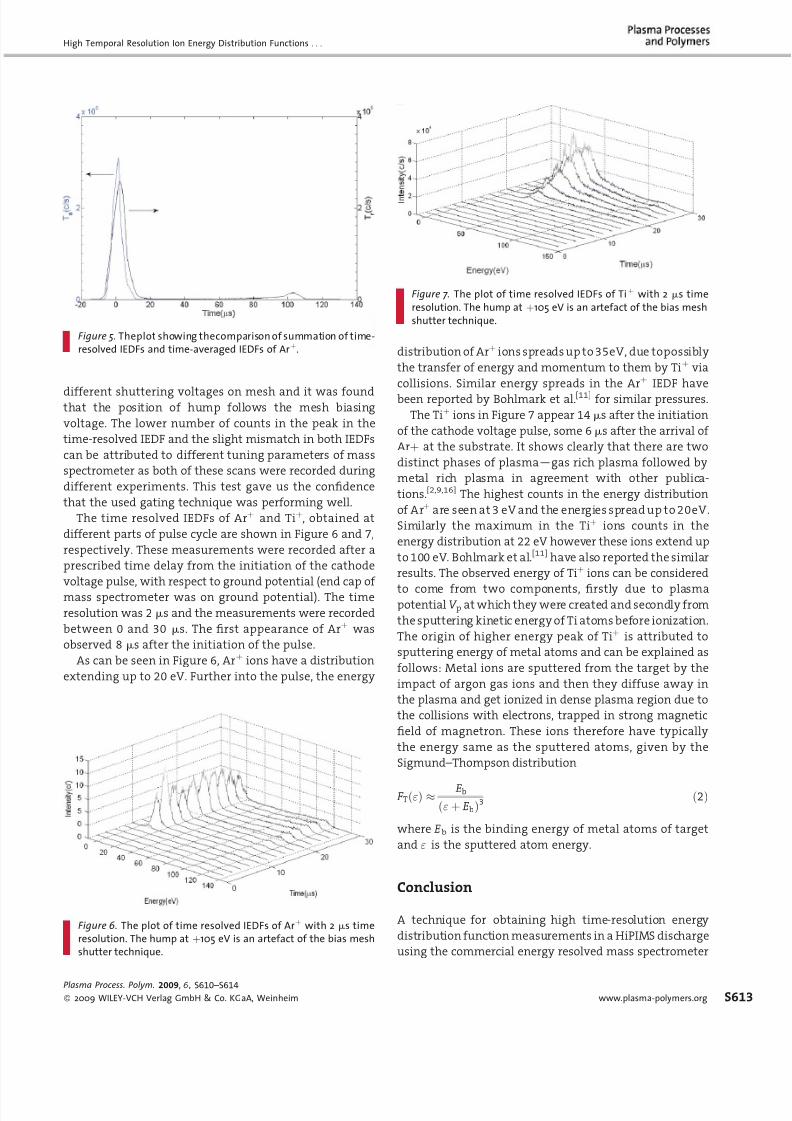
For this, a summation of time-resolved IEDFs at different
times during the pulse was compared to a time-averaged
IEDF. The plot is shown in Figure 5. Both of these IEDFs
have been recorded in different experiments and with
different tuning parameters of the mass spectrometer. The
time-averaged IEDF was recorded without mesh in the
instrument. As can be seen from plot, the IEDFs match well
except that the sum of time-resolved IEDFs has a hump at
105 eV and lower number of counts. This hump is artefact
produced by the biased mesh when there is fast transition
from 22 to 150 V, at the end of gating time window. To
confirm that this hump is indeed an artefact produced by
the mesh, more experiments were carried out with
A. Mishra, G. Clarke, P. Kelly, J. W. Bradley
Figure 2. The schematic diagram of the electrostatic ion shutter-ing technique.
Figure 3. The electrostatic ion shuttering and detector pulse waveforms. Figure 4. The discharge voltage and current waveforms.
S612
Plasma Process. Polym. 2009 , 6 , S610–S614 2009 WILEY-VCH Verlag GmbH & Co. KGaA, Weinheim DOI: 10.1002/ppap.200931601
8/9/2019 Mishra 2009 Plasma Processes and Polymers
http://slidepdf.com/reader/full/mishra-2009-plasma-processes-and-polymers 4/5
different shuttering voltages on mesh and it was foundthat the position of hump follows the mesh biasing
voltage. The lower number of counts in the peak in the
time-resolved IEDF and the slight mismatch in both IEDFs
can be attributed to different tuning parameters of mass
spectrometer as both of these scans were recorded during
different experiments. This test gave us the confidence
that the used gating technique was performing well.
The time resolved IEDFs of Arþ and Tiþ, obtained at
different parts of pulse cycle are shown in Figure 6 and 7,
respectively. These measurements were recorded after a
prescribed time delay from the initiation of the cathode
voltage pulse, with respect to ground potential (end cap of
mass spectrometer was on ground potential). The time
resolution was 2 ms and the measurements were recorded
between 0 and 30 ms. The first appearance of Arþ was
observed 8 ms after the initiation of the pulse.
As can be seen in Figure 6, Arþ ions have a distribution
extending up to 20 eV. Further into the pulse, the energy
distribution of Arþ ions spreads up to 35eV, due topossibly
the transfer of energy and momentum to them by Tiþ via
collisions. Similar energy spreads in the Arþ IEDF have
been reported by Bohlmark et al.[11] for similar pressures.
The Tiþ ions in Figure 7 appear 14 ms after the initiation
of the cathode voltage pulse, some 6 ms after the arrival of
Arþ at the substrate. It shows clearly that there are two
distinct phases of plasma—gas rich plasma followed by
metal rich plasma in agreement with other publica-
tions.[2,9,16] The highest counts in the energy distribution
of Arþ are seen at 3 eV and the energies spread up to 20eV.
Similarly the maximum in the Tiþ ions counts in the
energy distribution at 22 eV however these ions extend up
to 100 eV. Bohlmark et al.[11] have also reported the similar
results. The observed energy of Tiþ ions can be considered
to come from two components, firstly due to plasmapotential V p at which they were created and secondly from
the sputtering kinetic energy of Ti atoms before ionization.
The origin of higher energy peak of Tiþ is attributed to
sputtering energy of metal atoms and can be explained as
follows: Metal ions are sputtered from the target by the
impact of argon gas ions and then they diffuse away in
the plasma and get ionized in dense plasma region due to
the collisions with electrons, trapped in strong magnetic
field of magnetron. These ions therefore have typically
the energy same as the sputtered atoms, given by the
Sigmund–Thompson distribution
F Tð"Þ E b
ð" þ E bÞ3 ð2Þ
where E b is the binding energy of metal atoms of target
and " is the sputtered atom energy.
Conclusion
A technique for obtaining high time-resolution energy
distribution function measurements in a HiPIMS discharge
using the commercial energy resolved mass spectrometer
High Temporal Resolution Ion Energy Distribution Functions . . .
Figure 5. Theplot showing thecomparison of summation of time-resolved IEDFs and time-averaged IEDFs of Arþ.
Figure 6. The plot of time resolved IEDFs of Arþ with 2 ms timeresolution. The hump at þ105 eV is an artefact of the bias meshshutter technique.
Figure 7. The plot of time resolved IEDFs of Tiþ with 2 ms timeresolution. The hump at þ105 eV is an artefact of the bias meshshutter technique.
Plasma Process. Polym. 2009, 6 , S610–S614 2009 WILEY-VCH Verlag GmbH & Co. KGaA, Weinheim www.plasma-polymers.org S613
8/9/2019 Mishra 2009 Plasma Processes and Polymers
http://slidepdf.com/reader/full/mishra-2009-plasma-processes-and-polymers 5/5
(HIDEN Ltd, EQP 300) has been demonstrated successfully.
The key to this technique is the electrostatic gating of
the ions inside the instrument’s end cap. To demonstrate
the performance of this technique, the time-resolved
IEDFs measurement with 2 ms time resolution were
carried in the HIPIMS discharge pulsed at frequencyof 100 Hz, with a pulse width of 100 ms and average power
of 680 W.
The excellent agreement between the summation of all
the time-resolved IEDFs measurements at different times
during the pulse and a time-averaged measurement
recorded by the mass spectrometer demonstrated that
this technique is quite suitable for very high time-resolved
measurements of IEDFs in the HiPIMS discharge.
It was found that Arþ energy distribution has its
maximum energy at 3 eV (corresponding to plasma
potential) and extends up to 20 eV at 2 ms after the
initiation of the discharge pulse. As the pulse develops, this
energy spread extends to 35 eV possibly due to the energy
transfer from Tiþ via binary collisions.
The IEDFs of Tiþ ions has its maximum counts at 22 eV,
due tothe factthat energyof Tiþ ions is largely determined
by the energy of sputtered atoms as described the
Sigmund–Thomson energy distribution function. The
IEDFs of Tiþ spread up to 50 eV at 2 ms after the initiation
of cathode voltage pulse and further into the pulse, ions are
detected with energies extending up to 100 eV.
Acknowledgements: Authors are gratefully acknowledged EPSRC
for their funding support.
Received: September 12, 2008; Accepted: February 11, 2009; DOI:10.1002/ppap.200931601
Keywords: HIPIMS; ion energy distribution function; massspectrometry; pulsed-magnetron; time resolved
[1] V. Kouznetsov, K. Macak, J. M. Schneider, U. Helmerson, I.Petrov, Surf. Coat. Technol. 1999, 122 , 290.
[2] K. Macak, V. Kouznetsov, J. M. Schneider, U. Helmersson, I.Petrov, J. Vac. Sci. Technol. A 2000, 18, 1553.
[3] J. Bohlmark, M. Ostbye, M. Latterman, H. Ljungcrantz, T.Rosell, U. Helmerson, Thin Soild Films 2006, 515 , 1928.
[4] U. Helmersson, M. Lattermann, J. Bohlmark, A. P. Ehiasarian,J. T. Gudmundsson, Thin Solid Films 2006, 513(1–2), 1.
[5] A. P. Ehiasarian, J. G. Wen, I. Petrov, J. Appl. Phys. 2007, 101,
054301.[6] J. Vlcek, P. Kudlacek, K. Burcalova, J. Musil, Eur. Lett. 2007,
77 (4), 45002.[7] A. P. Ehiasarian, A. Yolanda Gonzalvo, T. D. Whitmore, Plasma
Processes Polym. 2007, 4, S309.
[8] D. J. Christie, J. Vac. Sci. Technol. A 2005, 23, 330.[9] S. Konstantinidis, J. P. Dauchot, M. Granciu, M. Hecq, Appl.
Phys. Lett. 2006, 88 , 021501.[10] J. Emmerlich, S. Marsh, R. Snyders, K. Jiang, J. M. Schneider,
Vacuum 2008, 82 , 867.[11] J. Bohlmark, M. Latterman, J. T. Gudmundsson, A. P. Ehiasar-
ian, Y. Aranda Gonzalvo, N. Brenning, U. Helmerson, Thin
Solid Films 2006, 515, 1522.[12] A. Hecimovic, K. Burcalova, A. P. Ehiasarian, J. Phys. D: Appl.
Phys. 2008, 41 , 095203.[13] K. Burcalova, A. Hecimovic, A. P. Ehiasarian, J. Phys. D: Appl.
Phys. 2008, 41 , 115306.[14] J. Andersson, A. P. Ehiasarian, A. Anders, Appl. Phys. Lett. 2008,
93, 071504.[15] S. A. Voronin, G. C. B. Clarke, M. Cada, P. Kelly, J. W. Bradley,
Meas. Sci. Technol. 2007, 18 , 1872.[16] A. P. Ehiasarian, R. New, W.-D. Munz, L. Hultman, U. Helmer-
son, Vacuum 2002, 65(2), 147.
A. Mishra, G. Clarke, P. Kelly, J. W. Bradley
S614
Plasma Process. Polym. 2009 , 6 , S610–S614 2009 WILEY-VCH Verlag GmbH & Co. KGaA, Weinheim DOI: 10.1002/ppap.200931601


![Alivrepository.liverpool.ac.uk/3008441/1/polymers-202890... · Web viewLopez-Garcia et al. [26] demonstrated argon plasma treatment improved HaCaT keratinocyte proliferation on collagen](https://img.dokumen.tips/doc/110x75/60e6eab96e238712da3a7f52/web-view-lopez-garcia-et-al-26-demonstrated-argon-plasma-treatment-improved-hacat.jpg)


![Untitled-2 [] for Advanced Technology. BARC. Mishra ... Hero Honda. Grasim Industries. Cadbury. LG Polymers, Ion Exchange (India) Ltd ... Technology, Government of](https://img.dokumen.tips/doc/110x75/5ad8b3f17f8b9a9d5c8da054/untitled-2-for-advanced-technology-barc-mishra-hero-honda-grasim-industries.jpg)