Embed Size (px)
Citation preview

W W W. N A T U R E . C O M / N A T U R E | 1
SUPPLEMENTARY INFORMATIONdoi:10.1038/nature10991
1
Supplementary materials - Unexpected features of Drosophila circadian
behavioural rhythms under natural conditions
Stefano Vanin1*^, Supriya Bhutani2*%, Stefano Montelli1+, Pamela Menegazzi1#, Edward W. Green2,
Mirko Pegoraro1,2 , Federica Sandrelli1, Rodolfo Costa1& and Charalambos P. Kyriacou2
1Department of Biology, University of Padova, Padova 35131, Italy
2Department of Genetics, University of Leicester, LE1 7RH, UK
*contributed equally
& corresponding author
Guide
Figures
1. Monitoring Drosophila locomotor rhythms in the wild.
2. Afternoon components in other clock genotypes.
3. Seasonal view of morning and evening onsets in Treviso and Leicester.
4. Morning onset for other genotypes.
5. Morning onset in WTALA flies exposed to natural illumination or covered at sunset
6. Eonset of other clock-relevant genotypes
7. Locomotor activity of flies exposed to full moonlight and sheltered in Treviso.
8. Immunocytochemistry
9. Natural simulations
10. Effects of Cyc103 on behaviour
11. Individual fly locomotor behaviour
Tables
1. Statistical rhythmicity of clock genotypes in natural conditions
2. Morning onset
3. Evening onset

SUPPLEMENTARY INFORMATION
2 | W W W. N A T U R E . C O M / N A T U R E
RESEARCH
2
Fig S1. Monitoring Drosophila locomotor rhythms in the wild.
Environment Monitors Activity Monitors Activity Monitors EM
Leicester, UK, 52°38'N, 01°08'W Treviso, IT, 45o50’ N, 12o15’W
In Leicester, the Trikinetics locomotor activity (8 x 32 channels), and environmental monitors were placed in a child’s playhouse (internal dimensions ~4’ x 4’ x 4’) on a plastic table with open windows allowing access to sunlight and moonlight but shielded from direct sunlight by a large tree (grey represents shadows) and from rainwater. The rear of the playhouse backed onto part of CPK’s house, in which the PC was placed. One activity unit (32 channels) unit is shown below – one fly was placed in each glass tube (8 cm x 4mm internal diameter) with food at one end, and an infra red beam was activated when the fly walked across the midpoint. In Treviso, the activity and environmental monitors (EM) were placed outside a penthouse, completely shaded from the sun. The relative position of the sun from dawn (east) to dusk (west) is shown.

W W W. N A T U R E . C O M / N A T U R E | 3
SUPPLEMENTARY INFORMATION RESEARCH
3
Figure S2. Afternoon components in other clock genotypes.
The average locomotor activity scores +/- sems are given for each 30 min time bin. For cry01, Pdf0 the average temperature over the experiment is 28.0oC (max 34.4oC, min 21.1oC). For pers and perL it is 29.3oC (max 35.9oC, min 23.1oC; for these experiments, N cry0 = 11, N Pdf0 =21 N perL= 25, N pers=26). Red, temperature, yellow, light intensity.

SUPPLEMENTARY INFORMATION
4 | W W W. N A T U R E . C O M / N A T U R E
RESEARCH
4
Figure S3. Seasonal view of morning and evening onsets in Treviso (red) and Leicester (blue).
Each point represents the average onset (mean based of 4-24 flies, median N = 14, +/- sem) for WTALA for a particular day. A. morning onset; b. evening onset. March to November are numbered III to XI.
a
b

W W W. N A T U R E . C O M / N A T U R E | 5
SUPPLEMENTARY INFORMATION RESEARCH
5
Figure S4. Morning onset for other genotypes.
a. pers b. perL c. yw; UAScyc/Pdfgal4;+/+ d. yw; UAScyc/timgal4;+/+ e. yw,UAS-hidUASrpr;Pdfgal4/+;+/+
Blue-Leicester Red-Treviso
The blue area represents the average time from astronomical to nautical twilight, and the yellow area the average time from nautical twilight to sunrise. Each point represents the average Monset (+/- sem) of a group of flies on a particular day. (N= 4 to 24, median =14).
SUPPLEMENTARY INFORMATION
6 | W W W. N A T U R E . C O M / N A T U R E
RESEARCH
6
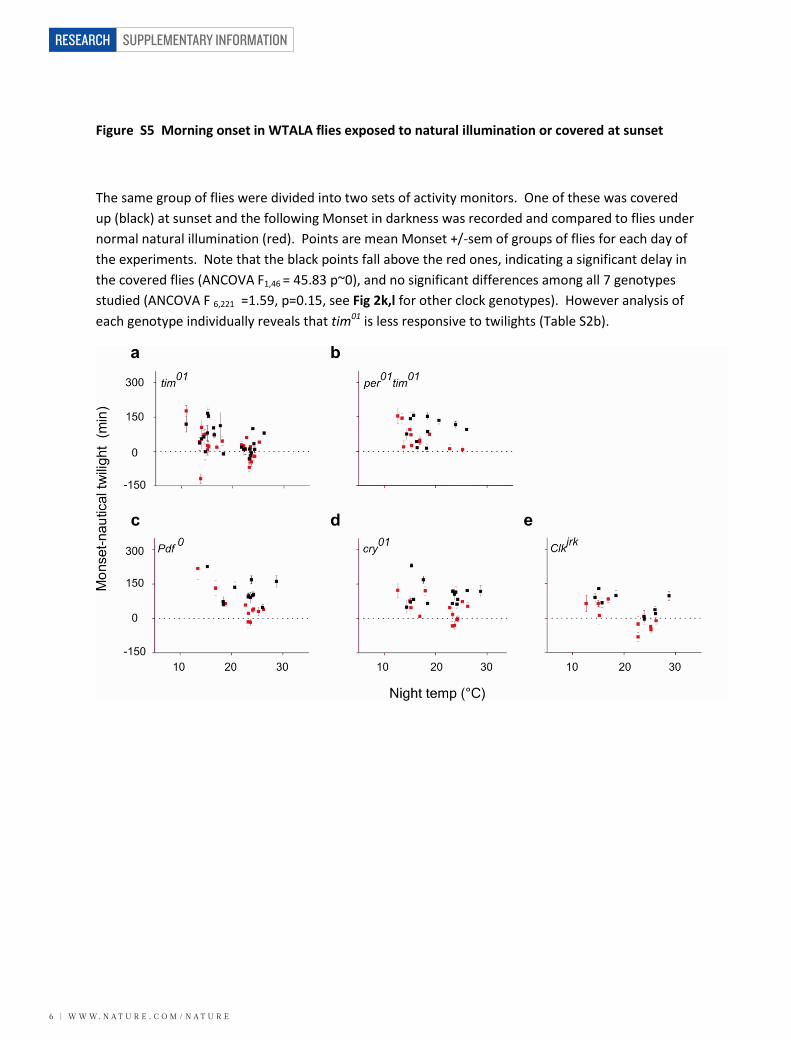
Figure S5 Morning onset in WTALA flies exposed to natural illumination or covered at sunset
The same group of flies were divided into two sets of activity monitors. One of these was covered up (black) at sunset and the following Monset in darkness was recorded and compared to flies under normal natural illumination (red). Points are mean Monset +/-sem of groups of flies for each day of the experiments. Note that the black points fall above the red ones, indicating a significant delay in the covered flies (ANCOVA F1,46 = 45.83 p~0), and no significant differences among all 7 genotypes studied (ANCOVA F 6,221 =1.59, p=0.15, see Fig 2k,l for other clock genotypes). However analysis of each genotype individually reveals that tim01 is less responsive to twilights (Table S2b).

W W W. N A T U R E . C O M / N A T U R E | 7
SUPPLEMENTARY INFORMATION RESEARCH
7
Figure S6 Eonset of other clock-relevant genotypes (blue Leicester, red Treviso)
The red dotted line reflects Tmax, the blue dotted line is the time of highest light intensity (average 2.25 h before Tmax). Red, Treviso, Blue, Leicester. Data for panels C and D was limited in that no recordings were obtained for warmer temperatures, hence the truncated pattern.
F. Eonset compared to M offset.....another measure of siesta length
The Eonset patterns for all genotypes were very similar to those obtained by comparing Eonset to the Moffset, a more conventional measure of the ‘siesta’ 8. Below are examples for WTALA and per01, which are almost identical to the Eonset-Tmax measures shown in Fig 3a and 3d. Thus there is no correlation between per splicing pattern and the length of the siesta at temperatures below 20oC (Fig 3j).

SUPPLEMENTARY INFORMATION
8 | W W W. N A T U R E . C O M / N A T U R E
RESEARCH
8
Figure S7 Locomotor activity of flies exposed to full moonlight (blue) and sheltered (pink) in Treviso.
Red line is temperature, yellow line is light intensity in lux. Time is local time, 0= midnight. ANOVA comparing levels of night activity (<0.5 lux) between exposed and sheltered positions was not significant (F1, 128 =2.47, p=0.12). Flies were exposed to full moon at sunset and returned back to their sheltered positions in the late morning (otherwise they would die in full sunlight), and this causes disturbances to both groups of flies, hence the large variation in sems observed at these times Nsheltered =21, Nexposed=21. Maximum temperature 31.5oC, Minimum 21.1oC, Average 26.4oC.

W W W. N A T U R E . C O M / N A T U R E | 9
SUPPLEMENTARY INFORMATION RESEARCH
9
Figure S8. The peak time for DN1 and DN2 PER antigenicity is significantly advanced compared to the other neuronal subtypes in natural conditions (see also Fig 4B).
Mean time (+/- sem) for peak intensity of PERIOD antigenicity in different clock neurons measured over a 24 h period in May and September 2008 (see Fig 4b) Y-axis is local time (am). A minimum of 10 half brains were analysed for each time point. Below this panel is a figure of the fly brain identifying the different neuronal clusters [from Helfrich-Forster, C. The Neuroarchitecture of the circadian clock in the brain of Drosophila melanogaster. Microscopy Research and Technique, 62, 94-102 (2003)]
May 7-8, 2008 new moon: Tmax 25.7oC ; Tmin 15.5oC; Tmean 20.0oC +/-3.5oC Civil twilights 21.00, 05.15: September 16-17, 2008 full moon Tmax 22.7 oC; T min 13.7 oC; Tmean 17.7 +/-2.8 oC Civil twilights 19.50, 06.22 LNd, dorsal lateral neurons, N=108: sLNvs, small lateral ventral neurons, N=69: 5th-LNv, pdf-null LNv, N=18: DN1s, dorsal neurons 1, N= 209: DN2s, dorsal neurons 2, N= 37: l-LNvs, large lateral ventral neurons, N=69 For each anatomical subgroup, each cell was placed in order of PER intensity from highest to lowest, and the top 10% of cells were used to generate an average value for the time of peak intensity.
Two way ANOVA gave a significant effect for Neurons (F5, 498=13.71, p~0) and Month (F1,498=34.1 p~0), with a significant effect of Month (September peaks were advanced compared to May peaks), but no significant Month x Neuron interaction (F 5,498 = 0.79, p=0.56). Thus the DN1 and DN2 groups have a significantly advanced phase, irrespective of season. For the Figure we pooled the data for the two months given the absence of an interaction, even though this artificially inflates the sems. Another full moon set of ICCs in October 2008 also showed no delay in PER expression of the 5th s-LNv compared to the other lateral neurons and these and other data form part of an extensive seasonal ICC study to be published separately (Menegazzi et al in prep).

SUPPLEMENTARY INFORMATION
1 0 | W W W. N A T U R E . C O M / N A T U R E
RESEARCH
10
Fig S9 Simulated natural conditions
a. Simulated summer (25-35oC) natural conditions in the laboratory for pers and perL.
b. Mean daily frequency (+/-SEM) for Afternoon (A) component observed in different clock genotypes in spring (20-30oC) and summer (25-25oC) simulations.

W W W. N A T U R E . C O M / N A T U R E | 1 1
SUPPLEMENTARY INFORMATION RESEARCH
11
Fig S9 (cont) Simulation experiments
c. Monset (blue squares spring, red circles summer -means +/- sem) .
ANOVA of Monset gave significant Genotype F 5,109=7.71 p~0, Temperature F 1,109=44.46 p~0, and Genotype x Temperature interaction F 5,109=15.12, p~0. Note how Monset comes earlier in warmer summer simulations for all genotypes except tim01, and Clkjrk . The tim01 result is expected given its behaviour in the wild but the Clkjrk response is not (Fig 2, Table S2b). pers and perL show slightly earlier Monsets than the other genotypes (p=0.03, 0.026 Newman-Keuls post-hoc test).
d. Aonset (blue squares spring, red circles summer -means +/- sem).
12
ANOVA of Aonset gave significant Genotype F 5,84=7.6, p= 0.00001, Temperature F 1,84=0.26 p=0.61, ns, and Genotype x Temperature interaction F 5,84=5.85, p=00011. In all genotypes except tim01 and Clkjrk, Aonset comes slightly earlier at the higher summer temperature. Clkjrk shows an unusual response with an earlier Aonset at lower temperatures, giving rise to the significant interaction and Genotype effect. Unlike nature, pers does not show an earlier Eonset than the other genotypes.
e. Eonset (blue squares spring, red circles summer -means +/- sem).
ANOVA of Eonset gave significant Genotype F 5,86=12.53, p~0, Temperature F 1,86=0.95 p=0.633 ns, and Genotype x Temperature interaction F 5,86=2.12, p=0.07, ns. per01 and pers show significantly earlier (p=0.0018, 0.013 respectively), and perL significantly later Eonsets (p=0.024) than the reference WTALA strain. tim01 is significantly earlier than perL (p=0.004).

SUPPLEMENTARY INFORMATION
1 2 | W W W. N A T U R E . C O M / N A T U R E
RESEARCH
12
ANOVA of Aonset gave significant Genotype F 5,84=7.6, p= 0.00001, Temperature F 1,84=0.26 p=0.61, ns, and Genotype x Temperature interaction F 5,84=5.85, p=00011. In all genotypes except tim01 and Clkjrk, Aonset comes slightly earlier at the higher summer temperature. Clkjrk shows an unusual response with an earlier Aonset at lower temperatures, giving rise to the significant interaction and Genotype effect. Unlike nature, pers does not show an earlier Eonset than the other genotypes.
e. Eonset (blue squares spring, red circles summer -means +/- sem).
ANOVA of Eonset gave significant Genotype F 5,86=12.53, p~0, Temperature F 1,86=0.95 p=0.633 ns, and Genotype x Temperature interaction F 5,86=2.12, p=0.07, ns. per01 and pers show significantly earlier (p=0.0018, 0.013 respectively), and perL significantly later Eonsets (p=0.024) than the reference WTALA strain. tim01 is significantly earlier than perL (p=0.004).
13
Figure S10 Locomotor activity of yw;tim gal4/UAS-Cyc ;+/+ at 10oC
Mean activity +/- SEM is shown
10o C LD12:12, grey dark phase, yellow, light phase
Blue yw; UASCyc103/+; +/+ (N=26)
Red yw; timgal4/UASCyc103; +/+ (N=30)
Note how expressing UAS-Cyc103 in clock neurons reduces the Evening component, suggesting that Gal4 is active at low temperature.
12
ANOVA of Aonset gave significant Genotype F 5,84=7.6, p= 0.00001, Temperature F 1,84=0.26 p=0.61, ns, and Genotype x Temperature interaction F 5,84=5.85, p=00011. In all genotypes except tim01 and Clkjrk, Aonset comes slightly earlier at the higher summer temperature. Clkjrk shows an unusual response with an earlier Aonset at lower temperatures, giving rise to the significant interaction and Genotype effect. Unlike nature, pers does not show an earlier Eonset than the other genotypes.
e. Eonset (blue squares spring, red circles summer -means +/- sem).
ANOVA of Eonset gave significant Genotype F 5,86=12.53, p~0, Temperature F 1,86=0.95 p=0.633 ns, and Genotype x Temperature interaction F 5,86=2.12, p=0.07, ns. per01 and pers show significantly earlier (p=0.0018, 0.013 respectively), and perL significantly later Eonsets (p=0.024) than the reference WTALA strain. tim01 is significantly earlier than perL (p=0.004).

W W W. N A T U R E . C O M / N A T U R E | 1 3
SUPPLEMENTARY INFORMATION RESEARCH
14
Fig S11 Individual fly activity. Monset (red arrow), Aonset (blue arrow) and Eonset (green arrow). Light intensity, yellow, temperature cycle, red. WTALA, and the per mutants were monitored together over an average daily temperature of 31.1oC. The Clkjrk fly was monitored over an average temperature of 29.7oC and shows high levels of nocturnal activity.

SUPPLEMENTARY INFORMATION
1 4 | W W W. N A T U R E . C O M / N A T U R E
RESEARCH
15
Table S1 – Percent rhythmicity of clock genotypes in natural conditions
strain <20°C >20°C Mean% ±SD N Nexp Mean % ±SD N Nexp N total
WTALA 99.46±1.48 297 11 98.31±3.17 228 16 525 Canton S 98.95±2.35 79 5 97.62±6.30 138 7 217 HU 98.95±4.08 155 8 96.62±3.5 134 7 289 tim01* 86.63±13.55 192 12 100.00±0.00 129 7 321 per01 95.26±10.10 340 17 91.38±6.13 78 4 418 per01;tim01 95.93±7.35 123 6 100.00±0.00 56 3 179 perS 89.31±8.46 91 4 86.71±9.93 77 4 168 perL 85.89±17.20 95 4 100.00±0.00 70 3 165 Clkjrk** 41.41±21.74 217 11 83.73 39 2 256 Pdf0 96.03±5.26 77 4 93.65±11.00 51 4 128 cry0 95.83±7.22 99 5 100±0.00 50 3 149 pdfG4Cyc 100.00±0.00 81 4 98.55±2.5 69 3 150 timG4Cyc 87.29±21.10 164 7 98.67±2.31 65 3 229 *p=0.02
**p = 0.03
Rhythmicity was formally determined using the CLEAN spectral analysis and autocorrelation procedure (see Methods) on a selection of our experiments across the full temperature range. In these experiments, N is the number of flies examined that survived the observation period. Nexp is the number of experiments analysed, and the SD reflects inter-experimental variance. Only tim01 and Clkjrk show a significant temperature effect (t-test).

W W W. N A T U R E . C O M / N A T U R E | 1 5
SUPPLEMENTARY INFORMATION RESEARCH
16
Table S2 Morning onset (Monset) in wild-types and clock mutant genotypes.
A. The slope of the regression line of Monset on temperature was calculated and compared with that of each wild-type by t-test, the results of which is shown in the table (Bonferroni corrected). Only tim01 which has a marginal temperature dependence and PdfGal4CycΔ103 (which has a steeper slope), show a significant difference in slope against all three wild-type genotypes (see Fig 2). The
ANCOVA of Monset (temperature as covariate, tim01 and Pdfgal4Cyc 103 omitted because they have different temperature curves) is also significant F11, 858=10.57 p~0, and the mean time of Monset was calculated (mins after nautical twilight) from the ANCOVA. When corrected for temperature, the Pdf0 mutant has a significantly delayed Monset compared to all three wild-types (P<0.01). Of the wild-types, WTALA has a significantly earlier Monset than HU, revealing that HU is less sensitive to the twilight driven onset of activity.
Strain Slope (p value of t-test) Mean Monset (mins +/- sem) WTALA Canton S HU
WTALA -- 0.4376 0.6059 58.04 ± 3.37
Canton S 0.4376 -- 0.3163 78.03 ± 7.56
HU 0.6059 0.3163 -- 81.29 ± 6.70
tim01 0.0001 0.0002 0.0001 --
per01 0.2085 0.9892 0.1818 78.99 ± 3.72
per01;tim01 0.3161 0.9948 0.2159 76.77 ± 5.55
perS 0.7504 0.5961 0.4393 93.72 ± 6.15
perL 0.0831 0.1013 0.3535 93.66 ± 7.15
Clkjrk 0.0143 0.0274 0.1532 58.04 ± 3.37
Pdf0 0.5938 0.3175 0.0511 118.60 ± 5.53
cry0 0.0608 0.5514 0.1532 94.81 ± 5.36
pdfgal4CycΔ 0.0001 0.0002 0.0009 -- timgal4CycΔ 0.4369 0.4484 0.7878 82.10 ±7.85
hidrprpdfgal4 0.0673 0.2967 0.0425 85.94 ±9.57
B. Individual analysis (ANCOVA) of genotypes covered at night. Note that tim01 just fails to reach significance revealing that this mutant’s morning activity is less sensitive to twilights
df F p WTALA 49 19.70 0.00005 tim01 42 3.88 0.05558 per01 46 45.83 0.00000 per01;tim01 19 18.63 0.00037 Clkjrk 15 11.92 0.00355 Pdf0 20 8.96 0.00718 cry0 24 12.72 0.00156

SUPPLEMENTARY INFORMATION
1 6 | W W W. N A T U R E . C O M / N A T U R E
RESEARCH
17
Table S3A. Regression analysis for Evening onset data collected at >20 and < 20oC daylight temperature
strain 20oC slope±SEM df Adj R2 F P
WTALA > 0.46 ± 0.03 80 0.69 182.89 ~0 WTALA < -0.12 ± 0.05 101 0.04 5.60 0.02 Canton S > O.44 ± 0.10 11 0.62 20.31 ~0 Canton S < 0.02 ± 0.05 30 -0.03 0.23 0.6322 HU > 0.54 ± 0.07 10 0.84 58.21 ~0 HU < -0.15 ± 0.06 33 0.15 7.18 0.01 tim01 > 0.42 ± 0.05 21 0.76 70.58 ~0 tim01 < -0.23 ± 0.14 37 0.04 2.75 0.11 per01 > 0.43 ± 0.04 38 0.71 97.37 ~0 per01 < -0.08 ± 0.11 49 -0.008 0.60 0.44 per01;tim01 > 0.34 ± 0.06 38 0.71 97.3736 ~0 per01;tim01 < 0.002 ± 0.31 26 -0.04 ~0 0.99 perS > 0.21 ± 0.06 41 0.19 10.90 0.002 perS < -0.44 ± 0.35 17 0.03 1.60 0.22 perL > 0.25 ± 0.05 35 0.35 20.81 ~0 perL < -0.29 ± 0.32 16 -0.01 0.78 0.39 Clkjrk > 0.73 ± 0.09 25 0.74 73.45 ~0 Clkjrk < -1.12 ± 0.26 29 0.37 18.39 ~0 Pdf0 > 0.48 ± 0.05 47 0.66 96.21 ~0 Pdf0 < 0.41 ± 0.31 14 0.05 1.81 0.20 cry0 > 0.52 ± 0.07 36 0.63 63.43 ~0 cry0 < 0.13 ± 0.23 22 -0.03 0.34 0.57
For all genotypes the data >20oC always shows a highly significant fit with a positive slope. For data collected at <20oC,WTALA, HU give small but significant negative slopes, whereas Clkjrk gives a larger significant negative slope (outlined in red)

W W W. N A T U R E . C O M / N A T U R E | 1 7
SUPPLEMENTARY INFORMATION RESEARCH
18
Table S3B Mean position of Evening onset compared to Tmax for data collected <20oC daylight temperature
(ANOVA, F10,384 = 4.02 p = ~0)
*C significantly different from Canton-S, **WH significantly different from WTALA and Houten (Newman-Keuls post-hoc test). Note how perS and per01 show Eonset earlier than Tmax, whereas perL follows Tmax
Table S3C – Mean position of Evening onset compared to Tmax for data collected >20oC daylight temperature
(ANCOVA, temperature as covariate F10,381 = 14.51 p = ~0 ).
strain Mean (h) +/- SEM N WTALA 1.93 +/- 0.15 83 Canton S 3.14 +/- 0.37 13 HU 1.24 +/- 0.36 14 tim01 1.01 +/- 0.27*C 24 per01 0.75 +/- 0.21*C 40 per01; tim01 1.57 +/- 0.24 30 perS 0.03 +/- 0.21*** 39 perL 3.07 +/- 0.22**WH 36 Clkjrk 1.76 +/- 0.26 27 Pdf0 1.98 +/- 0.19 49 cry01 1.64 +/- 0.22*H 38
*C significantly different from Canton-S, *H significantly different from Houten, **WH significantly different from WTALA and Houten, *** significantly different from all three wild-type strains (Newman-Keuls post-hoc test). Again note how perS has an earlier onset at ~Tmax, whereas perL Eonset is 3 h later.
strain Mean (h) +/- SEM N WTALA -0.87 +/- 0.17 102 Canton S -0.03 +/- 0.30 32 HU -0.83 +/- 0.29 35 tim01 -1.24 +/- 0.28 39 per01 -1.41 +/- 0.24 51 per01;tim01 -0.36 +/- 0.33 28 perS -1.59 +/- 0.39*C 19 perL 0.67+/- 0.41**WH 18 Clkjrk -1.02 +/- 0.31 31 Pdf0 -0.54 +/- 0.43 16 cry01 -1.64 +/- 0.35*C 24