Embed Size (px)
Citation preview

MINUTES
UNIVERSITY ADVISORY COUNCIL ON STRATEGIC BUDGETING AND PLANNING
December 5, 2013
PRESENT: Amy Brunner, Martin Daniel, Wendy Herdman, Tim Hodge, William Knocke, Mark McNamee, Joe Merola, Quinton Nottingham, Leslie O’Brien, John Phillips, Dwight Shelton, Ken Smith, Sue Teel
ABSENT: Renee Boyer, Elizabeth Fine, Balachandar Guiduri, Andrew McCoy, Theresa Pancotto, Timothy Scott, Jason Soileau, Connie Stovall
1. CALL TO ORDER Dr. Mark McNamee, Senior Vice President and Provost, called the meeting to order at 3:00 p.m.
2. APPROVAL OF THE OCTOBER 24, 2013 MINUTES Dr. McNamee announced that the minutes of the October 24, 2013 meeting have been electronically approved and sent to University Council for posting on the web.
3. UPDATE ON ADMINISTRATIVE EFFICIENCY ASSESSMENT AND INITITATIVES
Mr. Dwight Shelton, Vice President for Finance and Chief Financial Officer, reviewed that the Council had expressed interest in several topics. In response, the university had developed materials to present to respond to two of those requests today: update on administrative efficiency assessment and initiatives and faculty compensation.
Mr. Shelton introduced Mr. Tim Hodge, Assistant Vice President for Budget and Financial Planning to update the council on the university’s assessment of administrative efficiency and share initiatives to further enhance administrative efficiency.
Mr. Hodge reviewed four assessment methodologies used by external groups to consider administrative efficiency at institutions of higher education: 1) Administrative costs as a percentage of core expenditures (IPEDS), 2) Administrative costs per student FTE (SHEEO), 3) Administrative staffing level per student FTE (Delta Cost Study), and 4) allocation of resources between primary and support programs (Virginia Auditor of Public Accounts). Virginia Tech was benchmarked against peer institutions, public research institutions, and Virginia public research institutions. Findings of these studies showed that with respect to the comparable institutions: a smaller portion of Virginia Tech’s core expenditures is spent on administrative costs, Virginia Tech spends less on administrative costs per student FTE, Virginia Tech employs fewer full-time administrative employees per student FTE, and VT allocates a greater proportion of tuition and fees to core programs than other Virginia institutions. The slides from this presentation are attached to the minutes.
Mr. Hodge reviewed two perspectives on the State Council of Higher Education’s (SCHEV) assessment of institutional funding adequacy. Overall Virginia Tech continues to have a funding shortfall which stretches resources across campus.
To respond to the question about efforts undertaken to enhance administrative efficiency, Mr. Hodge shared examples of university efforts to enhance and leverage efficiency initiatives, new efforts underway, and planned initiatives that will help leverage technology, enhance efficiency, and reduce energy consumption which will result in increased resources for core programs. Administrative efficiency is a top priority for Virginia Tech. To maintain this focus moving forward, administrative efficiency has been added to the Board of Visitor’s Scorecard with a goal to remain within the top 5 of peer institutions. VT is currently ranked 2nd, up from 3rd last year.
4. FACULTY COMPENSATION UPDATE
In response to the question about faculty compensation, Mr. Hodge provided an overview of the faculty compensation policy environment, the benchmarking process with SCHEV approved peer institutions, and the importance of faculty compensation to the overall institutional funding model. Reductions in state support have prevented traditional merit process during the recession. The Commonwealth has a cost-sharing formula for faculty compensation and other costs which has the institution funding a significant portion of the cost. The overall result of the July 25, 2013 faculty merit process was reviewed which resulted in a 4.8% overall increase. Achieving the 60th percentile will take an estimated 4.1% annual increase for the next six years based on the state’s traditional methodology and SCHEV’s assumptions. Restoration of the annual merit process remains a top institutional priority to ensure sustained progress towards salary competitiveness. If the Commonwealth cannot contribute to a faculty salary increase annually, the university has a contingency plan for more modest faculty salary increases based upon the institutional share of the annual process. PowerPoint slides for this presentation are attached to the minutes.
5. OTHER BUSINESS
There being no further business, the meeting adjourned at 4:10 p.m.

Update on Administrative Efficiency Assessment & Initiatives University Advisory Council on Strategic Budgeting and Planning
December 5, 2013
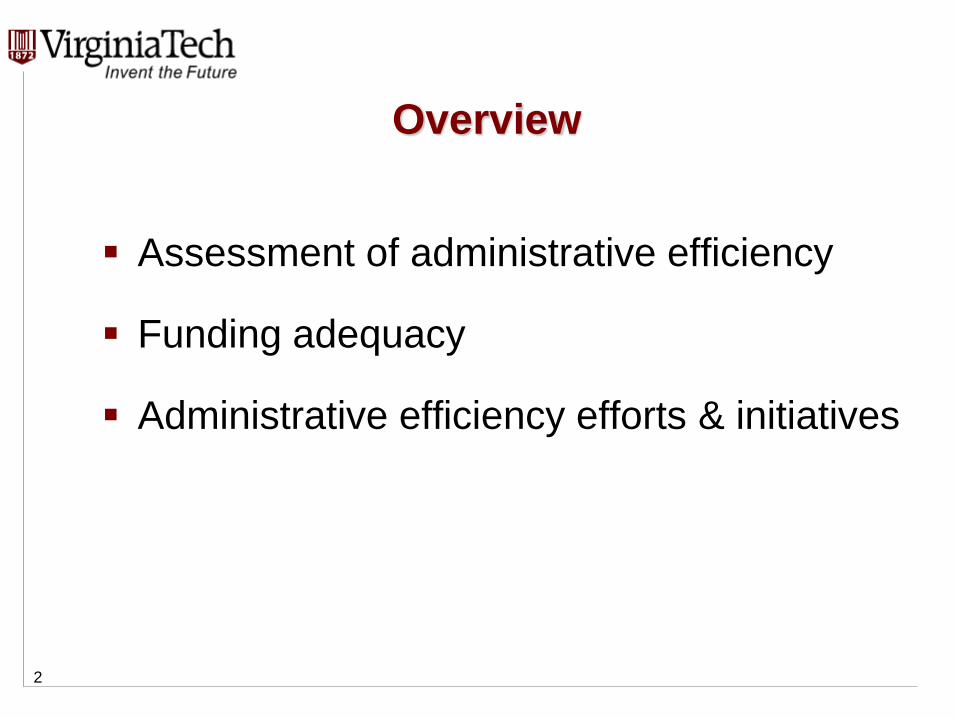
Overview
Assessment of administrative efficiency
Funding adequacy
Administrative efficiency efforts & initiatives
2

Assessment Methodologies Three industry standard perspectives and a state method:
1. Administrative costs as a percentage of core expenditures
Traditional methodology of examining costs by program (IPEDS )
2. Administrative costs per student FTE
2011 report by State Higher Education Executive Officers
(SHEEO) - Staffing Trends in Public Colleges and Universities
3. Administrative staffing level per student FTE
Delta Cost Study on Postsecondary Education Costs
4. Also examined allocation of resources between primary
and support programs
Virginia Auditor of Public Accounts (APA) methodology
3

Assessment Methodology
Benchmarked against:
Peer institutions
Public research institutions
Virginia research institutions
Data from the Integrated Postsecondary Education Data System
(IPEDS)
4

Functional Expense Classification
Core Expenditures * Other Expenditures
Instruction Auxiliary Enterprises
Research Hospitals
Public Service Independent Operations
Academic Support
Student Services
Institutional Support
Operation and Maintenance of Plant
Depreciation
Scholarships and Fellowships
*Core expenditures as defined by the Integrated Postsecondary Education Data System (IPEDS), GASB 5

Administrative Expenses
Academic support – Academic Administration
Support for instruction, research, public service
Academic computing
Deans’ offices
Library & ancillary (data limitation)
Institutional support – Central Administration
General administrative services
Executive management
Legal and fiscal operations
Public relations
Other centralized services 6

Administrative Costs as a Percentage of Core
Expenditures
7
21% 18% 19% 15%
79% 82% 81% 85%
0%
10%
20%
30%
40%
50%
60%
70%
80%
90%
100%
Virginia ResearchAverage (n=2)
Public ResearchAverage (n=72)
SCHEV PeerAverage (n=25)
Virginia Tech
Remaining Core Expenditures (Instruction,Research, Public Service, etc.)
Academic & Institutional Support
Fiscal Year 2011

Administrative Spending per Student FTE
8 Fiscal Year 2011
$3,943 $3,846 $4,319
$2,231
$3,110 $3,013
$3,843
$1,870
$-
$1,000
$2,000
$3,000
$4,000
$5,000
$6,000
$7,000
$8,000
$9,000
Virginia Research Average(n=2)
Public Research Average(n=72)
SCHEV Peer Average(n=25)
Virginia Tech
Institutional Support
Academic Support
VA Tech spends $4,224 less
on academic and institutional
support costs per student than
our average SCHEV peers.

Administrative Employees per 100 Student FTE
9
1.1 1.4 1.7 0.9
6.5
8.9
9.6
5.9
3.3
2.9
3.3
3.8
3.5
2.9
3.2
1.3
0.0
2.0
4.0
6.0
8.0
10.0
12.0
14.0
16.0
18.0
20.0
Virginia Research (n=2) Public ResearchAverage (n=72)
SCHEV Peer Average(n=25)
Virginia Tech
Clerical/Secretarial
Technical/paraprofessional
Other Professionals
Executive/Administrative/Managerial
VT has 5.9 fewer FT
administrative employees
per 100 students than our
SCHEV peers.
Fiscal Year 2011

10
85
%
84
%
83
%
73
%
70
%
68
%
68
%
63
%
62
%
59
%
57
%
56
%
56
%
53
%
49
%
15
%
16
%
17
%
27
%
30
%
32
%
32
%
37
%
38
%
41
%
43
%
44
%
44
%
47
%
51
%
0%
10%
20%
30%
40%
50%
60%
70%
80%
90%
100%
E&G Non-E&G
Mandatory Non-E&G Fees as a Percentage of Mandatory Costs Virginia Public Institutions, 2013-14
Another Perspective on Efficiency

Findings of Administrative Cost Studies
With respect to the comparable institutions:
A smaller portion of Virginia Tech’s core
expenditures is spent on administrative costs.
Virginia Tech spends less on administrative
costs per student FTE
Virginia Tech employs fewer full-time
administrative employees per student FTE
VT allocates a greater proportion of tuition and
fees to core programs than other Virginia
institutions 11

$83
,35
8,5
01
$3
5,9
78
,80
7
$2
6,2
50
,51
0
$8
,51
8,4
31
$5
04
,25
9
$4
78
,54
9
$(1
31
,26
6)
$(3
55
,30
0)
$(1
,01
2,1
62
)
$(1
,44
8,0
11
)
$(2
,08
6,7
24
)
$(8
,04
5,4
97
)
$(1
8,7
31
,16
8)
$(2
0,9
08
,48
1)
$(4
6,3
03
,04
5)
System-wide Funding Adequacy As Calculated by SCHEV, Fall 2013
This is the Commonwealth’s recognized shortage of
faculty, staff, and resources for operation at Virginia
Tech.
12

VT Total Shortfall
Faculty salaries are a major driver of the BBA
model.
To achieve the 60th percentile and 100% BBA
would require $78.6 million.
13

Virginia Tech maintains a cost conscious culture
that is sensitive to administrative costs.
VT strives to maintain its competitive advantage in
this area into the future by automating and
streamlining processes.
VT has invested, and continues to invest in
initiatives to become more efficient while
maintaining our effectiveness.
Examples of efficient initiatives to provide a sense
of the range and scope of activities
Maximization of Existing Resources Efficiency and Effectiveness
14
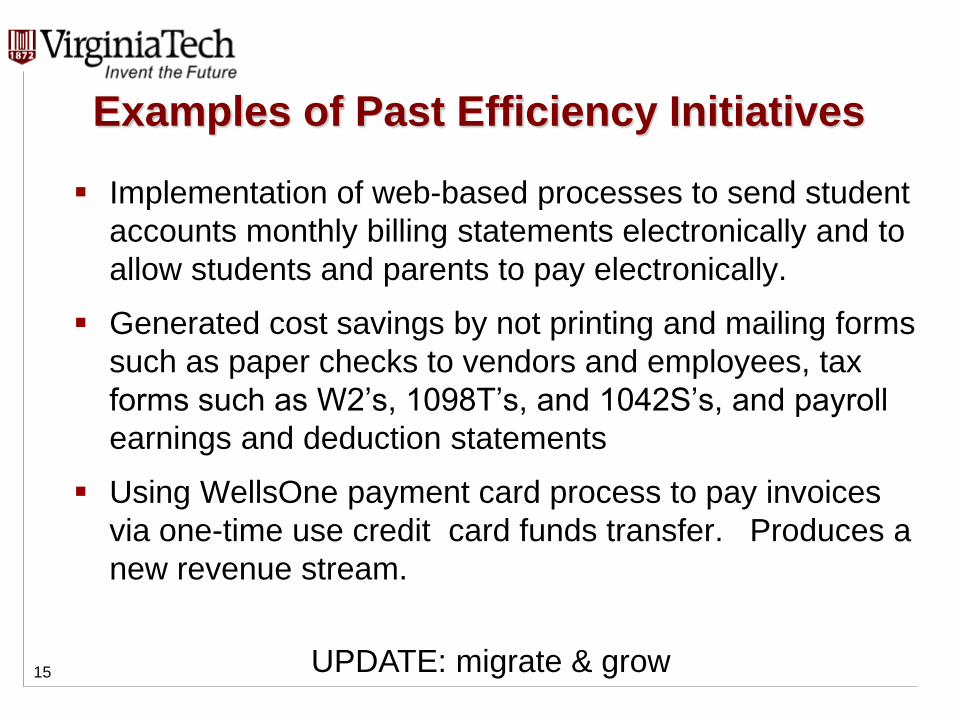
Implementation of web-based processes to send student
accounts monthly billing statements electronically and to
allow students and parents to pay electronically.
Generated cost savings by not printing and mailing forms
such as paper checks to vendors and employees, tax
forms such as W2’s, 1098T’s, and 1042S’s, and payroll
earnings and deduction statements
Using WellsOne payment card process to pay invoices
via one-time use credit card funds transfer. Produces a
new revenue stream.
Examples of Past Efficiency Initiatives
15 UPDATE: migrate & grow

HokieMart
A single marketplace where electronic orders can be
formulated and issued to commercial as well as
internal suppliers.
Provides for single-source data entry, on-line approvals
and workflow, and electronic delivery of completed
orders to suppliers.
For high volume vendors the processes are fully
automated from electronic requisition to electronic
payment including the automated three-way matching
of purchase order, invoice and receiving reports.
Examples of Past Efficiency Initiatives
16 UPDATE: expand & leverage

Cooperative Procurement Contracting
Collaborative procurement process with involving other
Virginia universities resulted in negotiation of
substantially improved cost pricing than had been
provided in the previous higher education contract and
in comparison to the existing state contract.
Examples of Past Efficiency Initiatives
17

Energy Savings
Energy Service Company (ESCO)
Implementation of green and sustainability initiatives to
create efficiencies, control costs, and reduce the
university's impact on the environment. Initiatives
included strategic investments in infrastructure,
retrofitting existing facilities, regional power management
systems, energy efficiency lighting and management of
peak electric power consumption.
Optimize usage of central powerhouse with preferential
loading of boilers combined with campus steam
reductions have resulted in increased BTU utilization.
Examples of Current Efficiency Initiatives
18

Renovation Services Outsourcing
Resulted in improved renovation services to campus
community as well as annual savings. Once the
university reaches a certain volume threshold,
additional savings are expected to be realized through
reduced fees.
Improvements in Accounts Payable Processing
Imaging, electronic matching, e-invoicing, etc. resulted
in increased efficiencies and elimination of the need for
multiple positions.
Examples of Current Efficiency Initiatives
19

In-house Surplus Auctions
The university transitioned the surplus auction
management from the State to the University resulting
in cost savings to the university.
Video Conferencing
The university has implemented video conferencing
units on campus and throughout the state at strategic
locations. This has significantly reduced the need for
travel for face to face interactions.
Examples of Current Efficiency Initiatives
20
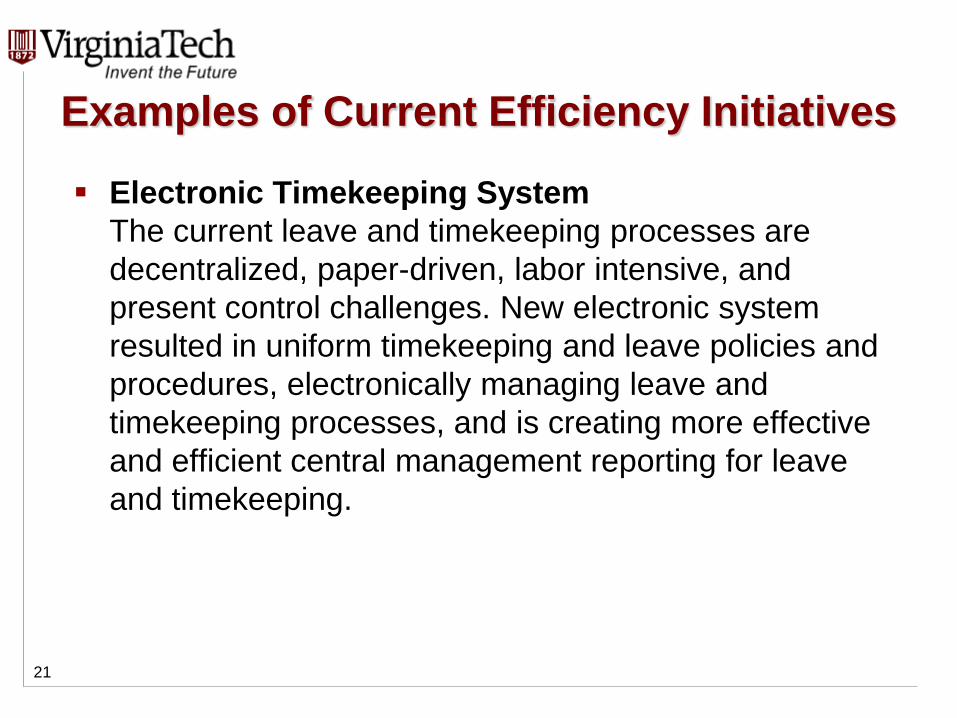
Electronic Timekeeping System
The current leave and timekeeping processes are
decentralized, paper-driven, labor intensive, and
present control challenges. New electronic system
resulted in uniform timekeeping and leave policies and
procedures, electronically managing leave and
timekeeping processes, and is creating more effective
and efficient central management reporting for leave
and timekeeping.
Examples of Current Efficiency Initiatives
21

Research Administration System
The university has invested in a coordinated research
administration system to effectively manage pre and
post-award processes, minimizing manual effort,
improving faculty management of resources, and
streamlining of Office of Sponsored Programs staffing.
Cash Receipt System
Travel and Expense Reimbursement System
Automated system which will allow employees to plan
their travel and file their expense reimbursement
request electronically.
Examples of Ongoing/Planned Efficiency
Initiatives
22

Efficiency is a priority
New BOV scorecard measure instituted with a goal of remaining in
the Top 5 efficient schools as compared to our peers.
VT must continue to be conscious of administrative
costs and seek additional operating efficiencies
Summary
Measure Current
Target Results 2012 Results 2013
CAMPUS INFRASTRUCTURE, EFFICIENCY, AND COST CONTAINMENT
Administrative Cost Efficiency as
measured per Delta Cost Project
methodology against peer institutions
Top 5 of peers 3rd
(FY10)
2nd
(FY11)
23

Faculty Compensation Update University Advisory Council on Strategic Budgeting and Planning
December 5, 2013

Office of Budget and Financial Planning
Commonwealth has longstanding goal that institutions of
higher education reach the 60th percentile of SCHEV
approved Peer institutions.
Peer group negotiation occurs each 10 years
Not only are faculty salaries important as a function of
recruitment and peer competition, faculty salaries are a key
driver of the higher education funding model in Virginia.
Total calculated need is driven by faculty salary, which in turn drives
support needs including staff, graduate assistants, and related
operation costs of the Educational & General program.
Faculty Compensation
Policy Environment

Office of Budget and Financial Planning

Office of Budget and Financial Planning
State cost-sharing formula in Virginia -- universities are
responsible for a significant portion of compensation
programs:
University Division (E&G):
59% of statewide salary action
100% of institutional salary action
Cooperative Extension & Agricultural Experiment Station Division (E&G)
5% of statewide salary action
100% of institutional salary action
Sponsored Programs & Auxiliary Enterprises
100% of any action
Compensation
Cost Sharing

Faculty Salaries
July 25, 2013: University implemented first
merit process since 2007
State provided GF share of 3% statewide increase
(41% of total cost in 208, 95% of total cost in 229)
University reallocated additional resources to
enhance merit process
This resulted in an average faculty increase of 4.8%

Office of Budget and Financial Planning
To reach the 60th percentile of peer faculty salaries, the
university will need to increase the average salary by 4.1%
per year over 6 years.
Restoration of annual merit process is needed to ensure
sustained progress towards salary competitiveness
If the Commonwealth cannot contribute to a faculty salary
increase annually, the university has a plan for more modest
faculty salary increases based upon the institutional share of
the annual progress needed.
Faculty Salary Competitiveness

Office of Budget and Financial Planning
Faculty Salary Benchmark
$70,000
$80,000
$90,000
$100,000
$110,000
$120,000
$130,000
Fall 2013 Projected Average Salaries at Peer Institutions
Projected Average Salary Projected 60th Percentile
22%

Office of Budget and Financial Planning
Faculty Salary Status FY14
SCHEV’s Assessment of Virginia Publics
Source: SCHEV, October 28, 2013
0.0% 0.0%
3.9%
8.9% 9.0% 9.5% 10.1%
11.4% 11.6% 11.7% 11.9% 12.7%
14.5%
16.2%
20.4%
NS
U
UV
AW
LU
VC
U
JM
VT
VS
U
UV
A
OD
U
CW
M
UM
W
CN
U
RU
VM
I
GM
U
% Increase to 60th Percentile Goal

Office of Budget and Financial Planning
Faculty Salary Progress Towards 60th Percentile of Peer Group
(Fall 2013-Fall 2019)
$70,000
$80,000
$90,000
$100,000
$110,000
$120,000
Ave
rag
e S
ala
ry
Peer 60th %tile
SCHEV Authorized
Projected
Estimated

Office of Budget and Financial Planning
Planning Ahead

Office of Budget and Financial Planning
The university is committed to achieving appropriate
compensation programs for all university employees
Faculty Salary competitiveness remains a top priority for
the university; the 60th percentile of the salary peer group
Reductions is state support have prevented traditional
merit process during the recession
Faculty Salary needs are at the top of our priorities in
discussions with state and within university’s six-year plan
University will continue to work towards meeting the 60th
percentile goal
Compensation Priorities

Office of Budget and Financial Planning
In the absence of state budget reductions, one
reasonable strategy would be to:
Develop a multi-year plan for faculty salary increases,
Continue to work for General Fund support each year,
Increase tuition and fee rates annually at rates that will
support the nongeneral fund share of faculty salary
increases, and
Implement the rate supported by nongeneral funds in
years when General Fund support is not available
Compensation Priorities
Office of Budget and Financial Planning
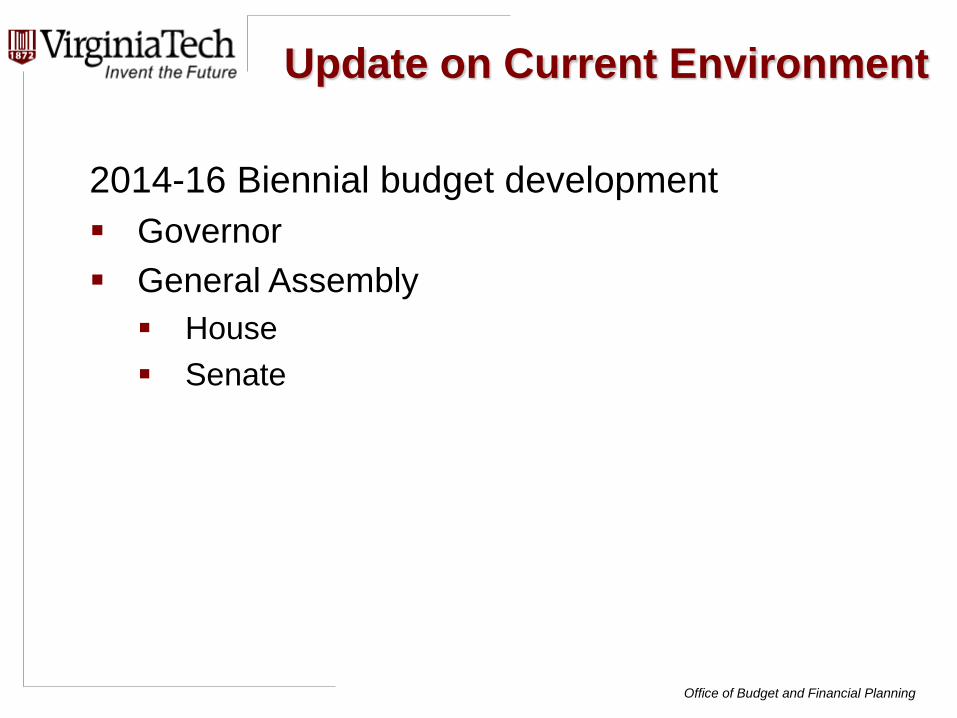
Update on Current Environment
2014-16 Biennial budget development
Governor
General Assembly
House
Senate

Office of Budget and Financial Planning
Questions?