Embed Size (px)
Citation preview
Policy and Economic Analysis Program Rotman School of Management
University of Toronto 105 St. George Street
Toronto, ON M5S 3E6
Final Report
December 2012
Mining: Dynamic and Dependable for Ontario’s Future
by
Peter Dungan and Steve Murphy
Submitted to: Ontario Mining Association
Assistance from the Ontario Ministry of Northern Development and Mines is appreciated.
Mining: Dynamic and Dependable for Ontario’s Future
Table of Contents Executive Summary i
Introduction 1
Mineral Production 2
Mining Industry Employment and Wages 7
Comparing Employment in the Ontario Mining Industry to Other Industries 12
Distribution of Employment Compensation in the Ontario Mining Industry 16
Mining Safety Moves Towards “Zero Harm” 18
Commodity Prices 21
Location of Customers 25
International Trade in Minerals 26
Taxes Paid by the Mining Industry 29
Investing in the Future 31
Turning Exploration into Development 33
New Mines from Old Sites 35
Miner for the Future – Building on a Major Investment 36
The Ring of Fire – Opportunities and Challenges 37
Can the Industry Build on these Investments? 39
Mining Innovation and Patents 40
Environmental Sustainability 42
Mining’s Beneficial Impact on Other Sectors 44
Upstream Impacts from the Input-Output Analysis – Industry Results 47
Upstream Impacts from the Input-Output Analysis – Employment Results 48
Upstream Impacts from the Input-Output Analysis – Foreign Leakages 49
Including Induced Impacts from Ontario Mining using Input-Output Analysis 50
Trying to Get Some Regional Perspective on the Numbers 53
The Toronto Stock Exchange is a World Leader in Mining Listings and Financing 55
Mining’s Impact on the Broader Community 60
Appendix A: Map Used to Define Regions in Ontario Mining Association Survey 61
Appendix B: Detailed Input-Output Results 62
Appendix C: Ontario Location of CAMESE Members – By Industry Sub-Sector 69
Mining: Dynamic and Dependable for Ontario’s Future
List of Charts Chart Page 1 Value of Output in the Metal Mining, Non-Metal Mining and Total Ontario Mining Industry 5 2 Employment in the Ontario Mining Industry 8 3 Output per Worker in the Metal Mining and Total Ontario Mining Industry 8 4 Mining Employment in Ontario, by Job Category, 2011 9 5 Mining Employment in Ontario, by Region, 2011 9 6 % Share of Ontario Mining Industry Employment, By Age Category 10 7 % Share of Ontario Mining Industry Aboriginal Employment, 2010 and 2011 11 8 % Share of Ontario Mining Industry Employment, By Gender, 2010 and 2011 11 9 % Share of Ontario Mining Industry Employment, By Union Affiliation, 2010 and 2011 11 10 Employment in Ontario Mining-Related Industries 12 11 Employment in the Mining Industry Compared to Other Natural Resource Based Industries 13 12 2011 Ontario Real Value Added per Employee, by Industry, Relative to Mining 14 13a Average Weekly Wages, by Ontario Resource-Related Industry 14 13b Average Weekly Wages, by Ontario Industry 15 13c Average Weekly Wages, by Ontario Mining-Related Industry 15 14 Mining Wages & Salaries Paid in Ontario, by Job Category, 2011 16 15 Mining Wages & Salaries Paid in Ontario, by Region, 2011 17 16a Taxable Benefits Paid as a % of Mining Wages & Salaries Paid, by Ontario Region 17 16b Non-Taxable Benefits Paid as a % of Mining Wages & Salaries Paid, by Ontario Region 17 17 Lost-Time Injury Frequency in the Ontario Mining Industry 19 18 Total Medical Injury Frequency in the Ontario Mining Industry 19 19 Ontario Mining Industry, Training and Health & Safety Spending per Employee 20 20a London PM Gold Price per Ounce 21 20b London Metal Exchange Nickel Price per Pound 22 20c London Metal Exchange Copper Price per Pound 22 20d London PM Platinum Price per Ounce 23 20e London PM Palladium Price per Ounce 23 20f London Metal Exchange Zinc Price per Pound 24 20g London Silver Price per Ounce 24 21 Location of Mine Customers by % Share, 2010 and 2011 25 22 Ontario International Trade Balance 26 23 Employer Payroll Taxes paid by the Ontario Mining Industry 29 24 Estimates of the Fed’l and Prov’l Corporate Income Taxes Paid by the Ontario Mining Industry 30 25 Property Taxes paid by the Ontario Mining Industry, by Region 30 26 Ontario Mineral Exploration Spending 32 27 Capital Expenditures in the Ontario Mining Industry 33 28 Industrial Electricity Rates in Canada, 2002-2010 39 29 Ontario Mining Industry Research & Development Spending 41 30 Ontario Mining Industry Environmental Protection Spending 42 31 Daily Load Profile for the Ontario Metal Ore Mining Industry and Total Provincial Demand 43 32 Location of Mine Suppliers by % Share, 2010 and 2011 44 33 Share of $1 Billion of OMA Mineral Production in Ontario 46 34 Share of Value of Global Mine Equity Financings, 2007-2011 55 35 Value of Shares Traded on the TSX, Mining and Other 56 36 Volume of Shares Traded on the TSX Venture, Mining and Other 56 37 Value of Shares Traded on the TSX Venture, Mining and Other 57 38 Volume of Shares Traded on the TSX, Mining and Other 57
Mining: Dynamic and Dependable for Ontario’s Future
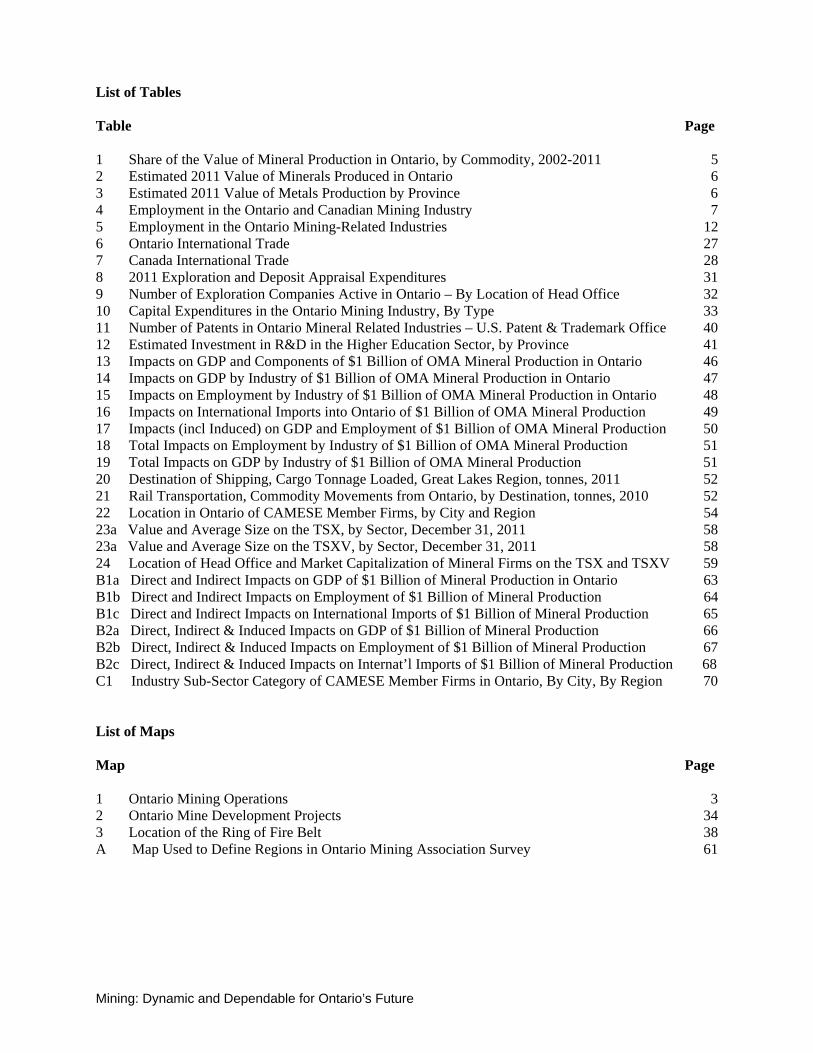
List of Tables Table Page 1 Share of the Value of Mineral Production in Ontario, by Commodity, 2002-2011 5 2 Estimated 2011 Value of Minerals Produced in Ontario 6 3 Estimated 2011 Value of Metals Production by Province 6 4 Employment in the Ontario and Canadian Mining Industry 7 5 Employment in the Ontario Mining-Related Industries 12 6 Ontario International Trade 27 7 Canada International Trade 28 8 2011 Exploration and Deposit Appraisal Expenditures 31 9 Number of Exploration Companies Active in Ontario – By Location of Head Office 32 10 Capital Expenditures in the Ontario Mining Industry, By Type 33 11 Number of Patents in Ontario Mineral Related Industries – U.S. Patent & Trademark Office 40 12 Estimated Investment in R&D in the Higher Education Sector, by Province 41 13 Impacts on GDP and Components of $1 Billion of OMA Mineral Production in Ontario 46 14 Impacts on GDP by Industry of $1 Billion of OMA Mineral Production in Ontario 47 15 Impacts on Employment by Industry of $1 Billion of OMA Mineral Production in Ontario 48 16 Impacts on International Imports into Ontario of $1 Billion of OMA Mineral Production 49 17 Impacts (incl Induced) on GDP and Employment of $1 Billion of OMA Mineral Production 50 18 Total Impacts on Employment by Industry of $1 Billion of OMA Mineral Production 51 19 Total Impacts on GDP by Industry of $1 Billion of OMA Mineral Production 51 20 Destination of Shipping, Cargo Tonnage Loaded, Great Lakes Region, tonnes, 2011 52 21 Rail Transportation, Commodity Movements from Ontario, by Destination, tonnes, 2010 52 22 Location in Ontario of CAMESE Member Firms, by City and Region 54 23a Value and Average Size on the TSX, by Sector, December 31, 2011 58 23a Value and Average Size on the TSXV, by Sector, December 31, 2011 58 24 Location of Head Office and Market Capitalization of Mineral Firms on the TSX and TSXV 59 B1a Direct and Indirect Impacts on GDP of $1 Billion of Mineral Production in Ontario 63 B1b Direct and Indirect Impacts on Employment of $1 Billion of Mineral Production 64 B1c Direct and Indirect Impacts on International Imports of $1 Billion of Mineral Production 65 B2a Direct, Indirect & Induced Impacts on GDP of $1 Billion of Mineral Production 66 B2b Direct, Indirect & Induced Impacts on Employment of $1 Billion of Mineral Production 67 B2c Direct, Indirect & Induced Impacts on Internat’l Imports of $1 Billion of Mineral Production 68 C1 Industry Sub-Sector Category of CAMESE Member Firms in Ontario, By City, By Region 70 List of Maps Map Page 1 Ontario Mining Operations 3 2 Ontario Mine Development Projects 34 3 Location of the Ring of Fire Belt 38 A Map Used to Define Regions in Ontario Mining Association Survey 61
Mining: Dynamic and Dependable for Ontario’s Future i
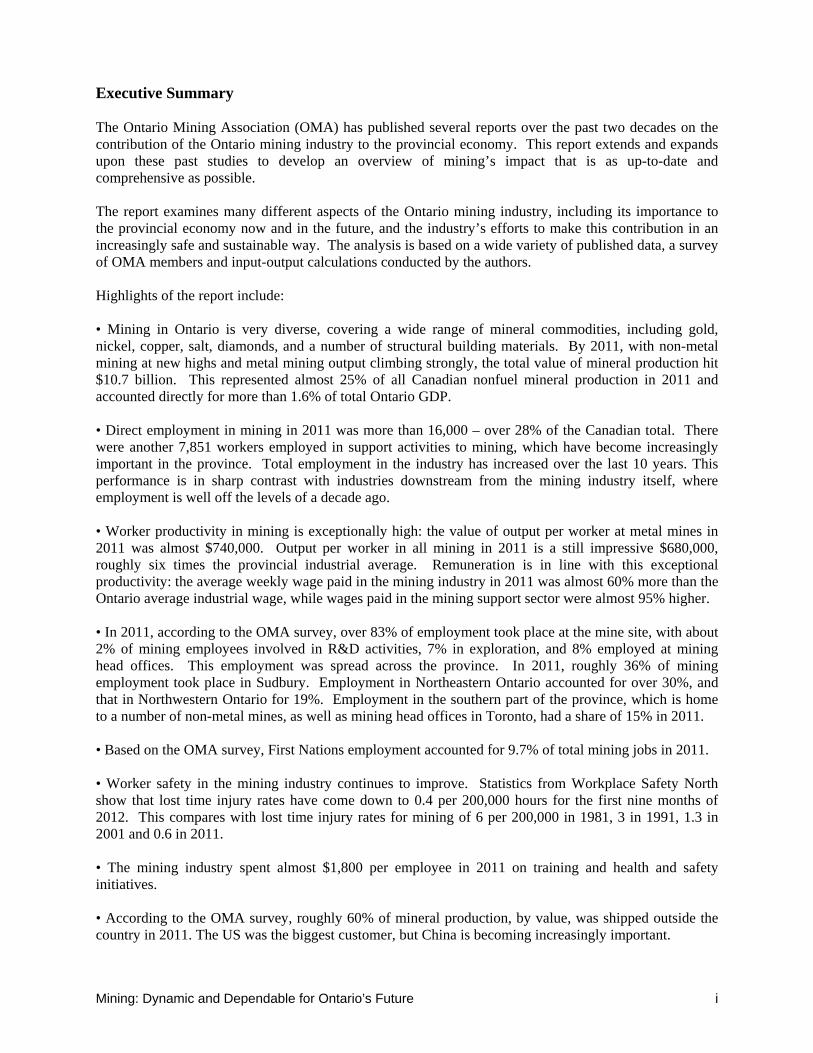
Executive Summary The Ontario Mining Association (OMA) has published several reports over the past two decades on the contribution of the Ontario mining industry to the provincial economy. This report extends and expands upon these past studies to develop an overview of mining’s impact that is as up-to-date and comprehensive as possible. The report examines many different aspects of the Ontario mining industry, including its importance to the provincial economy now and in the future, and the industry’s efforts to make this contribution in an increasingly safe and sustainable way. The analysis is based on a wide variety of published data, a survey of OMA members and input-output calculations conducted by the authors. Highlights of the report include: • Mining in Ontario is very diverse, covering a wide range of mineral commodities, including gold, nickel, copper, salt, diamonds, and a number of structural building materials. By 2011, with non-metal mining at new highs and metal mining output climbing strongly, the total value of mineral production hit $10.7 billion. This represented almost 25% of all Canadian nonfuel mineral production in 2011 and accounted directly for more than 1.6% of total Ontario GDP. • Direct employment in mining in 2011 was more than 16,000 – over 28% of the Canadian total. There were another 7,851 workers employed in support activities to mining, which have become increasingly important in the province. Total employment in the industry has increased over the last 10 years. This performance is in sharp contrast with industries downstream from the mining industry itself, where employment is well off the levels of a decade ago. • Worker productivity in mining is exceptionally high: the value of output per worker at metal mines in 2011 was almost $740,000. Output per worker in all mining in 2011 is a still impressive $680,000, roughly six times the provincial industrial average. Remuneration is in line with this exceptional productivity: the average weekly wage paid in the mining industry in 2011 was almost 60% more than the Ontario average industrial wage, while wages paid in the mining support sector were almost 95% higher. • In 2011, according to the OMA survey, over 83% of employment took place at the mine site, with about 2% of mining employees involved in R&D activities, 7% in exploration, and 8% employed at mining head offices. This employment was spread across the province. In 2011, roughly 36% of mining employment took place in Sudbury. Employment in Northeastern Ontario accounted for over 30%, and that in Northwestern Ontario for 19%. Employment in the southern part of the province, which is home to a number of non-metal mines, as well as mining head offices in Toronto, had a share of 15% in 2011. • Based on the OMA survey, First Nations employment accounted for 9.7% of total mining jobs in 2011. • Worker safety in the mining industry continues to improve. Statistics from Workplace Safety North show that lost time injury rates have come down to 0.4 per 200,000 hours for the first nine months of 2012. This compares with lost time injury rates for mining of 6 per 200,000 in 1981, 3 in 1991, 1.3 in 2001 and 0.6 in 2011. • The mining industry spent almost $1,800 per employee in 2011 on training and health and safety initiatives. • According to the OMA survey, roughly 60% of mineral production, by value, was shipped outside the country in 2011. The US was the biggest customer, but China is becoming increasingly important.

Mining: Dynamic and Dependable for Ontario’s Future ii
• Since 2002, the overall international goods trade deficit for Ontario has more than quadrupled. In contrast, the trade surplus for Ontario mineral products has strengthened to more than $12 billion, remaining positive over the entire period. • While some components of taxes paid by mining companies in Ontario are difficult to measure due to confidentiality issues, the report estimates that mining companies in Ontario paid the federal government between $314 and $413 in various revenues in 2011, while the provincial government received between $482 million and $564 million. These figures do not include income and payroll taxes paid by mining employees, which would conservatively amount to over a half-billion dollars. Local taxes, while much smaller in total, are an important part of the tax base of northern communities. • The mining industry is making exceptional investments in the future: exploration and deposit appraisal spending in Ontario for 2011 was more than $1 billion – almost eight times the amount spent in 2002. New mines are being built and existing ones refurbished. Over the last 10 years, it is estimated that capital expenditures have increased from just over $1 billion in 2002 to over $4 billion in 2011. With rising commodity prices, especially the price of gold, a significant amount of recent investment has gone to the refurbishment, or reopening, of older mines. • Recent years have seen the emergence of major opportunities in the “Ring of Fire” region in the Far North. A variety of mineral deposits have been found, including chromite, which is a critical ingredient in stainless steel and otherwise unobtainable in North America. Development of the “Ring of Fire” will depend critically on how the private and public sectors can share the development of large-scale infrastructure to open the area for development. • The mining industry in recent years has made major strides in reducing its energy inputs and, especially, in moving its electricity needs to off-peak periods. The relative cost of electric power in Ontario versus adjacent jurisdictions remains, however, a major factor in decisions to invest in the development and downstream processing of Ontario mineral resources. • The OMA survey reports that $62 million was spent in 2011 on environmental protection, compared to $43 million in 2010. The investments by the mining industry to improve its environmental footprint, which builds upon its investment on health and safety training of its employees, are not reflected in measured output or productivity for the industry. The societal benefits of this spending, however, can not be overlooked. • Results from the OMA survey show the source of many of the inputs to the mining sector. From the survey, well over 70% of the value of mining supplies and services were provided from within the province, 31% locally and over 43% from the rest of Ontario. Suppliers in the rest of Canada accounted for 15% and imports from outside the country accounted for the other 11%. • The Input-Output model of Statistics Canada was used to probe deeper into the indirect impacts of mining on the Ontario economy. (This was the same technique used in the OMA’s 2007 study of the economic impacts of a ‘Representative Mine’ in Ontario.) The impacts are calculated based on a $1 billion of output reflecting the type of production in the Ontario mining sector, as constituted by the membership of the Ontario Mining Association in 2011. • We estimate that the direct and upstream aggregate impacts of $1 billion of Ontario mining production add $858 million to Ontario GDP and $900 million to the GDP of Canada. In terms of employment, this is 4,418 jobs in Ontario and 4,775 in Canada.
Mining: Dynamic and Dependable for Ontario’s Future iii
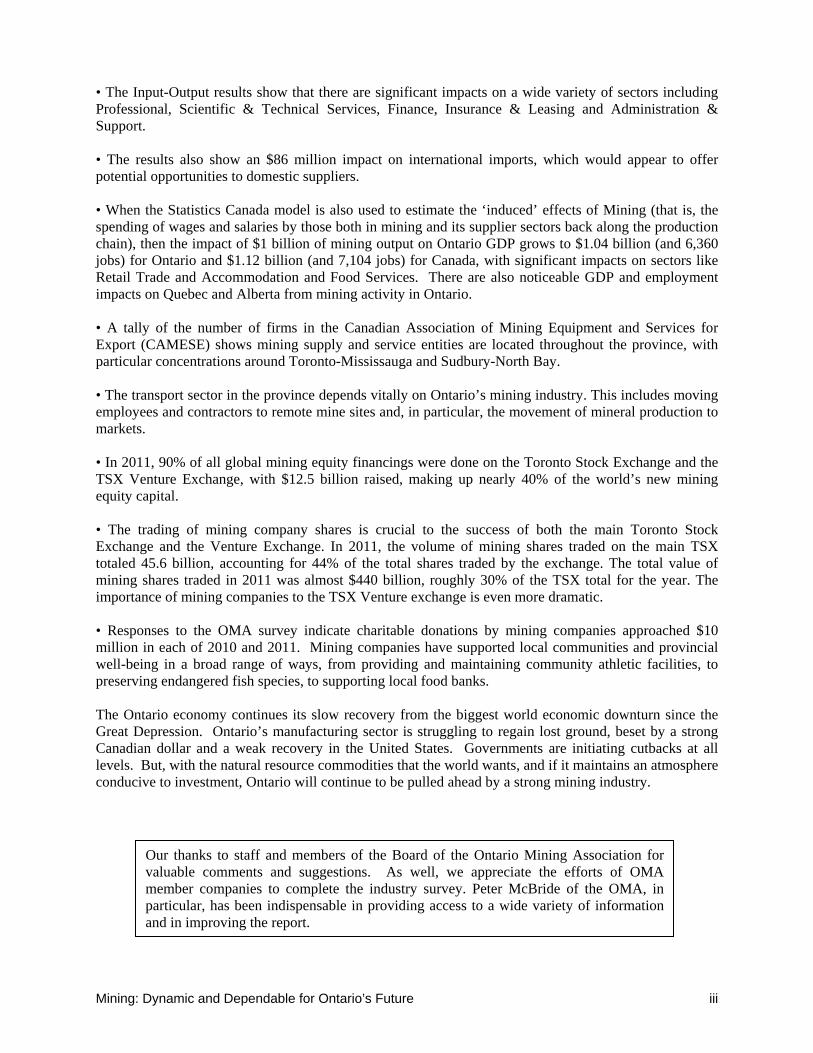
• The Input-Output results show that there are significant impacts on a wide variety of sectors including Professional, Scientific & Technical Services, Finance, Insurance & Leasing and Administration & Support. • The results also show an $86 million impact on international imports, which would appear to offer potential opportunities to domestic suppliers. • When the Statistics Canada model is also used to estimate the ‘induced’ effects of Mining (that is, the spending of wages and salaries by those both in mining and its supplier sectors back along the production chain), then the impact of $1 billion of mining output on Ontario GDP grows to $1.04 billion (and 6,360 jobs) for Ontario and $1.12 billion (and 7,104 jobs) for Canada, with significant impacts on sectors like Retail Trade and Accommodation and Food Services. There are also noticeable GDP and employment impacts on Quebec and Alberta from mining activity in Ontario. • A tally of the number of firms in the Canadian Association of Mining Equipment and Services for Export (CAMESE) shows mining supply and service entities are located throughout the province, with particular concentrations around Toronto-Mississauga and Sudbury-North Bay. • The transport sector in the province depends vitally on Ontario’s mining industry. This includes moving employees and contractors to remote mine sites and, in particular, the movement of mineral production to markets. • In 2011, 90% of all global mining equity financings were done on the Toronto Stock Exchange and the TSX Venture Exchange, with $12.5 billion raised, making up nearly 40% of the world’s new mining equity capital. • The trading of mining company shares is crucial to the success of both the main Toronto Stock Exchange and the Venture Exchange. In 2011, the volume of mining shares traded on the main TSX totaled 45.6 billion, accounting for 44% of the total shares traded by the exchange. The total value of mining shares traded in 2011 was almost $440 billion, roughly 30% of the TSX total for the year. The importance of mining companies to the TSX Venture exchange is even more dramatic.
• Responses to the OMA survey indicate charitable donations by mining companies approached $10 million in each of 2010 and 2011. Mining companies have supported local communities and provincial well-being in a broad range of ways, from providing and maintaining community athletic facilities, to preserving endangered fish species, to supporting local food banks. The Ontario economy continues its slow recovery from the biggest world economic downturn since the Great Depression. Ontario’s manufacturing sector is struggling to regain lost ground, beset by a strong Canadian dollar and a weak recovery in the United States. Governments are initiating cutbacks at all levels. But, with the natural resource commodities that the world wants, and if it maintains an atmosphere conducive to investment, Ontario will continue to be pulled ahead by a strong mining industry.
Our thanks to staff and members of the Board of the Ontario Mining Association for valuable comments and suggestions. As well, we appreciate the efforts of OMA member companies to complete the industry survey. Peter McBride of the OMA, in particular, has been indispensable in providing access to a wide variety of information and in improving the report.
Mining: Dynamic and Dependable for Ontario’s Future 1
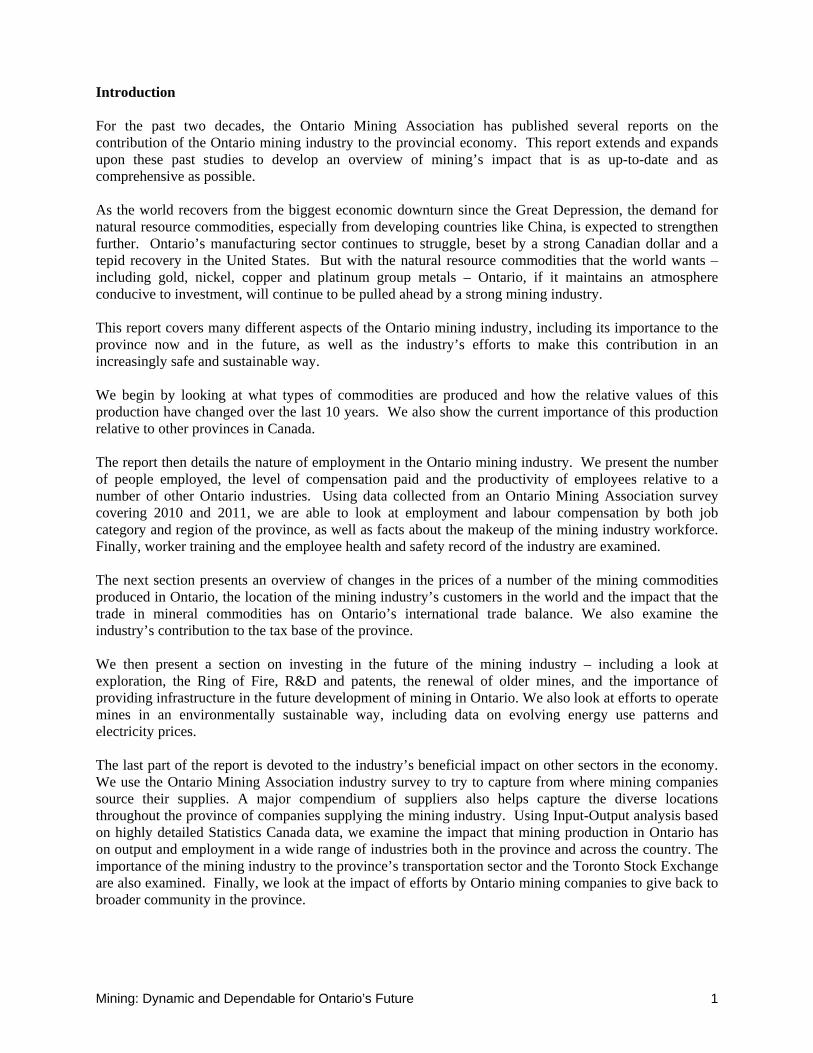
Introduction For the past two decades, the Ontario Mining Association has published several reports on the contribution of the Ontario mining industry to the provincial economy. This report extends and expands upon these past studies to develop an overview of mining’s impact that is as up-to-date and as comprehensive as possible. As the world recovers from the biggest economic downturn since the Great Depression, the demand for natural resource commodities, especially from developing countries like China, is expected to strengthen further. Ontario’s manufacturing sector continues to struggle, beset by a strong Canadian dollar and a tepid recovery in the United States. But with the natural resource commodities that the world wants – including gold, nickel, copper and platinum group metals – Ontario, if it maintains an atmosphere conducive to investment, will continue to be pulled ahead by a strong mining industry. This report covers many different aspects of the Ontario mining industry, including its importance to the province now and in the future, as well as the industry’s efforts to make this contribution in an increasingly safe and sustainable way. We begin by looking at what types of commodities are produced and how the relative values of this production have changed over the last 10 years. We also show the current importance of this production relative to other provinces in Canada. The report then details the nature of employment in the Ontario mining industry. We present the number of people employed, the level of compensation paid and the productivity of employees relative to a number of other Ontario industries. Using data collected from an Ontario Mining Association survey covering 2010 and 2011, we are able to look at employment and labour compensation by both job category and region of the province, as well as facts about the makeup of the mining industry workforce. Finally, worker training and the employee health and safety record of the industry are examined. The next section presents an overview of changes in the prices of a number of the mining commodities produced in Ontario, the location of the mining industry’s customers in the world and the impact that the trade in mineral commodities has on Ontario’s international trade balance. We also examine the industry’s contribution to the tax base of the province. We then present a section on investing in the future of the mining industry – including a look at exploration, the Ring of Fire, R&D and patents, the renewal of older mines, and the importance of providing infrastructure in the future development of mining in Ontario. We also look at efforts to operate mines in an environmentally sustainable way, including data on evolving energy use patterns and electricity prices. The last part of the report is devoted to the industry’s beneficial impact on other sectors in the economy. We use the Ontario Mining Association industry survey to try to capture from where mining companies source their supplies. A major compendium of suppliers also helps capture the diverse locations throughout the province of companies supplying the mining industry. Using Input-Output analysis based on highly detailed Statistics Canada data, we examine the impact that mining production in Ontario has on output and employment in a wide range of industries both in the province and across the country. The importance of the mining industry to the province’s transportation sector and the Toronto Stock Exchange are also examined. Finally, we look at the impact of efforts by Ontario mining companies to give back to broader community in the province.
Mining: Dynamic and Dependable for Ontario’s Future
2
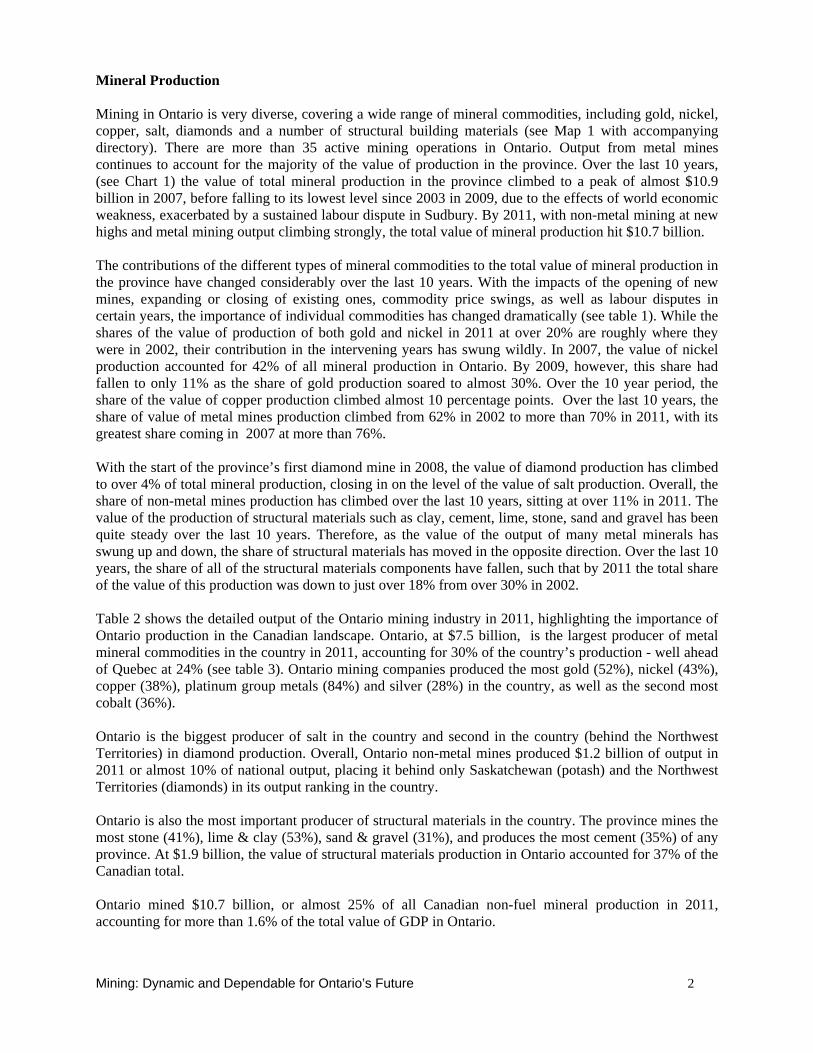
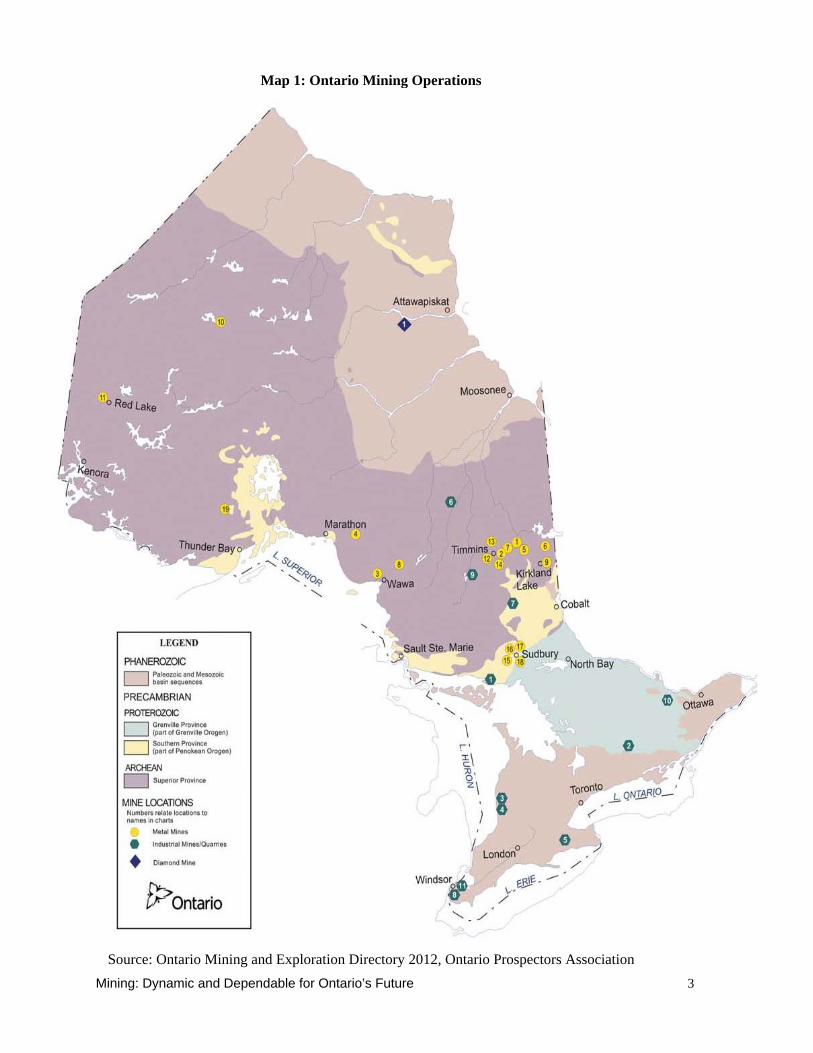
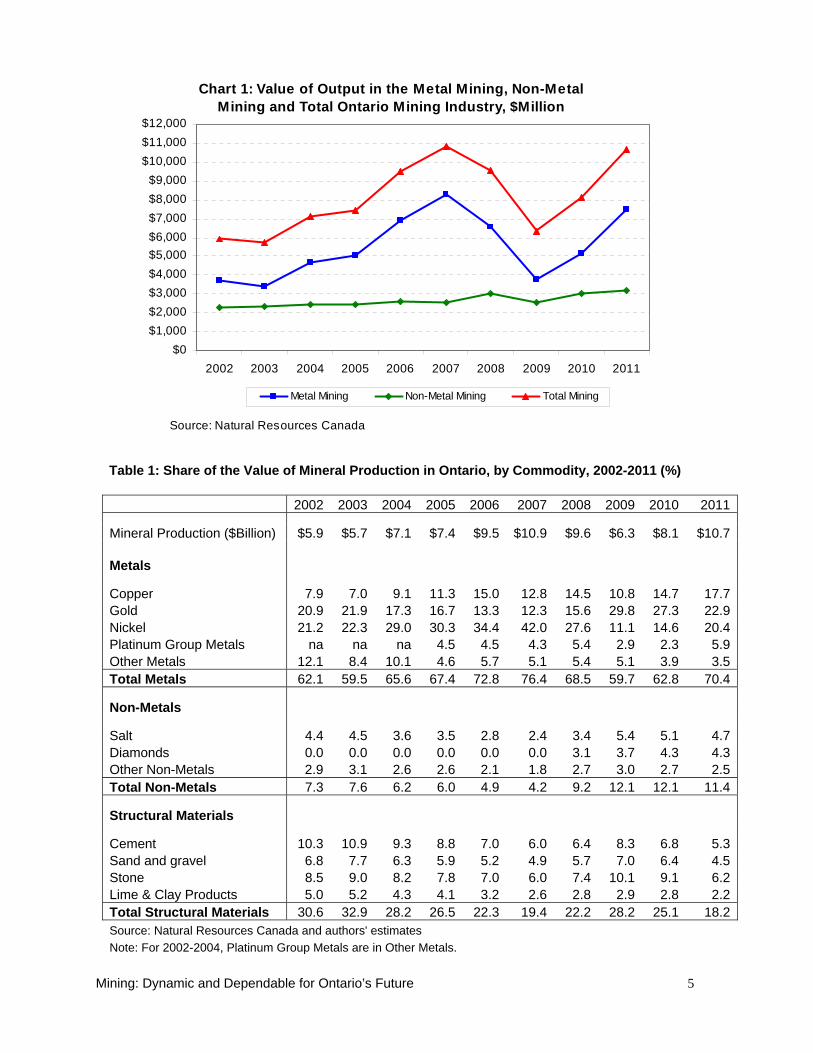
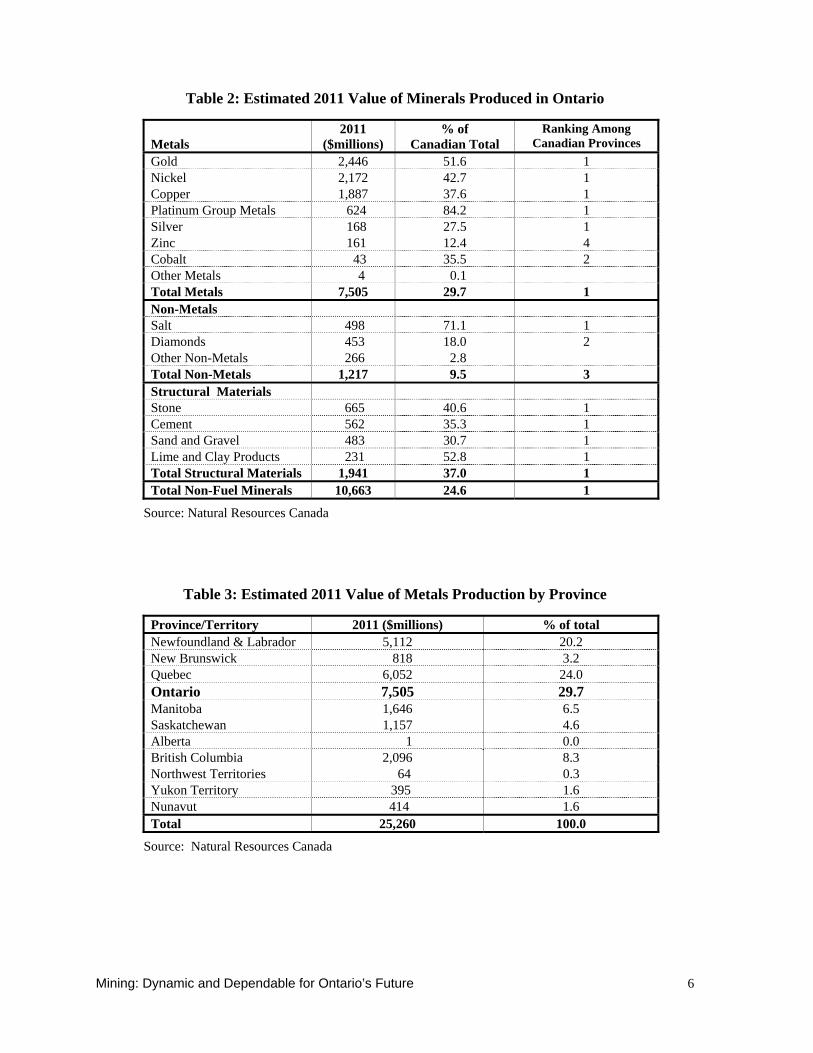
Mineral Production Mining in Ontario is very diverse, covering a wide range of mineral commodities, including gold, nickel, copper, salt, diamonds and a number of structural building materials (see Map 1 with accompanying directory). There are more than 35 active mining operations in Ontario. Output from metal mines continues to account for the majority of the value of production in the province. Over the last 10 years, (see Chart 1) the value of total mineral production in the province climbed to a peak of almost $10.9 billion in 2007, before falling to its lowest level since 2003 in 2009, due to the effects of world economic weakness, exacerbated by a sustained labour dispute in Sudbury. By 2011, with non-metal mining at new highs and metal mining output climbing strongly, the total value of mineral production hit $10.7 billion. The contributions of the different types of mineral commodities to the total value of mineral production in the province have changed considerably over the last 10 years. With the impacts of the opening of new mines, expanding or closing of existing ones, commodity price swings, as well as labour disputes in certain years, the importance of individual commodities has changed dramatically (see table 1). While the shares of the value of production of both gold and nickel in 2011 at over 20% are roughly where they were in 2002, their contribution in the intervening years has swung wildly. In 2007, the value of nickel production accounted for 42% of all mineral production in Ontario. By 2009, however, this share had fallen to only 11% as the share of gold production soared to almost 30%. Over the 10 year period, the share of the value of copper production climbed almost 10 percentage points. Over the last 10 years, the share of value of metal mines production climbed from 62% in 2002 to more than 70% in 2011, with its greatest share coming in 2007 at more than 76%. With the start of the province’s first diamond mine in 2008, the value of diamond production has climbed to over 4% of total mineral production, closing in on the level of the value of salt production. Overall, the share of non-metal mines production has climbed over the last 10 years, sitting at over 11% in 2011. The value of the production of structural materials such as clay, cement, lime, stone, sand and gravel has been quite steady over the last 10 years. Therefore, as the value of the output of many metal minerals has swung up and down, the share of structural materials has moved in the opposite direction. Over the last 10 years, the share of all of the structural materials components have fallen, such that by 2011 the total share of the value of this production was down to just over 18% from over 30% in 2002. Table 2 shows the detailed output of the Ontario mining industry in 2011, highlighting the importance of Ontario production in the Canadian landscape. Ontario, at $7.5 billion, is the largest producer of metal mineral commodities in the country in 2011, accounting for 30% of the country’s production - well ahead of Quebec at 24% (see table 3). Ontario mining companies produced the most gold (52%), nickel (43%), copper (38%), platinum group metals (84%) and silver (28%) in the country, as well as the second most cobalt (36%). Ontario is the biggest producer of salt in the country and second in the country (behind the Northwest Territories) in diamond production. Overall, Ontario non-metal mines produced $1.2 billion of output in 2011 or almost 10% of national output, placing it behind only Saskatchewan (potash) and the Northwest Territories (diamonds) in its output ranking in the country. Ontario is also the most important producer of structural materials in the country. The province mines the most stone (41%), lime & clay (53%), sand & gravel (31%), and produces the most cement (35%) of any province. At $1.9 billion, the value of structural materials production in Ontario accounted for 37% of the Canadian total. Ontario mined $10.7 billion, or almost 25% of all Canadian non-fuel mineral production in 2011, accounting for more than 1.6% of the total value of GDP in Ontario.
Mining: Dynamic and Dependable for Ontario’s Future
3
Map 1: Ontario Mining Operations
Source: Ontario Mining and Exploration Directory 2012, Ontario Prospectors Association
Mining: Dynamic and Dependable for Ontario’s Future
4
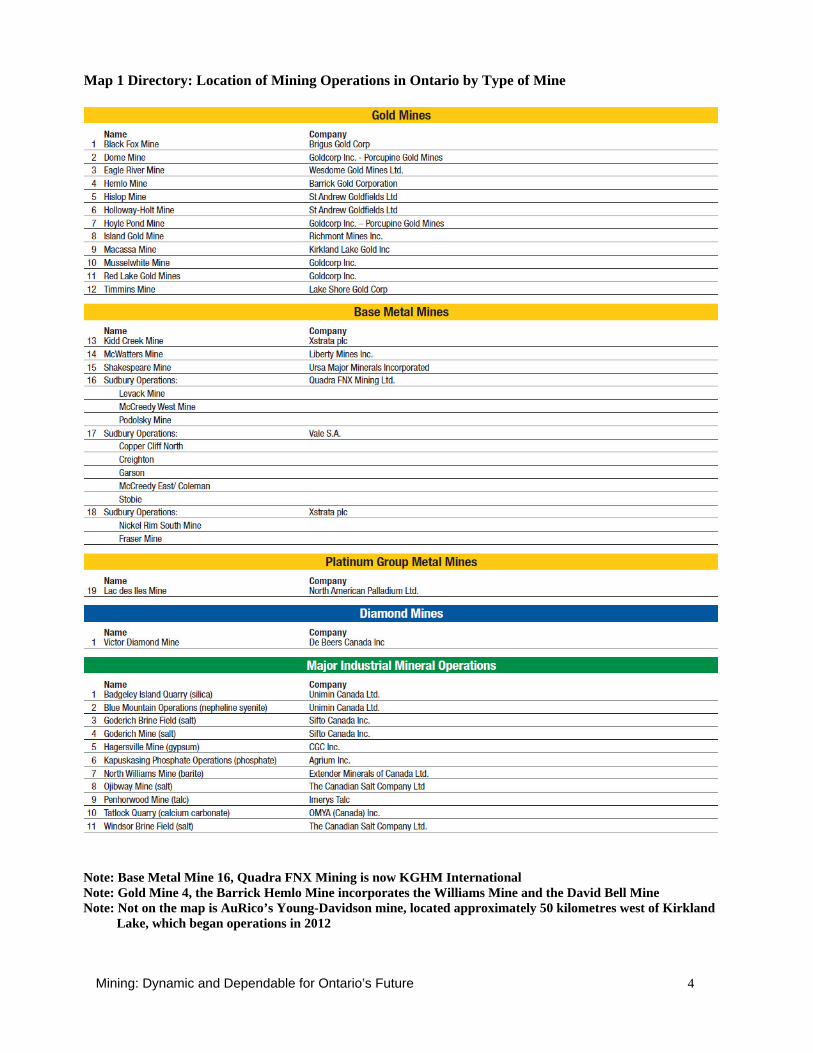
Map 1 Directory: Location of Mining Operations in Ontario by Type of Mine
Note: Base Metal Mine 16, Quadra FNX Mining is now KGHM International Note: Gold Mine 4, the Barrick Hemlo Mine incorporates the Williams Mine and the David Bell Mine Note: Not on the map is AuRico’s Young-Davidson mine, located approximately 50 kilometres west of Kirkland Lake, which began operations in 2012
Mining: Dynamic and Dependable for Ontario’s Future
5
Chart 1: Value of Output in the Metal Mining, Non-Metal Mining and Total Ontario Mining Industry, $Million
$0$1,000$2,000$3,000$4,000$5,000$6,000$7,000$8,000$9,000
$10,000$11,000$12,000
2002 2003 2004 2005 2006 2007 2008 2009 2010 2011
Metal Mining Non-Metal Mining Total Mining
Source: Natural Resources Canada
Table 1: Share of the Value of Mineral Production in Ontario, by Commodity, 2002-2011 (%)
2002 2003 2004 2005 2006 2007 2008 2009 2010 2011
Mineral Production ($Billion) $5.9 $5.7 $7.1 $7.4 $9.5 $10.9 $9.6 $6.3 $8.1 $10.7 Metals
Copper 7.9 7.0 9.1 11.3 15.0 12.8 14.5 10.8 14.7 17.7Gold 20.9 21.9 17.3 16.7 13.3 12.3 15.6 29.8 27.3 22.9Nickel 21.2 22.3 29.0 30.3 34.4 42.0 27.6 11.1 14.6 20.4Platinum Group Metals na na na 4.5 4.5 4.3 5.4 2.9 2.3 5.9Other Metals 12.1 8.4 10.1 4.6 5.7 5.1 5.4 5.1 3.9 3.5Total Metals 62.1 59.5 65.6 67.4 72.8 76.4 68.5 59.7 62.8 70.4
Non-Metals
Salt 4.4 4.5 3.6 3.5 2.8 2.4 3.4 5.4 5.1 4.7Diamonds 0.0 0.0 0.0 0.0 0.0 0.0 3.1 3.7 4.3 4.3Other Non-Metals 2.9 3.1 2.6 2.6 2.1 1.8 2.7 3.0 2.7 2.5Total Non-Metals 7.3 7.6 6.2 6.0 4.9 4.2 9.2 12.1 12.1 11.4
Structural Materials
Cement 10.3 10.9 9.3 8.8 7.0 6.0 6.4 8.3 6.8 5.3Sand and gravel 6.8 7.7 6.3 5.9 5.2 4.9 5.7 7.0 6.4 4.5Stone 8.5 9.0 8.2 7.8 7.0 6.0 7.4 10.1 9.1 6.2Lime & Clay Products 5.0 5.2 4.3 4.1 3.2 2.6 2.8 2.9 2.8 2.2Total Structural Materials 30.6 32.9 28.2 26.5 22.3 19.4 22.2 28.2 25.1 18.2Source: Natural Resources Canada and authors' estimates Note: For 2002-2004, Platinum Group Metals are in Other Metals.
Mining: Dynamic and Dependable for Ontario’s Future
6
Table 2: Estimated 2011 Value of Minerals Produced in Ontario
Metals
2011 ($millions)
% of Canadian Total
Ranking Among Canadian Provinces
Gold 2,446 51.6 1 Nickel 2,172 42.7 1 Copper 1,887 37.6 1 Platinum Group Metals 624 84.2 1 Silver 168 27.5 1 Zinc 161 12.4 4 Cobalt 43 35.5 2 Other Metals 4 0.1 Total Metals 7,505 29.7 1 Non-Metals Salt 498 71.1 1 Diamonds 453 18.0 2 Other Non-Metals 266 2.8 Total Non-Metals 1,217 9.5 3 Structural Materials Stone 665 40.6 1 Cement 562 35.3 1 Sand and Gravel 483 30.7 1 Lime and Clay Products 231 52.8 1 Total Structural Materials 1,941 37.0 1 Total Non-Fuel Minerals 10,663 24.6 1
Source: Natural Resources Canada
Table 3: Estimated 2011 Value of Metals Production by Province
Province/Territory 2011 ($millions) % of total Newfoundland & Labrador 5,112 20.2 New Brunswick 818 3.2 Quebec 6,052 24.0 Ontario 7,505 29.7 Manitoba 1,646 6.5 Saskatchewan 1,157 4.6 Alberta 1 0.0 British Columbia 2,096 8.3 Northwest Territories 64 0.3 Yukon Territory 395 1.6 Nunavut 414 1.6 Total 25,260 100.0
Source: Natural Resources Canada

Mining: Dynamic and Dependable for Ontario’s Future
7
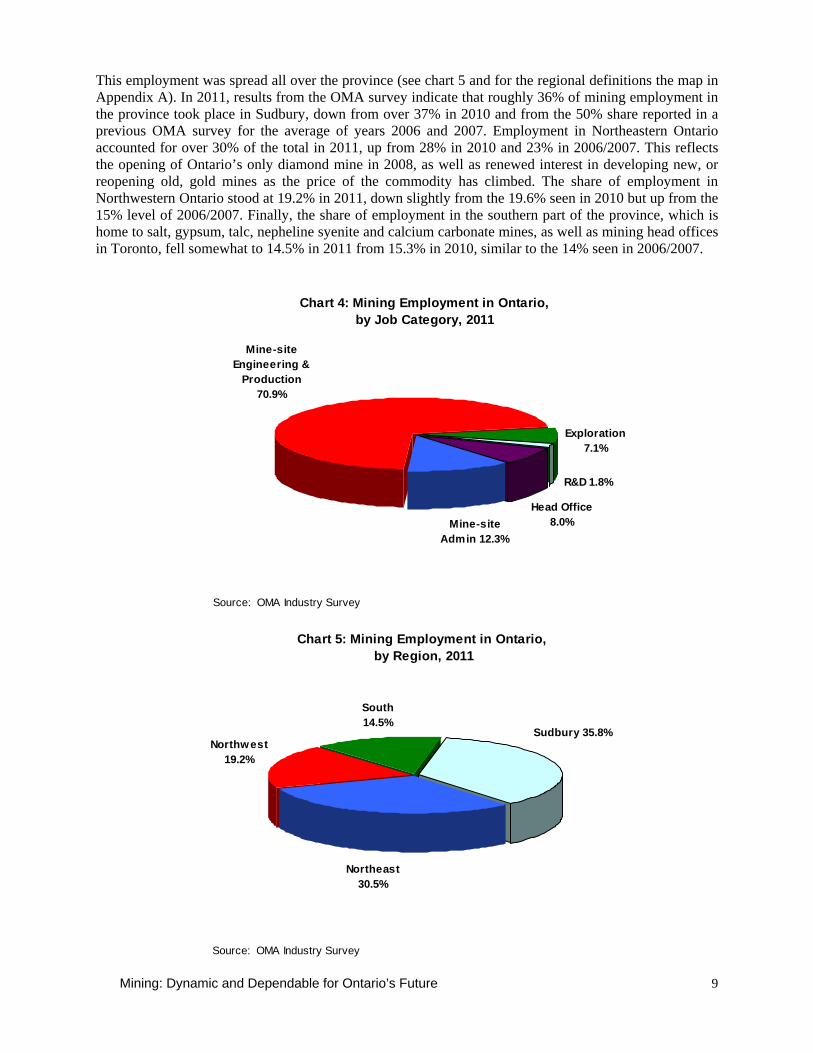
Mining Industry Employment and Wages As the world economy slowly recovered from the recent “great recession”, employment in the mining sector began to rebound in 2011. The number of workers directly employed by Ontario’s mining industry, at over 19,400, climbed to a 15 year high in 2008 (see table 4). By 2010, employment in the industry had fallen by over 25%, as the impacts of the recession and labour issues continued to be felt, before recovering to more than 16,000 in 2011. Metal mining remains the most important mining sector in Ontario with over 63 percent of all mining employees involved in metal ore mining in the province in 2011, although this is a much lower share than seen in the 1990s. Support activities to mining (which includes contract drilling, exploration, and other mine services) have become increasingly important in the province over the last several years (see chart 2 and table 5). In 2011, almost 8,000 workers were employed in this sector, the highest level ever recorded for the province by Statistics Canada and more than double the number employed 10 years earlier. Other than the recent peak in 2008, overall, employment in 2011in the Ontario mining industry directly, together with services to the mining industry, is at its highest level in 20 years. Ontario accounts for a large share of Canada’s mining employment, particularly in metal ore mining (see table 4). Of the total number of people employed in metals mining in Canada in 2011, Ontario accounted for almost 38 percent, somewhat below the average share seen over the last 10 years. For all types of mineral production, Ontario accounts for over 28% of the country’s employment, somewhat higher than 2010 but still at a level below that seen in recent years. The recovery in employment is not reducing the output per worker in the industry (see chart 3) which is stellar. The value of output per worker employed at metal mines in the province hit a peak of almost $900,000 in 2007 before dropping in the downturn. This measure has recovered in 2011 to almost $740,000. Output per worker in all mining in 2011 is a still impressive $680,000, roughly six times the provincial industrial average. Using data collected from Ontario Mining Association members, one can look at the numbers of different types of jobs in the mining industry, as well as in what parts of the province this employment takes place and the nature of the mining labour force.1 In 2011, over 83% of employment took place at the mine site (see chart 4), with 71% of total mining employment devoted to mine-site production and engineering activities and a further 12% providing administration support at the mine. According to the survey results, just under two percent of mining employees were involved in scientific/R&D activities, more than seven percent were involved in exploration, and eight percent were employed at mining head offices.
Table 4: Employment in the Ontario and Canadian Mining Industry
2002 2003 2004 2005 2006 2007 2008 2009 2010 2011 Mining Canada 47,893 47,391 45,986 46,689 48,830 52,877 58,506 52,429 52,532 56,669 Ontario 13,679 13,700 14,429 14,110 14,433 16,036 19,409 16,534 14,492 16,067 Ontario Share 28.6% 28.9% 31.4% 30.2% 29.6% 30.3% 33.2% 31.5% 27.6% 28.4% Metal Mining Canada 22,585 21,810 21,374 21,196 22,007 23,850 28,074 24,286 23,311 26,917 Ontario 8,471 8,362 8,859 8,723 8,456 9,329 12,782 10,423 8,580 10,160 Ontario Share 37.5% 38.3% 41.4% 41.2% 38.4% 39.1% 45.5% 42.9% 36.8% 37.8%
Source: Statistics Canada
1 The OMA membership includes metal and non-metal mines in the province, as well as most mine contractors. It, however, does not capture the aggregates or structural materials production in the province.

Mining: Dynamic and Dependable for Ontario’s Future
8
Chart 2: Employment in the Ontario Mining Industry
0
5,000
10,000
15,000
20,000
25,000
30,000
2002 2003 2004 2005 2006 2007 2008 2009 2010 2011
Mining Sector Support Activities to Mining
Source: Statistics Canada and authors' calculations
Chart 3: Output per Worker in the Metal Mining and Total Ontario Mining Industry, $000
$0
$100
$200
$300
$400
$500
$600
$700
$800
$900
$1,000
2002 2003 2004 2005 2006 2007 2008 2009 2010 2011
Metal Mining Total Mining
Source: Natural Resources Canada, Statistics Canada and authors' calculations
Mining: Dynamic and Dependable for Ontario’s Future
9
This employment was spread all over the province (see chart 5 and for the regional definitions the map in Appendix A). In 2011, results from the OMA survey indicate that roughly 36% of mining employment in the province took place in Sudbury, down from over 37% in 2010 and from the 50% share reported in a previous OMA survey for the average of years 2006 and 2007. Employment in Northeastern Ontario accounted for over 30% of the total in 2011, up from 28% in 2010 and 23% in 2006/2007. This reflects the opening of Ontario’s only diamond mine in 2008, as well as renewed interest in developing new, or reopening old, gold mines as the price of the commodity has climbed. The share of employment in Northwestern Ontario stood at 19.2% in 2011, down slightly from the 19.6% seen in 2010 but up from the 15% level of 2006/2007. Finally, the share of employment in the southern part of the province, which is home to salt, gypsum, talc, nepheline syenite and calcium carbonate mines, as well as mining head offices in Toronto, fell somewhat to 14.5% in 2011 from 15.3% in 2010, similar to the 14% seen in 2006/2007.
Chart 4: Mining Employment in Ontario, by Job Category, 2011
Mine-site Admin 12.3%
Mine-site Engineering &
Production70.9%
Exploration7.1%
R&D 1.8%
Head Office 8.0%
Source: OMA Industry Survey
Chart 5: Mining Employment in Ontario, by Region, 2011
Northeast 30.5%
Northwest19.2%
South14.5%
Sudbury 35.8%
Source: OMA Industry Survey
Mining: Dynamic and Dependable for Ontario’s Future
10
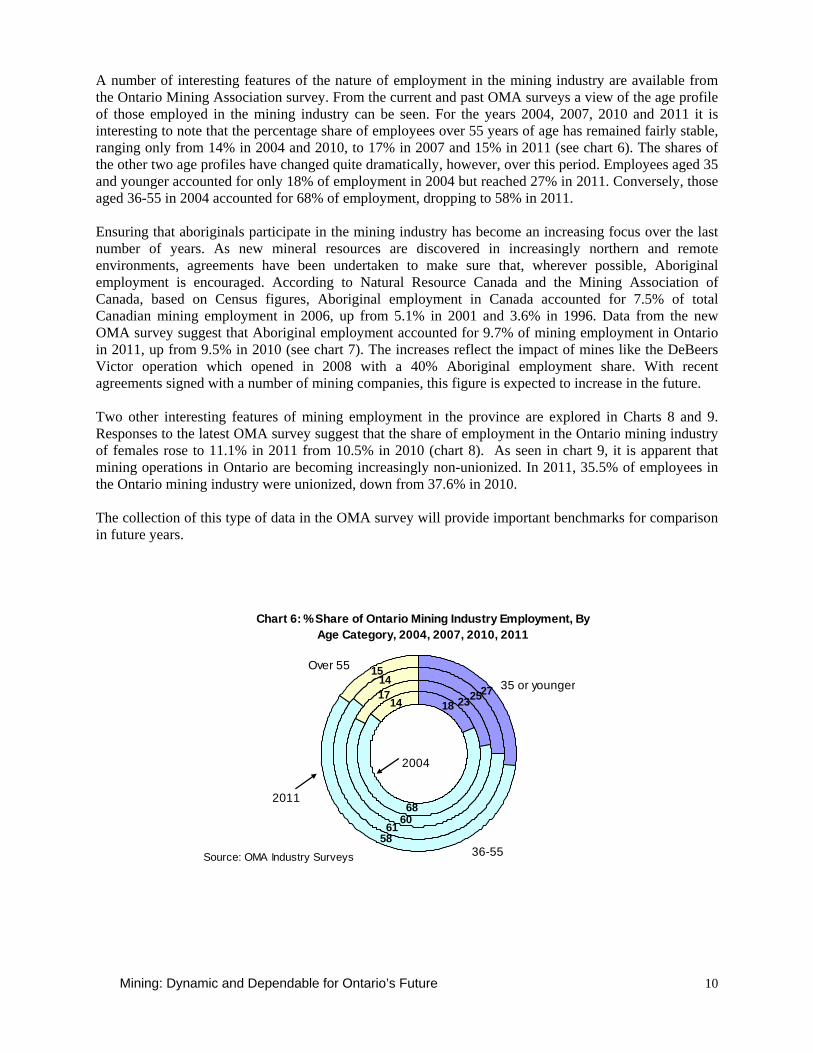
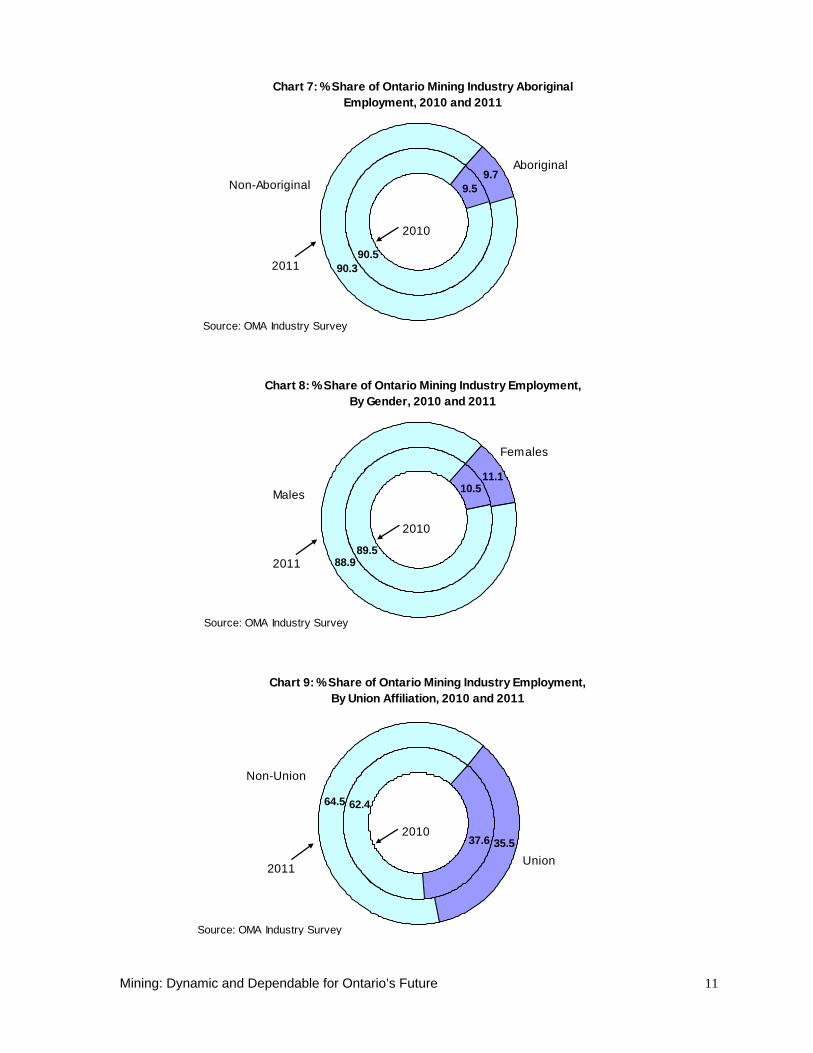
A number of interesting features of the nature of employment in the mining industry are available from the Ontario Mining Association survey. From the current and past OMA surveys a view of the age profile of those employed in the mining industry can be seen. For the years 2004, 2007, 2010 and 2011 it is interesting to note that the percentage share of employees over 55 years of age has remained fairly stable, ranging only from 14% in 2004 and 2010, to 17% in 2007 and 15% in 2011 (see chart 6). The shares of the other two age profiles have changed quite dramatically, however, over this period. Employees aged 35 and younger accounted for only 18% of employment in 2004 but reached 27% in 2011. Conversely, those aged 36-55 in 2004 accounted for 68% of employment, dropping to 58% in 2011. Ensuring that aboriginals participate in the mining industry has become an increasing focus over the last number of years. As new mineral resources are discovered in increasingly northern and remote environments, agreements have been undertaken to make sure that, wherever possible, Aboriginal employment is encouraged. According to Natural Resource Canada and the Mining Association of Canada, based on Census figures, Aboriginal employment in Canada accounted for 7.5% of total Canadian mining employment in 2006, up from 5.1% in 2001 and 3.6% in 1996. Data from the new OMA survey suggest that Aboriginal employment accounted for 9.7% of mining employment in Ontario in 2011, up from 9.5% in 2010 (see chart 7). The increases reflect the impact of mines like the DeBeers Victor operation which opened in 2008 with a 40% Aboriginal employment share. With recent agreements signed with a number of mining companies, this figure is expected to increase in the future. Two other interesting features of mining employment in the province are explored in Charts 8 and 9. Responses to the latest OMA survey suggest that the share of employment in the Ontario mining industry of females rose to 11.1% in 2011 from 10.5% in 2010 (chart 8). As seen in chart 9, it is apparent that mining operations in Ontario are becoming increasingly non-unionized. In 2011, 35.5% of employees in the Ontario mining industry were unionized, down from 37.6% in 2010. The collection of this type of data in the OMA survey will provide important benchmarks for comparison in future years.
Chart 6: % Share of Ontario Mining Industry Employment, By Age Category, 2004, 2007, 2010, 2011
18
68
14 23
60
17 25
61
1427
58
15
2004
35 or younger
36-55
Over 55
2011
Source: OMA Industry Surveys
Mining: Dynamic and Dependable for Ontario’s Future
11
Chart 7: % Share of Ontario Mining Industry Aboriginal Employment, 2010 and 2011
9.5
90.5
9.7
90.3
2010
Aboriginal
Non-Aboriginal
2011
Source: OMA Industry Survey
Chart 8: % Share of Ontario Mining Industry Employment, By Gender, 2010 and 2011
10.5
89.5
11.1
88.9
2010
Females
Males
2011
Source: OMA Industry Survey
Chart 9: % Share of Ontario Mining Industry Employment, By Union Affiliation, 2010 and 2011
37.6
62.4
35.5
64.5
2010
Union
Non-Union
2011
Source: OMA Industry Survey
Mining: Dynamic and Dependable for Ontario’s Future
12
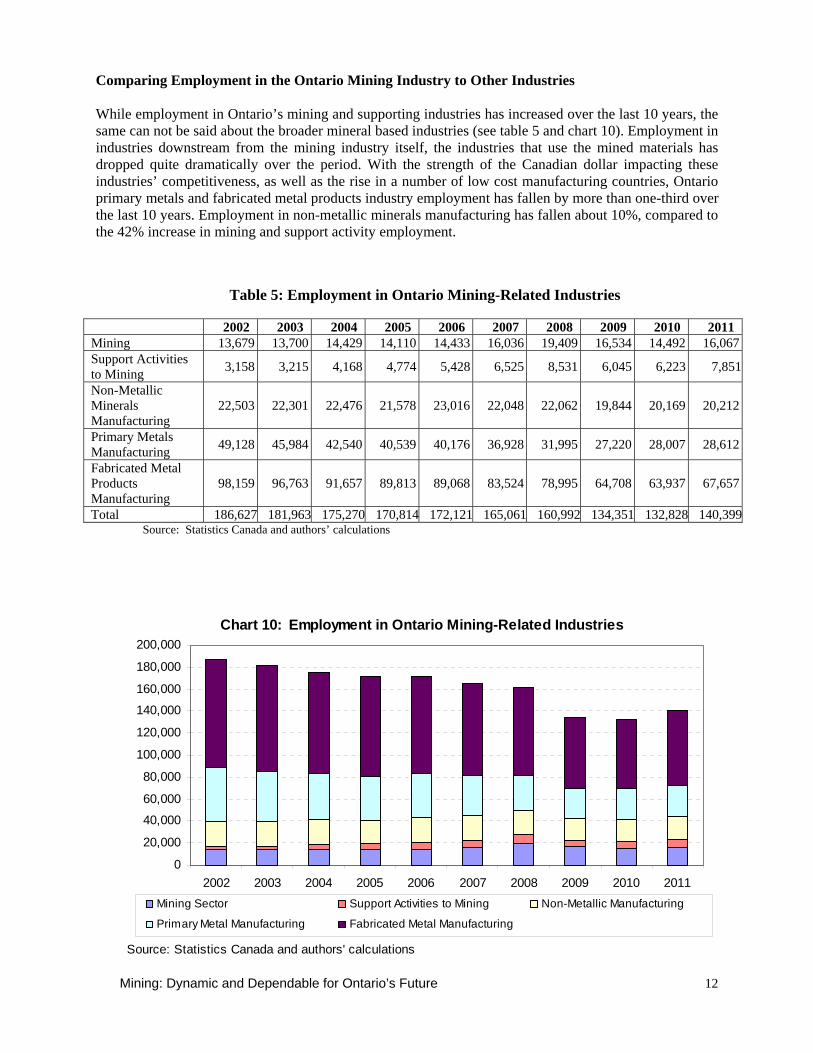
Comparing Employment in the Ontario Mining Industry to Other Industries While employment in Ontario’s mining and supporting industries has increased over the last 10 years, the same can not be said about the broader mineral based industries (see table 5 and chart 10). Employment in industries downstream from the mining industry itself, the industries that use the mined materials has dropped quite dramatically over the period. With the strength of the Canadian dollar impacting these industries’ competitiveness, as well as the rise in a number of low cost manufacturing countries, Ontario primary metals and fabricated metal products industry employment has fallen by more than one-third over the last 10 years. Employment in non-metallic minerals manufacturing has fallen about 10%, compared to the 42% increase in mining and support activity employment.
Table 5: Employment in Ontario Mining-Related Industries
2002 2003 2004 2005 2006 2007 2008 2009 2010 2011 Mining 13,679 13,700 14,429 14,110 14,433 16,036 19,409 16,534 14,492 16,067Support Activities to Mining 3,158 3,215 4,168 4,774 5,428 6,525 8,531 6,045 6,223 7,851
Non-Metallic Minerals Manufacturing
22,503 22,301 22,476 21,578 23,016 22,048 22,062 19,844 20,169 20,212
Primary Metals Manufacturing 49,128 45,984 42,540 40,539 40,176 36,928 31,995 27,220 28,007 28,612
Fabricated Metal Products Manufacturing
98,159 96,763 91,657 89,813 89,068 83,524 78,995 64,708 63,937 67,657
Total 186,627 181,963 175,270 170,814 172,121 165,061 160,992 134,351 132,828 140,399Source: Statistics Canada and authors’ calculations
Chart 10: Employment in Ontario Mining-Related Industries
0
20,000
40,000
60,000
80,000
100,000
120,000
140,000
160,000
180,000
200,000
2002 2003 2004 2005 2006 2007 2008 2009 2010 2011Mining Sector Support Activities to Mining Non-Metallic Manufacturing
Primary Metal Manufacturing Fabricated Metal Manufacturing
Source: Statistics Canada and authors' calculations
Mining: Dynamic and Dependable for Ontario’s Future
13
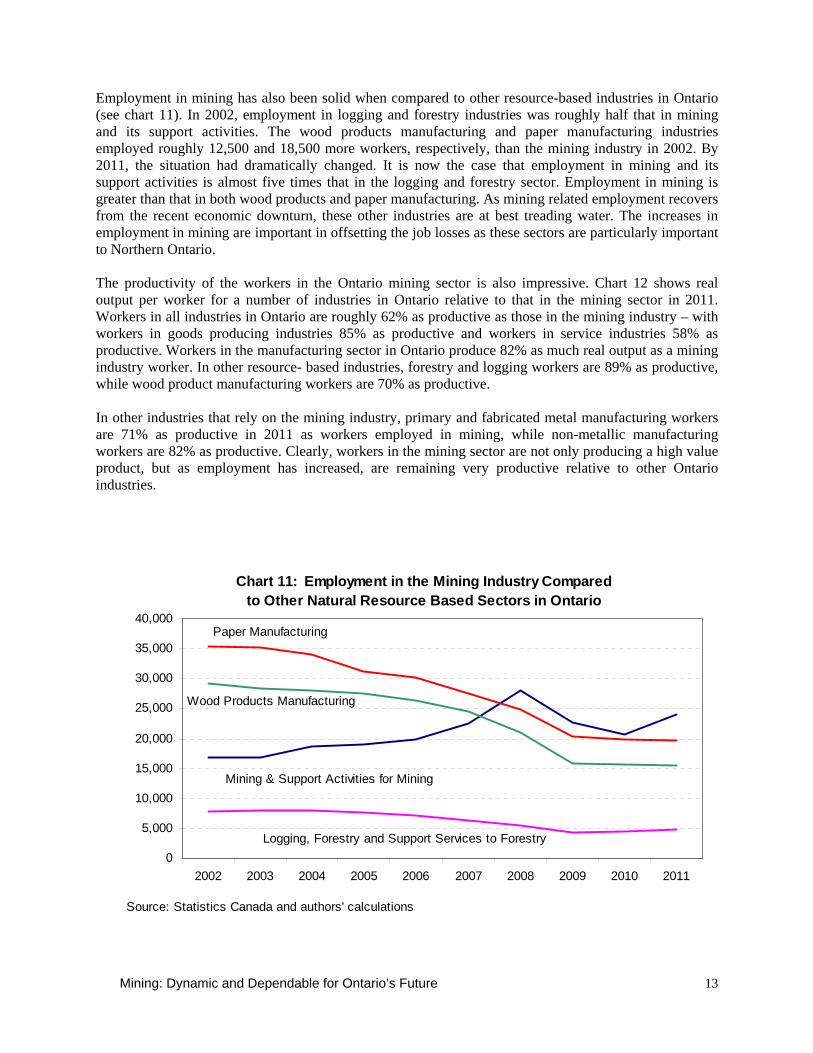
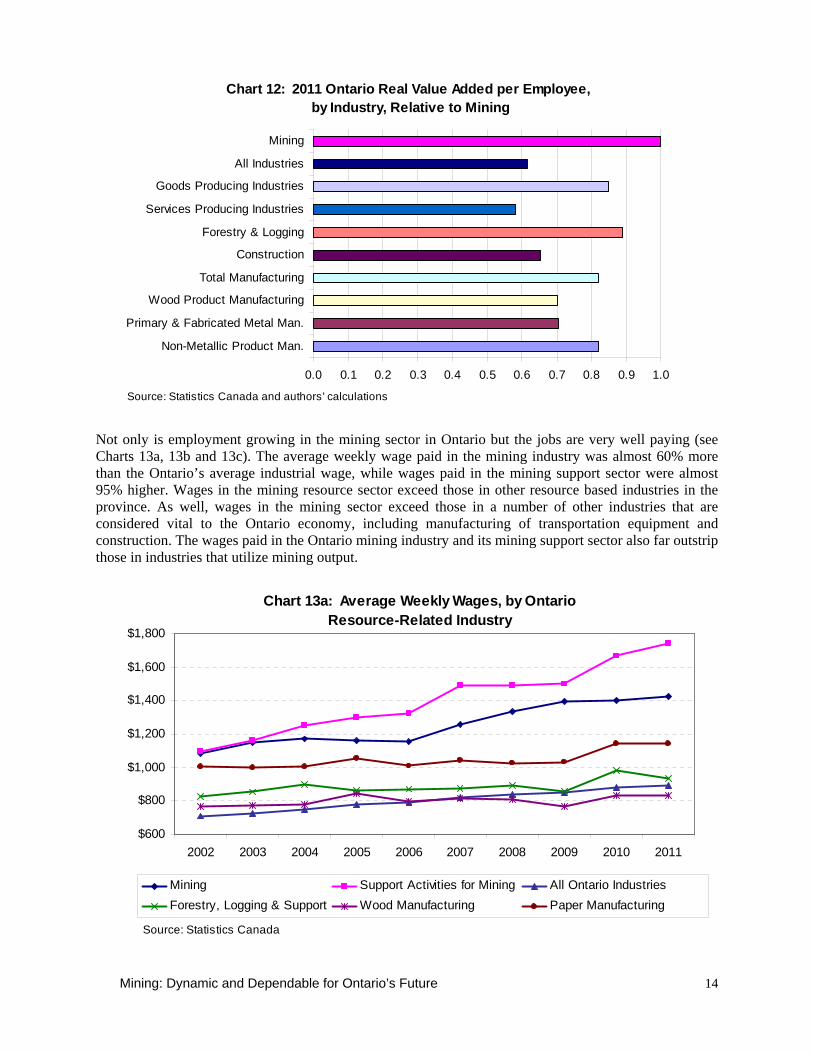
Employment in mining has also been solid when compared to other resource-based industries in Ontario (see chart 11). In 2002, employment in logging and forestry industries was roughly half that in mining and its support activities. The wood products manufacturing and paper manufacturing industries employed roughly 12,500 and 18,500 more workers, respectively, than the mining industry in 2002. By 2011, the situation had dramatically changed. It is now the case that employment in mining and its support activities is almost five times that in the logging and forestry sector. Employment in mining is greater than that in both wood products and paper manufacturing. As mining related employment recovers from the recent economic downturn, these other industries are at best treading water. The increases in employment in mining are important in offsetting the job losses as these sectors are particularly important to Northern Ontario. The productivity of the workers in the Ontario mining sector is also impressive. Chart 12 shows real output per worker for a number of industries in Ontario relative to that in the mining sector in 2011. Workers in all industries in Ontario are roughly 62% as productive as those in the mining industry – with workers in goods producing industries 85% as productive and workers in service industries 58% as productive. Workers in the manufacturing sector in Ontario produce 82% as much real output as a mining industry worker. In other resource- based industries, forestry and logging workers are 89% as productive, while wood product manufacturing workers are 70% as productive. In other industries that rely on the mining industry, primary and fabricated metal manufacturing workers are 71% as productive in 2011 as workers employed in mining, while non-metallic manufacturing workers are 82% as productive. Clearly, workers in the mining sector are not only producing a high value product, but as employment has increased, are remaining very productive relative to other Ontario industries.
Chart 11: Employment in the Mining Industry Compared to Other Natural Resource Based Sectors in Ontario
0
5,000
10,000
15,000
20,000
25,000
30,000
35,000
40,000
2002 2003 2004 2005 2006 2007 2008 2009 2010 2011
Source: Statistics Canada and authors' calculations
Logging, Forestry and Support Services to Forestry
Paper Manufacturing
Mining & Support Activities for Mining
Wood Products Manufacturing
Mining: Dynamic and Dependable for Ontario’s Future
14
Chart 12: 2011 Ontario Real Value Added per Employee, by Industry, Relative to Mining
0.0 0.1 0.2 0.3 0.4 0.5 0.6 0.7 0.8 0.9 1.0
Non-Metallic Product Man.
Primary & Fabricated Metal Man.
Wood Product Manufacturing
Total Manufacturing
Construction
Forestry & Logging
Services Producing Industries
Goods Producing Industries
All Industries
Mining
Source: Statistics Canada and authors' calculations
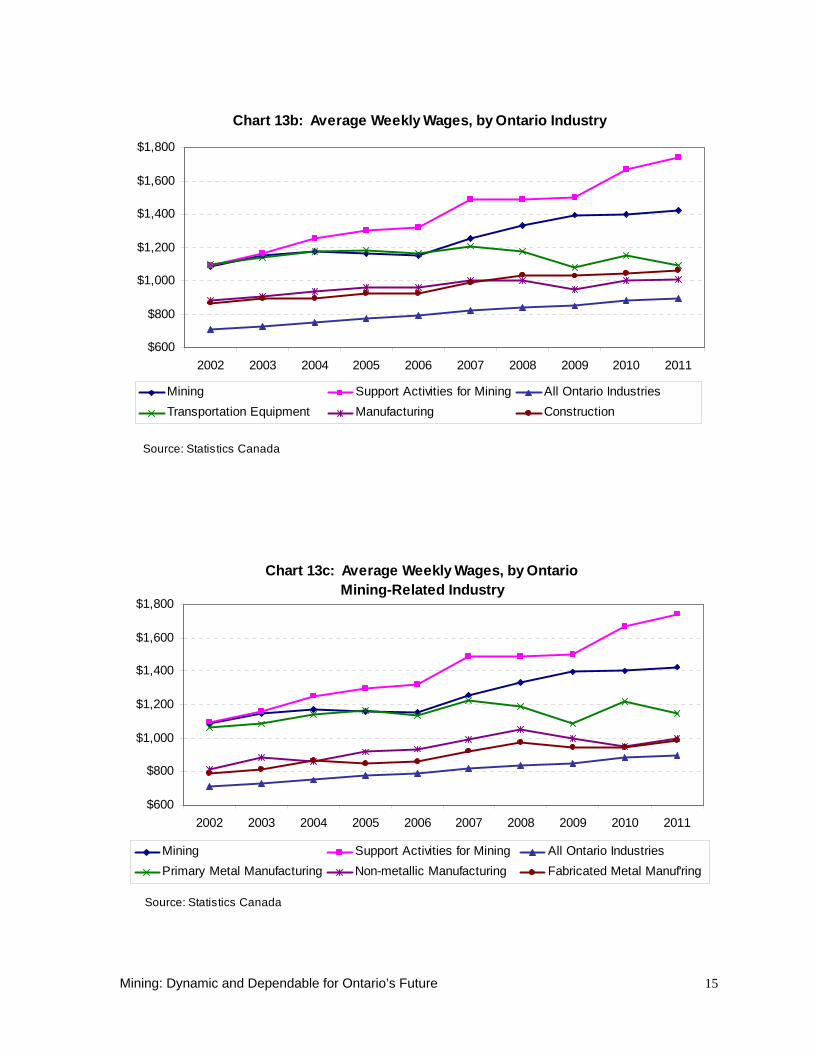
Not only is employment growing in the mining sector in Ontario but the jobs are very well paying (see Charts 13a, 13b and 13c). The average weekly wage paid in the mining industry was almost 60% more than the Ontario’s average industrial wage, while wages paid in the mining support sector were almost 95% higher. Wages in the mining resource sector exceed those in other resource based industries in the province. As well, wages in the mining sector exceed those in a number of other industries that are considered vital to the Ontario economy, including manufacturing of transportation equipment and construction. The wages paid in the Ontario mining industry and its mining support sector also far outstrip those in industries that utilize mining output.
Chart 13a: Average Weekly Wages, by Ontario Resource-Related Industry
$600
$800
$1,000
$1,200
$1,400
$1,600
$1,800
2002 2003 2004 2005 2006 2007 2008 2009 2010 2011
Mining Support Activities for Mining All Ontario IndustriesForestry, Logging & Support Wood Manufacturing Paper Manufacturing
Source: Statistics Canada
Mining: Dynamic and Dependable for Ontario’s Future
15
Chart 13b: Average Weekly Wages, by Ontario Industry
$600
$800
$1,000
$1,200
$1,400
$1,600
$1,800
2002 2003 2004 2005 2006 2007 2008 2009 2010 2011
Mining Support Activities for Mining All Ontario IndustriesTransportation Equipment Manufacturing Construction
Source: Statistics Canada
Chart 13c: Average Weekly Wages, by Ontario Mining-Related Industry
$600
$800
$1,000
$1,200
$1,400
$1,600
$1,800
2002 2003 2004 2005 2006 2007 2008 2009 2010 2011
Mining Support Activities for Mining All Ontario IndustriesPrimary Metal Manufacturing Non-metallic Manufacturing Fabricated Metal Manuf'ring
Source: Statistics Canada
Mining: Dynamic and Dependable for Ontario’s Future
16
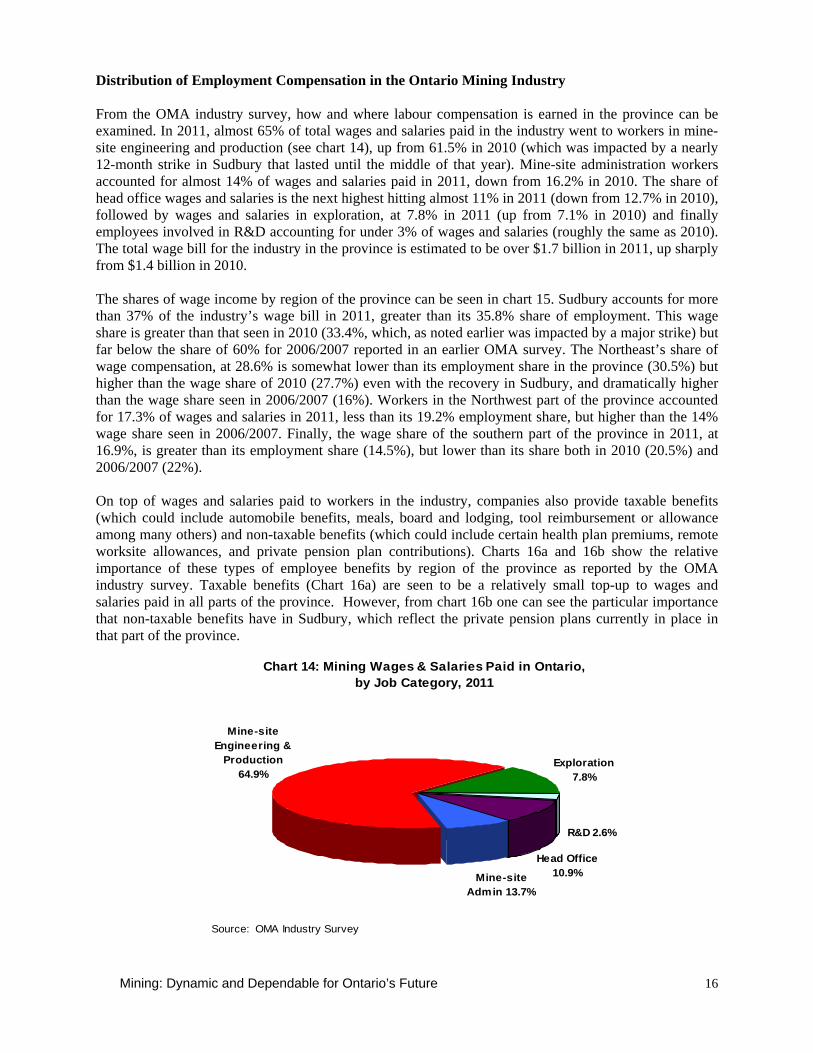
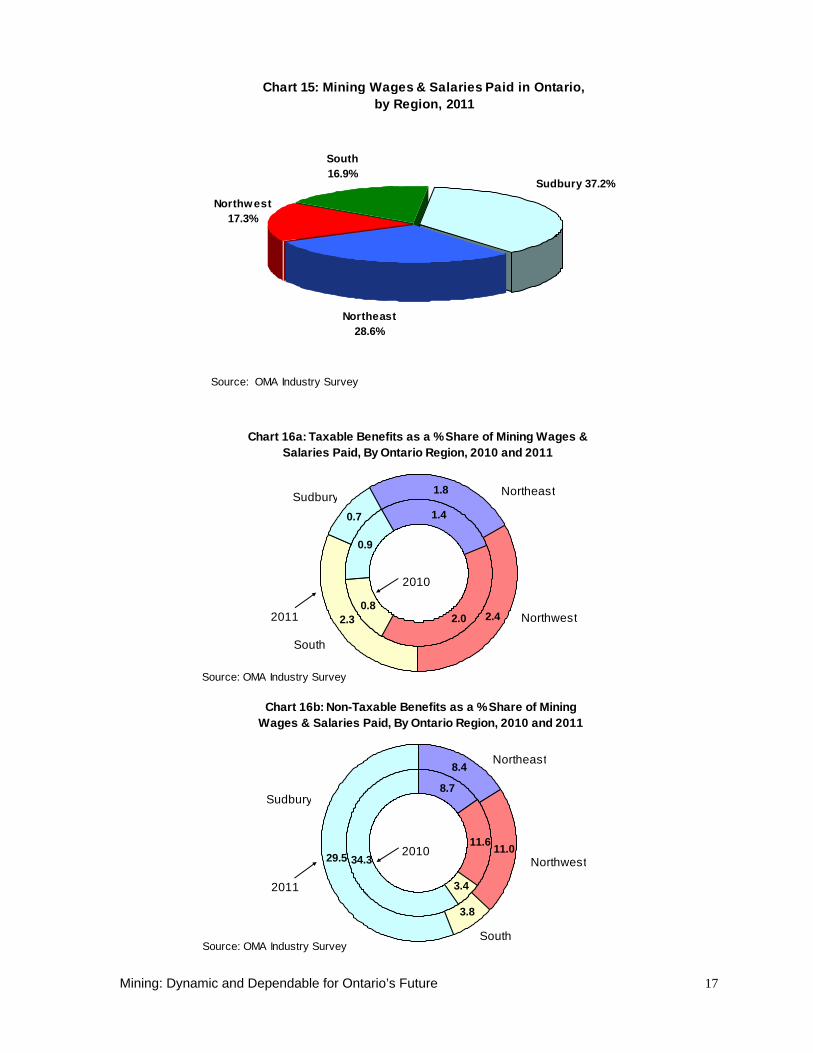
Distribution of Employment Compensation in the Ontario Mining Industry From the OMA industry survey, how and where labour compensation is earned in the province can be examined. In 2011, almost 65% of total wages and salaries paid in the industry went to workers in mine-site engineering and production (see chart 14), up from 61.5% in 2010 (which was impacted by a nearly 12-month strike in Sudbury that lasted until the middle of that year). Mine-site administration workers accounted for almost 14% of wages and salaries paid in 2011, down from 16.2% in 2010. The share of head office wages and salaries is the next highest hitting almost 11% in 2011 (down from 12.7% in 2010), followed by wages and salaries in exploration, at 7.8% in 2011 (up from 7.1% in 2010) and finally employees involved in R&D accounting for under 3% of wages and salaries (roughly the same as 2010). The total wage bill for the industry in the province is estimated to be over $1.7 billion in 2011, up sharply from $1.4 billion in 2010. The shares of wage income by region of the province can be seen in chart 15. Sudbury accounts for more than 37% of the industry’s wage bill in 2011, greater than its 35.8% share of employment. This wage share is greater than that seen in 2010 (33.4%, which, as noted earlier was impacted by a major strike) but far below the share of 60% for 2006/2007 reported in an earlier OMA survey. The Northeast’s share of wage compensation, at 28.6% is somewhat lower than its employment share in the province (30.5%) but higher than the wage share of 2010 (27.7%) even with the recovery in Sudbury, and dramatically higher than the wage share seen in 2006/2007 (16%). Workers in the Northwest part of the province accounted for 17.3% of wages and salaries in 2011, less than its 19.2% employment share, but higher than the 14% wage share seen in 2006/2007. Finally, the wage share of the southern part of the province in 2011, at 16.9%, is greater than its employment share (14.5%), but lower than its share both in 2010 (20.5%) and 2006/2007 (22%). On top of wages and salaries paid to workers in the industry, companies also provide taxable benefits (which could include automobile benefits, meals, board and lodging, tool reimbursement or allowance among many others) and non-taxable benefits (which could include certain health plan premiums, remote worksite allowances, and private pension plan contributions). Charts 16a and 16b show the relative importance of these types of employee benefits by region of the province as reported by the OMA industry survey. Taxable benefits (Chart 16a) are seen to be a relatively small top-up to wages and salaries paid in all parts of the province. However, from chart 16b one can see the particular importance that non-taxable benefits have in Sudbury, which reflect the private pension plans currently in place in that part of the province.
Chart 14: Mining Wages & Salaries Paid in Ontario, by Job Category, 2011
Head Office 10.9%
R&D 2.6%
Exploration7.8%
Mine-site Engineering &
Production64.9%
Mine-site Admin 13.7%
Source: OMA Industry Survey
Mining: Dynamic and Dependable for Ontario’s Future
17
Chart 15: Mining Wages & Salaries Paid in Ontario, by Region, 2011
Northeast 28.6%
Northwest17.3%
South16.9%
Sudbury 37.2%
Source: OMA Industry Survey
Chart 16a: Taxable Benefits as a % Share of Mining Wages &
Salaries Paid, By Ontario Region, 2010 and 2011
1.4
2.00.8
0.9
1.8
2.42.3
0.7
2010
NortheastSudbury
2011
Source: OMA Industry Survey
Northwest
South
Chart 16b: Non-Taxable Benefits as a % Share of Mining
Wages & Salaries Paid, By Ontario Region, 2010 and 2011
8.7
11.6
3.4
34.3
8.4
11.0
3.8
29.5 2010
Northeast
Sudbury
2011
Source: OMA Industry Survey
Northwest
South

Mining: Dynamic and Dependable for Ontario’s Future
18
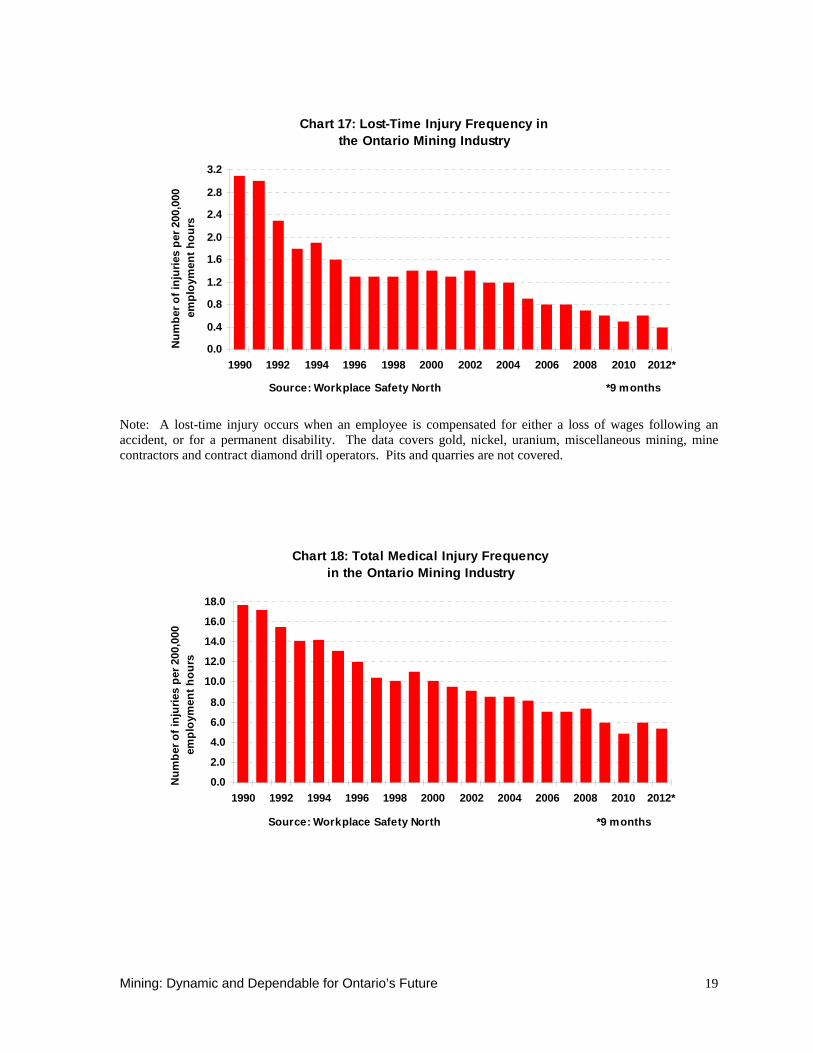
Mine Safety Moves Towards “Zero Harm” Ontario’s mining industry is moving toward its goal of “zero harm in the workplace by 2015.” Over the past 30 years, the industry’s overall safety performance has improved dramatically and it continues to move in that positive direction. According to statistics provided by Workplace Safety North, a provincial safety and accident prevention organization, the lost time injury rate for mining in the first nine months of 2012 was 0.4 per 200,000 hours (see chart 17). This has come down from rates of six per 200,000 hours in 1981, to three in 1991, to 1.3 in 2001 and to 0.6 in 2011. Similarly, total medical injury rates have come down to 5.4 per 200,000 hours for the first nine months of 2012 (see chart 18). The total medical injury rate for mining was 20 per 200,000 hours in the early 1980s, 17.7 in 1991, 9.5 in 2001 and six in 2011. Evidence shows that Ontario is one of the safest mining jurisdictions in the world. A number of factors contribute to this improvement in safety performance. These include the development of health and safety committees where management and workers address safety issues and procedures to make the workplace safer and reduce risk. Also, certified health and safety committee members audit, make recommendations, provide feedback to management and workers and ensure that legislated and company standards are maintained. Companies are building safety cultures. In addition, government chairs the tripartite Mining Legislative Rules Committee (MLRC) with management and labour. This group collaboratively sets standards, policies and procedures for safety and examines the impact of technological changes on risk management. A Common Core for industry-wide training programs have been developed which provides foundation orientation for safe mining workplaces across the province. The Internal Responsibility System (IRS) has been the cornerstone of the Occupational Health and Safety Act in Ontario since 1978. It defines the responsibility for each person in the workplace and provides workers with three rights: the right to know, the right to refuse and the right to participate in the safe and orderly production of work. The system is now part of a formal audit process. In 1997, 50 amendments to Ontario’s Regulations for Mines and Mining Plants were implemented. Key changes included new underground safety regulations, emergency braking systems on underground vehicles, improved inspection of equipment, a strengthening of the IRS and the streamlining of administrative procedures. These amendments were developed by the MLRC. The industry works closely with its accident prevention organization Workplace Safety North to improve training and enhance safety. The OMA plays a number of roles in assisting mining companies with their safety programs. The OMA acts as a forum for the exchange of information and ideas related to improving safety performance and monitors safety statistics and trends. The OMA also interfaces with the Ministry of Labour, Workplace Safety North and the MLRC in the development of new safety policies, practices, rules and regulations. The OMA Occupational Health and Safety Commitment for members is a statement of the dedication and expectations of OMA members to achieve healthy work environments. The document is directed towards establishing workplace environments that promote zero harm and the physical and mental health of its employees. It embraces the OMA members’ use of an integrated approach to the management of health and safety with the economic, technical and social processes of their business.
Mining: Dynamic and Dependable for Ontario’s Future
19
Chart 17: Lost-Time Injury Frequency in the Ontario Mining Industry
0.0
0.4
0.8
1.2
1.6
2.0
2.4
2.8
3.2
1990 1992 1994 1996 1998 2000 2002 2004 2006 2008 2010 2012*
Num
ber o
f inj
urie
s pe
r 200
,000
em
ploy
men
t hou
rs
Source: Workplace Safety North *9 months
Note: A lost-time injury occurs when an employee is compensated for either a loss of wages following an accident, or for a permanent disability. The data covers gold, nickel, uranium, miscellaneous mining, mine contractors and contract diamond drill operators. Pits and quarries are not covered.
Chart 18: Total Medical Injury Frequency in the Ontario Mining Industry
0.0
2.0
4.0
6.0
8.0
10.0
12.0
14.0
16.0
18.0
1990 1992 1994 1996 1998 2000 2002 2004 2006 2008 2010 2012*
Num
ber o
f inj
urie
s pe
r 200
,000
em
ploy
men
t hou
rs
Source: Workplace Safety North *9 months
Mining: Dynamic and Dependable for Ontario’s Future
20
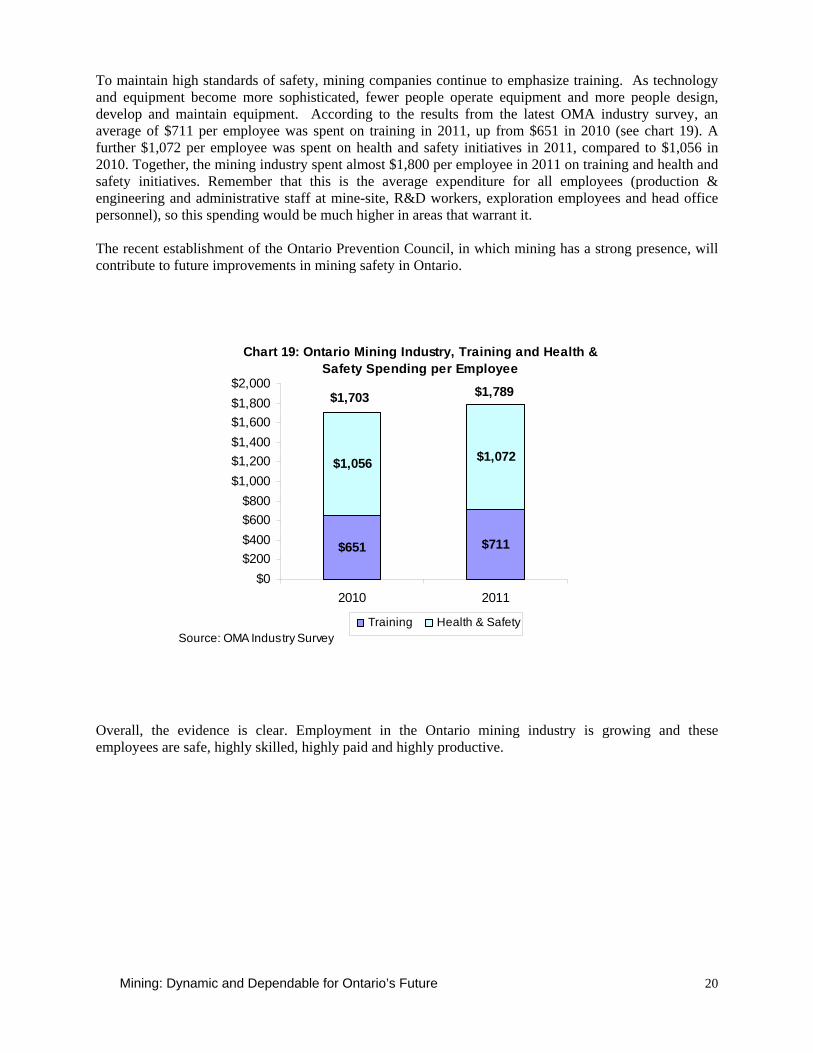
To maintain high standards of safety, mining companies continue to emphasize training. As technology and equipment become more sophisticated, fewer people operate equipment and more people design, develop and maintain equipment. According to the results from the latest OMA industry survey, an average of $711 per employee was spent on training in 2011, up from $651 in 2010 (see chart 19). A further $1,072 per employee was spent on health and safety initiatives in 2011, compared to $1,056 in 2010. Together, the mining industry spent almost $1,800 per employee in 2011 on training and health and safety initiatives. Remember that this is the average expenditure for all employees (production & engineering and administrative staff at mine-site, R&D workers, exploration employees and head office personnel), so this spending would be much higher in areas that warrant it. The recent establishment of the Ontario Prevention Council, in which mining has a strong presence, will contribute to future improvements in mining safety in Ontario.
Chart 19: Ontario Mining Industry, Training and Health & Safety Spending per Employee
$651 $711
$1,056 $1,072
$0$200$400$600$800
$1,000$1,200$1,400$1,600$1,800$2,000
2010 2011
Training Health & SafetySource: OMA Industry Survey
$1,703 $1,789
Overall, the evidence is clear. Employment in the Ontario mining industry is growing and these employees are safe, highly skilled, highly paid and highly productive.
Mining: Dynamic and Dependable for Ontario’s Future 21
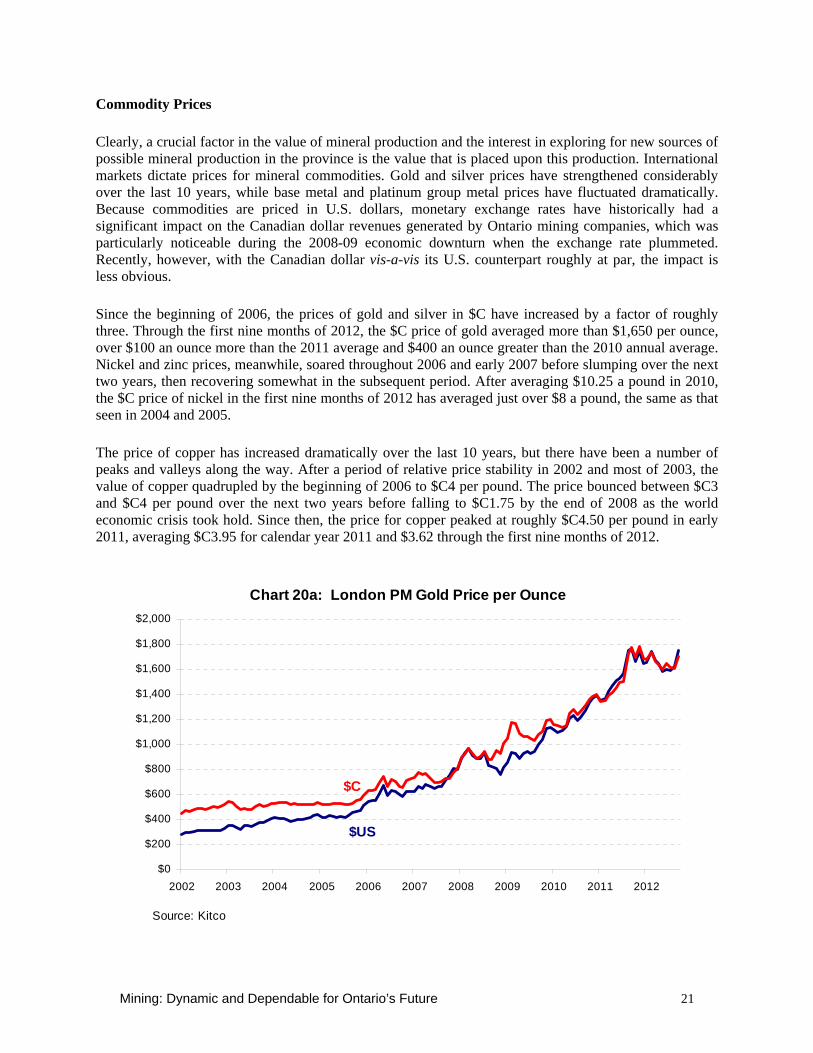
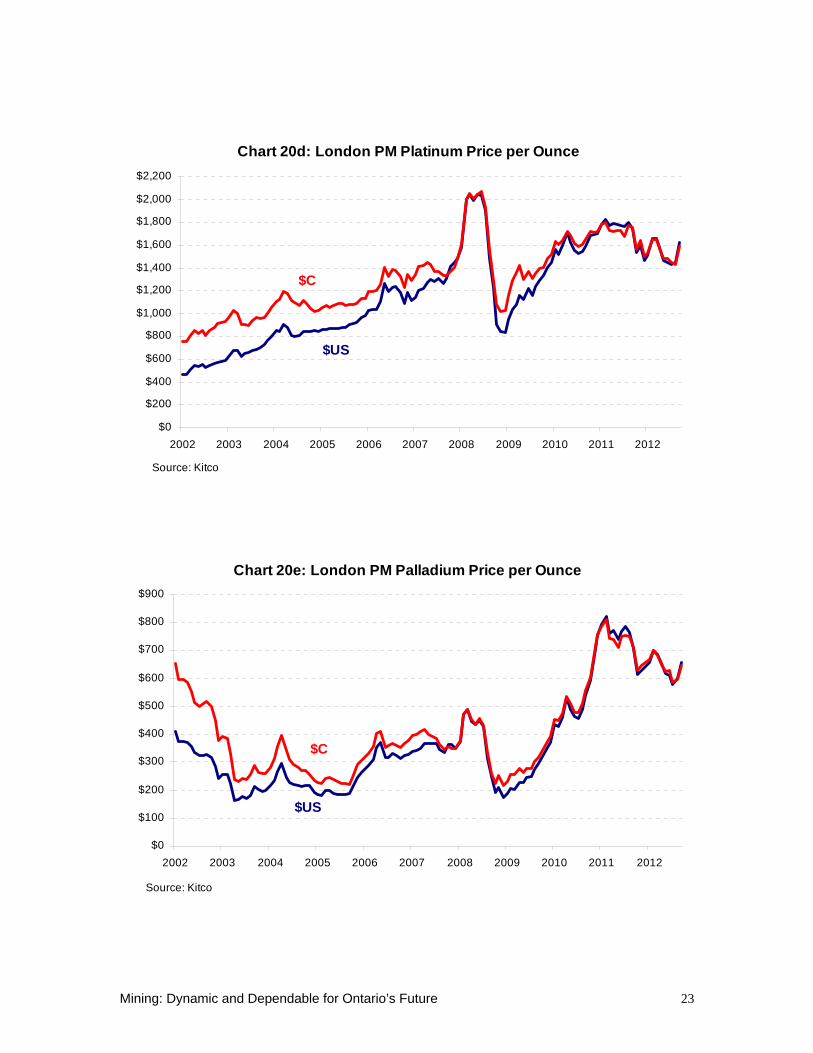
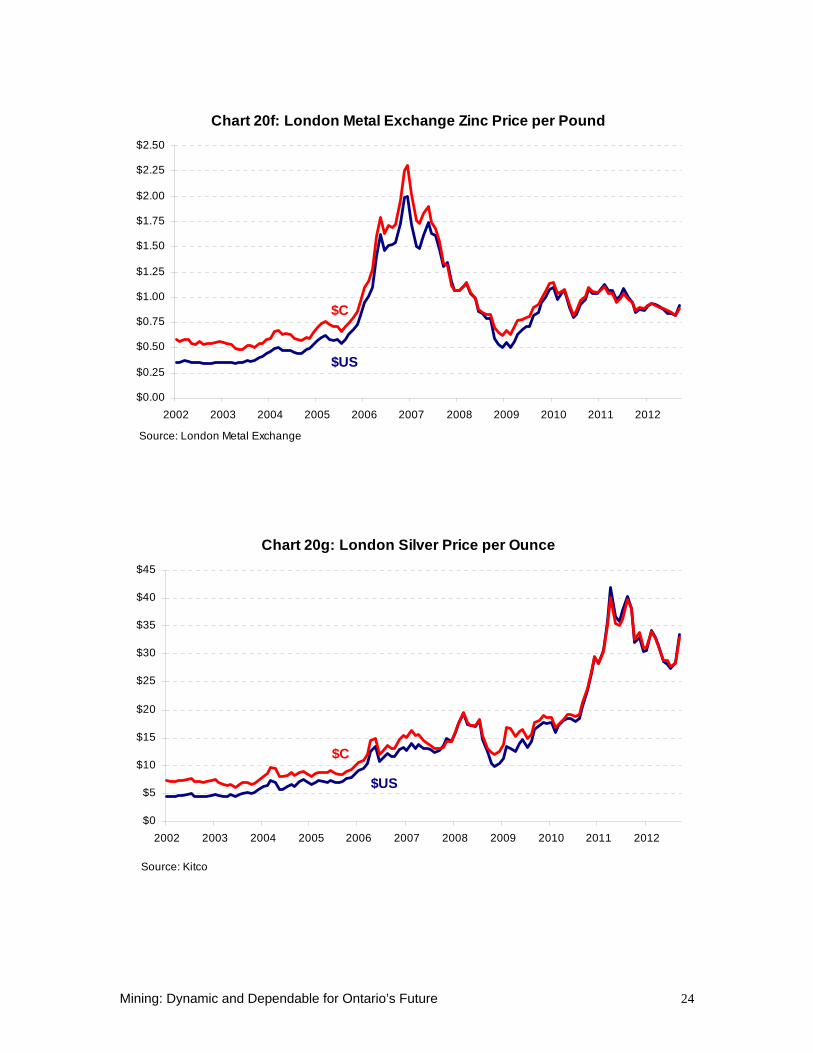
Commodity Prices Clearly, a crucial factor in the value of mineral production and the interest in exploring for new sources of possible mineral production in the province is the value that is placed upon this production. International markets dictate prices for mineral commodities. Gold and silver prices have strengthened considerably over the last 10 years, while base metal and platinum group metal prices have fluctuated dramatically. Because commodities are priced in U.S. dollars, monetary exchange rates have historically had a significant impact on the Canadian dollar revenues generated by Ontario mining companies, which was particularly noticeable during the 2008-09 economic downturn when the exchange rate plummeted. Recently, however, with the Canadian dollar vis-a-vis its U.S. counterpart roughly at par, the impact is less obvious. Since the beginning of 2006, the prices of gold and silver in $C have increased by a factor of roughly three. Through the first nine months of 2012, the $C price of gold averaged more than $1,650 per ounce, over $100 an ounce more than the 2011 average and $400 an ounce greater than the 2010 annual average. Nickel and zinc prices, meanwhile, soared throughout 2006 and early 2007 before slumping over the next two years, then recovering somewhat in the subsequent period. After averaging $10.25 a pound in 2010, the $C price of nickel in the first nine months of 2012 has averaged just over $8 a pound, the same as that seen in 2004 and 2005. The price of copper has increased dramatically over the last 10 years, but there have been a number of peaks and valleys along the way. After a period of relative price stability in 2002 and most of 2003, the value of copper quadrupled by the beginning of 2006 to $C4 per pound. The price bounced between $C3 and $C4 per pound over the next two years before falling to $C1.75 by the end of 2008 as the world economic crisis took hold. Since then, the price for copper peaked at roughly $C4.50 per pound in early 2011, averaging $C3.95 for calendar year 2011 and $3.62 through the first nine months of 2012.
Chart 20a: London PM Gold Price per Ounce
$0
$200
$400
$600
$800
$1,000
$1,200
$1,400
$1,600
$1,800
$2,000
2002 2003 2004 2005 2006 2007 2008 2009 2010 2011 2012
$US
$C
Source: Kitco

Mining: Dynamic and Dependable for Ontario’s Future 22
Chart 20b: London Metal Exchange Nickel Price per Pound
$0
$5
$10
$15
$20
$25
$30
2002 2003 2004 2005 2006 2007 2008 2009 2010 2011 2012
$US
$C
Source: London Metal Exchange
Chart 20c: London Metal Exchange Copper Price per Pound
$0.00
$0.50
$1.00
$1.50
$2.00
$2.50
$3.00
$3.50
$4.00
$4.50
$5.00
2002 2003 2004 2005 2006 2007 2008 2009 2010 2011 2012
$US
$C
Source: London Metal Exchange
Mining: Dynamic and Dependable for Ontario’s Future 23
Chart 20d: London PM Platinum Price per Ounce
$0
$200
$400
$600
$800
$1,000
$1,200
$1,400
$1,600
$1,800
$2,000
$2,200
2002 2003 2004 2005 2006 2007 2008 2009 2010 2011 2012
$US
$C
Source: Kitco
Chart 20e: London PM Palladium Price per Ounce
$0
$100
$200
$300
$400
$500
$600
$700
$800
$900
2002 2003 2004 2005 2006 2007 2008 2009 2010 2011 2012
$US
$C
Source: Kitco
Mining: Dynamic and Dependable for Ontario’s Future 24
Chart 20f: London Metal Exchange Zinc Price per Pound
$0.00
$0.25
$0.50
$0.75
$1.00
$1.25
$1.50
$1.75
$2.00
$2.25
$2.50
2002 2003 2004 2005 2006 2007 2008 2009 2010 2011 2012
$US
$C
Source: London Metal Exchange
Chart 20g: London Silver Price per Ounce
$0
$5
$10
$15
$20
$25
$30
$35
$40
$45
2002 2003 2004 2005 2006 2007 2008 2009 2010 2011 2012
$US
$C
Source: Kitco
Mining: Dynamic and Dependable for Ontario’s Future 25
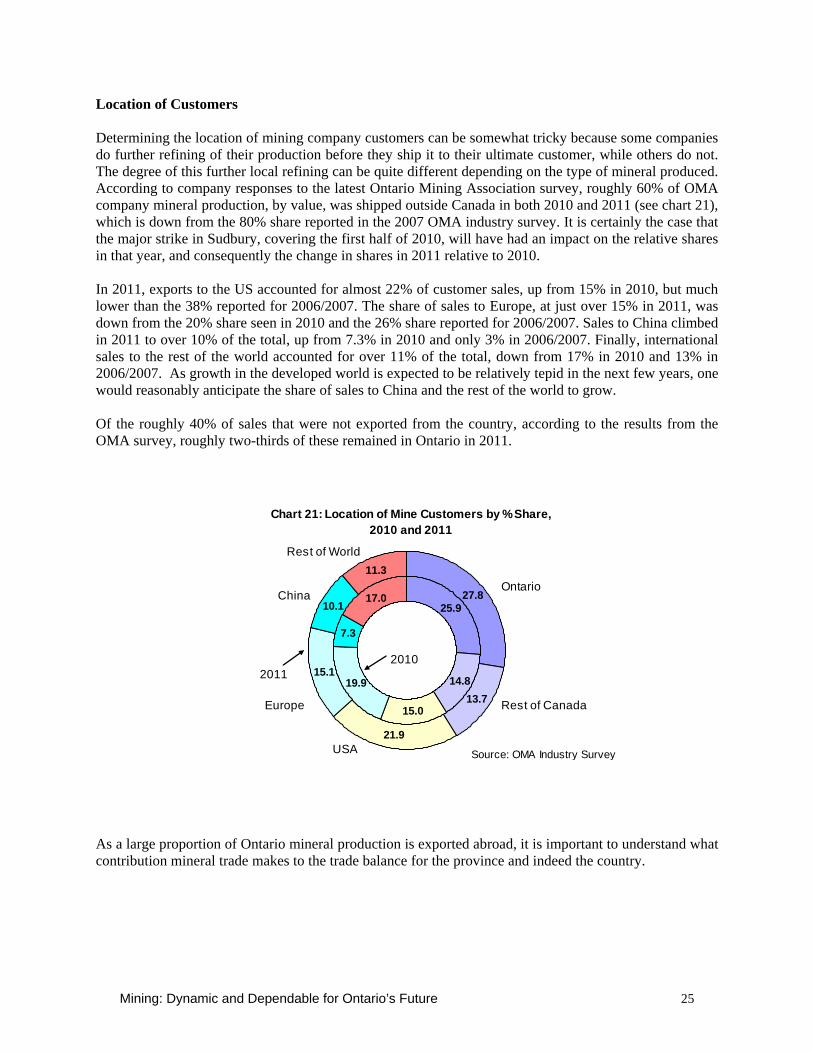
Location of Customers Determining the location of mining company customers can be somewhat tricky because some companies do further refining of their production before they ship it to their ultimate customer, while others do not. The degree of this further local refining can be quite different depending on the type of mineral produced. According to company responses to the latest Ontario Mining Association survey, roughly 60% of OMA company mineral production, by value, was shipped outside Canada in both 2010 and 2011 (see chart 21), which is down from the 80% share reported in the 2007 OMA industry survey. It is certainly the case that the major strike in Sudbury, covering the first half of 2010, will have had an impact on the relative shares in that year, and consequently the change in shares in 2011 relative to 2010. In 2011, exports to the US accounted for almost 22% of customer sales, up from 15% in 2010, but much lower than the 38% reported for 2006/2007. The share of sales to Europe, at just over 15% in 2011, was down from the 20% share seen in 2010 and the 26% share reported for 2006/2007. Sales to China climbed in 2011 to over 10% of the total, up from 7.3% in 2010 and only 3% in 2006/2007. Finally, international sales to the rest of the world accounted for over 11% of the total, down from 17% in 2010 and 13% in 2006/2007. As growth in the developed world is expected to be relatively tepid in the next few years, one would reasonably anticipate the share of sales to China and the rest of the world to grow. Of the roughly 40% of sales that were not exported from the country, according to the results from the OMA survey, roughly two-thirds of these remained in Ontario in 2011.
Chart 21: Location of Mine Customers by % Share, 2010 and 2011
25.9
14.8
15.0
19.9
7.3
17.0 27.8
13.7
21.9
15.1
10.1
11.3
2010
Ontario
Europe
2011
Source: OMA Industry Survey
Rest of Canada
USA
China
Rest of World
As a large proportion of Ontario mineral production is exported abroad, it is important to understand what contribution mineral trade makes to the trade balance for the province and indeed the country.
Mining: Dynamic and Dependable for Ontario’s Future 26
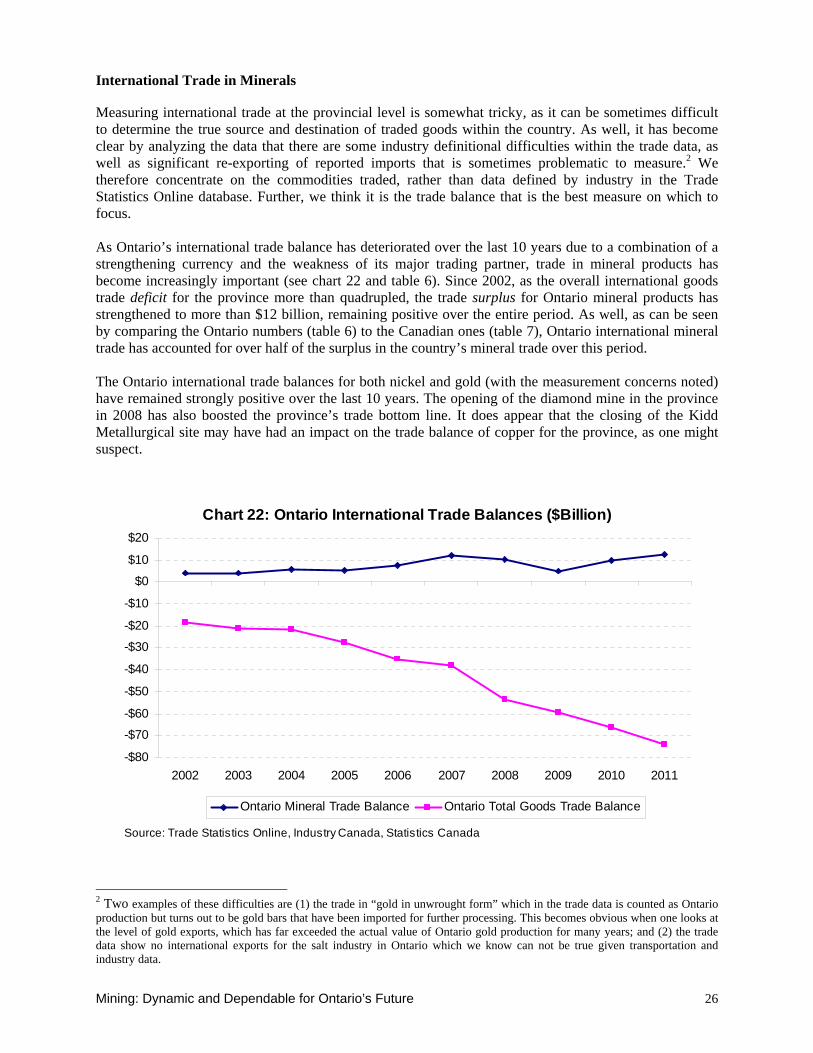
International Trade in Minerals Measuring international trade at the provincial level is somewhat tricky, as it can be sometimes difficult to determine the true source and destination of traded goods within the country. As well, it has become clear by analyzing the data that there are some industry definitional difficulties within the trade data, as well as significant re-exporting of reported imports that is sometimes problematic to measure.2 We therefore concentrate on the commodities traded, rather than data defined by industry in the Trade Statistics Online database. Further, we think it is the trade balance that is the best measure on which to focus. As Ontario’s international trade balance has deteriorated over the last 10 years due to a combination of a strengthening currency and the weakness of its major trading partner, trade in mineral products has become increasingly important (see chart 22 and table 6). Since 2002, as the overall international goods trade deficit for the province more than quadrupled, the trade surplus for Ontario mineral products has strengthened to more than $12 billion, remaining positive over the entire period. As well, as can be seen by comparing the Ontario numbers (table 6) to the Canadian ones (table 7), Ontario international mineral trade has accounted for over half of the surplus in the country’s mineral trade over this period. The Ontario international trade balances for both nickel and gold (with the measurement concerns noted) have remained strongly positive over the last 10 years. The opening of the diamond mine in the province in 2008 has also boosted the province’s trade bottom line. It does appear that the closing of the Kidd Metallurgical site may have had an impact on the trade balance of copper for the province, as one might suspect.
Chart 22: Ontario International Trade Balances ($Billion)
-$80
-$70
-$60
-$50
-$40
-$30
-$20
-$10
$0
$10
$20
2002 2003 2004 2005 2006 2007 2008 2009 2010 2011
Ontario Mineral Trade Balance Ontario Total Goods Trade Balance
Source: Trade Statistics Online, Industry Canada, Statistics Canada
2 Two examples of these difficulties are (1) the trade in “gold in unwrought form” which in the trade data is counted as Ontario production but turns out to be gold bars that have been imported for further processing. This becomes obvious when one looks at the level of gold exports, which has far exceeded the actual value of Ontario gold production for many years; and (2) the trade data show no international exports for the salt industry in Ontario which we know can not be true given transportation and industry data.
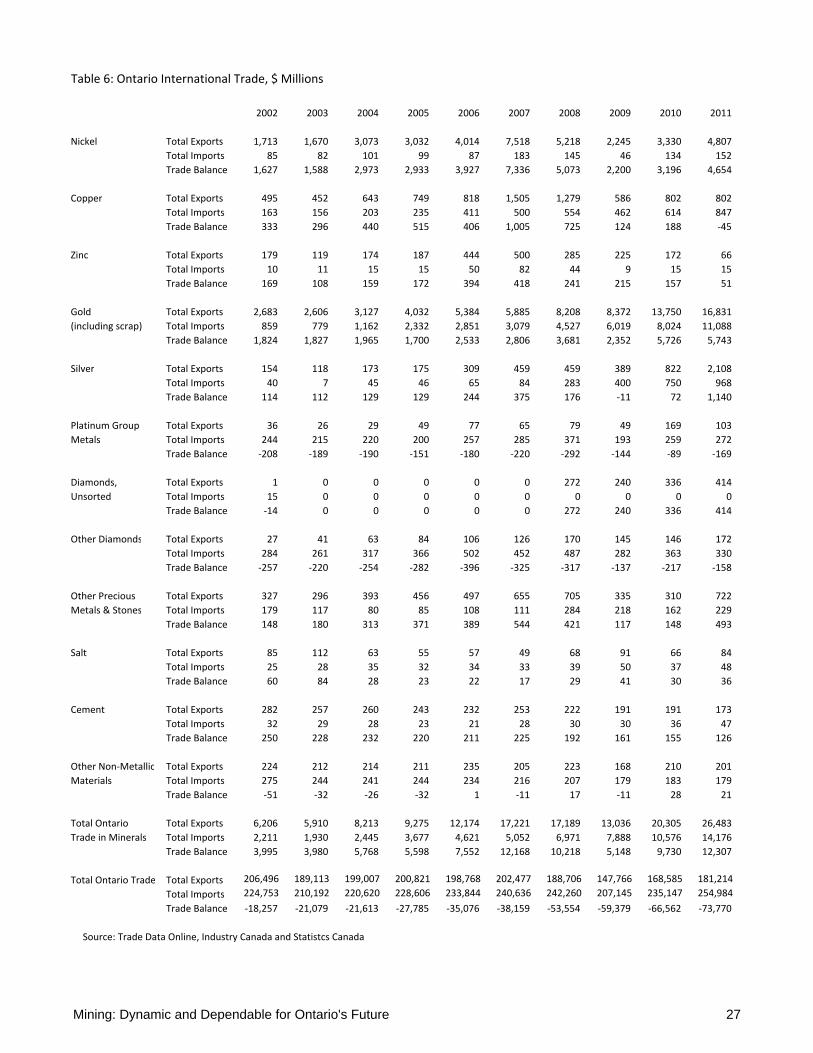
Table 6: Ontario International Trade, $ Millions
2002 2003 2004 2005 2006 2007 2008 2009 2010 2011
Nickel Total Exports 1,713 1,670 3,073 3,032 4,014 7,518 5,218 2,245 3,330 4,807Total Imports 85 82 101 99 87 183 145 46 134 152Trade Balance 1,627 1,588 2,973 2,933 3,927 7,336 5,073 2,200 3,196 4,654
Copper Total Exports 495 452 643 749 818 1,505 1,279 586 802 802Total Imports 163 156 203 235 411 500 554 462 614 847Trade Balance 333 296 440 515 406 1,005 725 124 188 ‐45
Zinc Total Exports 179 119 174 187 444 500 285 225 172 66Total Imports 10 11 15 15 50 82 44 9 15 15Trade Balance 169 108 159 172 394 418 241 215 157 51
Gold Total Exports 2,683 2,606 3,127 4,032 5,384 5,885 8,208 8,372 13,750 16,831(including scrap) Total Imports 859 779 1,162 2,332 2,851 3,079 4,527 6,019 8,024 11,088
Trade Balance 1,824 1,827 1,965 1,700 2,533 2,806 3,681 2,352 5,726 5,743
Silver Total Exports 154 118 173 175 309 459 459 389 822 2,108Total Imports 40 7 45 46 65 84 283 400 750 968Trade Balance 114 112 129 129 244 375 176 ‐11 72 1,140
Platinum Group Total Exports 36 26 29 49 77 65 79 49 169 103Metals Total Imports 244 215 220 200 257 285 371 193 259 272
Trade Balance ‐208 ‐189 ‐190 ‐151 ‐180 ‐220 ‐292 ‐144 ‐89 ‐169
Diamonds, Total Exports 1 0 0 0 0 0 272 240 336 414Unsorted Total Imports 15 0 0 0 0 0 0 0 0 0
Trade Balance ‐14 0 0 0 0 0 272 240 336 414
Other Diamonds Total Exports 27 41 63 84 106 126 170 145 146 172Total Imports 284 261 317 366 502 452 487 282 363 330Trade Balance ‐257 ‐220 ‐254 ‐282 ‐396 ‐325 ‐317 ‐137 ‐217 ‐158
Other Precious Total Exports 327 296 393 456 497 655 705 335 310 722Metals & Stones Total Imports 179 117 80 85 108 111 284 218 162 229
Trade Balance 148 180 313 371 389 544 421 117 148 493
Salt Total Exports 85 112 63 55 57 49 68 91 66 84Total Imports 25 28 35 32 34 33 39 50 37 48Trade Balance 60 84 28 23 22 17 29 41 30 36
Cement Total Exports 282 257 260 243 232 253 222 191 191 173Total Imports 32 29 28 23 21 28 30 30 36 47Trade Balance 250 228 232 220 211 225 192 161 155 126
Other Non‐Metallic Total Exports 224 212 214 211 235 205 223 168 210 201Materials Total Imports 275 244 241 244 234 216 207 179 183 179
Trade Balance ‐51 ‐32 ‐26 ‐32 1 ‐11 17 ‐11 28 21
Total Ontario Total Exports 6,206 5,910 8,213 9,275 12,174 17,221 17,189 13,036 20,305 26,483Trade in Minerals Total Imports 2,211 1,930 2,445 3,677 4,621 5,052 6,971 7,888 10,576 14,176
Trade Balance 3,995 3,980 5,768 5,598 7,552 12,168 10,218 5,148 9,730 12,307
Total Ontario Trade Total Exports 206,496 189,113 199,007 200,821 198,768 202,477 188,706 147,766 168,585 181,214
Total Imports 224,753 210,192 220,620 228,606 233,844 240,636 242,260 207,145 235,147 254,984
Trade Balance ‐18,257 ‐21,079 ‐21,613 ‐27,785 ‐35,076 ‐38,159 ‐53,554 ‐59,379 ‐66,562 ‐73,770
Source: Trade Data Online, Industry Canada and Statistcs Canada
Mining: Dynamic and Dependable for Ontario's Future 27
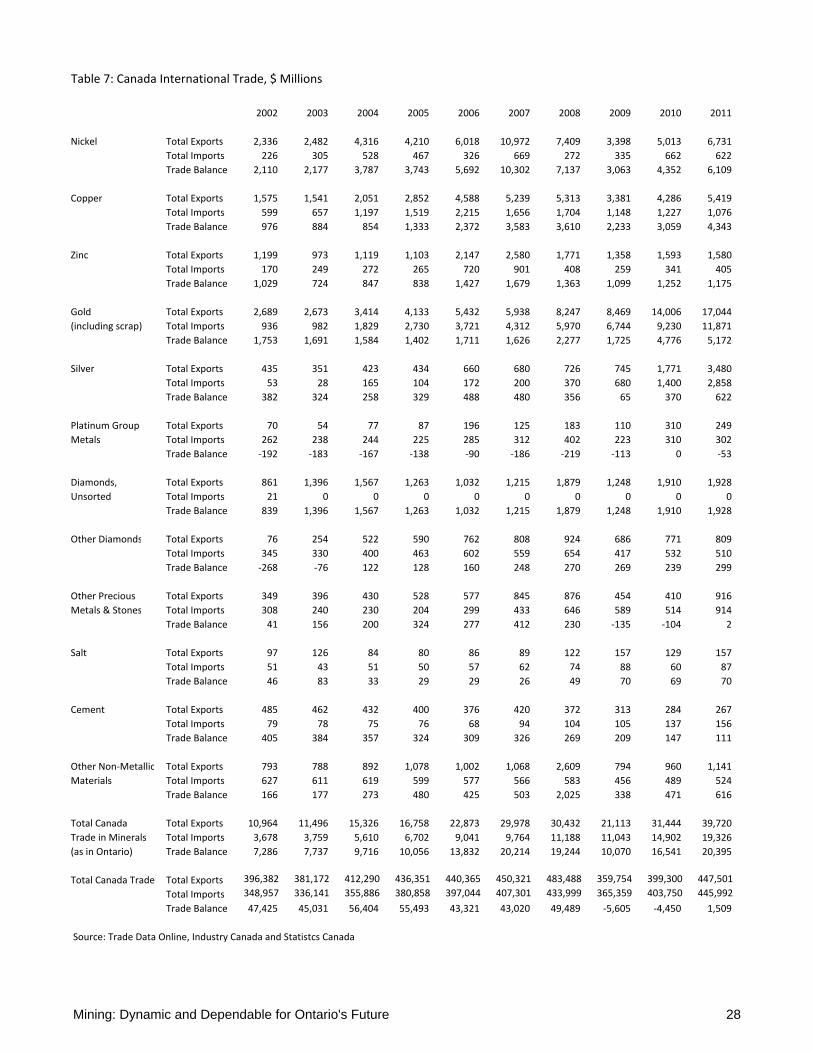
Table 7: Canada International Trade, $ Millions
2002 2003 2004 2005 2006 2007 2008 2009 2010 2011
Nickel Total Exports 2,336 2,482 4,316 4,210 6,018 10,972 7,409 3,398 5,013 6,731Total Imports 226 305 528 467 326 669 272 335 662 622Trade Balance 2,110 2,177 3,787 3,743 5,692 10,302 7,137 3,063 4,352 6,109
Copper Total Exports 1,575 1,541 2,051 2,852 4,588 5,239 5,313 3,381 4,286 5,419Total Imports 599 657 1,197 1,519 2,215 1,656 1,704 1,148 1,227 1,076Trade Balance 976 884 854 1,333 2,372 3,583 3,610 2,233 3,059 4,343
Zinc Total Exports 1,199 973 1,119 1,103 2,147 2,580 1,771 1,358 1,593 1,580Total Imports 170 249 272 265 720 901 408 259 341 405Trade Balance 1,029 724 847 838 1,427 1,679 1,363 1,099 1,252 1,175
Gold Total Exports 2,689 2,673 3,414 4,133 5,432 5,938 8,247 8,469 14,006 17,044(including scrap) Total Imports 936 982 1,829 2,730 3,721 4,312 5,970 6,744 9,230 11,871
Trade Balance 1,753 1,691 1,584 1,402 1,711 1,626 2,277 1,725 4,776 5,172
Silver Total Exports 435 351 423 434 660 680 726 745 1,771 3,480Total Imports 53 28 165 104 172 200 370 680 1,400 2,858Trade Balance 382 324 258 329 488 480 356 65 370 622
Platinum Group Total Exports 70 54 77 87 196 125 183 110 310 249Metals Total Imports 262 238 244 225 285 312 402 223 310 302
Trade Balance ‐192 ‐183 ‐167 ‐138 ‐90 ‐186 ‐219 ‐113 0 ‐53
Diamonds, Total Exports 861 1,396 1,567 1,263 1,032 1,215 1,879 1,248 1,910 1,928Unsorted Total Imports 21 0 0 0 0 0 0 0 0 0
Trade Balance 839 1,396 1,567 1,263 1,032 1,215 1,879 1,248 1,910 1,928
Other Diamonds Total Exports 76 254 522 590 762 808 924 686 771 809Total Imports 345 330 400 463 602 559 654 417 532 510Trade Balance ‐268 ‐76 122 128 160 248 270 269 239 299
Other Precious Total Exports 349 396 430 528 577 845 876 454 410 916Metals & Stones Total Imports 308 240 230 204 299 433 646 589 514 914
Trade Balance 41 156 200 324 277 412 230 ‐135 ‐104 2
Salt Total Exports 97 126 84 80 86 89 122 157 129 157Total Imports 51 43 51 50 57 62 74 88 60 87Trade Balance 46 83 33 29 29 26 49 70 69 70
Cement Total Exports 485 462 432 400 376 420 372 313 284 267Total Imports 79 78 75 76 68 94 104 105 137 156Trade Balance 405 384 357 324 309 326 269 209 147 111
Other Non‐Metallic Total Exports 793 788 892 1,078 1,002 1,068 2,609 794 960 1,141Materials Total Imports 627 611 619 599 577 566 583 456 489 524
Trade Balance 166 177 273 480 425 503 2,025 338 471 616
Total Canada Total Exports 10,964 11,496 15,326 16,758 22,873 29,978 30,432 21,113 31,444 39,720Trade in Minerals Total Imports 3,678 3,759 5,610 6,702 9,041 9,764 11,188 11,043 14,902 19,326(as in Ontario) Trade Balance 7,286 7,737 9,716 10,056 13,832 20,214 19,244 10,070 16,541 20,395
Total Canada Trade Total Exports 396,382 381,172 412,290 436,351 440,365 450,321 483,488 359,754 399,300 447,501
Total Imports 348,957 336,141 355,886 380,858 397,044 407,301 433,999 365,359 403,750 445,992
Trade Balance 47,425 45,031 56,404 55,493 43,321 43,020 49,489 ‐5,605 ‐4,450 1,509
Source: Trade Data Online, Industry Canada and Statistcs Canada
Mining: Dynamic and Dependable for Ontario's Future 28
Mining: Dynamic and Dependable for Ontario’s Future 29
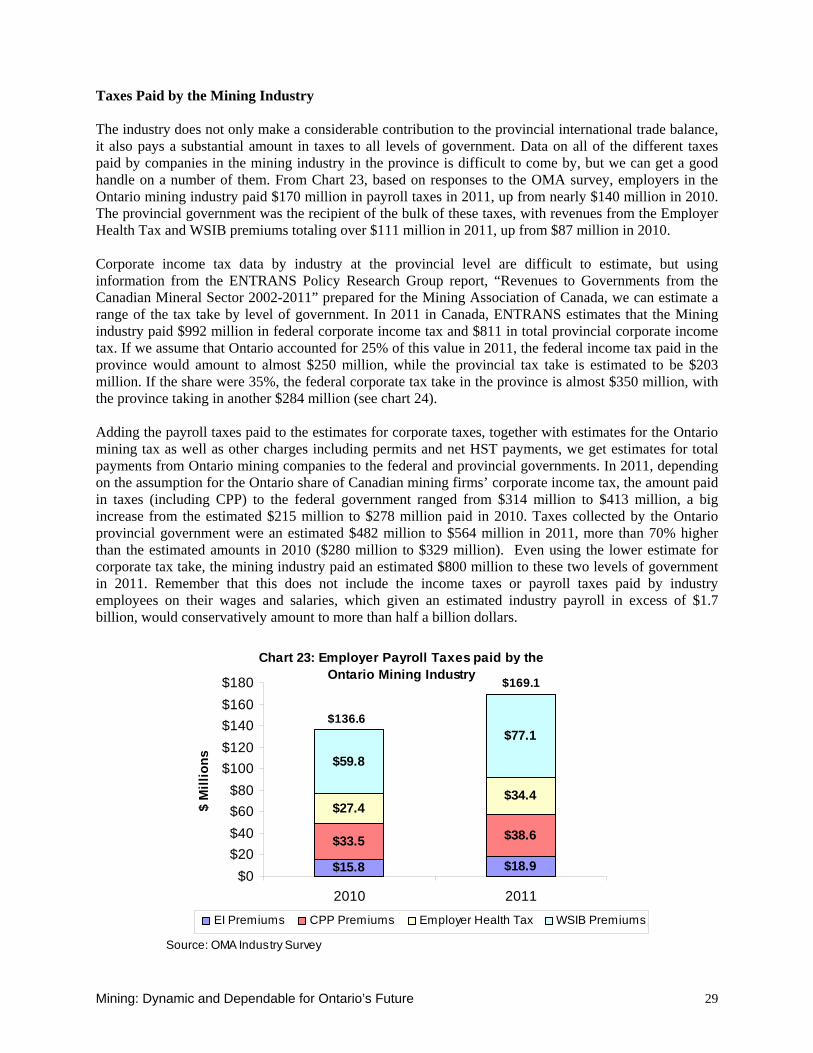
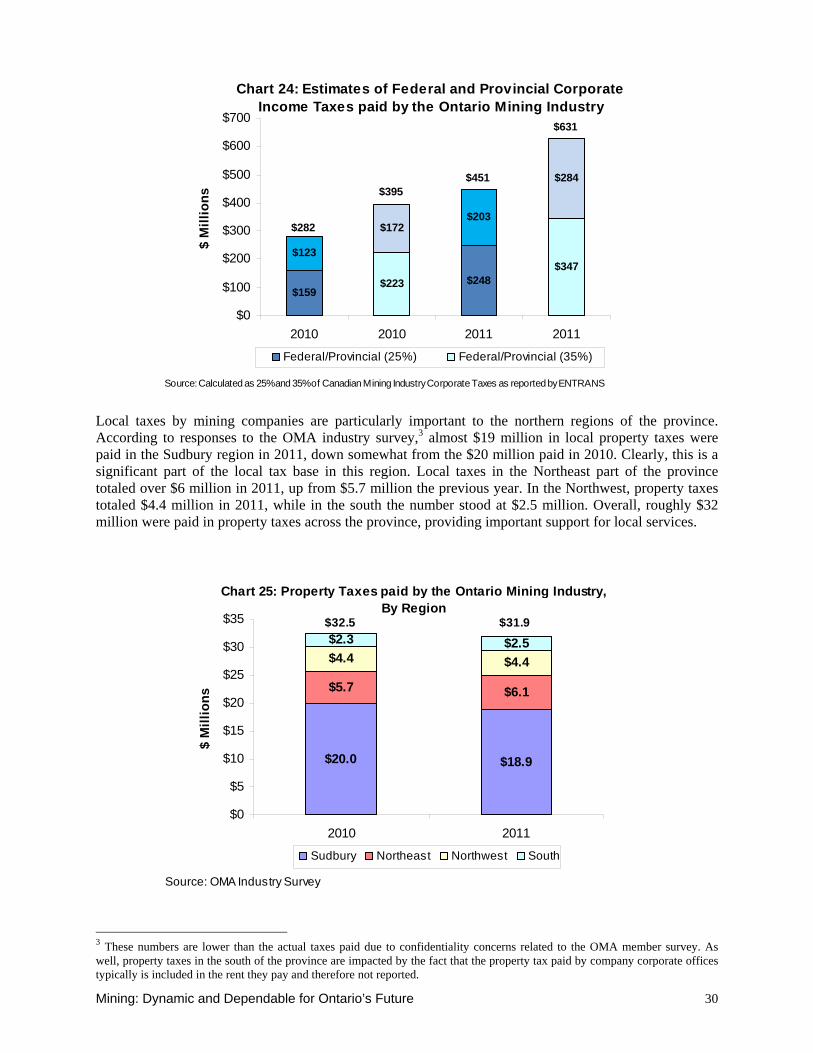
Taxes Paid by the Mining Industry The industry does not only make a considerable contribution to the provincial international trade balance, it also pays a substantial amount in taxes to all levels of government. Data on all of the different taxes paid by companies in the mining industry in the province is difficult to come by, but we can get a good handle on a number of them. From Chart 23, based on responses to the OMA survey, employers in the Ontario mining industry paid $170 million in payroll taxes in 2011, up from nearly $140 million in 2010. The provincial government was the recipient of the bulk of these taxes, with revenues from the Employer Health Tax and WSIB premiums totaling over $111 million in 2011, up from $87 million in 2010. Corporate income tax data by industry at the provincial level are difficult to estimate, but using information from the ENTRANS Policy Research Group report, “Revenues to Governments from the Canadian Mineral Sector 2002-2011” prepared for the Mining Association of Canada, we can estimate a range of the tax take by level of government. In 2011 in Canada, ENTRANS estimates that the Mining industry paid $992 million in federal corporate income tax and $811 in total provincial corporate income tax. If we assume that Ontario accounted for 25% of this value in 2011, the federal income tax paid in the province would amount to almost $250 million, while the provincial tax take is estimated to be $203 million. If the share were 35%, the federal corporate tax take in the province is almost $350 million, with the province taking in another $284 million (see chart 24). Adding the payroll taxes paid to the estimates for corporate taxes, together with estimates for the Ontario mining tax as well as other charges including permits and net HST payments, we get estimates for total payments from Ontario mining companies to the federal and provincial governments. In 2011, depending on the assumption for the Ontario share of Canadian mining firms’ corporate income tax, the amount paid in taxes (including CPP) to the federal government ranged from $314 million to $413 million, a big increase from the estimated $215 million to $278 million paid in 2010. Taxes collected by the Ontario provincial government were an estimated $482 million to $564 million in 2011, more than 70% higher than the estimated amounts in 2010 ($280 million to $329 million). Even using the lower estimate for corporate tax take, the mining industry paid an estimated $800 million to these two levels of government in 2011. Remember that this does not include the income taxes or payroll taxes paid by industry employees on their wages and salaries, which given an estimated industry payroll in excess of $1.7 billion, would conservatively amount to more than half a billion dollars.
Chart 23: Employer Payroll Taxes paid by the Ontario Mining Industry
$15.8 $18.9
$33.5 $38.6
$27.4$34.4
$59.8
$77.1
$0$20$40$60$80
$100$120$140$160$180
2010 2011
$ M
illio
ns
EI Premiums CPP Premiums Employer Health Tax WSIB Premiums
Source: OMA Industry Survey
$136.6
$169.1
Mining: Dynamic and Dependable for Ontario’s Future 30
Chart 24: Estimates of Federal and Provincial Corporate Income Taxes paid by the Ontario Mining Industry
$159$223 $248
$347$123
$172$203
$284
$0
$100
$200
$300
$400
$500
$600
$700
2010 2010 2011 2011
$ M
illio
ns
Federal/Provincial (25%) Federal/Provincial (35%)
Source: Calculated as 25% and 35% of Canadian Mining Industry Corporate Taxes as reported by ENTRANS
$282
$451$395
$631
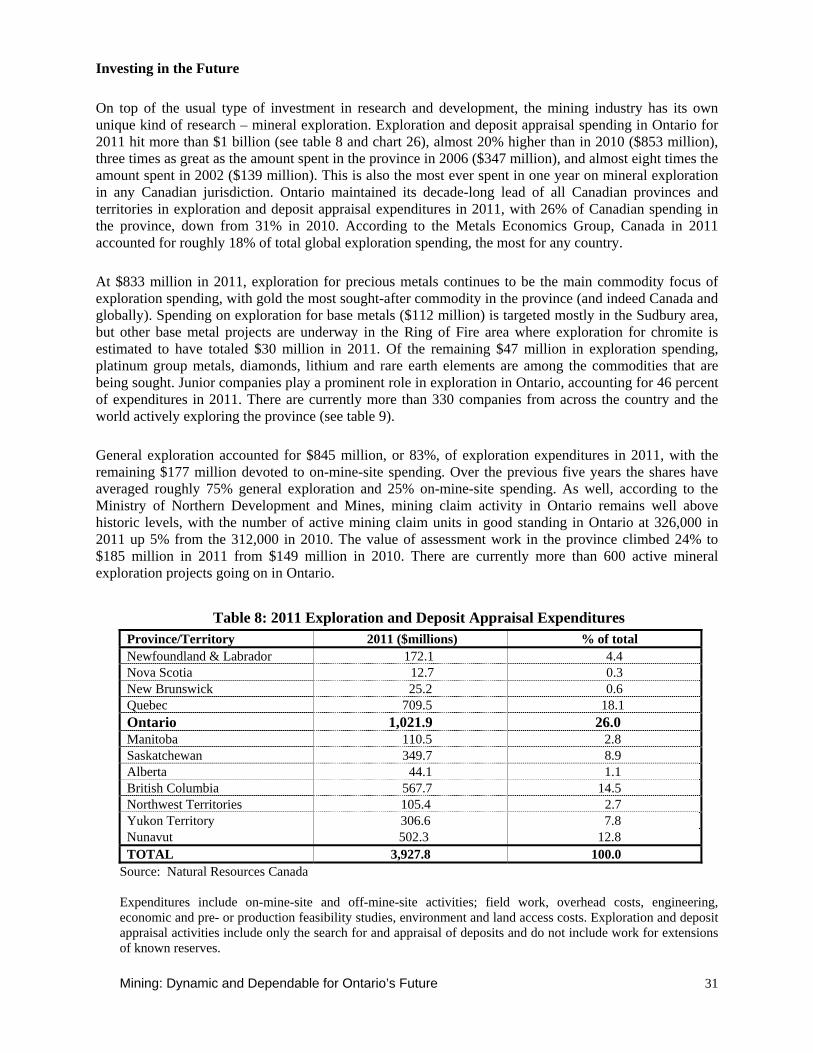
Local taxes by mining companies are particularly important to the northern regions of the province. According to responses to the OMA industry survey,3 almost $19 million in local property taxes were paid in the Sudbury region in 2011, down somewhat from the $20 million paid in 2010. Clearly, this is a significant part of the local tax base in this region. Local taxes in the Northeast part of the province totaled over $6 million in 2011, up from $5.7 million the previous year. In the Northwest, property taxes totaled $4.4 million in 2011, while in the south the number stood at $2.5 million. Overall, roughly $32 million were paid in property taxes across the province, providing important support for local services.
Chart 25: Property Taxes paid by the Ontario Mining Industry, By Region
$20.0 $18.9
$5.7 $6.1
$4.4 $4.4
$2.3 $2.5
$0
$5
$10
$15
$20
$25
$30
$35
2010 2011
$ M
illio
ns
Sudbury Northeast Northwest South
Source: OMA Industry Survey
$32.5 $31.9
3 These numbers are lower than the actual taxes paid due to confidentiality concerns related to the OMA member survey. As well, property taxes in the south of the province are impacted by the fact that the property tax paid by company corporate offices typically is included in the rent they pay and therefore not reported.
Mining: Dynamic and Dependable for Ontario’s Future
31
Investing in the Future On top of the usual type of investment in research and development, the mining industry has its own unique kind of research – mineral exploration. Exploration and deposit appraisal spending in Ontario for 2011 hit more than $1 billion (see table 8 and chart 26), almost 20% higher than in 2010 ($853 million), three times as great as the amount spent in the province in 2006 ($347 million), and almost eight times the amount spent in 2002 ($139 million). This is also the most ever spent in one year on mineral exploration in any Canadian jurisdiction. Ontario maintained its decade-long lead of all Canadian provinces and territories in exploration and deposit appraisal expenditures in 2011, with 26% of Canadian spending in the province, down from 31% in 2010. According to the Metals Economics Group, Canada in 2011 accounted for roughly 18% of total global exploration spending, the most for any country. At $833 million in 2011, exploration for precious metals continues to be the main commodity focus of exploration spending, with gold the most sought-after commodity in the province (and indeed Canada and globally). Spending on exploration for base metals ($112 million) is targeted mostly in the Sudbury area, but other base metal projects are underway in the Ring of Fire area where exploration for chromite is estimated to have totaled $30 million in 2011. Of the remaining $47 million in exploration spending, platinum group metals, diamonds, lithium and rare earth elements are among the commodities that are being sought. Junior companies play a prominent role in exploration in Ontario, accounting for 46 percent of expenditures in 2011. There are currently more than 330 companies from across the country and the world actively exploring the province (see table 9). General exploration accounted for $845 million, or 83%, of exploration expenditures in 2011, with the remaining $177 million devoted to on-mine-site spending. Over the previous five years the shares have averaged roughly 75% general exploration and 25% on-mine-site spending. As well, according to the Ministry of Northern Development and Mines, mining claim activity in Ontario remains well above historic levels, with the number of active mining claim units in good standing in Ontario at 326,000 in 2011 up 5% from the 312,000 in 2010. The value of assessment work in the province climbed 24% to $185 million in 2011 from $149 million in 2010. There are currently more than 600 active mineral exploration projects going on in Ontario.
Table 8: 2011 Exploration and Deposit Appraisal Expenditures
Province/Territory 2011 ($millions) % of total Newfoundland & Labrador 172.1 4.4 Nova Scotia 12.7 0.3 New Brunswick 25.2 0.6 Quebec 709.5 18.1 Ontario 1,021.9 26.0 Manitoba 110.5 2.8 Saskatchewan 349.7 8.9 Alberta 44.1 1.1 British Columbia 567.7 14.5 Northwest Territories 105.4 2.7 Yukon Territory 306.6 7.8 Nunavut 502.3 12.8 TOTAL 3,927.8 100.0
Source: Natural Resources Canada Expenditures include on-mine-site and off-mine-site activities; field work, overhead costs, engineering, economic and pre- or production feasibility studies, environment and land access costs. Exploration and deposit appraisal activities include only the search for and appraisal of deposits and do not include work for extensions of known reserves.
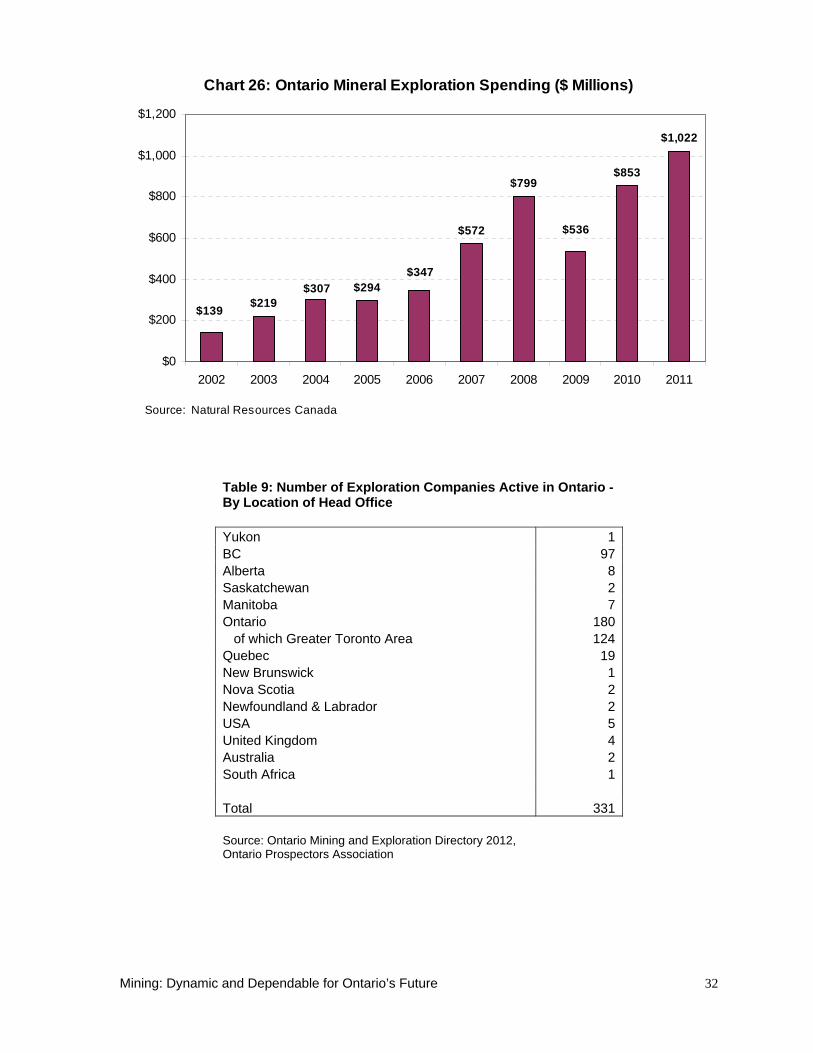
Mining: Dynamic and Dependable for Ontario’s Future
32
Chart 26: Ontario Mineral Exploration Spending ($ Millions)
$219$294
$572
$799$853
$1,022
$307
$536
$347
$139
$0
$200
$400
$600
$800
$1,000
$1,200
2002 2003 2004 2005 2006 2007 2008 2009 2010 2011
Source: Natural Resources Canada
Table 9: Number of Exploration Companies Active in Ontario - By Location of Head Office Yukon 1 BC 97 Alberta 8 Saskatchewan 2 Manitoba 7 Ontario 180 of which Greater Toronto Area 124 Quebec 19 New Brunswick 1 Nova Scotia 2 Newfoundland & Labrador 2 USA 5 United Kingdom 4 Australia 2 South Africa 1 Total 331 Source: Ontario Mining and Exploration Directory 2012, Ontario Prospectors Association
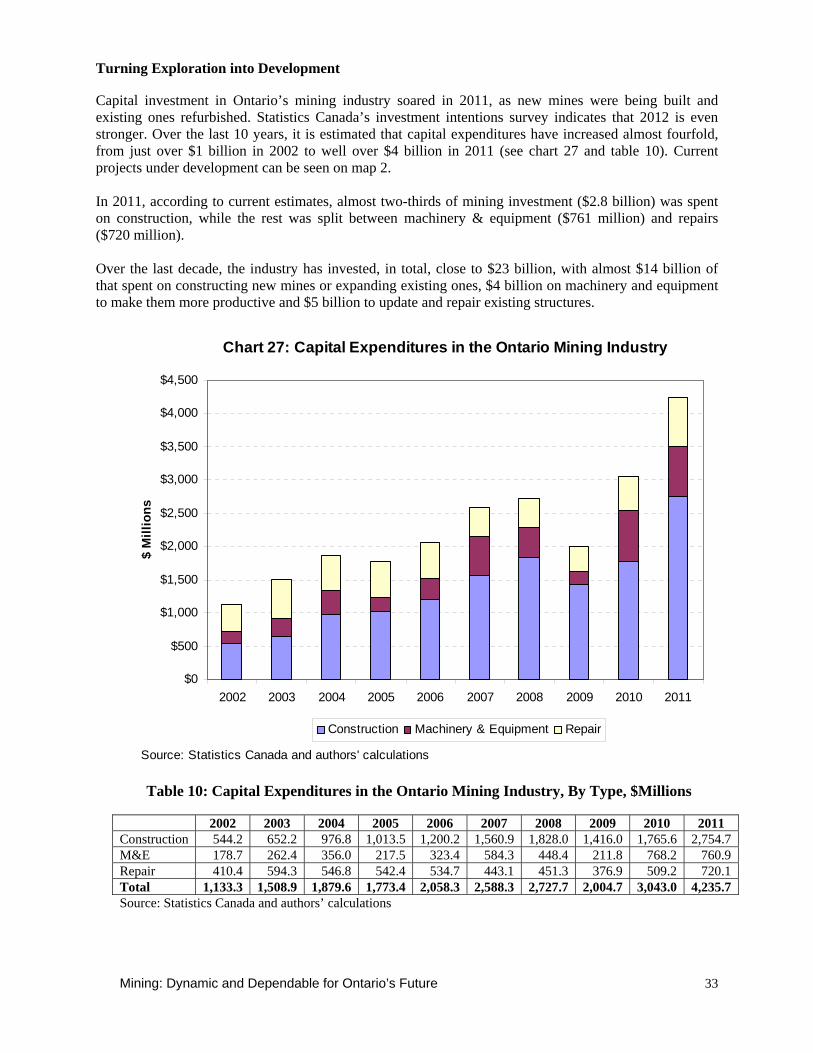
Mining: Dynamic and Dependable for Ontario’s Future
33
Turning Exploration into Development Capital investment in Ontario’s mining industry soared in 2011, as new mines were being built and existing ones refurbished. Statistics Canada’s investment intentions survey indicates that 2012 is even stronger. Over the last 10 years, it is estimated that capital expenditures have increased almost fourfold, from just over $1 billion in 2002 to well over $4 billion in 2011 (see chart 27 and table 10). Current projects under development can be seen on map 2. In 2011, according to current estimates, almost two-thirds of mining investment ($2.8 billion) was spent on construction, while the rest was split between machinery & equipment ($761 million) and repairs ($720 million). Over the last decade, the industry has invested, in total, close to $23 billion, with almost $14 billion of that spent on constructing new mines or expanding existing ones, $4 billion on machinery and equipment to make them more productive and $5 billion to update and repair existing structures.
Chart 27: Capital Expenditures in the Ontario Mining Industry
$0
$500
$1,000
$1,500
$2,000
$2,500
$3,000
$3,500
$4,000
$4,500
2002 2003 2004 2005 2006 2007 2008 2009 2010 2011
$ M
illio
ns
Construction Machinery & Equipment Repair
Source: Statistics Canada and authors' calculations
Table 10: Capital Expenditures in the Ontario Mining Industry, By Type, $Millions 2002 2003 2004 2005 2006 2007 2008 2009 2010 2011 Construction 544.2 652.2 976.8 1,013.5 1,200.2 1,560.9 1,828.0 1,416.0 1,765.6 2,754.7 M&E 178.7 262.4 356.0 217.5 323.4 584.3 448.4 211.8 768.2 760.9 Repair 410.4 594.3 546.8 542.4 534.7 443.1 451.3 376.9 509.2 720.1 Total 1,133.3 1,508.9 1,879.6 1,773.4 2,058.3 2,588.3 2,727.7 2,004.7 3,043.0 4,235.7 Source: Statistics Canada and authors’ calculations

Mining: Dynamic and Dependable for Ontario’s Future
34
Map 2:
Source: Ontario Mining and Exploration Directory 2012, Ontario Prospectors Association
Note: Quadra FNX Mining Ltd. is now KGHM International Note: AuRico Gold’s Young-Davidson mine in commercial production as of September 1, 2012 Note: Trelawney Mining and Exploration Inc. now part of IAMGOLD
Mining: Dynamic and Dependable for Ontario’s Future
35
New Mines from Old Sites Technological advances and changing economics and markets can turn old mineral properties into new mines. This has certainly been the case in Ontario in the last few years. As the price of gold has climbed, a number of mines across the northern part of the province have been “reborn”. Northgate Minerals, now owned by AuRico Gold, invested an estimated $339 (U.S.) million to construct the Young-Davidson Gold Mine which began production in mid-2012. Young-Davidson is located near Matachewan in northeastern Ontario and is about 50 kilometres west of Kirkland Lake. The site covers the operations of two historic gold mines, which produced about one million ounces of the precious metal from the mid-1930s to mid-1950s. Northgate purchased the Young-Davidson property in 2005. The company has established a strong working relationship with the local Matachewan First Nation signing an impact and benefit agreement in 2009. Kirkland Lake Gold from its South Mine Complex is building on the legacy of the ground mined by five of the seven former gold operations that made Kirkland Lake famous and produced more than 24 million ounces of gold. This is the first time properties in the Kirkland Lake area have been consolidated with a single owner. The new gold miner controls the five westernmost mine sites in the Kirkland Lake mile of gold. From west to east, the mines are Macassa, Kirkland Minerals, Tech-Hughes, Lake Shore and Wright-Hargreaves. The distance from Macassa to Wright-Hargreaves is about seven kilometres. The Sylvanite Mine, which operated from 1927 to 1961 and the Toburn Mine, which operated from 1913 to 1953, lay to the east of Kirkland Lake Gold’s consolidated property. The company restored gold production in Kirkland Lake in 2005 at the former Macassa property. New exploration projects led to the discovery of additional high grade gold mineralization to the south of the main strike zone. Kirkland Lake Gold acquired the Macassa Mine and mill and four former gold producing properties in 2001. Claude Resources is making progress toward having its Madsen advanced exploration project contribute once again to the total of more than 26 million ounces of gold which have been produced in the Red Lake district. The Madsen Mine, which is located about 10 kilometres west of Red Lake, operated from 1938 to 1976 and produced more than 2.4 million ounces of gold during that period. Since taking over the Madsen property in 2008, Claude Resources has been refurbishing the hoist, shaft and headframe, preparing the mine and mill for future production and carrying out further exploration drilling to expand resources. Claude Resources has 13 employees at the Madsen site, all of whom are local, and about 15 contractors. Currently, two exploration drills are working from underground stations and one exploration drill is working from the surface. The second phase of this exploration program is to be completed by the end of 2012. Also, Rubicon Minerals Corporation is developing a new mine at an old site at its Phoenix Gold Project, also near Red Lake. Rubicon acquired control of the property in 2002 and has a bullion production target of the first quarter of 2014. Rubicon inherited infrastructure from what was known as the old McFinley Mine site. Claims were first staked on this property in 1922 and initial underground exploration took place in 1956. From 1982 to 1989, further exploration was carried out, a shaft was built, three underground levels were developed in the mine, a 150-ton-per-day mill and tailings compound were built and bulk sampling was done on a satellite target, which lies approximately 500 metres away from the eventual discovery. The headframe has been extended by 50 feet in height, the shaft deepened to 430 metres, a production scale hoist has been installed, grid power connected on site and new drifts established. Capital expenditures on the property as outlined in the Preliminary Economic Assessment (PEA) are estimated at $214 million. Current plans see the shaft extended to a depth of 610 metres and the delivery of milling equipment is expected in July of 2013. Exploration activity is expanding the mineral resources on site. Rubicon has an exploration agreement with the Lac Seul First Nation and is consulting with the Wabauskang First Nation and the Metis Nation of Ontario.
Mining: Dynamic and Dependable for Ontario’s Future
36
Miner for the Future – Building on a Major Investment When quantifying the impact of the mining industry, figures that are used, as seen earlier in this report, are, for obvious reasons, those typically currently employed in the industry, usually mine site production and engineering workers and the spending on supplies and services for an operating mine. But as is seen in the December 2007 study, “Ontario Mining: A Partner in Prosperity Building - The Economic Impacts of a ‘Representative Mine’ in Ontario”, prepared for the Ontario Mining Association by Peter Dungan and Steve Murphy the impacts of the construction of a new mine can be considerable. The following is a real world example of the impacts of such a new mine development. Detour Gold is involved in one of the most significant projects in the province, turning a former mine site into one of the largest gold mines in Canada. The mine is located 185 kilometres by road northeast of Cochrane, Ontario via Highway 652, about 10 kilometres west of the Quebec border. Detour Gold is investing roughly $1.5 billion on the project, and with mill commissioning activities for the first production line underway, it is expected that the first ore will be fed through the mill circuit before year-end, with a first gold pour seen in January 2013. The Detour Lake open pit mine is expected to produce an average of 657,000 ounces of gold annually over a period of 21.5 years. From a historical perspective, the Detour Lake deposit was discovered in 1974 by Amoco Petroleum. The mine started production in 1983 with a small open pit from 1983 to 1987 and from underground until closing in 1999. Placer Dome produced 1.8 million ounces of gold over that period at the mine.
Construction of the mining facilities started in November 2010, with more than 1,500 construction and other contract workers, as well close to 300 Detour Gold employees involved in this phase of the operation by mid-2012. In July, 2012, the major milestone of connecting the 230 kW electrical power transmission line to the Ontario power grid was accomplished. With this power supplied to the site, the full commissioning of the grinding mills moved forward so that the January 2013 operation date is indeed on target. From the acquisition of the property in 2006, it will have taken just six years for the new mine to become a reality. The company has signed agreements with local Aboriginal communities including the Wahgoshig First Nation, Taykwa Tagamou Nation, Moose Cree First Nation and the Métis Nation of Ontario.
Once operational, the mine is expected to employ from 400 to 500 people with new modern camp facilities with 400 en-suite rooms. The Detour Lake mine is designed as a year-round open pit operation. The mine facilities have been designed to minimize the footprint using state-of-the-art technology to protect the environment and animal species of the area. Detour Gold has committed to develop and operate Detour Lake to the highest environmental standards and bring long-lasting benefits to the communities in the region and to its partnerships with the local Aboriginal communities. To this end, employee hiring for the site to date has been primarily from Northern Ontario, with a focus on the Cochrane area. As well, roughly a quarter of front line employees hired to date are from First Nations communities in the general vicinity of the mine.
It is interesting to note that existing infrastructure appears to have played a role in the company being interested in the old mine site that has turned into such a key investment for the province. The close proximity to the property of an existing provincial highway made access to the property feasible. The company may not have taken a closer look at the old Detour Lake property if this basic but critical transportation corridor were not already in place. Also, while the company incurred considerable expense to build a power line to tie into the existing grid, if the tie-in to the power grid were not possible, would the project itself have been attractive?
These are interesting factors that will be top of mind in the development of the Ring of Fire: to what extent does the access to basic infrastructure, in itself, spur further development and investment?

Mining: Dynamic and Dependable for Ontario’s Future
37
The Ring Of Fire – Opportunities and Challenges
According to the Ontario Ministry of Northern Development and Mines, the Ring of Fire, located about 540 kilometres northeast of Thunder Bay and covering about 5,000 square kilometres (see Map 3), represents “one of the most significant mineral deposits discovered in Ontario in over a century with multi-generational mineral production opportunities”. Exploration companies to date have uncovered chromite, nickel, gold, iron and platinium group elements in the area. It is expected that the area could potentially yield North America’s first large-scale chromite mining operation. Chromite is a key ingredient in the production of stainless steel. Recognizing the unique opportunity the region affords, as well as the challenges that such a remote location presents (roughly 300 kilometres from the nearest road or rail line) and the number of companies involved in the area, the provincial government has named a Ring of Fire Secretariat to help move the various mining and related infrastructure projects forward. As coordinator, the Secretariat’s role is to work with other provincial ministries, the federal government, local communities including First Nations, the mining industry and other stakeholders to facilitate the development of the Ring of Fire’s massive potential. There are a number of very important policy issues related to the Ring of Fire region’s resources that will not only impact the area’s development but also define how the province is viewed as a location for future investment. Not only will environmental and Aboriginal agreements be front and centre, but decisions will need to be made in the coming years as to what provision of basic infrastructure is provided by governments, in conjunction with the mining companies, to facilitate the development of the resources in a way that is sustainable and provides maximum benefits to all involved parties. These decisions include by what means the area will be supplied and production transported. As well, given the size of the expected developments in the region and their energy requirements, questions arise as to how and in what fashion the area can be connected to the province’s power grid. Negotiations will determine who should pay what as the infrastructure improvements will not only enable the companies involved to develop their mine-sites, but also benefit Aboriginal communities in the region. At present, there are two major projects moving to development stage. Cliffs Natural Resources has announced it is committing $3.3 billion to develop its Black Thor chromite project encompassing the mine, a road to ship the ore for processing and a smelter to be built in the Sudbury area. The company estimates a total of 1,200 direct jobs will be created. At its Eagle’s Nest project, Noront Resources intends to develop nickel as well as copper and platinum reserves in a distinctive fashion. To minimize the environmental impact, it is proposing an underground mine, mill and tailings storage facility. On the surface, the only visible signs of the Eagle’s Nest project will be a year-round airstrip, a base camp, and a number of support and storage buildings, all of which will occupy less than 50 hectares. It will have one of the smallest environmental footprints of any underground mine in the world. Noront plans to recycle its entire volume of tailings underground removing the need for a surface tailings impoundment area and establishing a model mine for the future. Noront estimates their project will entail a capital investment of roughly $609 million, generating 700 construction jobs and 300 ongoing jobs. The estimates for the types and extent of the commodities that exist in the Ring of Fire mean these projects will be just two of many, if all sectors cooperate to make it happen.
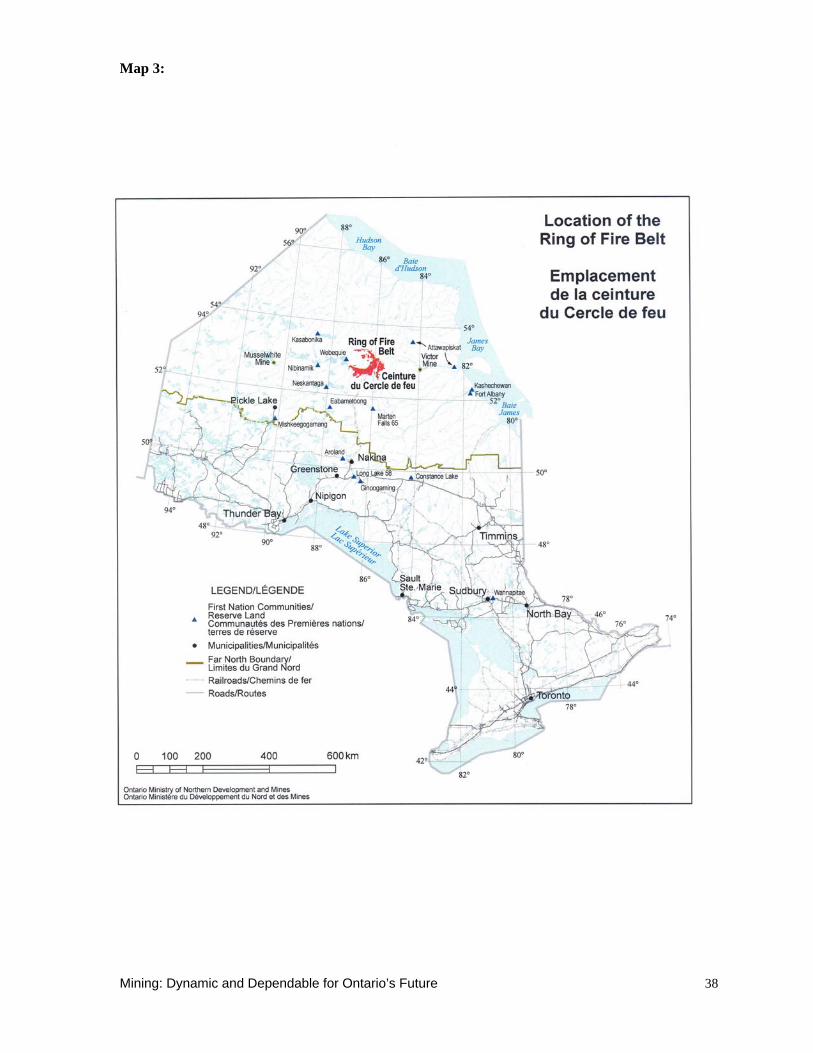
Mining: Dynamic and Dependable for Ontario’s Future
38
Map 3:
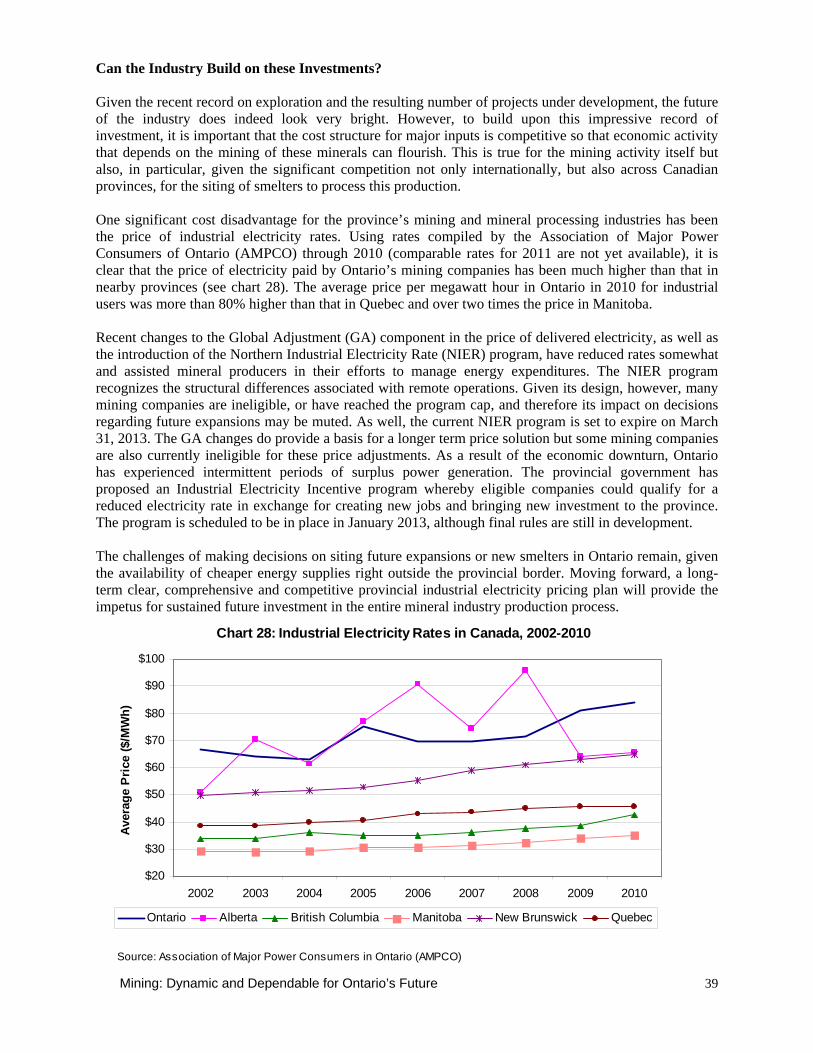
Mining: Dynamic and Dependable for Ontario’s Future
39
Can the Industry Build on these Investments? Given the recent record on exploration and the resulting number of projects under development, the future of the industry does indeed look very bright. However, to build upon this impressive record of investment, it is important that the cost structure for major inputs is competitive so that economic activity that depends on the mining of these minerals can flourish. This is true for the mining activity itself but also, in particular, given the significant competition not only internationally, but also across Canadian provinces, for the siting of smelters to process this production. One significant cost disadvantage for the province’s mining and mineral processing industries has been the price of industrial electricity rates. Using rates compiled by the Association of Major Power Consumers of Ontario (AMPCO) through 2010 (comparable rates for 2011 are not yet available), it is clear that the price of electricity paid by Ontario’s mining companies has been much higher than that in nearby provinces (see chart 28). The average price per megawatt hour in Ontario in 2010 for industrial users was more than 80% higher than that in Quebec and over two times the price in Manitoba. Recent changes to the Global Adjustment (GA) component in the price of delivered electricity, as well as the introduction of the Northern Industrial Electricity Rate (NIER) program, have reduced rates somewhat and assisted mineral producers in their efforts to manage energy expenditures. The NIER program recognizes the structural differences associated with remote operations. Given its design, however, many mining companies are ineligible, or have reached the program cap, and therefore its impact on decisions regarding future expansions may be muted. As well, the current NIER program is set to expire on March 31, 2013. The GA changes do provide a basis for a longer term price solution but some mining companies are also currently ineligible for these price adjustments. As a result of the economic downturn, Ontario has experienced intermittent periods of surplus power generation. The provincial government has proposed an Industrial Electricity Incentive program whereby eligible companies could qualify for a reduced electricity rate in exchange for creating new jobs and bringing new investment to the province. The program is scheduled to be in place in January 2013, although final rules are still in development. The challenges of making decisions on siting future expansions or new smelters in Ontario remain, given the availability of cheaper energy supplies right outside the provincial border. Moving forward, a long-term clear, comprehensive and competitive provincial industrial electricity pricing plan will provide the impetus for sustained future investment in the entire mineral industry production process.
Chart 28: Industrial Electricity Rates in Canada, 2002-2010
$20
$30
$40
$50
$60
$70
$80
$90
$100
2002 2003 2004 2005 2006 2007 2008 2009 2010
Aver
age
Pri
ce ($
/MW
h)
Ontario Alberta British Columbia Manitoba New Brunswick Quebec
Source: Association of Major Power Consumers in Ontario (AMPCO)
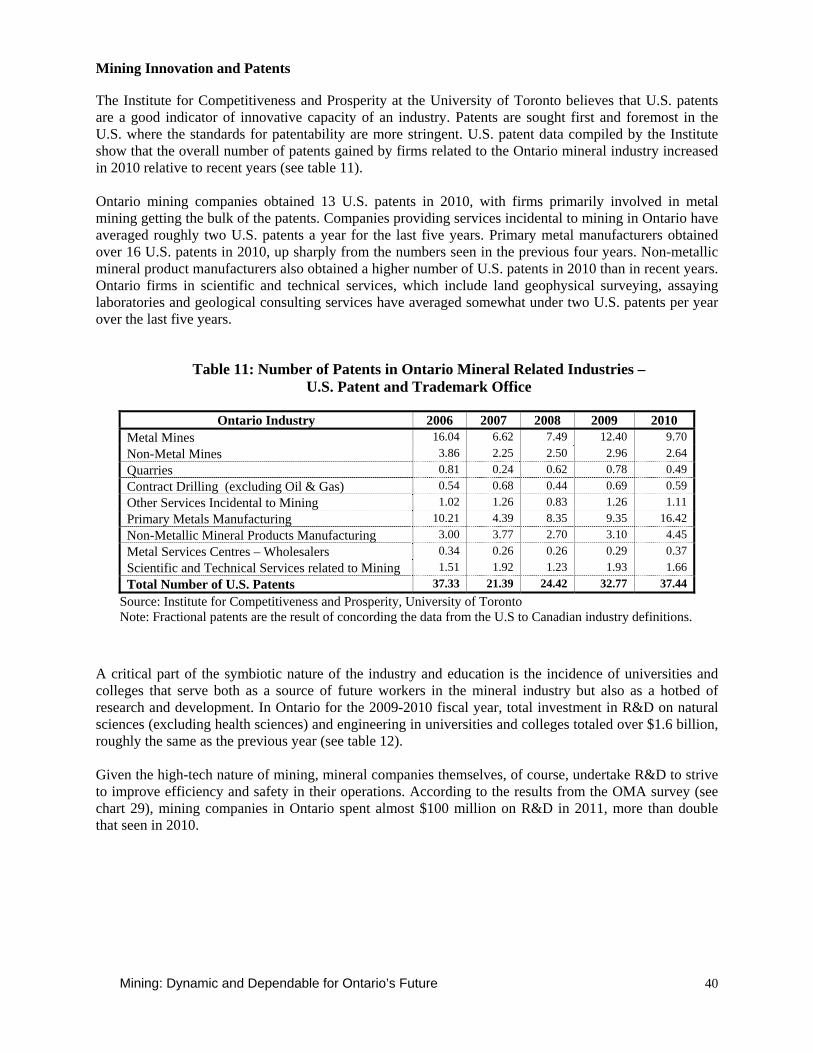
Mining: Dynamic and Dependable for Ontario’s Future
40
Mining Innovation and Patents The Institute for Competitiveness and Prosperity at the University of Toronto believes that U.S. patents are a good indicator of innovative capacity of an industry. Patents are sought first and foremost in the U.S. where the standards for patentability are more stringent. U.S. patent data compiled by the Institute show that the overall number of patents gained by firms related to the Ontario mineral industry increased in 2010 relative to recent years (see table 11). Ontario mining companies obtained 13 U.S. patents in 2010, with firms primarily involved in metal mining getting the bulk of the patents. Companies providing services incidental to mining in Ontario have averaged roughly two U.S. patents a year for the last five years. Primary metal manufacturers obtained over 16 U.S. patents in 2010, up sharply from the numbers seen in the previous four years. Non-metallic mineral product manufacturers also obtained a higher number of U.S. patents in 2010 than in recent years. Ontario firms in scientific and technical services, which include land geophysical surveying, assaying laboratories and geological consulting services have averaged somewhat under two U.S. patents per year over the last five years.
Table 11: Number of Patents in Ontario Mineral Related Industries – U.S. Patent and Trademark Office
Ontario Industry 2006 2007 2008 2009 2010
Metal Mines 16.04 6.62 7.49 12.40 9.70 Non-Metal Mines 3.86 2.25 2.50 2.96 2.64 Quarries 0.81 0.24 0.62 0.78 0.49 Contract Drilling (excluding Oil & Gas) 0.54 0.68 0.44 0.69 0.59 Other Services Incidental to Mining 1.02 1.26 0.83 1.26 1.11 Primary Metals Manufacturing 10.21 4.39 8.35 9.35 16.42 Non-Metallic Mineral Products Manufacturing 3.00 3.77 2.70 3.10 4.45 Metal Services Centres – Wholesalers 0.34 0.26 0.26 0.29 0.37 Scientific and Technical Services related to Mining 1.51 1.92 1.23 1.93 1.66 Total Number of U.S. Patents 37.33 21.39 24.42 32.77 37.44
Source: Institute for Competitiveness and Prosperity, University of Toronto Note: Fractional patents are the result of concording the data from the U.S to Canadian industry definitions.
A critical part of the symbiotic nature of the industry and education is the incidence of universities and colleges that serve both as a source of future workers in the mineral industry but also as a hotbed of research and development. In Ontario for the 2009-2010 fiscal year, total investment in R&D on natural sciences (excluding health sciences) and engineering in universities and colleges totaled over $1.6 billion, roughly the same as the previous year (see table 12). Given the high-tech nature of mining, mineral companies themselves, of course, undertake R&D to strive to improve efficiency and safety in their operations. According to the results from the OMA survey (see chart 29), mining companies in Ontario spent almost $100 million on R&D in 2011, more than double that seen in 2010.

Mining: Dynamic and Dependable for Ontario’s Future
41
Table 12: Estimated Investment in R&D in the Higher Education Sector – on Natural Sciences (excluding Health Sciences) and Engineering, by Province, 2003-2004 to
2009-2010 (millions of dollars)
Province 2003-2004 2004-2005 2005-2006 2006-2007 2007-2008 2008-2009 2009-2010 Newf. & Lab 48.9 49.6 62.1 56.2 60.9 60.2 64.7PEI 14.9 13.7 15.3 17.5 21.2 20.7 23.6Nova Scotia 93.9 99.4 113.9 119.5 125.9 128.5 127.4New Brunswick 69.0 64.5 73.5 77.5 84.3 86.0 90.6Quebec 1,014.2 1,060.3 1,095.2 1,075.2 1,088.4 1,113.1 1,100.7Ontario 1,269.4 1,446.8 1,478.8 1,552.7 1,585.3 1,647.6 1,637.0Manitoba 101.5 109.2 121.5 120.4 129.8 125.5 130.5Saskatchewan 131.5 133.8 112.5 113.2 125.4 166.7 167.6Alberta 353.6 378.1 398.8 382.0 427.8 479.4 510.4BC 360.8 339.6 388.1 421.0 462.5 509.2 517.3Canada 3,457.7 3,695.1 3,859.7 3,933.3 4,111.5 4,337.0 4,369.8
Source: Statistics Canada Catalogue #88-001 and authors’ calculations
Chart 29: Ontario Mining Industry Research & Development Spending
$47.8
$99.7
$0
$20
$40
$60
$80
$100
$120
2010 2011
$ M
illio
ns
Source: OMA Industry Survey
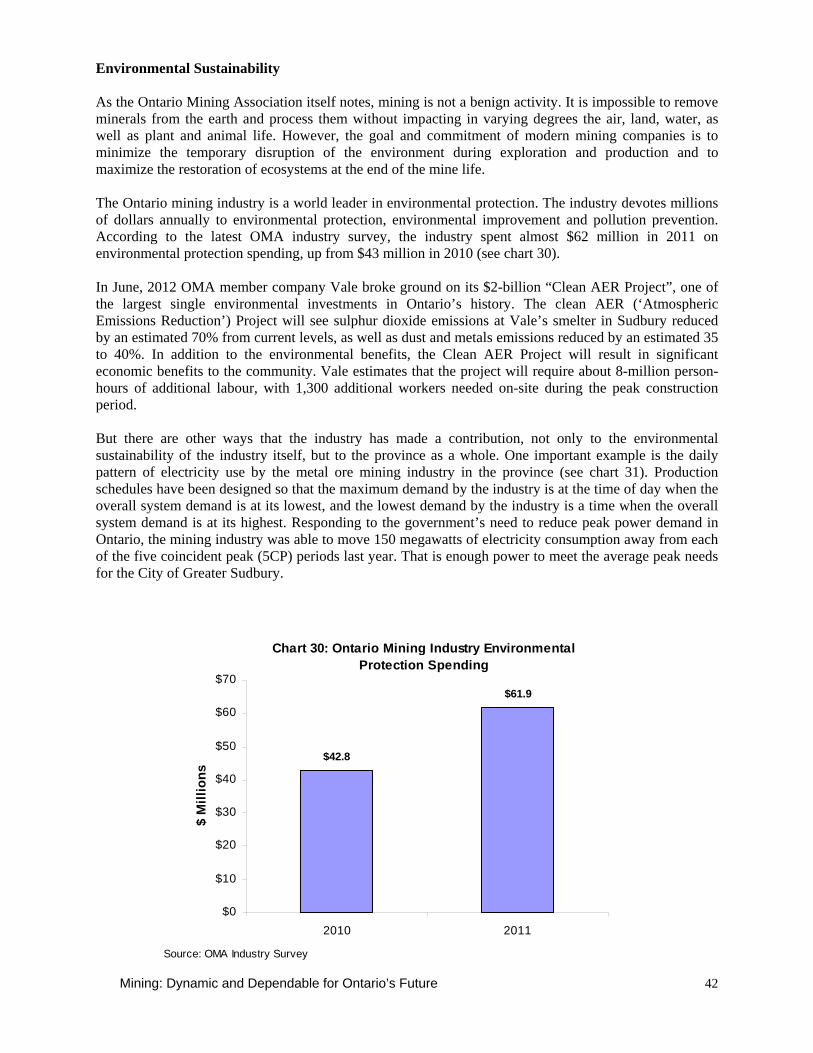
Mining: Dynamic and Dependable for Ontario’s Future
42
Environmental Sustainability As the Ontario Mining Association itself notes, mining is not a benign activity. It is impossible to remove minerals from the earth and process them without impacting in varying degrees the air, land, water, as well as plant and animal life. However, the goal and commitment of modern mining companies is to minimize the temporary disruption of the environment during exploration and production and to maximize the restoration of ecosystems at the end of the mine life. The Ontario mining industry is a world leader in environmental protection. The industry devotes millions of dollars annually to environmental protection, environmental improvement and pollution prevention. According to the latest OMA industry survey, the industry spent almost $62 million in 2011 on environmental protection spending, up from $43 million in 2010 (see chart 30). In June, 2012 OMA member company Vale broke ground on its $2-billion “Clean AER Project”, one of the largest single environmental investments in Ontario’s history. The clean AER (‘Atmospheric Emissions Reduction’) Project will see sulphur dioxide emissions at Vale’s smelter in Sudbury reduced by an estimated 70% from current levels, as well as dust and metals emissions reduced by an estimated 35 to 40%. In addition to the environmental benefits, the Clean AER Project will result in significant economic benefits to the community. Vale estimates that the project will require about 8-million person-hours of additional labour, with 1,300 additional workers needed on-site during the peak construction period. But there are other ways that the industry has made a contribution, not only to the environmental sustainability of the industry itself, but to the province as a whole. One important example is the daily pattern of electricity use by the metal ore mining industry in the province (see chart 31). Production schedules have been designed so that the maximum demand by the industry is at the time of day when the overall system demand is at its lowest, and the lowest demand by the industry is a time when the overall system demand is at its highest. Responding to the government’s need to reduce peak power demand in Ontario, the mining industry was able to move 150 megawatts of electricity consumption away from each of the five coincident peak (5CP) periods last year. That is enough power to meet the average peak needs for the City of Greater Sudbury.
Chart 30: Ontario Mining Industry Environmental Protection Spending
$42.8
$61.9
$0
$10
$20
$30
$40
$50
$60
$70
2010 2011
$ M
illio
ns
Source: OMA Industry Survey

Mining: Dynamic and Dependable for Ontario’s Future
43
Chart 31: 2011 Daily Load Profile for the Ontario Metal Ore Mining Industry and Total Provincial Demand
350
360
370
380
390
400
410
420
430
440
450
1 2 3 4 5 6 7 8 9 10 11 12 13 14 15 16 17 18 19 20 21 22 23 2410,000
11,000
12,000
13,000
14,000
15,000
16,000
17,000
18,000
19,000
20,000
System Average Demand (MW) Metal Ore Mining Average Demand (MW)
System (MW)
Metal Ore Mining (MW)
Source: Association of Major Pow er Consumers in Ontario (AMPCO)
Hours of the Day
The investments by the mining industry to improve its environmental footprint, which builds upon its investment on health and safety training of its employees, are not reflected in measured output or productivity for the industry. The societal benefits of this spending, however, can not be overlooked.
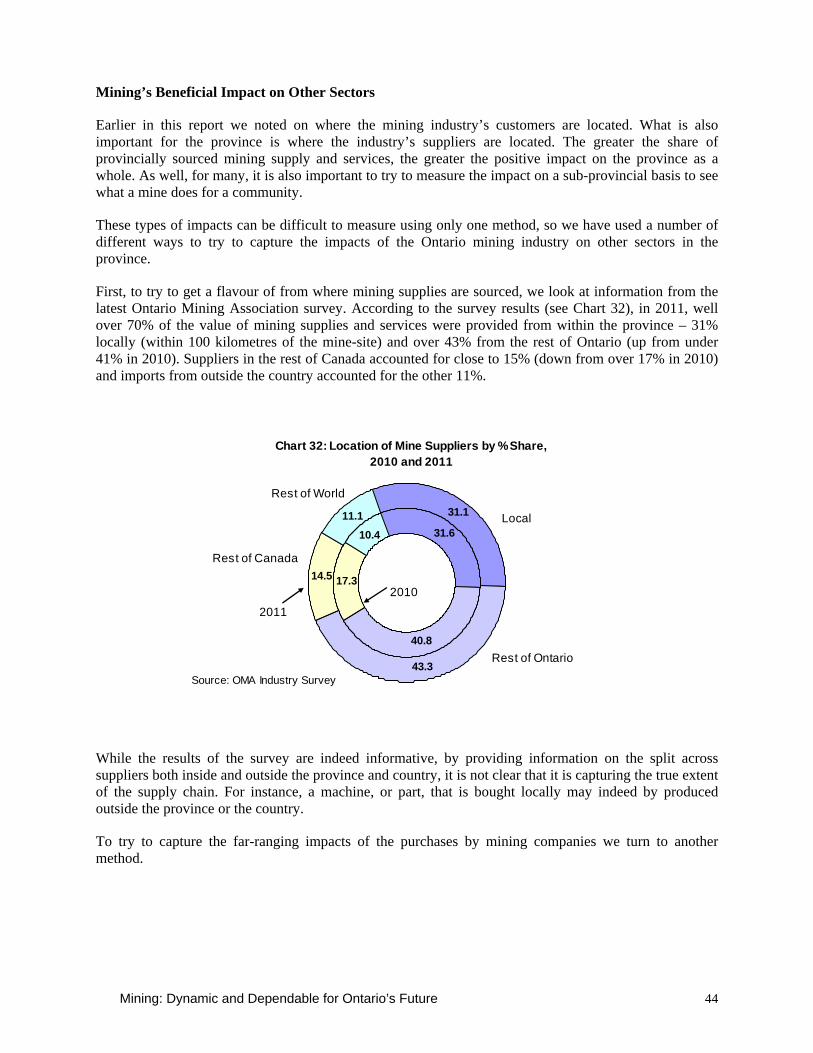
Mining: Dynamic and Dependable for Ontario’s Future 44
Mining’s Beneficial Impact on Other Sectors
Earlier in this report we noted on where the mining industry’s customers are located. What is also important for the province is where the industry’s suppliers are located. The greater the share of provincially sourced mining supply and services, the greater the positive impact on the province as a whole. As well, for many, it is also important to try to measure the impact on a sub-provincial basis to see what a mine does for a community.
These types of impacts can be difficult to measure using only one method, so we have used a number of different ways to try to capture the impacts of the Ontario mining industry on other sectors in the province.
First, to try to get a flavour of from where mining supplies are sourced, we look at information from the latest Ontario Mining Association survey. According to the survey results (see Chart 32), in 2011, well over 70% of the value of mining supplies and services were provided from within the province – 31% locally (within 100 kilometres of the mine-site) and over 43% from the rest of Ontario (up from under 41% in 2010). Suppliers in the rest of Canada accounted for close to 15% (down from over 17% in 2010) and imports from outside the country accounted for the other 11%.
Chart 32: Location of Mine Suppliers by % Share, 2010 and 2011
31.6
40.8
17.3
10.4
31.1
43.3
14.5
11.1
2010
Local
Rest of Ontario
2011
Source: OMA Industry Survey
Rest of Canada
Rest of World
While the results of the survey are indeed informative, by providing information on the split across suppliers both inside and outside the province and country, it is not clear that it is capturing the true extent of the supply chain. For instance, a machine, or part, that is bought locally may indeed by produced outside the province or the country.
To try to capture the far-ranging impacts of the purchases by mining companies we turn to another method.
Mining: Dynamic and Dependable for Ontario’s Future 45
In order to estimate and analyze these upstream linkages, we have used survey data and information from the various mining supply industry associations. But the impacts are broad and may not always be fully captured by these techniques, so to shed further light on these important linkages we have also employed an additional method, termed ‘input-output’ analysis, based on most up-to-date version of the Input-Output (I-O) data system and models maintained by Statistics Canada. This technique comprised part of the tool kit used in the Peter Dungan and Steve Murphy 2007 study for the OMA of the economic impact of a ‘representative’ mine in Ontario “Ontario Mining: A Partner in Prosperity Building – The Economic Impacts of a ‘Representative Mine’ in Ontario” and earlier in the 1997 Peter Dungan book, Rock Solid: The Impact of the Mining and Primary Metals Industries on the Canadian Economy.
An extremely important and widespread route by which mining in Ontario adds to the provincial economy is through upstream or backward linkages. Upstream or backward linkages are all the various input requirements for mining production, and the inputs required to produce these inputs, and so on back up the production chain. At each stage, economic activity is generated, persons are employed and taxes are paid that are all directly related to mining operations, even if they seem to be considerably removed from the mine (and mining-type activity) itself. For example, operating a mine requires fuel and power of various sorts, which must be produced and transported to the mine. Mining operation requires continual upkeep and repair that needs various manufactured goods to be produced and transported. A major industry such as mining requires a host of business, scientific and professional services – many of which will be provided by business enterprises well away from the mine site.
While the results from the I-O system are in many ways more comprehensive and complete than survey results, there is a drawback. Only province wide results are possible; we cannot examine upstream linkages in various regions of the province. As a partial offset, however, the I-O system automatically yields upstream linkages for other provinces and the nation as a whole when calculating Ontario linkages.
Because of how Statistics Canada defines industries and economic activity in the I-O system, we limit our analysis to looking at the impacts of the production activities of Ontario mining only – not mineral exploration, mine opening or development, or the processing of mineral products. While we recognize that this does not capture some of the important “downstream” impacts of the mining industry, it is the most sensible I-O run to try to capture the impacts of the Ontario mining industry on its wide range of suppliers.
The impacts are calculated based on a $1 billion of output reflecting the type of production in the Ontario mining sector as constituted by the membership of the Ontario Mining Association in 2011. Using this level of output makes the results easily ‘scalable’ – if one wants to look at the impact of $5 billion of production, then the results from this study can be multiplied by five. From Chart 33, one can see that just over 48% of the production is from copper, nickel, and zinc mining, with another 30% from gold and silver ore production, and a further 8% from other metallic minerals. The production of salt accounts for almost 6% of production, with diamonds at just over 5% and other non-metallic minerals at 3%.
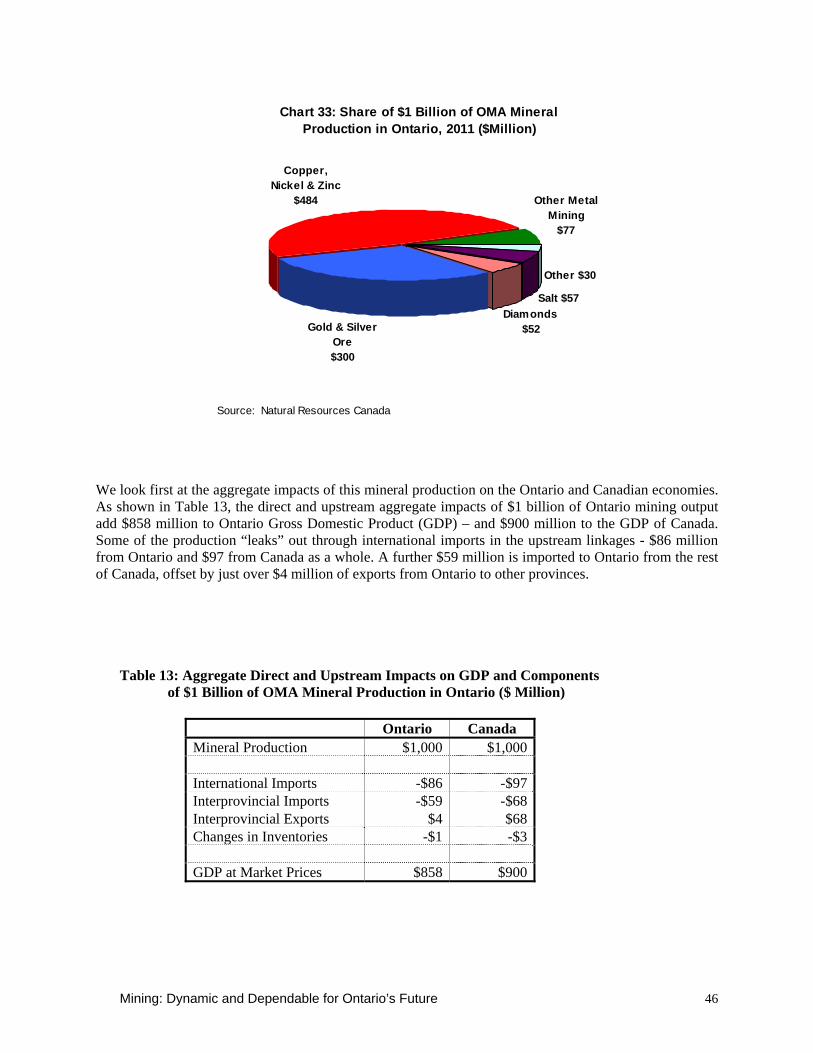
Mining: Dynamic and Dependable for Ontario’s Future 46
Chart 33: Share of $1 Billion of OMA Mineral Production in Ontario, 2011 ($Million)
Diamonds $52
Salt $57
Other $30
Other Metal Mining
$77
Copper, Nickel & Zinc
$484
Gold & Silver Ore$300
Source: Natural Resources Canada
We look first at the aggregate impacts of this mineral production on the Ontario and Canadian economies. As shown in Table 13, the direct and upstream aggregate impacts of $1 billion of Ontario mining output add $858 million to Ontario Gross Domestic Product (GDP) – and $900 million to the GDP of Canada. Some of the production “leaks” out through international imports in the upstream linkages - $86 million from Ontario and $97 from Canada as a whole. A further $59 million is imported to Ontario from the rest of Canada, offset by just over $4 million of exports from Ontario to other provinces.
Table 13: Aggregate Direct and Upstream Impacts on GDP and Components of $1 Billion of OMA Mineral Production in Ontario ($ Million)
Ontario Canada Mineral Production $1,000 $1,000 International Imports -$86 -$97Interprovincial Imports -$59 -$68Interprovincial Exports $4 $68Changes in Inventories -$1 -$3 GDP at Market Prices $858 $900
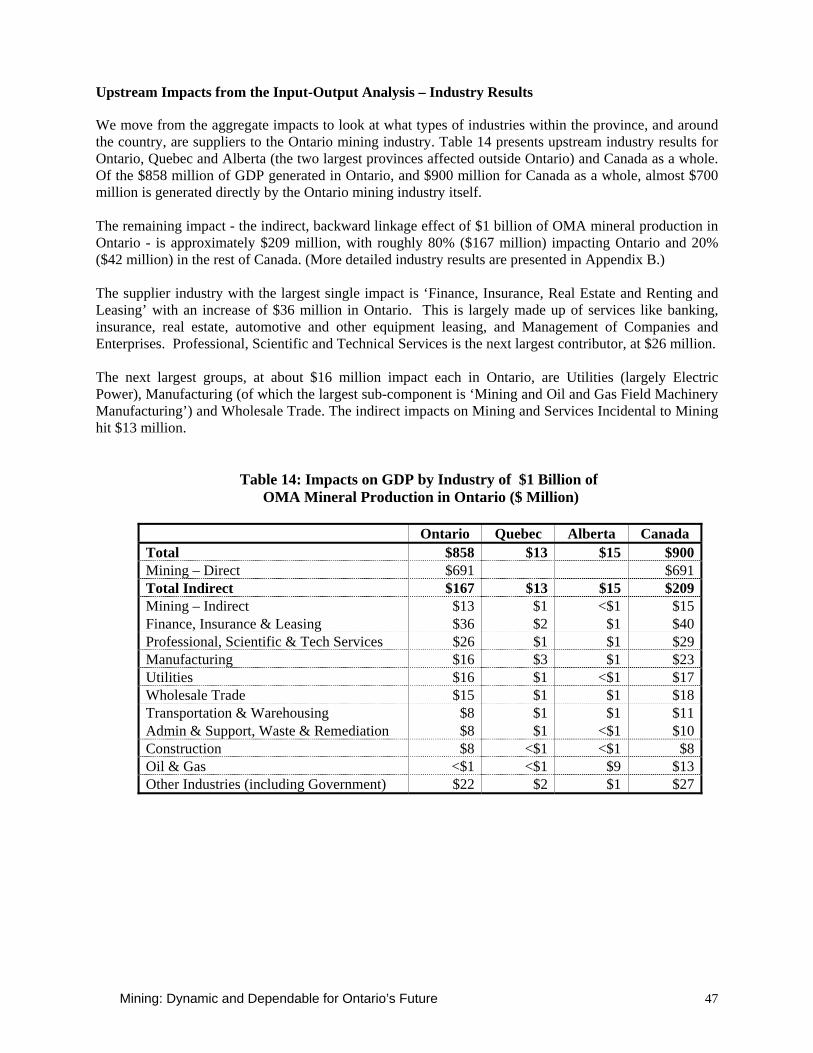
Mining: Dynamic and Dependable for Ontario’s Future 47
Upstream Impacts from the Input-Output Analysis – Industry Results
We move from the aggregate impacts to look at what types of industries within the province, and around the country, are suppliers to the Ontario mining industry. Table 14 presents upstream industry results for Ontario, Quebec and Alberta (the two largest provinces affected outside Ontario) and Canada as a whole. Of the $858 million of GDP generated in Ontario, and $900 million for Canada as a whole, almost $700 million is generated directly by the Ontario mining industry itself. The remaining impact - the indirect, backward linkage effect of $1 billion of OMA mineral production in Ontario - is approximately $209 million, with roughly 80% ($167 million) impacting Ontario and 20% ($42 million) in the rest of Canada. (More detailed industry results are presented in Appendix B.) The supplier industry with the largest single impact is ‘Finance, Insurance, Real Estate and Renting and Leasing’ with an increase of $36 million in Ontario. This is largely made up of services like banking, insurance, real estate, automotive and other equipment leasing, and Management of Companies and Enterprises. Professional, Scientific and Technical Services is the next largest contributor, at $26 million. The next largest groups, at about $16 million impact each in Ontario, are Utilities (largely Electric Power), Manufacturing (of which the largest sub-component is ‘Mining and Oil and Gas Field Machinery Manufacturing’) and Wholesale Trade. The indirect impacts on Mining and Services Incidental to Mining hit $13 million.
Table 14: Impacts on GDP by Industry of $1 Billion of OMA Mineral Production in Ontario ($ Million)
Ontario Quebec Alberta Canada
Total $858 $13 $15 $900Mining – Direct $691 $691Total Indirect $167 $13 $15 $209Mining – Indirect $13 $1 <$1 $15Finance, Insurance & Leasing $36 $2 $1 $40Professional, Scientific & Tech Services $26 $1 $1 $29Manufacturing $16 $3 $1 $23Utilities $16 $1 <$1 $17Wholesale Trade $15 $1 $1 $18Transportation & Warehousing $8 $1 $1 $11Admin & Support, Waste & Remediation $8 $1 <$1 $10Construction $8 <$1 <$1 $8Oil & Gas <$1 <$1 $9 $13Other Industries (including Government) $22 $2 $1 $27

Mining: Dynamic and Dependable for Ontario’s Future 48
Upstream Impacts from the Input-Output Analysis – Employment Results
This mineral production, of course, also has important impacts on employment in the province and the country. The I-O analysis indicates that $1 billion of OMA mining output in Ontario generates 4,418 jobs directly and in upstream production in the province, and 4,775 in Canada as a whole. Table 15 presents aggregated upstream employment results for Ontario, the two largest provinces affected outside Ontario, and Canada as a whole. What is clear from the table is that the mining sector has important linkages to all sectors of the Ontario, and indeed Canadian economy, with important contributions from the service sector. The direct employment impact in Ontario of $1 billion of this mining output is 2,421 jobs with another 2,000 created indirectly. For the country as a whole more than 2,350 jobs result upstream from this level of mining output in Ontario. The largest single impact is for the Professional, Scientific and Technical Services sector with 367 jobs in Ontario and 409 for Canada. The next biggest supplier sector is the ‘Finance, Insurance, Real Estate and Renting and Leasing’ where for every $1 billion in OMA mineral production in Ontario, almost 300 jobs in Ontario and another 33 in the rest of Canada are created. (Employment impacts for more industries are reported in Appendix B.) There are also important employment impacts in both Ontario, and the country as a whole, in ‘Administrative Support, Waste Management and Remediation Services’ (215 jobs in Ontario, 36 in the rest of Canada), Wholesale Trade, Manufacturing (of which the largest sub-component is ‘Mining and Oil and Gas Field Machinery Manufacturing’), Services Incidental to Mining, Construction, Transportation and Warehousing and Utilities (largely Electric Power).
Table 15: Direct and Indirect Impacts on Employment by Industry of $1 Billion of OMA Mineral Production in Ontario
Ontario Quebec Alberta Canada
Total 4,418 176 68 4,775Mining – Direct 2,421 2,421Total Indirect 1,997 176 68 2,354 Mining – Indirect 139 11 <1 152 Professional, Scientific & Tech Services 367 22 8 409 Finance, Insurance & Leasing 299 16 7 332 Admin & Support, Waste & Remediation 215 22 6 251 Wholesale Trade 165 19 5 200 Manufacturing 158 35 8 220 Construction 119 1 1 123 Transportation & Warehousing 101 15 7 141 Utilities 58 3 <1 62 Oil & Gas 1 <1 9 11 Other Industries (including Government) 376 33 18 453

Mining: Dynamic and Dependable for Ontario’s Future 49
Upstream Impacts from the Input-Output Analysis – Foreign Leakages
As indicated earlier, some of the suppliers to the mining industry are, not surprisingly, from outside the country. Details on international “leakages” that occur from mining production in Ontario are shown in Table 16. The table shows that to produce $1 billion in Ontario mining output, $15 million in machinery & equipment is imported from abroad. Chemicals and Chemical Products imports amount to $12 million, while Business and Computer Services come to $7 million. There are smaller but still important leakages from mineral fuels, electrical products, as well as a host of other products. (A more detailed table is provided in Appendix B.) Some of these leakages offer potential opportunities to domestic suppliers in supplanting imports with more locally-responsive inputs.
Table 16: Impacts on International Imports into Ontario of $1 Billion of OMA Mineral Production in Ontario ($ Million)
Imports
Total $86Machinery & Equipment $15Chemicals & Chemical Products $12Business & Computer Services $7Mineral Fuels $7Electrical, Electronic & Communication Products $5Motor Vehicle & Transportation Equipment $5Other Finance, Insurance & Leasing $5Primary Metal Products $4Leather, Rubber & Plastic Products $3Transport & Storage $3Accommodation Services & Meals $3Petroleum & Coal Products $2Services Incidental to Mining $2Other $13
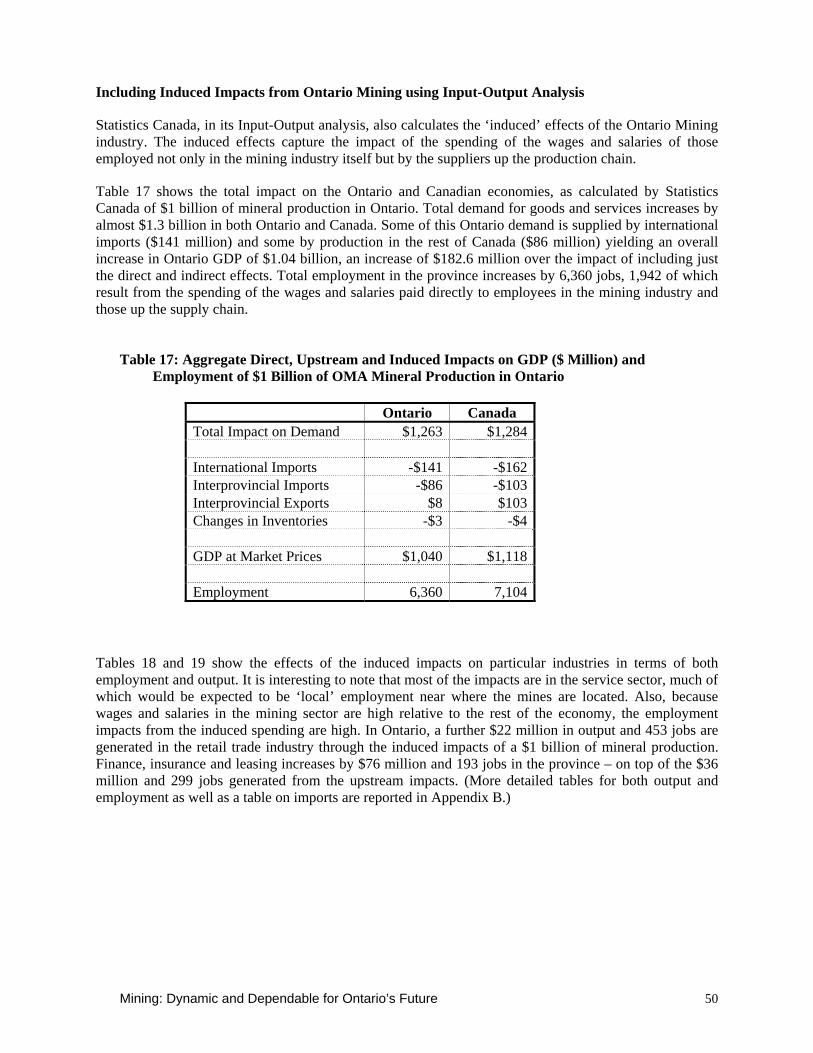
Mining: Dynamic and Dependable for Ontario’s Future 50
Including Induced Impacts from Ontario Mining using Input-Output Analysis
Statistics Canada, in its Input-Output analysis, also calculates the ‘induced’ effects of the Ontario Mining industry. The induced effects capture the impact of the spending of the wages and salaries of those employed not only in the mining industry itself but by the suppliers up the production chain.
Table 17 shows the total impact on the Ontario and Canadian economies, as calculated by Statistics Canada of $1 billion of mineral production in Ontario. Total demand for goods and services increases by almost $1.3 billion in both Ontario and Canada. Some of this Ontario demand is supplied by international imports ($141 million) and some by production in the rest of Canada ($86 million) yielding an overall increase in Ontario GDP of $1.04 billion, an increase of $182.6 million over the impact of including just the direct and indirect effects. Total employment in the province increases by 6,360 jobs, 1,942 of which result from the spending of the wages and salaries paid directly to employees in the mining industry and those up the supply chain.
Table 17: Aggregate Direct, Upstream and Induced Impacts on GDP ($ Million) and Employment of $1 Billion of OMA Mineral Production in Ontario
Tables 18 and 19 show the effects of the induced impacts on particular industries in terms of both employment and output. It is interesting to note that most of the impacts are in the service sector, much of which would be expected to be ‘local’ employment near where the mines are located. Also, because wages and salaries in the mining sector are high relative to the rest of the economy, the employment impacts from the induced spending are high. In Ontario, a further $22 million in output and 453 jobs are generated in the retail trade industry through the induced impacts of a $1 billion of mineral production. Finance, insurance and leasing increases by $76 million and 193 jobs in the province – on top of the $36 million and 299 jobs generated from the upstream impacts. (More detailed tables for both output and employment as well as a table on imports are reported in Appendix B.)
Ontario Canada Total Impact on Demand $1,263 $1,284 International Imports -$141 -$162Interprovincial Imports -$86 -$103Interprovincial Exports $8 $103Changes in Inventories -$3 -$4 GDP at Market Prices $1,040 $1,118 Employment 6,360 7,104
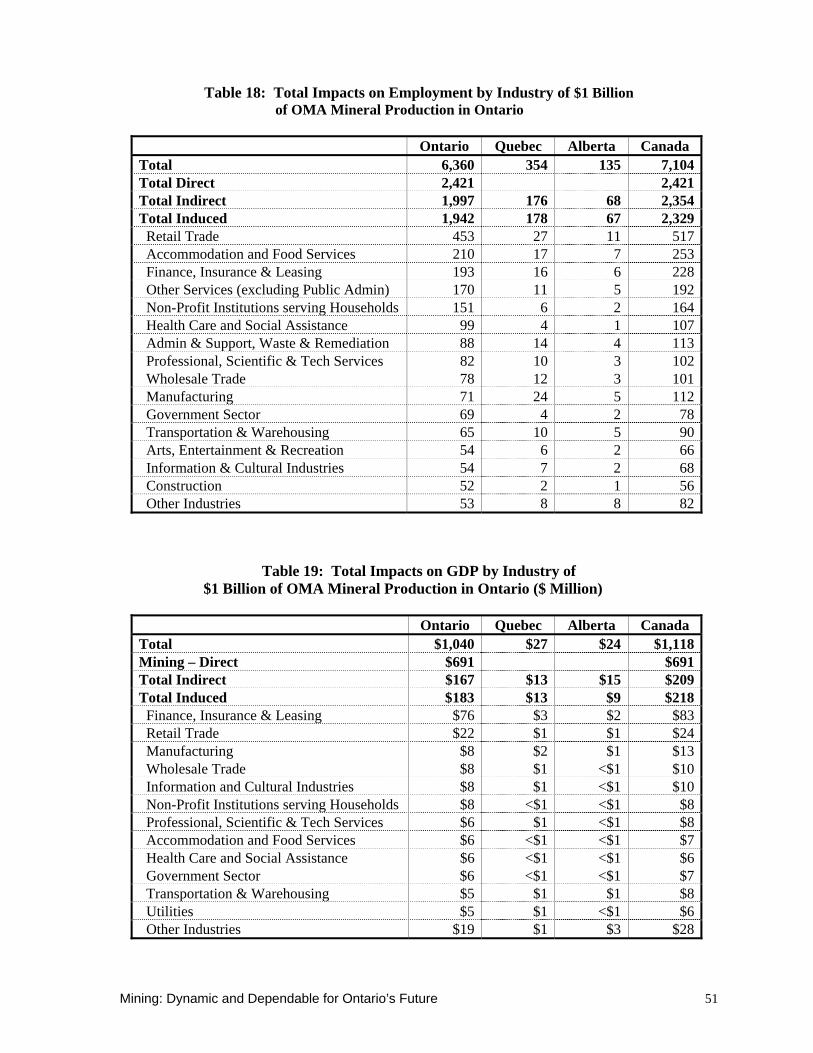
Mining: Dynamic and Dependable for Ontario’s Future 51
Table 18: Total Impacts on Employment by Industry of $1 Billion of OMA Mineral Production in Ontario
Ontario Quebec Alberta Canada
Total 6,360 354 135 7,104Total Direct 2,421 2,421Total Indirect 1,997 176 68 2,354Total Induced 1,942 178 67 2,329 Retail Trade 453 27 11 517 Accommodation and Food Services 210 17 7 253 Finance, Insurance & Leasing 193 16 6 228 Other Services (excluding Public Admin) 170 11 5 192 Non-Profit Institutions serving Households 151 6 2 164 Health Care and Social Assistance 99 4 1 107 Admin & Support, Waste & Remediation 88 14 4 113 Professional, Scientific & Tech Services 82 10 3 102 Wholesale Trade 78 12 3 101 Manufacturing 71 24 5 112 Government Sector 69 4 2 78 Transportation & Warehousing 65 10 5 90 Arts, Entertainment & Recreation 54 6 2 66 Information & Cultural Industries 54 7 2 68 Construction 52 2 1 56 Other Industries 53 8 8 82
Table 19: Total Impacts on GDP by Industry of $1 Billion of OMA Mineral Production in Ontario ($ Million)
Ontario Quebec Alberta Canada
Total $1,040 $27 $24 $1,118Mining – Direct $691 $691Total Indirect $167 $13 $15 $209Total Induced $183 $13 $9 $218 Finance, Insurance & Leasing $76 $3 $2 $83 Retail Trade $22 $1 $1 $24 Manufacturing $8 $2 $1 $13 Wholesale Trade $8 $1 <$1 $10 Information and Cultural Industries $8 $1 <$1 $10 Non-Profit Institutions serving Households $8 <$1 <$1 $8 Professional, Scientific & Tech Services $6 $1 <$1 $8 Accommodation and Food Services $6 <$1 <$1 $7 Health Care and Social Assistance $6 <$1 <$1 $6 Government Sector $6 <$1 <$1 $7 Transportation & Warehousing $5 $1 $1 $8 Utilities $5 $1 <$1 $6 Other Industries $19 $1 $3 $28
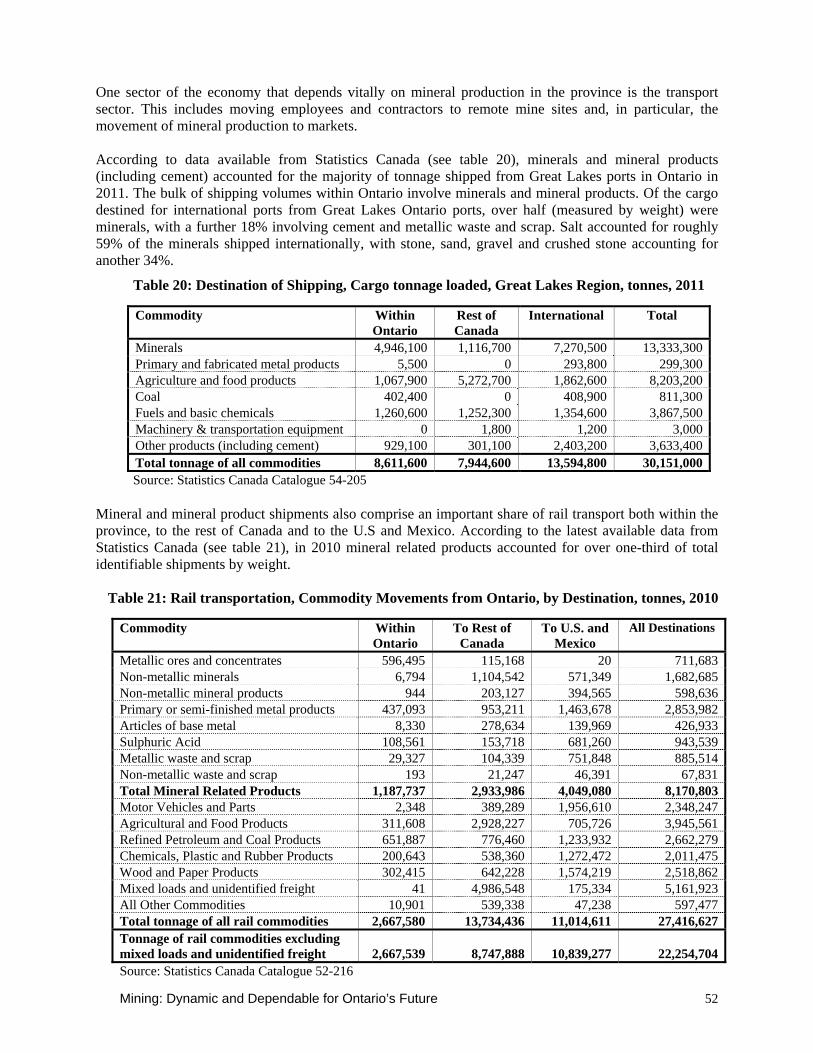
Mining: Dynamic and Dependable for Ontario’s Future 52
One sector of the economy that depends vitally on mineral production in the province is the transport sector. This includes moving employees and contractors to remote mine sites and, in particular, the movement of mineral production to markets. According to data available from Statistics Canada (see table 20), minerals and mineral products (including cement) accounted for the majority of tonnage shipped from Great Lakes ports in Ontario in 2011. The bulk of shipping volumes within Ontario involve minerals and mineral products. Of the cargo destined for international ports from Great Lakes Ontario ports, over half (measured by weight) were minerals, with a further 18% involving cement and metallic waste and scrap. Salt accounted for roughly 59% of the minerals shipped internationally, with stone, sand, gravel and crushed stone accounting for another 34%.
Table 20: Destination of Shipping, Cargo tonnage loaded, Great Lakes Region, tonnes, 2011
Source: Statistics Canada Catalogue 54-205
Mineral and mineral product shipments also comprise an important share of rail transport both within the province, to the rest of Canada and to the U.S and Mexico. According to the latest available data from Statistics Canada (see table 21), in 2010 mineral related products accounted for over one-third of total identifiable shipments by weight.
Table 21: Rail transportation, Commodity Movements from Ontario, by Destination, tonnes, 2010
Source: Statistics Canada Catalogue 52-216
Commodity Within Ontario
Rest of Canada
International Total
Minerals 4,946,100 1,116,700 7,270,500 13,333,300Primary and fabricated metal products 5,500 0 293,800 299,300Agriculture and food products 1,067,900 5,272,700 1,862,600 8,203,200Coal 402,400 0 408,900 811,300Fuels and basic chemicals 1,260,600 1,252,300 1,354,600 3,867,500Machinery & transportation equipment 0 1,800 1,200 3,000Other products (including cement) 929,100 301,100 2,403,200 3,633,400Total tonnage of all commodities 8,611,600 7,944,600 13,594,800 30,151,000
Commodity
Within Ontario
To Rest of Canada
To U.S. and Mexico
All Destinations
Metallic ores and concentrates 596,495 115,168 20 711,683Non-metallic minerals 6,794 1,104,542 571,349 1,682,685Non-metallic mineral products 944 203,127 394,565 598,636Primary or semi-finished metal products 437,093 953,211 1,463,678 2,853,982Articles of base metal 8,330 278,634 139,969 426,933Sulphuric Acid 108,561 153,718 681,260 943,539Metallic waste and scrap 29,327 104,339 751,848 885,514Non-metallic waste and scrap 193 21,247 46,391 67,831Total Mineral Related Products 1,187,737 2,933,986 4,049,080 8,170,803Motor Vehicles and Parts 2,348 389,289 1,956,610 2,348,247Agricultural and Food Products 311,608 2,928,227 705,726 3,945,561Refined Petroleum and Coal Products 651,887 776,460 1,233,932 2,662,279Chemicals, Plastic and Rubber Products 200,643 538,360 1,272,472 2,011,475Wood and Paper Products 302,415 642,228 1,574,219 2,518,862Mixed loads and unidentified freight 41 4,986,548 175,334 5,161,923All Other Commodities 10,901 539,338 47,238 597,477Total tonnage of all rail commodities 2,667,580 13,734,436 11,014,611 27,416,627Tonnage of rail commodities excluding mixed loads and unidentified freight 2,667,539 8,747,888
10,839,277 22,254,704
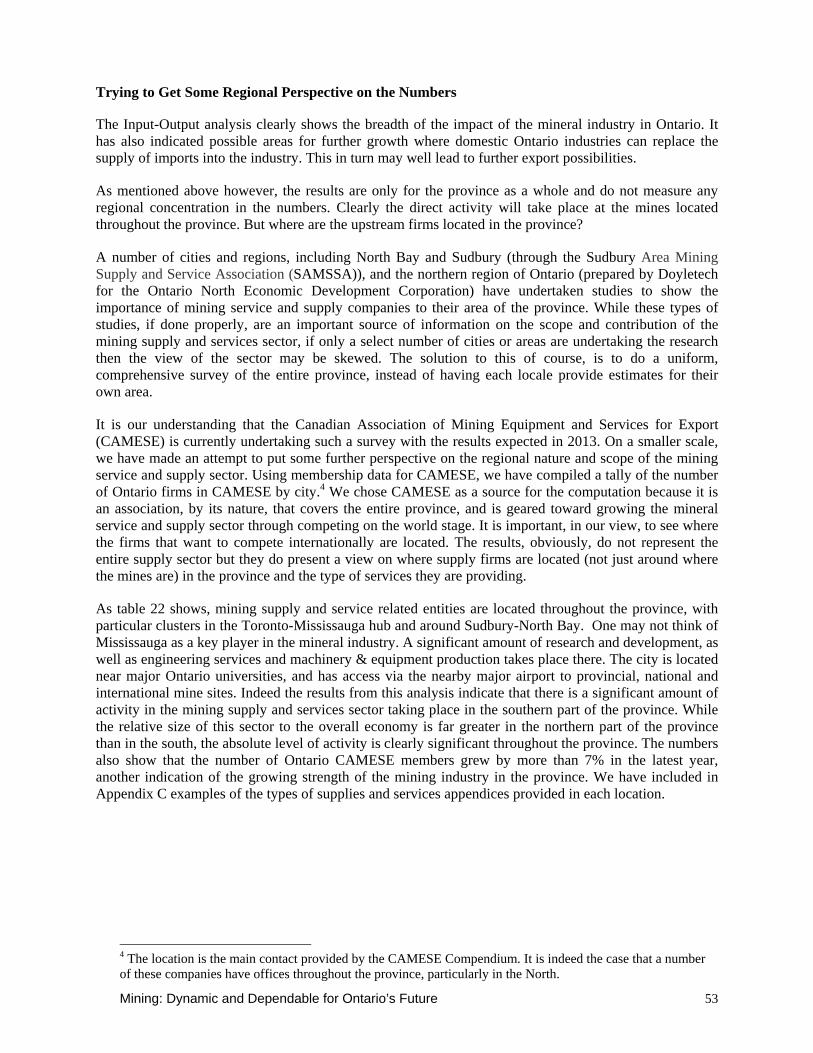
Mining: Dynamic and Dependable for Ontario’s Future 53
Trying to Get Some Regional Perspective on the Numbers The Input-Output analysis clearly shows the breadth of the impact of the mineral industry in Ontario. It has also indicated possible areas for further growth where domestic Ontario industries can replace the supply of imports into the industry. This in turn may well lead to further export possibilities.
As mentioned above however, the results are only for the province as a whole and do not measure any regional concentration in the numbers. Clearly the direct activity will take place at the mines located throughout the province. But where are the upstream firms located in the province?
A number of cities and regions, including North Bay and Sudbury (through the Sudbury Area Mining Supply and Service Association (SAMSSA)), and the northern region of Ontario (prepared by Doyletech for the Ontario North Economic Development Corporation) have undertaken studies to show the importance of mining service and supply companies to their area of the province. While these types of studies, if done properly, are an important source of information on the scope and contribution of the mining supply and services sector, if only a select number of cities or areas are undertaking the research then the view of the sector may be skewed. The solution to this of course, is to do a uniform, comprehensive survey of the entire province, instead of having each locale provide estimates for their own area.
It is our understanding that the Canadian Association of Mining Equipment and Services for Export (CAMESE) is currently undertaking such a survey with the results expected in 2013. On a smaller scale, we have made an attempt to put some further perspective on the regional nature and scope of the mining service and supply sector. Using membership data for CAMESE, we have compiled a tally of the number of Ontario firms in CAMESE by city.4 We chose CAMESE as a source for the computation because it is an association, by its nature, that covers the entire province, and is geared toward growing the mineral service and supply sector through competing on the world stage. It is important, in our view, to see where the firms that want to compete internationally are located. The results, obviously, do not represent the entire supply sector but they do present a view on where supply firms are located (not just around where the mines are) in the province and the type of services they are providing.
As table 22 shows, mining supply and service related entities are located throughout the province, with particular clusters in the Toronto-Mississauga hub and around Sudbury-North Bay. One may not think of Mississauga as a key player in the mineral industry. A significant amount of research and development, as well as engineering services and machinery & equipment production takes place there. The city is located near major Ontario universities, and has access via the nearby major airport to provincial, national and international mine sites. Indeed the results from this analysis indicate that there is a significant amount of activity in the mining supply and services sector taking place in the southern part of the province. While the relative size of this sector to the overall economy is far greater in the northern part of the province than in the south, the absolute level of activity is clearly significant throughout the province. The numbers also show that the number of Ontario CAMESE members grew by more than 7% in the latest year, another indication of the growing strength of the mining industry in the province. We have included in Appendix C examples of the types of supplies and services appendices provided in each location.
4 The location is the main contact provided by the CAMESE Compendium. It is indeed the case that a number of these companies have offices throughout the province, particularly in the North.
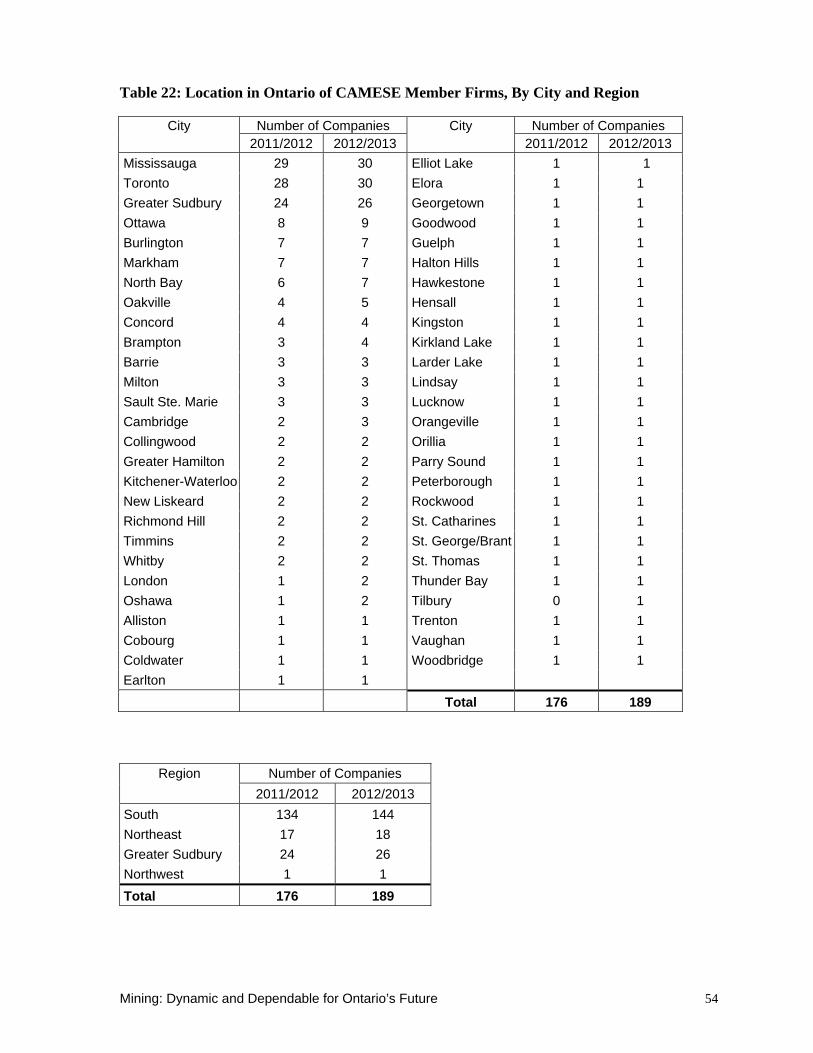
Mining: Dynamic and Dependable for Ontario’s Future 54
Table 22: Location in Ontario of CAMESE Member Firms, By City and Region
City Number of Companies City Number of Companies 2011/2012 2012/2013 2011/2012 2012/2013
Mississauga 29 30 Elliot Lake 1 1 Toronto 28 30 Elora 1 1 Greater Sudbury 24 26 Georgetown 1 1 Ottawa 8 9 Goodwood 1 1 Burlington 7 7 Guelph 1 1 Markham 7 7 Halton Hills 1 1 North Bay 6 7 Hawkestone 1 1 Oakville 4 5 Hensall 1 1 Concord 4 4 Kingston 1 1 Brampton 3 4 Kirkland Lake 1 1 Barrie 3 3 Larder Lake 1 1 Milton 3 3 Lindsay 1 1 Sault Ste. Marie 3 3 Lucknow 1 1 Cambridge 2 3 Orangeville 1 1 Collingwood 2 2 Orillia 1 1 Greater Hamilton 2 2 Parry Sound 1 1 Kitchener-Waterloo 2 2 Peterborough 1 1 New Liskeard 2 2 Rockwood 1 1 Richmond Hill 2 2 St. Catharines 1 1 Timmins 2 2 St. George/Brant 1 1 Whitby 2 2 St. Thomas 1 1 London 1 2 Thunder Bay 1 1 Oshawa 1 2 Tilbury 0 1 Alliston 1 1 Trenton 1 1 Cobourg 1 1 Vaughan 1 1 Coldwater 1 1 Woodbridge 1 1 Earlton 1 1
Total 176 189
Region Number of Companies
2011/2012 2012/2013 South 134 144 Northeast 17 18 Greater Sudbury 24 26 Northwest 1 1 Total 176 189
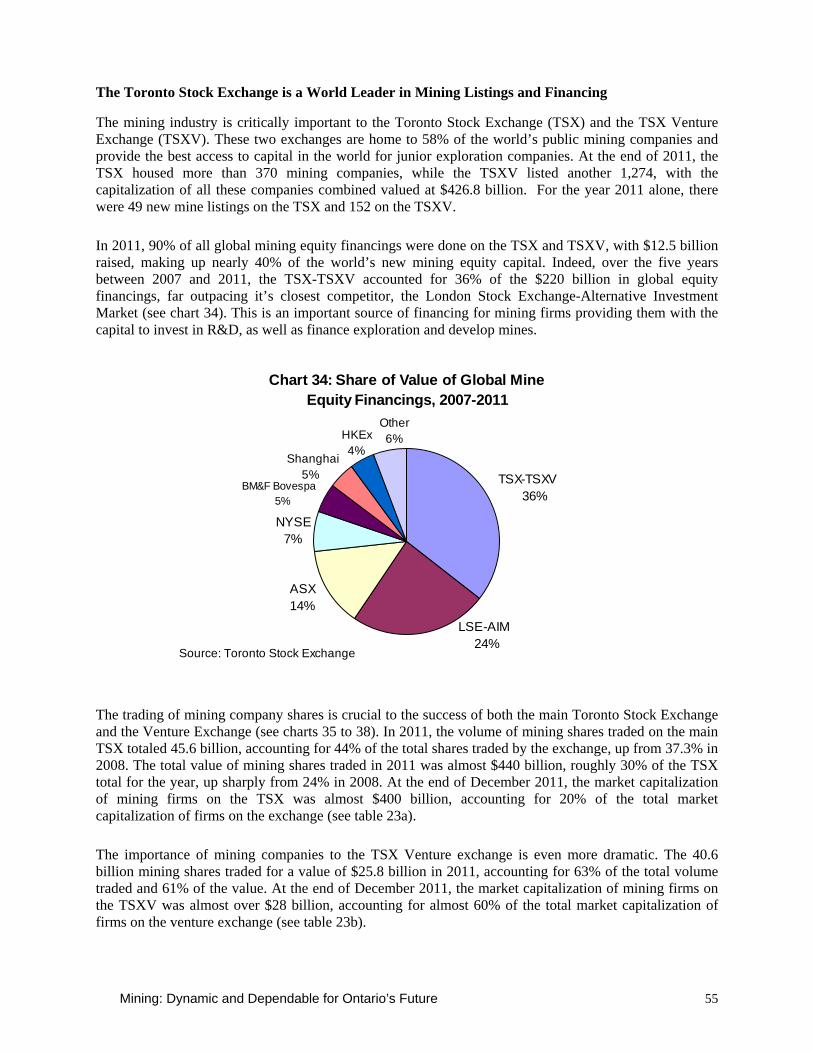
Mining: Dynamic and Dependable for Ontario’s Future 55
The Toronto Stock Exchange is a World Leader in Mining Listings and Financing
The mining industry is critically important to the Toronto Stock Exchange (TSX) and the TSX Venture Exchange (TSXV). These two exchanges are home to 58% of the world’s public mining companies and provide the best access to capital in the world for junior exploration companies. At the end of 2011, the TSX housed more than 370 mining companies, while the TSXV listed another 1,274, with the capitalization of all these companies combined valued at $426.8 billion. For the year 2011 alone, there were 49 new mine listings on the TSX and 152 on the TSXV. In 2011, 90% of all global mining equity financings were done on the TSX and TSXV, with $12.5 billion raised, making up nearly 40% of the world’s new mining equity capital. Indeed, over the five years between 2007 and 2011, the TSX-TSXV accounted for 36% of the $220 billion in global equity financings, far outpacing it’s closest competitor, the London Stock Exchange-Alternative Investment Market (see chart 34). This is an important source of financing for mining firms providing them with the capital to invest in R&D, as well as finance exploration and develop mines.
Chart 34: Share of Value of Global Mine Equity Financings, 2007-2011
TSX-TSXV 36%
LSE-AIM 24%
ASX14%
NYSE 7%
BM&F Bovespa 5%
Shanghai 5%
HKEx 4%
Other 6%
Source: Toronto Stock Exchange The trading of mining company shares is crucial to the success of both the main Toronto Stock Exchange and the Venture Exchange (see charts 35 to 38). In 2011, the volume of mining shares traded on the main TSX totaled 45.6 billion, accounting for 44% of the total shares traded by the exchange, up from 37.3% in 2008. The total value of mining shares traded in 2011 was almost $440 billion, roughly 30% of the TSX total for the year, up sharply from 24% in 2008. At the end of December 2011, the market capitalization of mining firms on the TSX was almost $400 billion, accounting for 20% of the total market capitalization of firms on the exchange (see table 23a). The importance of mining companies to the TSX Venture exchange is even more dramatic. The 40.6 billion mining shares traded for a value of $25.8 billion in 2011, accounting for 63% of the total volume traded and 61% of the value. At the end of December 2011, the market capitalization of mining firms on the TSXV was almost over $28 billion, accounting for almost 60% of the total market capitalization of firms on the venture exchange (see table 23b).

Mining: Dynamic and Dependable for Ontario’s Future 56
Chart 35: Value of Shares Traded on the TSX,Mining and Other
$450 $354 $394 $439
$1,403
$1,044 $997$1,042
$0
$200
$400
$600
$800
$1,000
$1,200
$1,400
$1,600
$1,800
$2,000
2008 2009 2010 2011
$Bill
ions
Mining All OtherSource: Toronto Stock Exchange
Chart 36: Volume of Shares Traded on the TSX,Mining and Other
40.7 47.9 45.0 45.6
68.570.6
59.6 58.0
0
20
40
60
80
100
120
140
2008 2009 2010 2011
Billi
ons
Mining All OtherSource: Toronto Stock Exchange
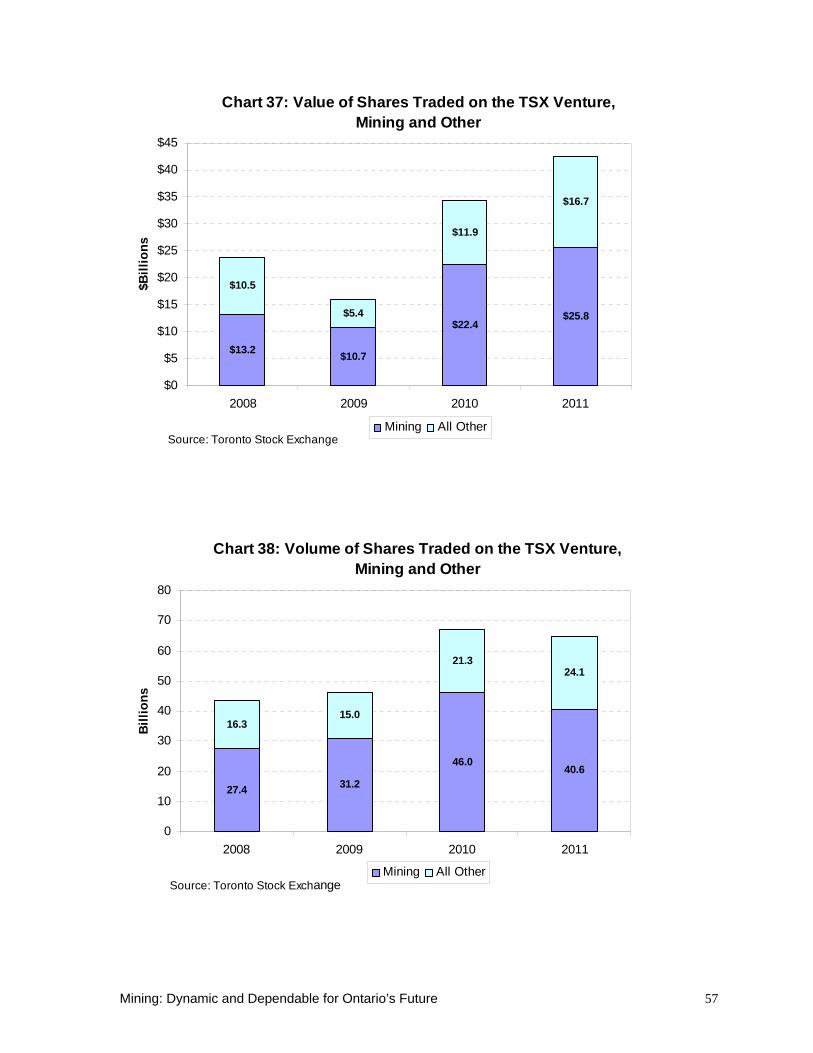
Mining: Dynamic and Dependable for Ontario’s Future 57
Chart 37: Value of Shares Traded on the TSX Venture,Mining and Other
$13.2 $10.7
$22.4$25.8
$10.5
$5.4
$11.9
$16.7
$0
$5
$10
$15
$20
$25
$30
$35
$40
$45
2008 2009 2010 2011
$Bill
ions
Mining All OtherSource: Toronto Stock Exchange
Chart 38: Volume of Shares Traded on the TSX Venture,Mining and Other
27.4 31.2
46.040.6
16.315.0
21.324.1
0
10
20
30
40
50
60
70
80
2008 2009 2010 2011
Bill
ions
Mining All OtherSource: Toronto Stock Exchange
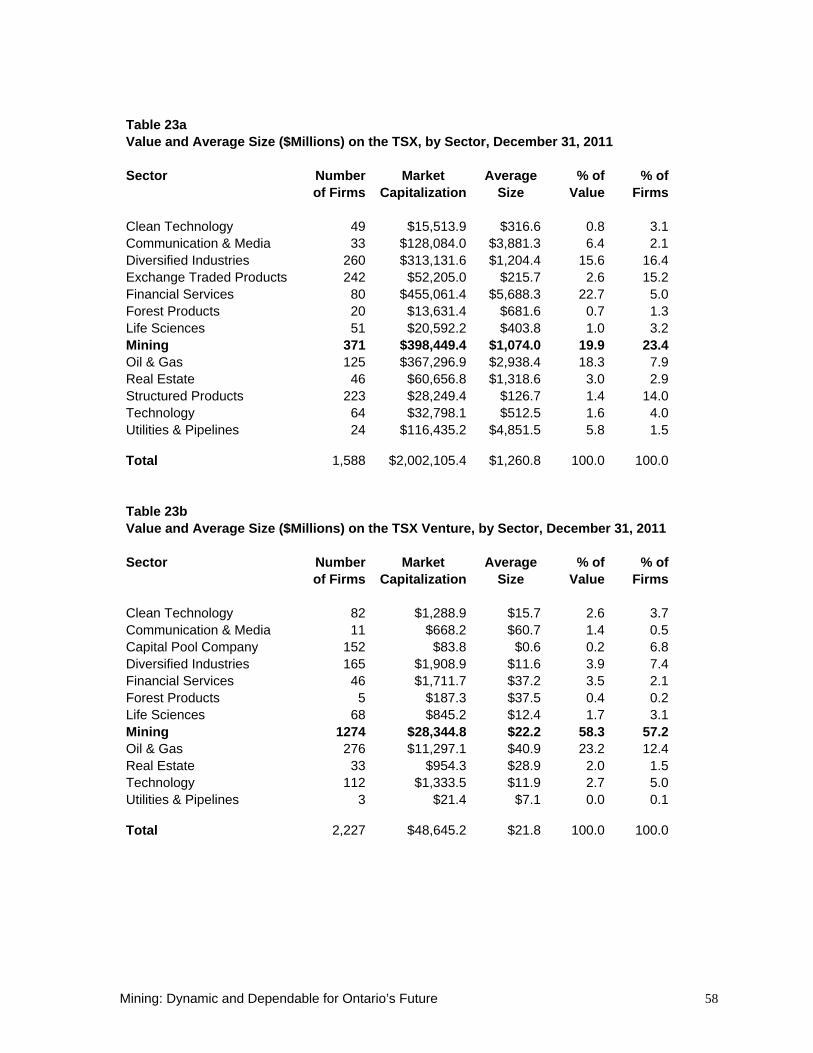
Mining: Dynamic and Dependable for Ontario’s Future 58
Table 23a Value and Average Size ($Millions) on the TSX, by Sector, December 31, 2011 Sector Number Market Average % of % of of Firms Capitalization Size Value Firms Clean Technology 49 $15,513.9 $316.6 0.8 3.1Communication & Media 33 $128,084.0 $3,881.3 6.4 2.1Diversified Industries 260 $313,131.6 $1,204.4 15.6 16.4Exchange Traded Products 242 $52,205.0 $215.7 2.6 15.2Financial Services 80 $455,061.4 $5,688.3 22.7 5.0Forest Products 20 $13,631.4 $681.6 0.7 1.3Life Sciences 51 $20,592.2 $403.8 1.0 3.2Mining 371 $398,449.4 $1,074.0 19.9 23.4Oil & Gas 125 $367,296.9 $2,938.4 18.3 7.9Real Estate 46 $60,656.8 $1,318.6 3.0 2.9Structured Products 223 $28,249.4 $126.7 1.4 14.0Technology 64 $32,798.1 $512.5 1.6 4.0Utilities & Pipelines 24 $116,435.2 $4,851.5 5.8 1.5
Total
1,588 $2,002,105.4 $1,260.8 100.0 100.0 Table 23b Value and Average Size ($Millions) on the TSX Venture, by Sector, December 31, 2011 Sector Number Market Average % of % of of Firms Capitalization Size Value Firms Clean Technology 82 $1,288.9 $15.7 2.6 3.7Communication & Media 11 $668.2 $60.7 1.4 0.5Capital Pool Company 152 $83.8 $0.6 0.2 6.8Diversified Industries 165 $1,908.9 $11.6 3.9 7.4Financial Services 46 $1,711.7 $37.2 3.5 2.1Forest Products 5 $187.3 $37.5 0.4 0.2Life Sciences 68 $845.2 $12.4 1.7 3.1Mining 1274 $28,344.8 $22.2 58.3 57.2Oil & Gas 276 $11,297.1 $40.9 23.2 12.4Real Estate 33 $954.3 $28.9 2.0 1.5Technology 112 $1,333.5 $11.9 2.7 5.0Utilities & Pipelines 3 $21.4 $7.1 0.0 0.1
Total
2,227 $48,645.2 $21.8 100.0 100.0
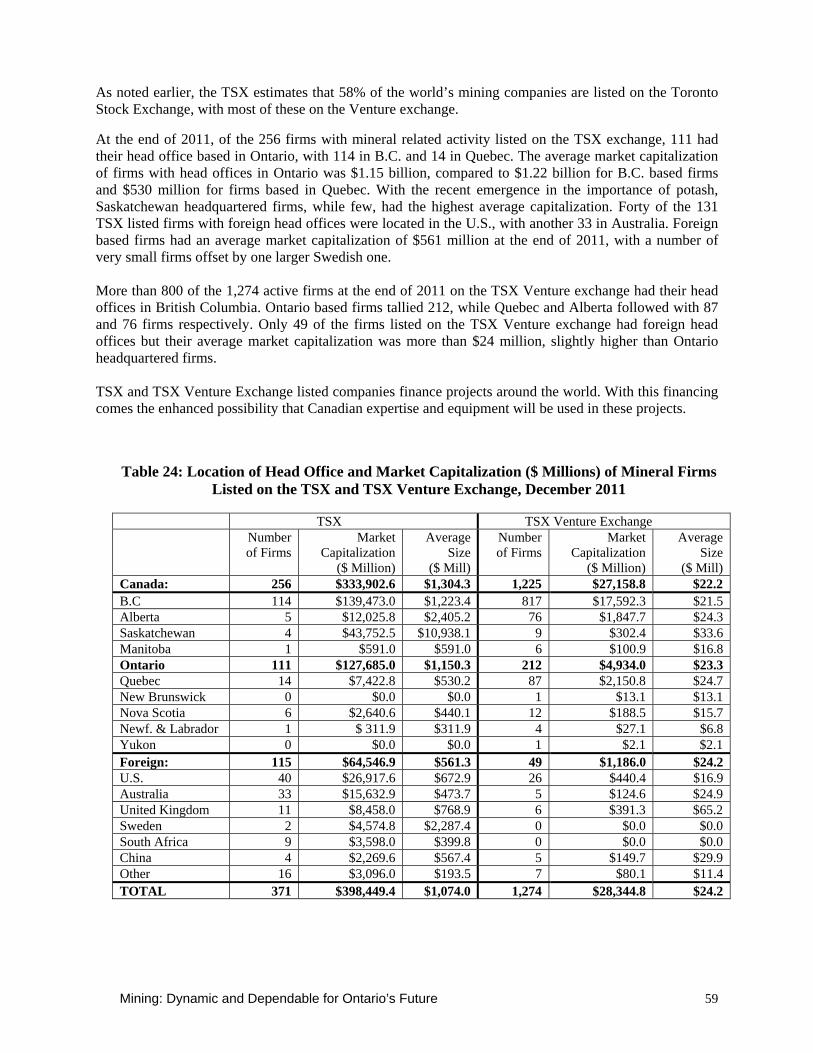
Mining: Dynamic and Dependable for Ontario’s Future 59
As noted earlier, the TSX estimates that 58% of the world’s mining companies are listed on the Toronto Stock Exchange, with most of these on the Venture exchange.
At the end of 2011, of the 256 firms with mineral related activity listed on the TSX exchange, 111 had their head office based in Ontario, with 114 in B.C. and 14 in Quebec. The average market capitalization of firms with head offices in Ontario was $1.15 billion, compared to $1.22 billion for B.C. based firms and $530 million for firms based in Quebec. With the recent emergence in the importance of potash, Saskatchewan headquartered firms, while few, had the highest average capitalization. Forty of the 131 TSX listed firms with foreign head offices were located in the U.S., with another 33 in Australia. Foreign based firms had an average market capitalization of $561 million at the end of 2011, with a number of very small firms offset by one larger Swedish one. More than 800 of the 1,274 active firms at the end of 2011 on the TSX Venture exchange had their head offices in British Columbia. Ontario based firms tallied 212, while Quebec and Alberta followed with 87 and 76 firms respectively. Only 49 of the firms listed on the TSX Venture exchange had foreign head offices but their average market capitalization was more than $24 million, slightly higher than Ontario headquartered firms. TSX and TSX Venture Exchange listed companies finance projects around the world. With this financing comes the enhanced possibility that Canadian expertise and equipment will be used in these projects.
Table 24: Location of Head Office and Market Capitalization ($ Millions) of Mineral Firms
Listed on the TSX and TSX Venture Exchange, December 2011 TSX TSX Venture Exchange Number
of Firms
Market Capitalization
($ Million)
Average Size
($ Mill)
Number of Firms
Market Capitalization
($ Million)
Average Size
($ Mill) Canada: 256 $333,902.6 $1,304.3 1,225 $27,158.8 $22.2 B.C 114 $139,473.0 $1,223.4 817 $17,592.3 $21.5 Alberta 5 $12,025.8 $2,405.2 76 $1,847.7 $24.3 Saskatchewan 4 $43,752.5 $10,938.1 9 $302.4 $33.6 Manitoba 1 $591.0 $591.0 6 $100.9 $16.8 Ontario 111 $127,685.0 $1,150.3 212 $4,934.0 $23.3 Quebec 14 $7,422.8 $530.2 87 $2,150.8 $24.7 New Brunswick 0 $0.0 $0.0 1 $13.1 $13.1 Nova Scotia 6 $2,640.6 $440.1 12 $188.5 $15.7 Newf. & Labrador 1 $ 311.9 $311.9 4 $27.1 $6.8 Yukon 0 $0.0 $0.0 1 $2.1 $2.1 Foreign: 115 $64,546.9 $561.3 49 $1,186.0 $24.2 U.S. 40 $26,917.6 $672.9 26 $440.4 $16.9 Australia 33 $15,632.9 $473.7 5 $124.6 $24.9 United Kingdom 11 $8,458.0 $768.9 6 $391.3 $65.2 Sweden 2 $4,574.8 $2,287.4 0 $0.0 $0.0 South Africa 9 $3,598.0 $399.8 0 $0.0 $0.0 China 4 $2,269.6 $567.4 5 $149.7 $29.9 Other 16 $3,096.0 $193.5 7 $80.1 $11.4 TOTAL 371 $398,449.4 $1,074.0 1,274 $28,344.8 $24.2
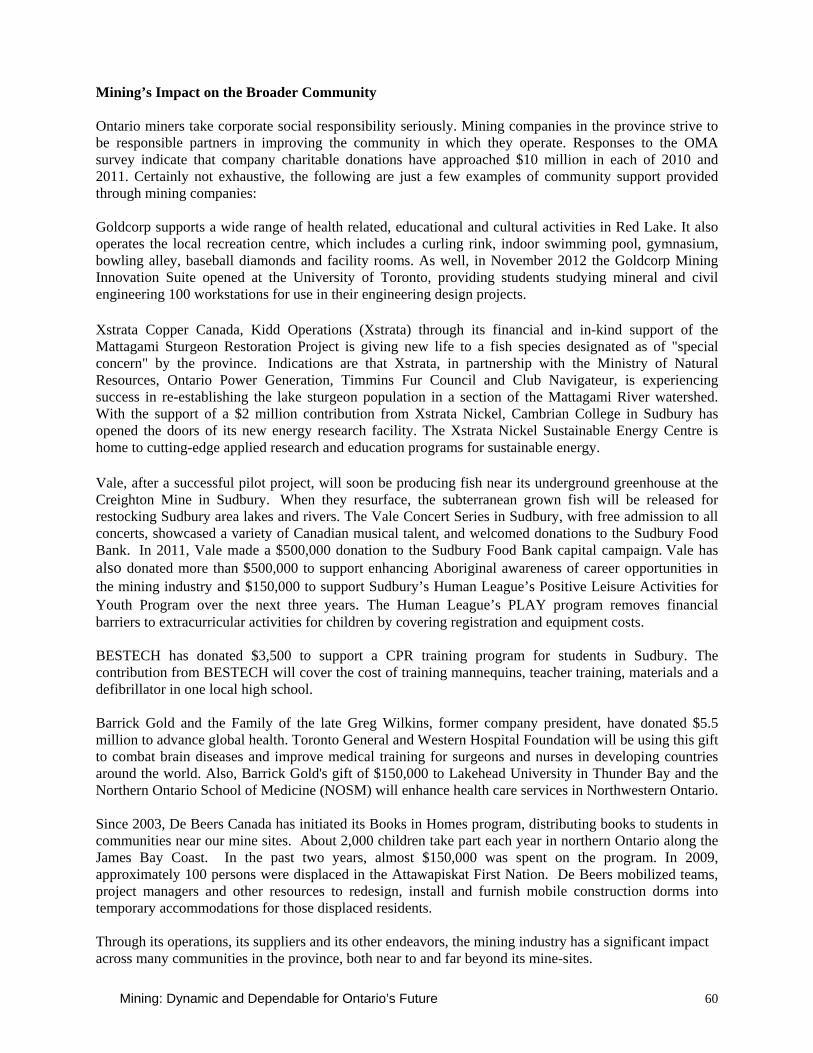
Mining: Dynamic and Dependable for Ontario’s Future 60
Mining’s Impact on the Broader Community Ontario miners take corporate social responsibility seriously. Mining companies in the province strive to be responsible partners in improving the community in which they operate. Responses to the OMA survey indicate that company charitable donations have approached $10 million in each of 2010 and 2011. Certainly not exhaustive, the following are just a few examples of community support provided through mining companies: Goldcorp supports a wide range of health related, educational and cultural activities in Red Lake. It also operates the local recreation centre, which includes a curling rink, indoor swimming pool, gymnasium, bowling alley, baseball diamonds and facility rooms. As well, in November 2012 the Goldcorp Mining Innovation Suite opened at the University of Toronto, providing students studying mineral and civil engineering 100 workstations for use in their engineering design projects.
Xstrata Copper Canada, Kidd Operations (Xstrata) through its financial and in-kind support of the Mattagami Sturgeon Restoration Project is giving new life to a fish species designated as of "special concern" by the province. Indications are that Xstrata, in partnership with the Ministry of Natural Resources, Ontario Power Generation, Timmins Fur Council and Club Navigateur, is experiencing success in re-establishing the lake sturgeon population in a section of the Mattagami River watershed. With the support of a $2 million contribution from Xstrata Nickel, Cambrian College in Sudbury has opened the doors of its new energy research facility. The Xstrata Nickel Sustainable Energy Centre is home to cutting-edge applied research and education programs for sustainable energy.
Vale, after a successful pilot project, will soon be producing fish near its underground greenhouse at the Creighton Mine in Sudbury. When they resurface, the subterranean grown fish will be released for restocking Sudbury area lakes and rivers. The Vale Concert Series in Sudbury, with free admission to all concerts, showcased a variety of Canadian musical talent, and welcomed donations to the Sudbury Food Bank. In 2011, Vale made a $500,000 donation to the Sudbury Food Bank capital campaign. Vale has also donated more than $500,000 to support enhancing Aboriginal awareness of career opportunities in the mining industry and $150,000 to support Sudbury’s Human League’s Positive Leisure Activities for Youth Program over the next three years. The Human League’s PLAY program removes financial barriers to extracurricular activities for children by covering registration and equipment costs. BESTECH has donated $3,500 to support a CPR training program for students in Sudbury. The contribution from BESTECH will cover the cost of training mannequins, teacher training, materials and a defibrillator in one local high school. Barrick Gold and the Family of the late Greg Wilkins, former company president, have donated $5.5 million to advance global health. Toronto General and Western Hospital Foundation will be using this gift to combat brain diseases and improve medical training for surgeons and nurses in developing countries around the world. Also, Barrick Gold's gift of $150,000 to Lakehead University in Thunder Bay and the Northern Ontario School of Medicine (NOSM) will enhance health care services in Northwestern Ontario. Since 2003, De Beers Canada has initiated its Books in Homes program, distributing books to students in communities near our mine sites. About 2,000 children take part each year in northern Ontario along the James Bay Coast. In the past two years, almost $150,000 was spent on the program. In 2009, approximately 100 persons were displaced in the Attawapiskat First Nation. De Beers mobilized teams, project managers and other resources to redesign, install and furnish mobile construction dorms into temporary accommodations for those displaced residents. Through its operations, its suppliers and its other endeavors, the mining industry has a significant impact across many communities in the province, both near to and far beyond its mine-sites.

Mining: Dynamic and Dependable for Ontario’s Future 61
Appendix A. Map Used to Define Regions in Ontario Mining Association Survey
Mining: Dynamic and Dependable for Ontario’s Future 62
Appendix B: Detailed Input-Output Results Table B1a. Direct and Indirect Impacts on GDP of $1 Billion in OMA Mineral Production in Ontario Table B1b. Direct and Indirect Impacts on Employment of $1 Billion in OMA Mineral Production in Ontario Table B1c. Direct and Indirect Impacts on International Imports of $1 Billion in OMA Mineral Production
in Ontario Table B2a. Direct, Indirect & Induced Impacts on GDP of $1 Billion in OMA Mineral Production in Ontario Table B2b. Direct, Indirect & Induced Impacts on Employment of $1 Billion in OMA Mineral Production
in Ontario Table B2c. Direct, Indirect & Induced Impacts on International Imports of $1 Billion in OMA Mineral
Production in Ontario
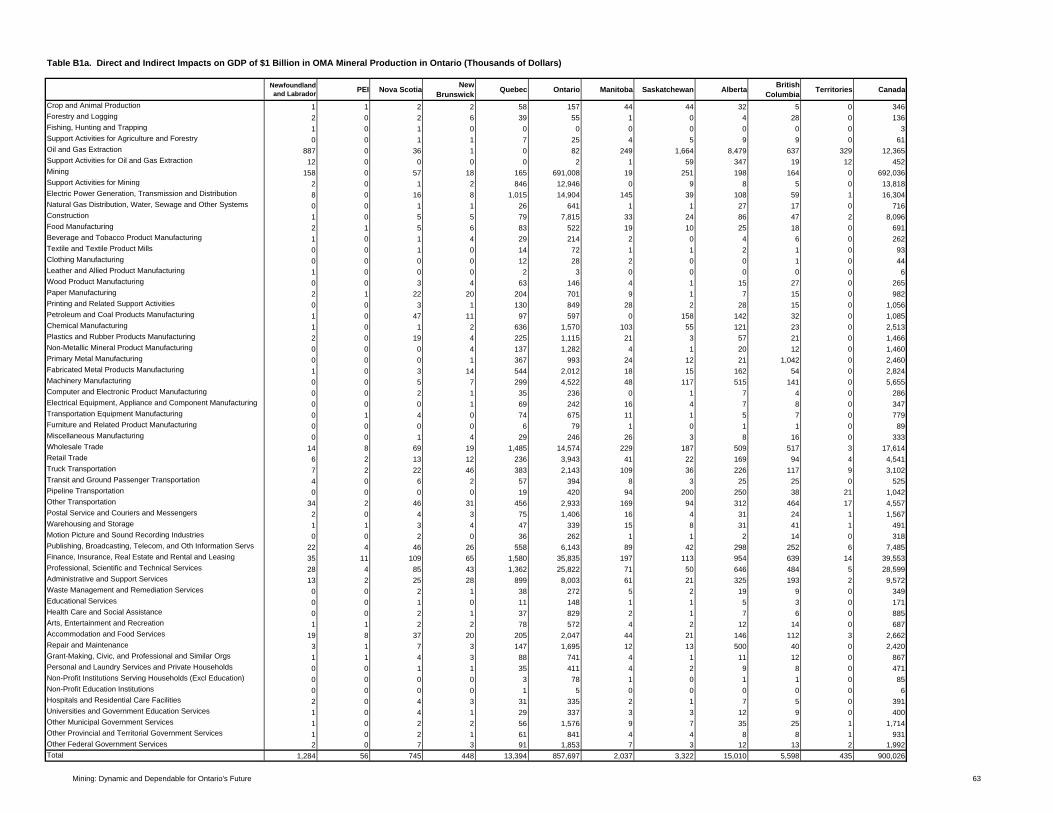
Table B1a. Direct and Indirect Impacts on GDP of $1 Billion in OMA Mineral Production in Ontario (Thousands of Dollars)
Newfoundland and Labrador PEI Nova Scotia New
Brunswick Quebec Ontario Manitoba Saskatchewan Alberta British Columbia Territories Canada
Crop and Animal Production 1 1 2 2 58 157 44 44 32 5 0 346Forestry and Logging 2 0 2 6 39 55 1 0 4 28 0 136Fishing, Hunting and Trapping 1 0 1 0 0 0 0 0 0 0 0 3Support Activities for Agriculture and Forestry 0 0 1 1 7 25 4 5 9 9 0 61Oil and Gas Extraction 887 0 36 1 0 82 249 1,664 8,479 637 329 12,365Support Activities for Oil and Gas Extraction 12 0 0 0 0 2 1 59 347 19 12 452Mining 158 0 57 18 165 691,008 19 251 198 164 0 692,036Support Activities for Mining 2 0 1 2 846 12,946 0 9 8 5 0 13,818Electric Power Generation, Transmission and Distribution 8 0 16 8 1,015 14,904 145 39 108 59 1 16,304Natural Gas Distribution, Water, Sewage and Other Systems 0 0 1 1 26 641 1 1 27 17 0 716Construction 1 0 5 5 79 7,815 33 24 86 47 2 8,096Food Manufacturing 2 1 5 6 83 522 19 10 25 18 0 691Beverage and Tobacco Product Manufacturing 1 0 1 4 29 214 2 0 4 6 0 262Textile and Textile Product Mills 0 0 1 0 14 72 1 1 2 1 0 93Clothing Manufacturing 0 0 0 0 12 28 2 0 0 1 0 44Leather and Allied Product Manufacturing 1 0 0 0 2 3 0 0 0 0 0 6Wood Product Manufacturing 0 0 3 4 63 146 4 1 15 27 0 265Paper Manufacturing 2 1 22 20 204 701 9 1 7 15 0 982Printing and Related Support Activities 0 0 3 1 130 849 28 2 28 15 0 1,056Petroleum and Coal Products Manufacturing 1 0 47 11 97 597 0 158 142 32 0 1,085Chemical Manufacturing 1 0 1 2 636 1,570 103 55 121 23 0 2,513Plastics and Rubber Products Manufacturing 2 0 19 4 225 1,115 21 3 57 21 0 1,466Non-Metallic Mineral Product Manufacturing 0 0 0 4 137 1,282 4 1 20 12 0 1,460Primary Metal Manufacturing 0 0 0 1 367 993 24 12 21 1,042 0 2,460Fabricated Metal Products Manufacturing 1 0 3 14 544 2,012 18 15 162 54 0 2,824Machinery Manufacturing 0 0 5 7 299 4,522 48 117 515 141 0 5,655Computer and Electronic Product Manufacturing 0 0 2 1 35 236 0 1 7 4 0 286Electrical Equipment, Appliance and Component Manufacturing 0 0 0 1 69 242 16 4 7 8 0 347Transportation Equipment Manufacturing 0 1 4 0 74 675 11 1 5 7 0 779Furniture and Related Product Manufacturing 0 0 0 0 6 79 1 0 1 1 0 89Miscellaneous Manufacturing 0 0 1 4 29 246 26 3 8 16 0 333Wholesale Trade 14 8 69 19 1,485 14,574 229 187 509 517 3 17,614Retail Trade 6 2 13 12 236 3,943 41 22 169 94 4 4,541Truck Transportation 7 2 22 46 383 2,143 109 36 226 117 9 3,102Transit and Ground Passenger Transportation 4 0 6 2 57 394 8 3 25 25 0 525Pipeline Transportation 0 0 0 0 19 420 94 200 250 38 21 1,042Other Transportation 34 2 46 31 456 2,933 169 94 312 464 17 4,557Postal Service and Couriers and Messengers 2 0 4 3 75 1,406 16 4 31 24 1 1,567Warehousing and Storage 1 1 3 4 47 339 15 8 31 41 1 491Motion Picture and Sound Recording Industries 0 0 2 0 36 262 1 1 2 14 0 318Publishing, Broadcasting, Telecom, and Oth Information Servs 22 4 46 26 558 6,143 89 42 298 252 6 7,485Finance, Insurance, Real Estate and Rental and Leasing 35 11 109 65 1,580 35,835 197 113 954 639 14 39,553Professional, Scientific and Technical Services 28 4 85 43 1,362 25,822 71 50 646 484 5 28,599Administrative and Support Services 13 2 25 28 899 8,003 61 21 325 193 2 9,572Waste Management and Remediation Services 0 0 2 1 38 272 5 2 19 9 0 349Educational Services 0 0 1 0 11 148 1 1 5 3 0 171Health Care and Social Assistance 0 0 2 1 37 829 2 1 7 6 0 885Arts, Entertainment and Recreation 1 1 2 2 78 572 4 2 12 14 0 687Accommodation and Food Services 19 8 37 20 205 2,047 44 21 146 112 3 2,662Repair and Maintenance 3 1 7 3 147 1,695 12 13 500 40 0 2,420Grant-Making, Civic, and Professional and Similar Orgs 1 1 4 3 88 741 4 1 11 12 0 867Personal and Laundry Services and Private Households 0 0 1 1 35 411 4 2 9 8 0 471Non-Profit Institutions Serving Households (Excl Education) 0 0 0 0 3 78 1 0 1 1 0 85Non-Profit Education Institutions 0 0 0 0 1 5 0 0 0 0 0 6Hospitals and Residential Care Facilities 2 0 4 3 31 335 2 1 7 5 0 391Universities and Government Education Services 1 0 4 1 29 337 3 3 12 9 0 400Other Municipal Government Services 1 0 2 2 56 1,576 9 7 35 25 1 1,714Other Provincial and Territorial Government Services 1 0 2 1 61 841 4 4 8 8 1 931Other Federal Government Services 2 0 7 3 91 1,853 7 3 12 13 2 1,992Total 1,284 56 745 448 13,394 857,697 2,037 3,322 15,010 5,598 435 900,026
Mining: Dynamic and Dependable for Ontario's Future 63
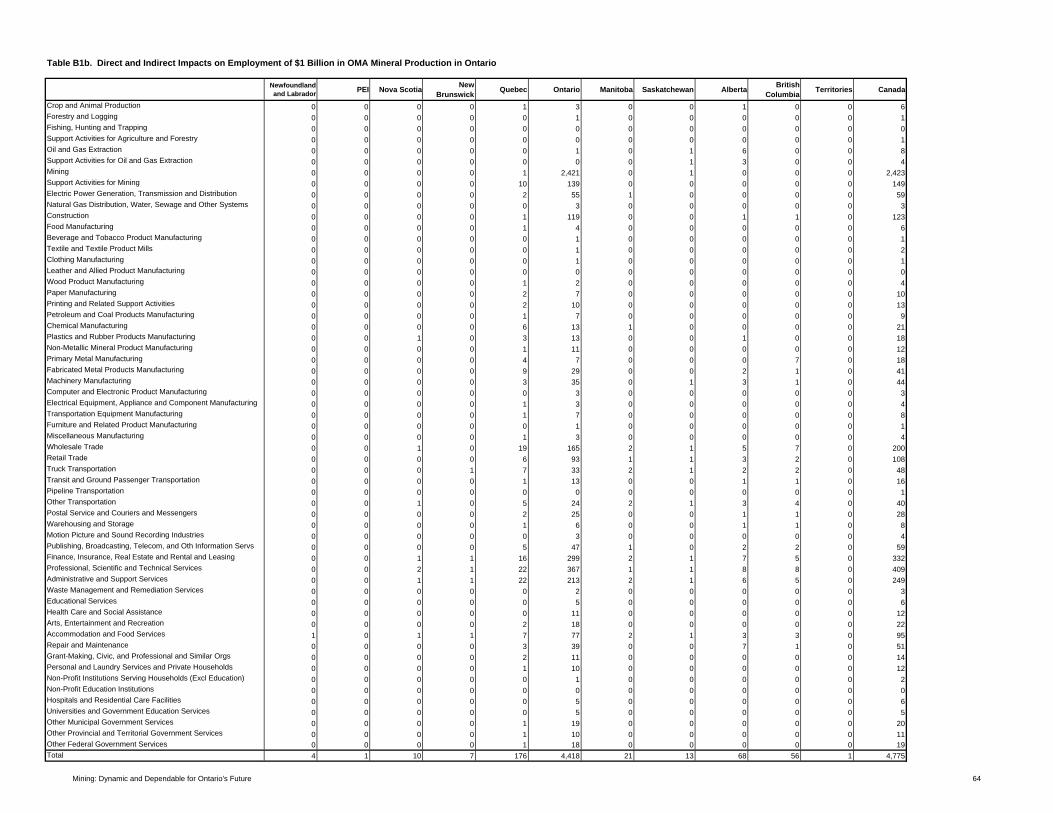
Table B1b. Direct and Indirect Impacts on Employment of $1 Billion in OMA Mineral Production in Ontario
Newfoundland and Labrador PEI Nova Scotia New
Brunswick Quebec Ontario Manitoba Saskatchewan Alberta British Columbia Territories Canada
Crop and Animal Production 0 0 0 0 1 3 0 0 1 0 0 6Forestry and Logging 0 0 0 0 0 1 0 0 0 0 0 1Fishing, Hunting and Trapping 0 0 0 0 0 0 0 0 0 0 0 0Support Activities for Agriculture and Forestry 0 0 0 0 0 0 0 0 0 0 0 1Oil and Gas Extraction 0 0 0 0 0 1 0 1 6 0 0 8Support Activities for Oil and Gas Extraction 0 0 0 0 0 0 0 1 3 0 0 4Mining 0 0 0 0 1 2,421 0 1 0 0 0 2,423Support Activities for Mining 0 0 0 0 10 139 0 0 0 0 0 149Electric Power Generation, Transmission and Distribution 0 0 0 0 2 55 1 0 0 0 0 59Natural Gas Distribution, Water, Sewage and Other Systems 0 0 0 0 0 3 0 0 0 0 0 3Construction 0 0 0 0 1 119 0 0 1 1 0 123Food Manufacturing 0 0 0 0 1 4 0 0 0 0 0 6Beverage and Tobacco Product Manufacturing 0 0 0 0 0 1 0 0 0 0 0 1Textile and Textile Product Mills 0 0 0 0 0 1 0 0 0 0 0 2Clothing Manufacturing 0 0 0 0 0 1 0 0 0 0 0 1Leather and Allied Product Manufacturing 0 0 0 0 0 0 0 0 0 0 0 0Wood Product Manufacturing 0 0 0 0 1 2 0 0 0 0 0 4Paper Manufacturing 0 0 0 0 2 7 0 0 0 0 0 10Printing and Related Support Activities 0 0 0 0 2 10 0 0 0 0 0 13Petroleum and Coal Products Manufacturing 0 0 0 0 1 7 0 0 0 0 0 9Chemical Manufacturing 0 0 0 0 6 13 1 0 0 0 0 21Plastics and Rubber Products Manufacturing 0 0 1 0 3 13 0 0 1 0 0 18Non-Metallic Mineral Product Manufacturing 0 0 0 0 1 11 0 0 0 0 0 12Primary Metal Manufacturing 0 0 0 0 4 7 0 0 0 7 0 18Fabricated Metal Products Manufacturing 0 0 0 0 9 29 0 0 2 1 0 41Machinery Manufacturing 0 0 0 0 3 35 0 1 3 1 0 44Computer and Electronic Product Manufacturing 0 0 0 0 0 3 0 0 0 0 0 3Electrical Equipment, Appliance and Component Manufacturing 0 0 0 0 1 3 0 0 0 0 0 4Transportation Equipment Manufacturing 0 0 0 0 1 7 0 0 0 0 0 8Furniture and Related Product Manufacturing 0 0 0 0 0 1 0 0 0 0 0 1Miscellaneous Manufacturing 0 0 0 0 1 3 0 0 0 0 0 4Wholesale Trade 0 0 1 0 19 165 2 1 5 7 0 200Retail Trade 0 0 0 0 6 93 1 1 3 2 0 108Truck Transportation 0 0 0 1 7 33 2 1 2 2 0 48Transit and Ground Passenger Transportation 0 0 0 0 1 13 0 0 1 1 0 16Pipeline Transportation 0 0 0 0 0 0 0 0 0 0 0 1Other Transportation 0 0 1 0 5 24 2 1 3 4 0 40Postal Service and Couriers and Messengers 0 0 0 0 2 25 0 0 1 1 0 28Warehousing and Storage 0 0 0 0 1 6 0 0 1 1 0 8Motion Picture and Sound Recording Industries 0 0 0 0 0 3 0 0 0 0 0 4Publishing, Broadcasting, Telecom, and Oth Information Servs 0 0 0 0 5 47 1 0 2 2 0 59Finance, Insurance, Real Estate and Rental and Leasing 0 0 1 1 16 299 2 1 7 5 0 332Professional, Scientific and Technical Services 0 0 2 1 22 367 1 1 8 8 0 409Administrative and Support Services 0 0 1 1 22 213 2 1 6 5 0 249Waste Management and Remediation Services 0 0 0 0 0 2 0 0 0 0 0 3Educational Services 0 0 0 0 0 5 0 0 0 0 0 6Health Care and Social Assistance 0 0 0 0 0 11 0 0 0 0 0 12Arts, Entertainment and Recreation 0 0 0 0 2 18 0 0 0 0 0 22Accommodation and Food Services 1 0 1 1 7 77 2 1 3 3 0 95Repair and Maintenance 0 0 0 0 3 39 0 0 7 1 0 51Grant-Making, Civic, and Professional and Similar Orgs 0 0 0 0 2 11 0 0 0 0 0 14Personal and Laundry Services and Private Households 0 0 0 0 1 10 0 0 0 0 0 12Non-Profit Institutions Serving Households (Excl Education) 0 0 0 0 0 1 0 0 0 0 0 2Non-Profit Education Institutions 0 0 0 0 0 0 0 0 0 0 0 0Hospitals and Residential Care Facilities 0 0 0 0 0 5 0 0 0 0 0 6Universities and Government Education Services 0 0 0 0 0 5 0 0 0 0 0 5Other Municipal Government Services 0 0 0 0 1 19 0 0 0 0 0 20Other Provincial and Territorial Government Services 0 0 0 0 1 10 0 0 0 0 0 11Other Federal Government Services 0 0 0 0 1 18 0 0 0 0 0 19Total 4 1 10 7 176 4,418 21 13 68 56 1 4,775
Mining: Dynamic and Dependable for Ontario's Future 64
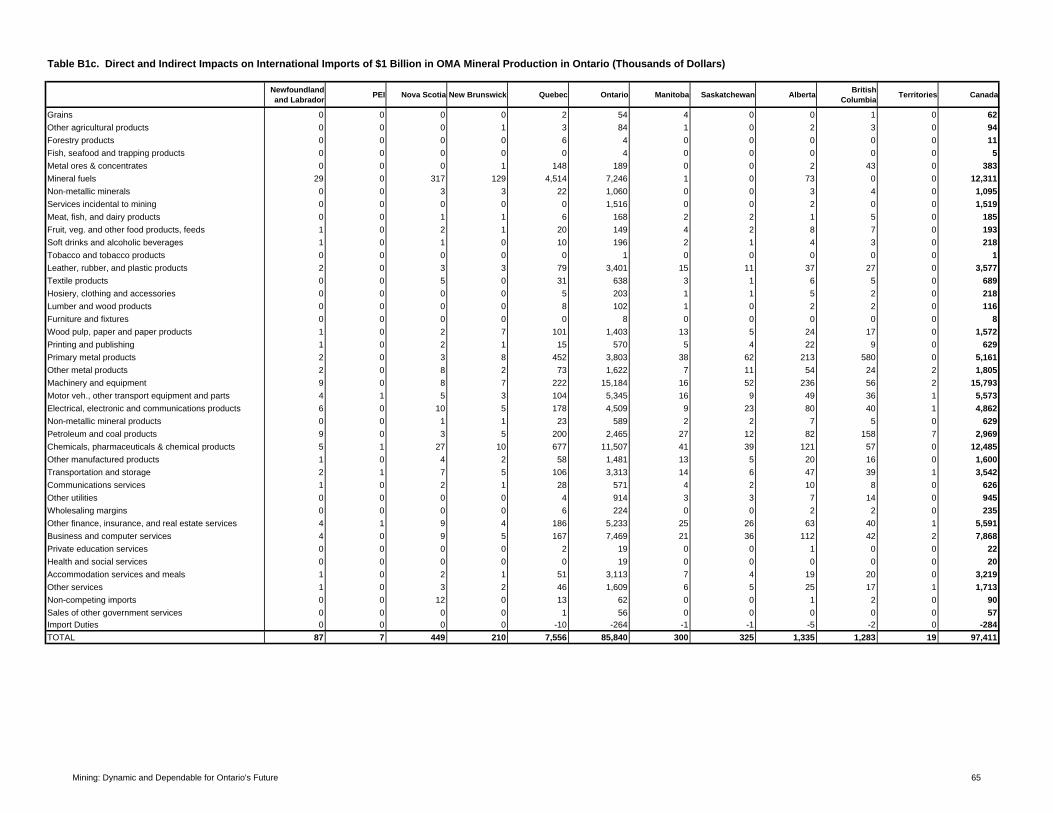
Table B1c. Direct and Indirect Impacts on International Imports of $1 Billion in OMA Mineral Production in Ontario (Thousands of Dollars)
Newfoundland and Labrador PEI Nova Scotia New Brunswick Quebec Ontario Manitoba Saskatchewan Alberta British
Columbia Territories Canada
Grains 0 0 0 0 2 54 4 0 0 1 0 62Other agricultural products 0 0 0 1 3 84 1 0 2 3 0 94Forestry products 0 0 0 0 6 4 0 0 0 0 0 11Fish, seafood and trapping products 0 0 0 0 0 4 0 0 0 0 0 5Metal ores & concentrates 0 0 0 1 148 189 0 0 2 43 0 383Mineral fuels 29 0 317 129 4,514 7,246 1 0 73 0 0 12,311Non-metallic minerals 0 0 3 3 22 1,060 0 0 3 4 0 1,095Services incidental to mining 0 0 0 0 0 1,516 0 0 2 0 0 1,519Meat, fish, and dairy products 0 0 1 1 6 168 2 2 1 5 0 185Fruit, veg. and other food products, feeds 1 0 2 1 20 149 4 2 8 7 0 193Soft drinks and alcoholic beverages 1 0 1 0 10 196 2 1 4 3 0 218Tobacco and tobacco products 0 0 0 0 0 1 0 0 0 0 0 1Leather, rubber, and plastic products 2 0 3 3 79 3,401 15 11 37 27 0 3,577Textile products 0 0 5 0 31 638 3 1 6 5 0 689Hosiery, clothing and accessories 0 0 0 0 5 203 1 1 5 2 0 218Lumber and wood products 0 0 0 0 8 102 1 0 2 2 0 116Furniture and fixtures 0 0 0 0 0 8 0 0 0 0 0 8Wood pulp, paper and paper products 1 0 2 7 101 1,403 13 5 24 17 0 1,572Printing and publishing 1 0 2 1 15 570 5 4 22 9 0 629Primary metal products 2 0 3 8 452 3,803 38 62 213 580 0 5,161Other metal products 2 0 8 2 73 1,622 7 11 54 24 2 1,805Machinery and equipment 9 0 8 7 222 15,184 16 52 236 56 2 15,793Motor veh., other transport equipment and parts 4 1 5 3 104 5,345 16 9 49 36 1 5,573Electrical, electronic and communications products 6 0 10 5 178 4,509 9 23 80 40 1 4,862Non-metallic mineral products 0 0 1 1 23 589 2 2 7 5 0 629Petroleum and coal products 9 0 3 5 200 2,465 27 12 82 158 7 2,969Chemicals, pharmaceuticals & chemical products 5 1 27 10 677 11,507 41 39 121 57 0 12,485Other manufactured products 1 0 4 2 58 1,481 13 5 20 16 0 1,600Transportation and storage 2 1 7 5 106 3,313 14 6 47 39 1 3,542Communications services 1 0 2 1 28 571 4 2 10 8 0 626Other utilities 0 0 0 0 4 914 3 3 7 14 0 945Wholesaling margins 0 0 0 0 6 224 0 0 2 2 0 235Other finance, insurance, and real estate services 4 1 9 4 186 5,233 25 26 63 40 1 5,591Business and computer services 4 0 9 5 167 7,469 21 36 112 42 2 7,868Private education services 0 0 0 0 2 19 0 0 1 0 0 22Health and social services 0 0 0 0 0 19 0 0 0 0 0 20Accommodation services and meals 1 0 2 1 51 3,113 7 4 19 20 0 3,219Other services 1 0 3 2 46 1,609 6 5 25 17 1 1,713Non-competing imports 0 0 12 0 13 62 0 0 1 2 0 90Sales of other government services 0 0 0 0 1 56 0 0 0 0 0 57Import Duties 0 0 0 0 -10 -264 -1 -1 -5 -2 0 -284TOTAL 87 7 449 210 7,556 85,840 300 325 1,335 1,283 19 97,411
Mining: Dynamic and Dependable for Ontario's Future 65
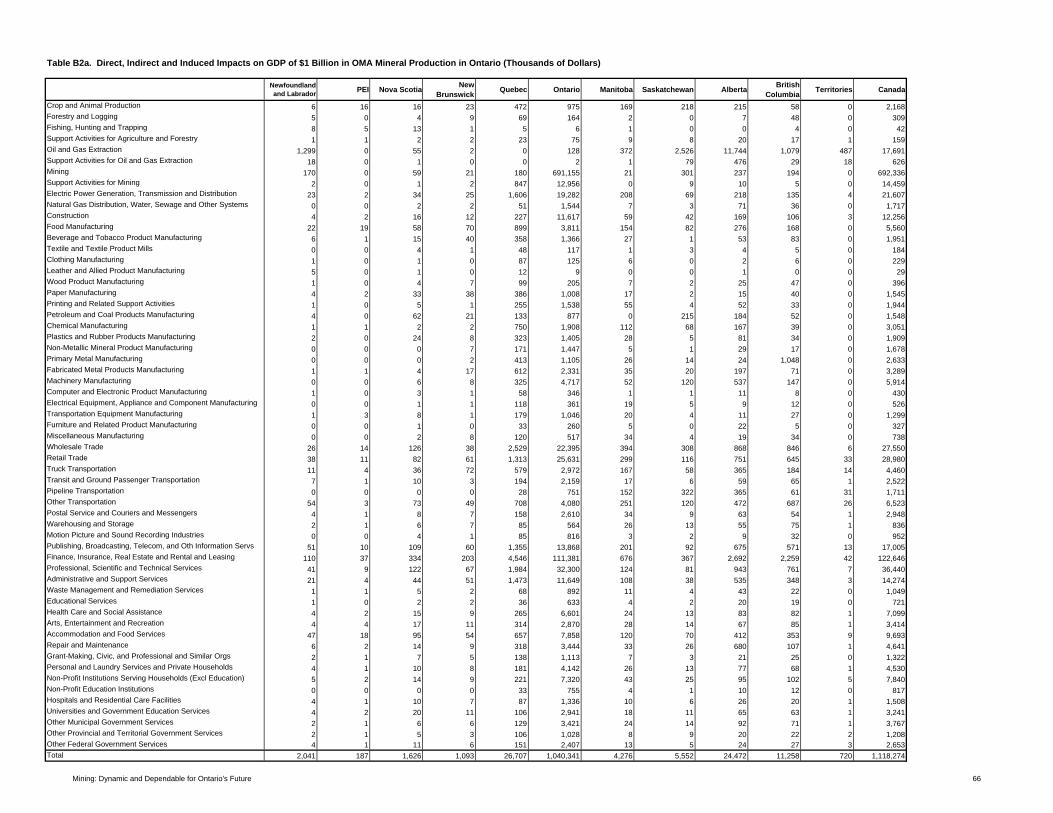
Table B2a. Direct, Indirect and Induced Impacts on GDP of $1 Billion in OMA Mineral Production in Ontario (Thousands of Dollars)
Newfoundland and Labrador PEI Nova Scotia New
Brunswick Quebec Ontario Manitoba Saskatchewan Alberta British Columbia Territories Canada
Crop and Animal Production 6 16 16 23 472 975 169 218 215 58 0 2,168Forestry and Logging 5 0 4 9 69 164 2 0 7 48 0 309Fishing, Hunting and Trapping 8 5 13 1 5 6 1 0 0 4 0 42Support Activities for Agriculture and Forestry 1 1 2 2 23 75 9 8 20 17 1 159Oil and Gas Extraction 1,299 0 55 2 0 128 372 2,526 11,744 1,079 487 17,691Support Activities for Oil and Gas Extraction 18 0 1 0 0 2 1 79 476 29 18 626Mining 170 0 59 21 180 691,155 21 301 237 194 0 692,336Support Activities for Mining 2 0 1 2 847 12,956 0 9 10 5 0 14,459Electric Power Generation, Transmission and Distribution 23 2 34 25 1,606 19,282 208 69 218 135 4 21,607Natural Gas Distribution, Water, Sewage and Other Systems 0 0 2 2 51 1,544 7 3 71 36 0 1,717Construction 4 2 16 12 227 11,617 59 42 169 106 3 12,256Food Manufacturing 22 19 58 70 899 3,811 154 82 276 168 0 5,560Beverage and Tobacco Product Manufacturing 6 1 15 40 358 1,366 27 1 53 83 0 1,951Textile and Textile Product Mills 0 0 4 1 48 117 1 3 4 5 0 184Clothing Manufacturing 1 0 1 0 87 125 6 0 2 6 0 229Leather and Allied Product Manufacturing 5 0 1 0 12 9 0 0 1 0 0 29Wood Product Manufacturing 1 0 4 7 99 205 7 2 25 47 0 396Paper Manufacturing 4 2 33 38 386 1,008 17 2 15 40 0 1,545Printing and Related Support Activities 1 0 5 1 255 1,538 55 4 52 33 0 1,944Petroleum and Coal Products Manufacturing 4 0 62 21 133 877 0 215 184 52 0 1,548Chemical Manufacturing 1 1 2 2 750 1,908 112 68 167 39 0 3,051Plastics and Rubber Products Manufacturing 2 0 24 8 323 1,405 28 5 81 34 0 1,909Non-Metallic Mineral Product Manufacturing 0 0 0 7 171 1,447 5 1 29 17 0 1,678Primary Metal Manufacturing 0 0 0 2 413 1,105 26 14 24 1,048 0 2,633Fabricated Metal Products Manufacturing 1 1 4 17 612 2,331 35 20 197 71 0 3,289Machinery Manufacturing 0 0 6 8 325 4,717 52 120 537 147 0 5,914Computer and Electronic Product Manufacturing 1 0 3 1 58 346 1 1 11 8 0 430Electrical Equipment, Appliance and Component Manufacturing 0 0 1 1 118 361 19 5 9 12 0 526Transportation Equipment Manufacturing 1 3 8 1 179 1,046 20 4 11 27 0 1,299Furniture and Related Product Manufacturing 0 0 1 0 33 260 5 0 22 5 0 327Miscellaneous Manufacturing 0 0 2 8 120 517 34 4 19 34 0 738Wholesale Trade 26 14 126 38 2,529 22,395 394 308 868 846 6 27,550Retail Trade 38 11 82 61 1,313 25,631 299 116 751 645 33 28,980Truck Transportation 11 4 36 72 579 2,972 167 58 365 184 14 4,460Transit and Ground Passenger Transportation 7 1 10 3 194 2,159 17 6 59 65 1 2,522Pipeline Transportation 0 0 0 0 28 751 152 322 365 61 31 1,711Other Transportation 54 3 73 49 708 4,080 251 120 472 687 26 6,523Postal Service and Couriers and Messengers 4 1 8 7 158 2,610 34 9 63 54 1 2,948Warehousing and Storage 2 1 6 7 85 564 26 13 55 75 1 836Motion Picture and Sound Recording Industries 0 0 4 1 85 816 3 2 9 32 0 952Publishing, Broadcasting, Telecom, and Oth Information Servs 51 10 109 60 1,355 13,868 201 92 675 571 13 17,005Finance, Insurance, Real Estate and Rental and Leasing 110 37 334 203 4,546 111,381 676 367 2,692 2,259 42 122,646Professional, Scientific and Technical Services 41 9 122 67 1,984 32,300 124 81 943 761 7 36,440Administrative and Support Services 21 4 44 51 1,473 11,649 108 38 535 348 3 14,274Waste Management and Remediation Services 1 1 5 2 68 892 11 4 43 22 0 1,049Educational Services 1 0 2 2 36 633 4 2 20 19 0 721Health Care and Social Assistance 4 2 15 9 265 6,601 24 13 83 82 1 7,099Arts, Entertainment and Recreation 4 4 17 11 314 2,870 28 14 67 85 1 3,414Accommodation and Food Services 47 18 95 54 657 7,858 120 70 412 353 9 9,693Repair and Maintenance 6 2 14 9 318 3,444 33 26 680 107 1 4,641Grant-Making, Civic, and Professional and Similar Orgs 2 1 7 5 138 1,113 7 3 21 25 0 1,322Personal and Laundry Services and Private Households 4 1 10 8 181 4,142 26 13 77 68 1 4,530Non-Profit Institutions Serving Households (Excl Education) 5 2 14 9 221 7,320 43 25 95 102 5 7,840Non-Profit Education Institutions 0 0 0 0 33 755 4 1 10 12 0 817Hospitals and Residential Care Facilities 4 1 10 7 87 1,336 10 6 26 20 1 1,508Universities and Government Education Services 4 2 20 11 106 2,941 18 11 65 63 1 3,241Other Municipal Government Services 2 1 6 6 129 3,421 24 14 92 71 1 3,767Other Provincial and Territorial Government Services 2 1 5 3 106 1,028 8 9 20 22 2 1,208Other Federal Government Services 4 1 11 6 151 2,407 13 5 24 27 3 2,653Total 2,041 187 1,626 1,093 26,707 1,040,341 4,276 5,552 24,472 11,258 720 1,118,274
Mining: Dynamic and Dependable for Ontario's Future 66
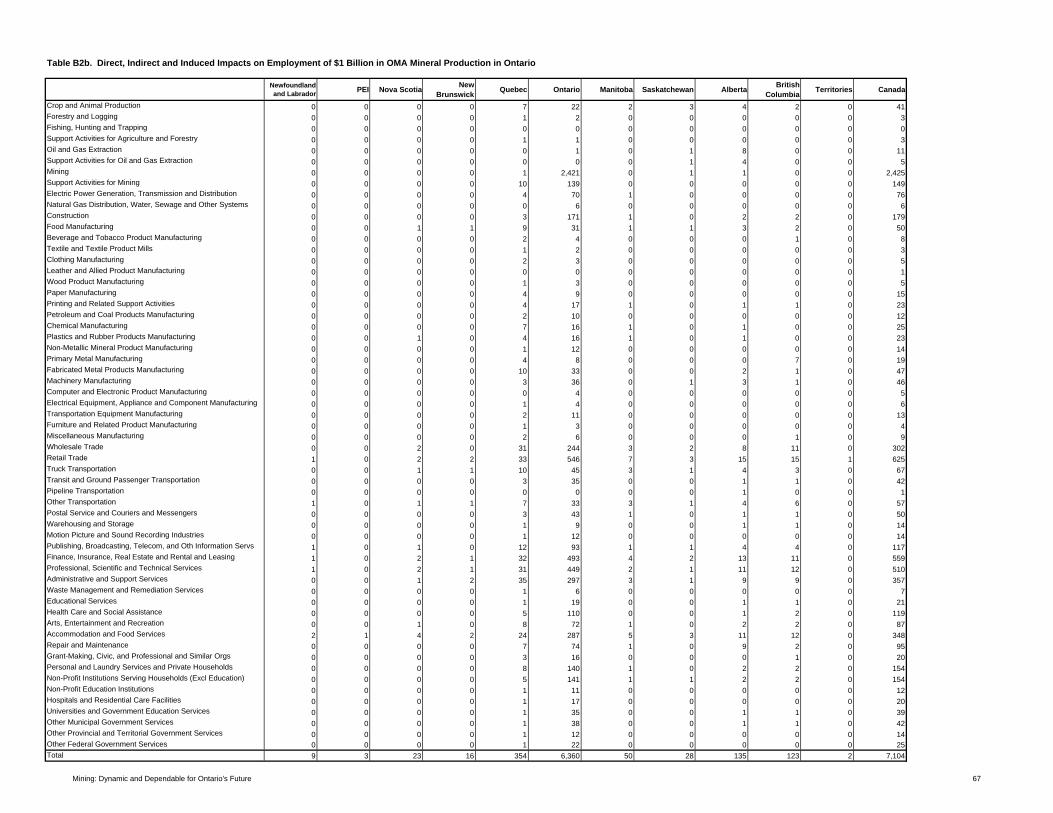
Table B2b. Direct, Indirect and Induced Impacts on Employment of $1 Billion in OMA Mineral Production in Ontario
Newfoundland and Labrador PEI Nova Scotia New
Brunswick Quebec Ontario Manitoba Saskatchewan Alberta British Columbia Territories Canada
Crop and Animal Production 0 0 0 0 7 22 2 3 4 2 0 41Forestry and Logging 0 0 0 0 1 2 0 0 0 0 0 3Fishing, Hunting and Trapping 0 0 0 0 0 0 0 0 0 0 0 0Support Activities for Agriculture and Forestry 0 0 0 0 1 1 0 0 0 0 0 3Oil and Gas Extraction 0 0 0 0 0 1 0 1 8 0 0 11Support Activities for Oil and Gas Extraction 0 0 0 0 0 0 0 1 4 0 0 5Mining 0 0 0 0 1 2,421 0 1 1 0 0 2,425Support Activities for Mining 0 0 0 0 10 139 0 0 0 0 0 149Electric Power Generation, Transmission and Distribution 0 0 0 0 4 70 1 0 0 0 0 76Natural Gas Distribution, Water, Sewage and Other Systems 0 0 0 0 0 6 0 0 0 0 0 6Construction 0 0 0 0 3 171 1 0 2 2 0 179Food Manufacturing 0 0 1 1 9 31 1 1 3 2 0 50Beverage and Tobacco Product Manufacturing 0 0 0 0 2 4 0 0 0 1 0 8Textile and Textile Product Mills 0 0 0 0 1 2 0 0 0 0 0 3Clothing Manufacturing 0 0 0 0 2 3 0 0 0 0 0 5Leather and Allied Product Manufacturing 0 0 0 0 0 0 0 0 0 0 0 1Wood Product Manufacturing 0 0 0 0 1 3 0 0 0 0 0 5Paper Manufacturing 0 0 0 0 4 9 0 0 0 0 0 15Printing and Related Support Activities 0 0 0 0 4 17 1 0 1 1 0 23Petroleum and Coal Products Manufacturing 0 0 0 0 2 10 0 0 0 0 0 12Chemical Manufacturing 0 0 0 0 7 16 1 0 1 0 0 25Plastics and Rubber Products Manufacturing 0 0 1 0 4 16 1 0 1 0 0 23Non-Metallic Mineral Product Manufacturing 0 0 0 0 1 12 0 0 0 0 0 14Primary Metal Manufacturing 0 0 0 0 4 8 0 0 0 7 0 19Fabricated Metal Products Manufacturing 0 0 0 0 10 33 0 0 2 1 0 47Machinery Manufacturing 0 0 0 0 3 36 0 1 3 1 0 46Computer and Electronic Product Manufacturing 0 0 0 0 0 4 0 0 0 0 0 5Electrical Equipment, Appliance and Component Manufacturing 0 0 0 0 1 4 0 0 0 0 0 6Transportation Equipment Manufacturing 0 0 0 0 2 11 0 0 0 0 0 13Furniture and Related Product Manufacturing 0 0 0 0 1 3 0 0 0 0 0 4Miscellaneous Manufacturing 0 0 0 0 2 6 0 0 0 1 0 9Wholesale Trade 0 0 2 0 31 244 3 2 8 11 0 302Retail Trade 1 0 2 2 33 546 7 3 15 15 1 625Truck Transportation 0 0 1 1 10 45 3 1 4 3 0 67Transit and Ground Passenger Transportation 0 0 0 0 3 35 0 0 1 1 0 42Pipeline Transportation 0 0 0 0 0 0 0 0 1 0 0 1Other Transportation 1 0 1 1 7 33 3 1 4 6 0 57Postal Service and Couriers and Messengers 0 0 0 0 3 43 1 0 1 1 0 50Warehousing and Storage 0 0 0 0 1 9 0 0 1 1 0 14Motion Picture and Sound Recording Industries 0 0 0 0 1 12 0 0 0 0 0 14Publishing, Broadcasting, Telecom, and Oth Information Servs 1 0 1 0 12 93 1 1 4 4 0 117Finance, Insurance, Real Estate and Rental and Leasing 1 0 2 1 32 493 4 2 13 11 0 559Professional, Scientific and Technical Services 1 0 2 1 31 449 2 1 11 12 0 510Administrative and Support Services 0 0 1 2 35 297 3 1 9 9 0 357Waste Management and Remediation Services 0 0 0 0 1 6 0 0 0 0 0 7Educational Services 0 0 0 0 1 19 0 0 1 1 0 21Health Care and Social Assistance 0 0 0 0 5 110 0 0 1 2 0 119Arts, Entertainment and Recreation 0 0 1 0 8 72 1 0 2 2 0 87Accommodation and Food Services 2 1 4 2 24 287 5 3 11 12 0 348Repair and Maintenance 0 0 0 0 7 74 1 0 9 2 0 95Grant-Making, Civic, and Professional and Similar Orgs 0 0 0 0 3 16 0 0 0 1 0 20Personal and Laundry Services and Private Households 0 0 0 0 8 140 1 0 2 2 0 154Non-Profit Institutions Serving Households (Excl Education) 0 0 0 0 5 141 1 1 2 2 0 154Non-Profit Education Institutions 0 0 0 0 1 11 0 0 0 0 0 12Hospitals and Residential Care Facilities 0 0 0 0 1 17 0 0 0 0 0 20Universities and Government Education Services 0 0 0 0 1 35 0 0 1 1 0 39Other Municipal Government Services 0 0 0 0 1 38 0 0 1 1 0 42Other Provincial and Territorial Government Services 0 0 0 0 1 12 0 0 0 0 0 14Other Federal Government Services 0 0 0 0 1 22 0 0 0 0 0 25Total 9 3 23 16 354 6,360 50 28 135 123 2 7,104
Mining: Dynamic and Dependable for Ontario's Future 67
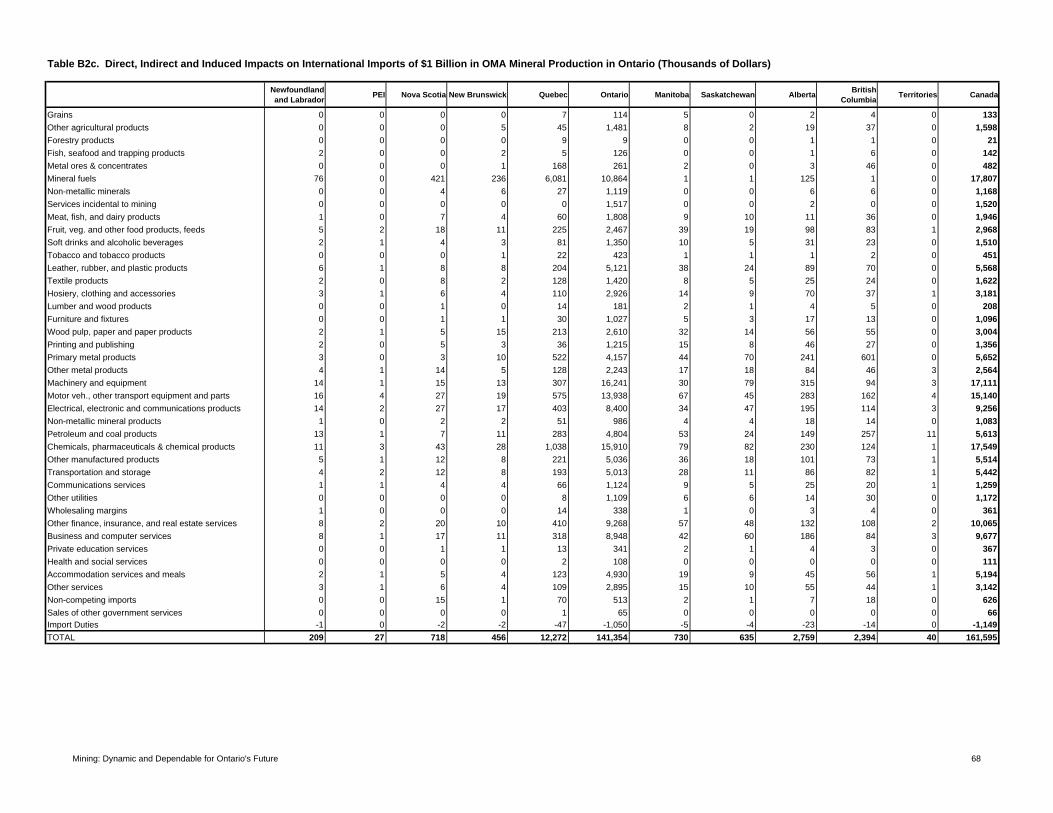
Table B2c. Direct, Indirect and Induced Impacts on International Imports of $1 Billion in OMA Mineral Production in Ontario (Thousands of Dollars)
Newfoundland and Labrador PEI Nova Scotia New Brunswick Quebec Ontario Manitoba Saskatchewan Alberta British
Columbia Territories Canada
Grains 0 0 0 0 7 114 5 0 2 4 0 133Other agricultural products 0 0 0 5 45 1,481 8 2 19 37 0 1,598Forestry products 0 0 0 0 9 9 0 0 1 1 0 21Fish, seafood and trapping products 2 0 0 2 5 126 0 0 1 6 0 142Metal ores & concentrates 0 0 0 1 168 261 2 0 3 46 0 482Mineral fuels 76 0 421 236 6,081 10,864 1 1 125 1 0 17,807Non-metallic minerals 0 0 4 6 27 1,119 0 0 6 6 0 1,168Services incidental to mining 0 0 0 0 0 1,517 0 0 2 0 0 1,520Meat, fish, and dairy products 1 0 7 4 60 1,808 9 10 11 36 0 1,946Fruit, veg. and other food products, feeds 5 2 18 11 225 2,467 39 19 98 83 1 2,968Soft drinks and alcoholic beverages 2 1 4 3 81 1,350 10 5 31 23 0 1,510Tobacco and tobacco products 0 0 0 1 22 423 1 1 1 2 0 451Leather, rubber, and plastic products 6 1 8 8 204 5,121 38 24 89 70 0 5,568Textile products 2 0 8 2 128 1,420 8 5 25 24 0 1,622Hosiery, clothing and accessories 3 1 6 4 110 2,926 14 9 70 37 1 3,181Lumber and wood products 0 0 1 0 14 181 2 1 4 5 0 208Furniture and fixtures 0 0 1 1 30 1,027 5 3 17 13 0 1,096Wood pulp, paper and paper products 2 1 5 15 213 2,610 32 14 56 55 0 3,004Printing and publishing 2 0 5 3 36 1,215 15 8 46 27 0 1,356Primary metal products 3 0 3 10 522 4,157 44 70 241 601 0 5,652Other metal products 4 1 14 5 128 2,243 17 18 84 46 3 2,564Machinery and equipment 14 1 15 13 307 16,241 30 79 315 94 3 17,111Motor veh., other transport equipment and parts 16 4 27 19 575 13,938 67 45 283 162 4 15,140Electrical, electronic and communications products 14 2 27 17 403 8,400 34 47 195 114 3 9,256Non-metallic mineral products 1 0 2 2 51 986 4 4 18 14 0 1,083Petroleum and coal products 13 1 7 11 283 4,804 53 24 149 257 11 5,613Chemicals, pharmaceuticals & chemical products 11 3 43 28 1,038 15,910 79 82 230 124 1 17,549Other manufactured products 5 1 12 8 221 5,036 36 18 101 73 1 5,514Transportation and storage 4 2 12 8 193 5,013 28 11 86 82 1 5,442Communications services 1 1 4 4 66 1,124 9 5 25 20 1 1,259Other utilities 0 0 0 0 8 1,109 6 6 14 30 0 1,172Wholesaling margins 1 0 0 0 14 338 1 0 3 4 0 361Other finance, insurance, and real estate services 8 2 20 10 410 9,268 57 48 132 108 2 10,065Business and computer services 8 1 17 11 318 8,948 42 60 186 84 3 9,677Private education services 0 0 1 1 13 341 2 1 4 3 0 367Health and social services 0 0 0 0 2 108 0 0 0 0 0 111Accommodation services and meals 2 1 5 4 123 4,930 19 9 45 56 1 5,194Other services 3 1 6 4 109 2,895 15 10 55 44 1 3,142Non-competing imports 0 0 15 1 70 513 2 1 7 18 0 626Sales of other government services 0 0 0 0 1 65 0 0 0 0 0 66Import Duties -1 0 -2 -2 -47 -1,050 -5 -4 -23 -14 0 -1,149TOTAL 209 27 718 456 12,272 141,354 730 635 2,759 2,394 40 161,595
Mining: Dynamic and Dependable for Ontario's Future 68

Mining: Dynamic and Dependable for Ontario’s Future 69
Appendix C: Ontario Location of CAMESE Members – By Industry Sub-Sector
Table C1. Industry Sub-Sector Category of CAMESE Member Firms in Ontario,
By City, By Region, 2012-2013
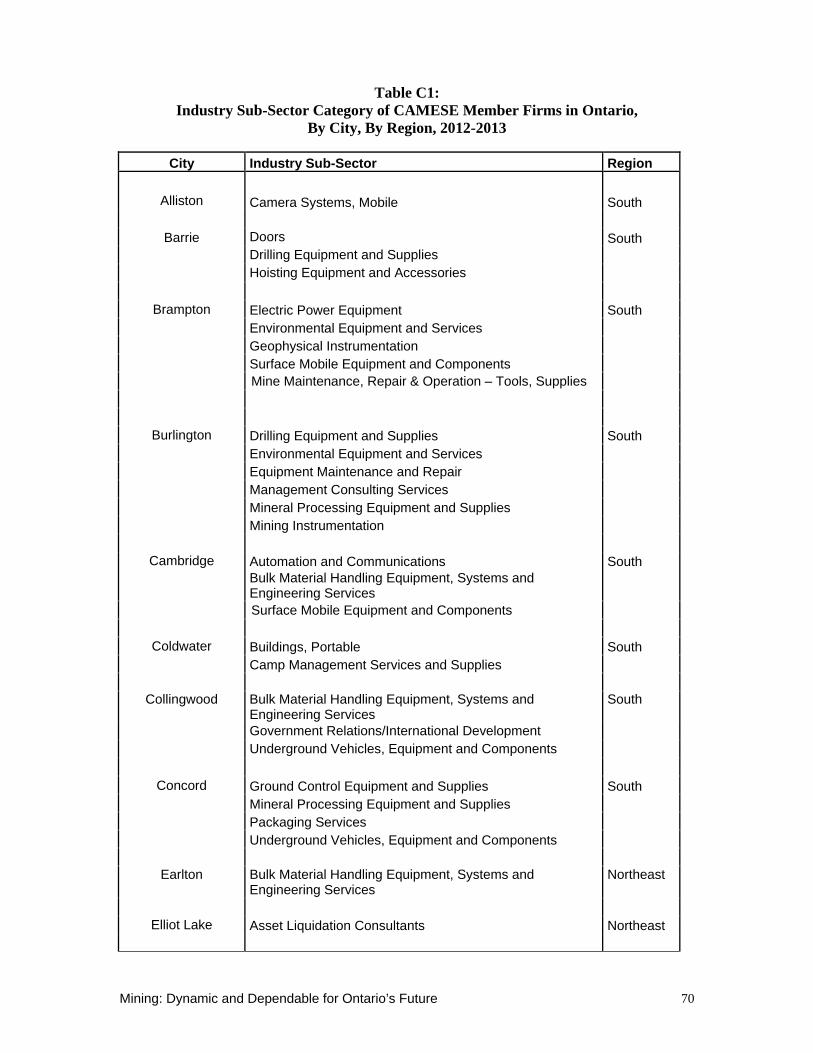
Mining: Dynamic and Dependable for Ontario’s Future 70
Table C1: Industry Sub-Sector Category of CAMESE Member Firms in Ontario,
By City, By Region, 2012-2013
City Industry Sub-Sector Region
Alliston Camera Systems, Mobile South
Barrie Doors South Drilling Equipment and Supplies Hoisting Equipment and Accessories
Brampton Electric Power Equipment South Environmental Equipment and Services Geophysical Instrumentation Surface Mobile Equipment and Components Mine Maintenance, Repair & Operation – Tools, Supplies
Burlington Drilling Equipment and Supplies South Environmental Equipment and Services Equipment Maintenance and Repair Management Consulting Services Mineral Processing Equipment and Supplies Mining Instrumentation
Cambridge Automation and Communications South
Bulk Material Handling Equipment, Systems and Engineering Services
Surface Mobile Equipment and Components
Coldwater Buildings, Portable South Camp Management Services and Supplies
Collingwood Bulk Material Handling Equipment, Systems and Engineering Services
South
Government Relations/International Development Underground Vehicles, Equipment and Components
Concord Ground Control Equipment and Supplies South Mineral Processing Equipment and Supplies Packaging Services Underground Vehicles, Equipment and Components
Earlton Bulk Material Handling Equipment, Systems and Engineering Services
Northeast
Elliot Lake Asset Liquidation Consultants Northeast
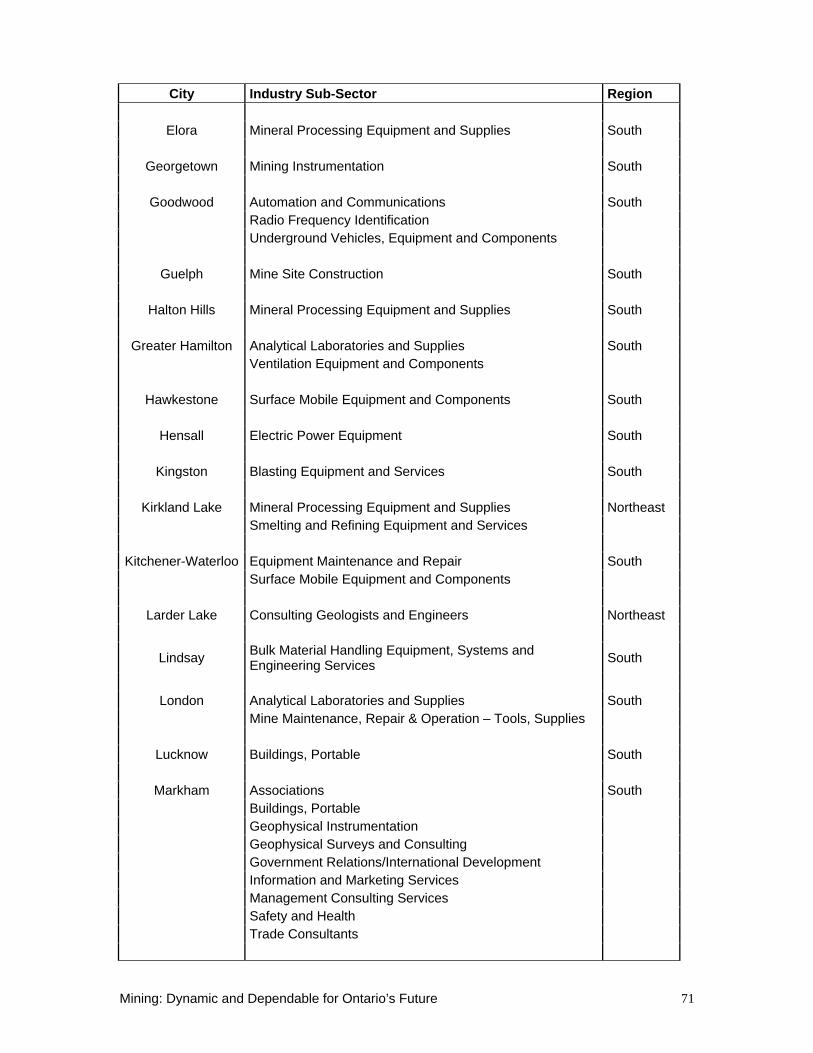
Mining: Dynamic and Dependable for Ontario’s Future 71
City Industry Sub-Sector Region
Elora Mineral Processing Equipment and Supplies South
Georgetown Mining Instrumentation South
Goodwood Automation and Communications South Radio Frequency Identification Underground Vehicles, Equipment and Components
Guelph Mine Site Construction South
Halton Hills Mineral Processing Equipment and Supplies South
Greater Hamilton Analytical Laboratories and Supplies South Ventilation Equipment and Components
Hawkestone Surface Mobile Equipment and Components South
Hensall Electric Power Equipment South
Kingston Blasting Equipment and Services South
Kirkland Lake Mineral Processing Equipment and Supplies Northeast Smelting and Refining Equipment and Services
Kitchener-Waterloo Equipment Maintenance and Repair South Surface Mobile Equipment and Components
Larder Lake Consulting Geologists and Engineers Northeast
Lindsay Bulk Material Handling Equipment, Systems and Engineering Services South
London Analytical Laboratories and Supplies South
Mine Maintenance, Repair & Operation – Tools, Supplies
Lucknow Buildings, Portable South
Markham Associations South Buildings, Portable Geophysical Instrumentation Geophysical Surveys and Consulting Government Relations/International Development Information and Marketing Services Management Consulting Services Safety and Health Trade Consultants
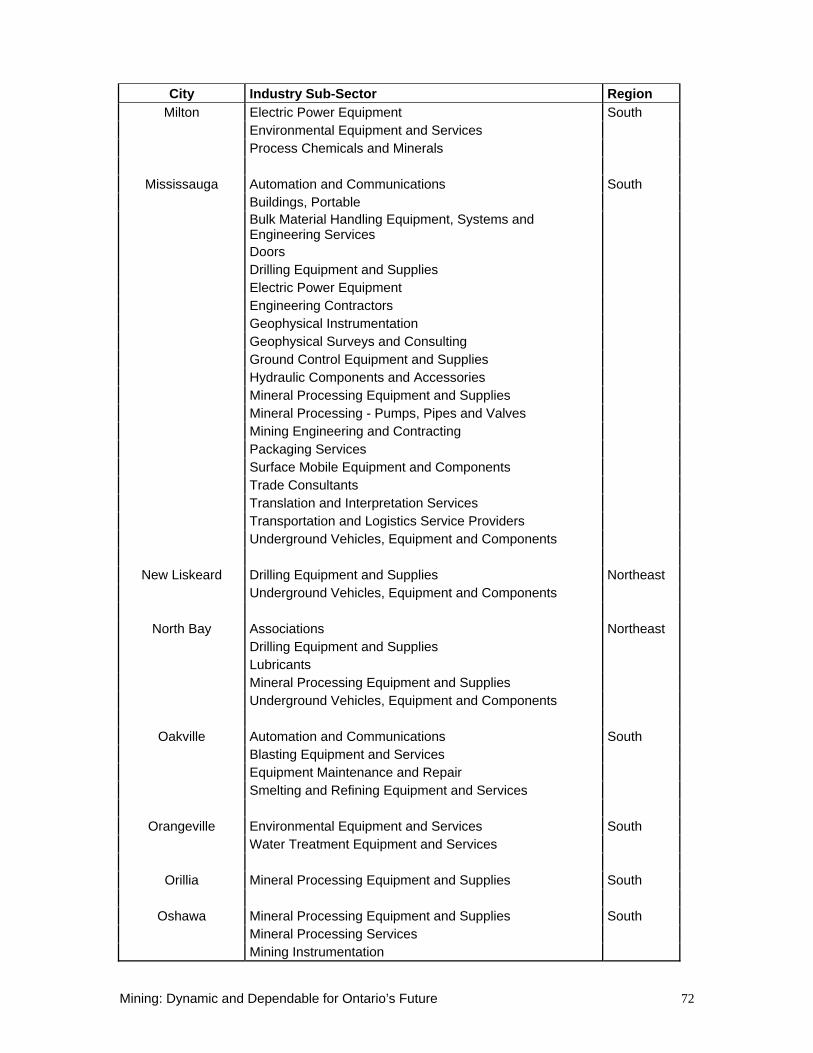
Mining: Dynamic and Dependable for Ontario’s Future 72
City Industry Sub-Sector Region Milton Electric Power Equipment South
Environmental Equipment and Services Process Chemicals and Minerals
Mississauga Automation and Communications South Buildings, Portable
Bulk Material Handling Equipment, Systems and Engineering Services
Doors Drilling Equipment and Supplies Electric Power Equipment Engineering Contractors Geophysical Instrumentation Geophysical Surveys and Consulting Ground Control Equipment and Supplies Hydraulic Components and Accessories Mineral Processing Equipment and Supplies Mineral Processing - Pumps, Pipes and Valves Mining Engineering and Contracting Packaging Services Surface Mobile Equipment and Components Trade Consultants Translation and Interpretation Services Transportation and Logistics Service Providers Underground Vehicles, Equipment and Components
New Liskeard Drilling Equipment and Supplies Northeast Underground Vehicles, Equipment and Components
North Bay Associations Northeast Drilling Equipment and Supplies Lubricants Mineral Processing Equipment and Supplies Underground Vehicles, Equipment and Components
Oakville Automation and Communications South Blasting Equipment and Services Equipment Maintenance and Repair Smelting and Refining Equipment and Services
Orangeville Environmental Equipment and Services South Water Treatment Equipment and Services
Orillia Mineral Processing Equipment and Supplies South
Oshawa Mineral Processing Equipment and Supplies South Mineral Processing Services Mining Instrumentation
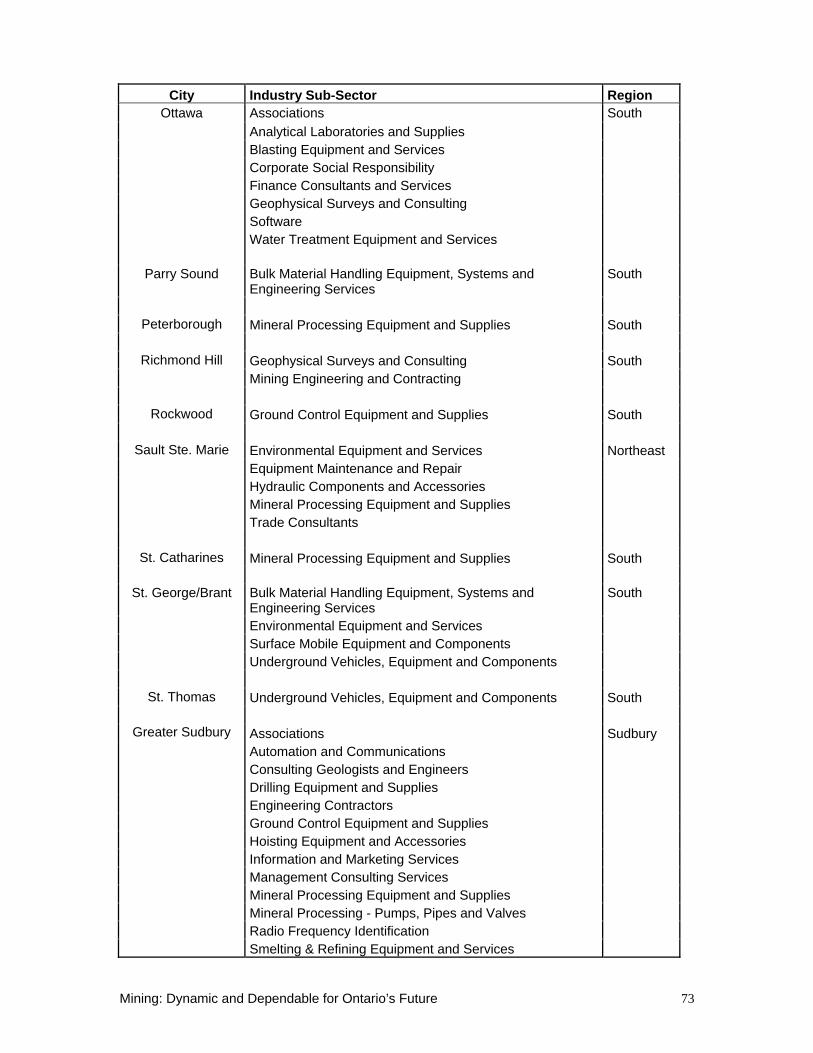
Mining: Dynamic and Dependable for Ontario’s Future 73
City Industry Sub-Sector Region Ottawa Associations South
Analytical Laboratories and Supplies Blasting Equipment and Services Corporate Social Responsibility Finance Consultants and Services Geophysical Surveys and Consulting Software Water Treatment Equipment and Services
Parry Sound Bulk Material Handling Equipment, Systems and Engineering Services
South
Peterborough Mineral Processing Equipment and Supplies South
Richmond Hill Geophysical Surveys and Consulting South
Mining Engineering and Contracting
Rockwood Ground Control Equipment and Supplies South
Sault Ste. Marie Environmental Equipment and Services Northeast Equipment Maintenance and Repair Hydraulic Components and Accessories
Mineral Processing Equipment and Supplies Trade Consultants
St. Catharines Mineral Processing Equipment and Supplies South
St. George/Brant Bulk Material Handling Equipment, Systems and Engineering Services
South
Environmental Equipment and Services Surface Mobile Equipment and Components Underground Vehicles, Equipment and Components
St. Thomas Underground Vehicles, Equipment and Components South
Greater Sudbury Associations Sudbury Automation and Communications Consulting Geologists and Engineers Drilling Equipment and Supplies Engineering Contractors Ground Control Equipment and Supplies Hoisting Equipment and Accessories Information and Marketing Services Management Consulting Services Mineral Processing Equipment and Supplies Mineral Processing - Pumps, Pipes and Valves Radio Frequency Identification Smelting & Refining Equipment and Services
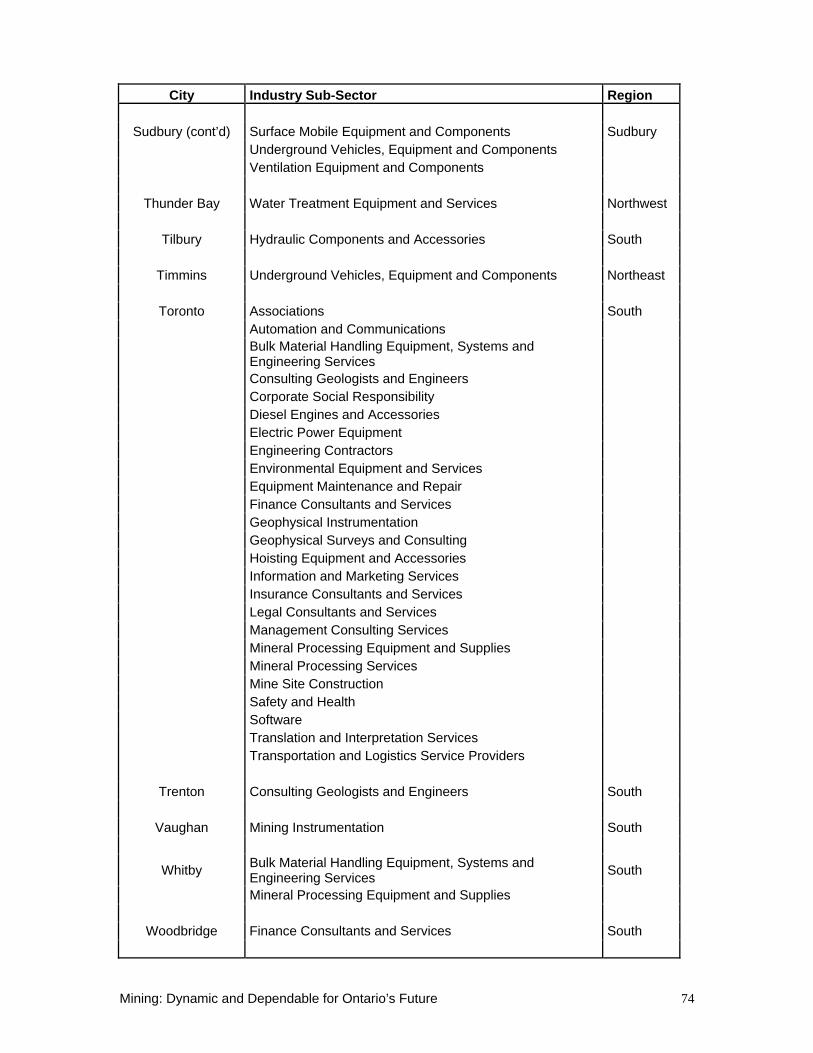
Mining: Dynamic and Dependable for Ontario’s Future 74
City Industry Sub-Sector Region
Sudbury (cont’d) Surface Mobile Equipment and Components Sudbury Underground Vehicles, Equipment and Components Ventilation Equipment and Components
Thunder Bay Water Treatment Equipment and Services Northwest
Tilbury Hydraulic Components and Accessories South
Timmins Underground Vehicles, Equipment and Components Northeast
Toronto Associations South Automation and Communications
Bulk Material Handling Equipment, Systems and Engineering Services
Consulting Geologists and Engineers Corporate Social Responsibility Diesel Engines and Accessories Electric Power Equipment Engineering Contractors Environmental Equipment and Services Equipment Maintenance and Repair Finance Consultants and Services
Geophysical Instrumentation Geophysical Surveys and Consulting Hoisting Equipment and Accessories Information and Marketing Services Insurance Consultants and Services Legal Consultants and Services Management Consulting Services Mineral Processing Equipment and Supplies
Mineral Processing Services Mine Site Construction Safety and Health Software Translation and Interpretation Services Transportation and Logistics Service Providers
Trenton Consulting Geologists and Engineers South
Vaughan Mining Instrumentation South
Whitby Bulk Material Handling Equipment, Systems and Engineering Services South
Mineral Processing Equipment and Supplies
Woodbridge Finance Consultants and Services South