Embed Size (px)
Citation preview

Mining and Managing User-Generated Contentand Preferences
Georgios Valkanas?
National and Kapodistrian University of AthensDepartment of Informatics and Telecommunications
Abstract. Capturing users preferences in today’s web ecosystem is es-sential to provide engaging services. In this thesis, we propose variousways that take user preferences into account. Skyline queries are a char-acteristic example. However, a problem is that the result size may be toolarge. To address this issue we propose techniques to diversify it, whichis an NP-Hard problem and propose efficient approximate solutions. Al-ternatively, users describe their experiences with a product or service,and what aspects they liked (or did not) in online reviews. Using thisinformation, we propose techniques to identify competitive products. Wepresent a formal framework for the identification of competitors, whichwe evaluate extensively and demonstrated its efficiency and efficacy. Fi-nally, users post their preferences and interests online, in social mediaplatforms. Social media data can be used to identify events that occur inthe physical world. However, given the domain’s particularities, straight-forward solutions do not perform well. Therefore, we resort to affectivetheories of emotion from psychology. Using these theories as a startingpoint, we monitor the aggregate emotional state of large, geographicalgroups of people and automatically identify abrupt changes, linking themto the underlying events. We develop i) custom geocoding techniques, ii)a classification framework mapping social data to emotions, iii) an onlineoutlier detection algorithm to identify abrupt changes, and iv) a visualcomponent to ease the presentation of events.
Keywords: web mining, review mining, event detection, user prefer-ences
1 Dissertation Summary
The World Wide Web has changed dramatically over the years since its initialinception, and is still evolving as new technologies emerge. Online services andapplications are more pervasive nowadays, allowing users to share online aspectsof their everyday lives. More importantly, users feel comfortable with doing so,which is a major shift in their attitude regarding privacy in digital environments.This general change in behavior has made the boundaries between the physicaland online world less transparent.
? Dissertation Advisor: Dimitrios Gunopulos, Professor
Sharing of information takes place in various forms. The common denomi-nator is that users express their preferences and personal opinions on varioustopics, such as music, products, politics, etc. Although new technologies providethe necessary framework(s) for the users to express themselves, novel techniquesare required to turn the available data into useful and actionable information.Such a need translates into interesting and challenging research questions, whichwe have to address, in order to provide the next generation services. For instance,more expressive query types are needed, whereby user preferences can be takeninto account. At the same time, we should develop techniques that extract mean-ingful and insightful information from this high-volume, user-generated content.
Skyline queries are an indicative example. These queries support multi-objec-tive optimization and are geared towards returning items with different trade-offs. Although easier to understand (from the user’s perspective), given thatpreferences are defined on each attribute separately, the output size can becomeextremely large. It would, then, be very tedious for the user to inspect all theresults manually and soem post-processing of the results is necessary.
One way to address this problem is to incorporate additional constraints inthe result selection process. For example, we can select a subset of skyline pointsthat meet certain criteria or that optimize a given objective function. Diver-sifying the skyline result is one such approach, which is also highly desirableconsidering that skyline queries aim to return points with trade-offs [26]. Select-ing a subset of the skyline points has been looked into in the past, with differentgoals in mind. In particular, the work in [12] proposed the selection of k sky-line points that maximize the coverage of the space. Another approach selectedk points that best describe the skyline contour [17], which could be seen as adiversification approach of the skyline result. However, in this thesis we demon-strated that coverage solves a different problem from diversification. Moreover,the technique in [17] assumes an underlying Euclidean space, which is not al-ways the case for skyline queries. Therefore, that technique becomes unusablein non-Euclidean spaces, in partially-ordered domains or in feature spaces withnon numerical attributes, where skyline queries are still meaningful. In addition,the result of [17] may change depending on the weights of each feature, whichnegates the axis-weighting invariance property of skyline queries. Finally, as wedemonstrated in our thesis, the subset of skyline points selected by [17] correlatemore with coverage than with diversity.
Ranking the skyline points could be another approach, giving them a degreeof importance and returning them in an ordered fashion. Ranking the skylinehas been the focus of past research [29, 6, 31]. However, these techniques face oneof two problems: i) they may return points that are not part of the skyline [31]or ii) they return skyline points with extreme values in a single dimension [29,6]. The latter techniques also consider an exponentially large search space, giventhat they take into account all non-empty feature subspaces (at most O(2d),where d is the number of considered dimensions). To counter these problems, wepropose to rank skyline points using a novel technique, inspired by InformationRetrieval. In particular, we adapt the well known Term Frequency-Inverse Doc-
ument Frequency (TF-IDF) scheme to the skyline domain, and propose efficienttechniques to rank skyline points accordingly [27].
User feedback can be provided in other formats as well, such as semi-structuredand free text. Online reviews fall under the second category, and has received con-siderable attention in recent years. This increased attention is due to the impactthat reviews have in the marketability of products. In fact, surveys have shownthat users prefer products that have already been reviewed, so that they knowthe item’s pros and cons, and can, therefore, make informed decisions. Througha combination of user feedback and product specifications, we can derive a rigidframework to analyze and compare such products.
More specifically, based on the users’ needs - as expressed in their feedback -and the extent to which a product can cover similar needs - given by its charac-teristics -, we can identify how competitive two products are. This is extremelyuseful for both item producers (e.g., the companies), as well as item consumers(e.g., the end users). Despite its importance, a formal framework to identifycompetitive items had been largely missing until now. The recent availability ofonline reviews has allowed us to test both the efficiency and efficacy of techniquesthat return the top-k most competitive products, with respect to a given item ofinterest [10].
Previous works on competitor identification has focused on the retrieval ofcomparative expressions, such as “X is better / worse than Y ”, or “(product)vs (product) Y ” [2, 11]. The underlying assumption is that if two products co-occur frequently in such expressions, they are more competitive, as opposed toproducts that occur less frequently. The problem with this approach is that,oftentimes, there is a scarcity of such expressions, making our confidence in thedrawn results quite weak. Additionally, these approaches are only useful whena product is compared as a whole, whereas users may discuss certain featuresof a product in their reviews. For these reasons, in this thesis we propose arigid framework, utilizing both product specifications as well as user feedback atthe feature-level. Competitiveness is then measured as the degree to which twoproducts fulfill the same needs of groups of people with similar requirements. Wepresent techniques to efficiently retrieve the top-k competitors of a given item,and evaluate our method’s efficacy using a user study. Our results demonstratethat our techniques are very efficient, and that our model aligns well with users’intuition of competitiveness.
Finally, despite the sharp increase in numbers of online reviews over theyears, these are nowhere near the data volume produced in social media. Pop-ular social media platforms have extremely high user adoption, with Facebookboasting more than 1.28 billion active users per month (as of March 31, 2014),and Twitter - a later founded company - having more than 255 million activeusers per month (as of July 2014). A driving force of these frameworks is theirnetworking component, with people linking to one another, as a prerequisite toshare information. Undoubtedly, social media is among the most prolific areasfor research nowadays, not only because of the user adoption, but also due tothe usefulness of the data in various diverse disciplines: computer science, psy-
chology, sociology and journalism to name a few. Moreover, there are practicalapplications where the data can be used. Advertising and community detectionare typical use cases, whereas (real-time) event detection, interaction analysis,and user behavior understanding increasingly gain attention. Making sense ofthe user-genereated content in these mediums is also extremely challenging, be-cause of the data volume and content diversity, which is as high as the underlyingpopulation and their interests.
As a first objective, we wanted to explore the properties of data posted insocial media platforms, to better understand the kind of information we aredealing with. Towards this direction, a major outcome of this thesis is to showthat elevated access is primarily needed for applications that rely heavily on up-to-date information and do not only focus on popular items. Applications thatonly deal with popular items, can be well served through default access [24].
The fast pace of social media platforms is a key factor in considering themas online news reporting tools. However, mining high volumes of data to iden-tify (newsworthy) events is far from trivial. Previous techniques have focusedon event monitoring, implying that the event is already identified or somehowknown [13]. Others simplify the problem by searching for specific keywords,which can accurately describe the event [16]. Online clustering techniques havealso been explored [3, 30], however, they do not perform well in fast-paced medi-ums [20]. It is easy to see that identifying events, regardless of type and withoutprior knowledge of any descriptive keywords, calls for a different approach.
For this reason, we resort to psychological theories, according to which eventsimpact the user psychologically, and more specifically their affective state, com-pelling them to externalize their thoughts. We argue that newsorthy events willimpact large groups of users, and by monitoring a group’s aggregate affective /emotional state, we will be able to capture abrupt changes and trace them backto the source, i.e., the event.
Within this research question, however, there are several other issues to re-solve. In particular, we must identify an event’s location, so we develop customgeocoding techniques, that convert textual information to GPS coordinates [18].Extracting the affective state of a single user is challenging on its own, let alonefor an entire group. We solve this problem through a classification framework,mapping social media data to a set of predefined basic emotions [19]. Capturingabrupt changes requires a careful formulation of the problem, as well as efficientcomputation techniques, due to the high volumes of real-time data we are dealingwith. We formulate this problem as an instance of online outlier detection andpropose online techniques that approximate the Probability Density Function(PDF) of the aggregate emotional state [20]. Information visualization is alsoimportant in that domain, to better explain an occuring event. Therefore, wepropose a User Interface that presents all of the information in an appropriateway [21]. Such an approach also requires a great deal of system and softwareengineering, and end-to-end solutions could also be used to facilitate the dataharvesting process [25, 23, 28].

2 Results and Discussion
2.1 Skyline Diversification
Let D be a d-dimensional dataset, where w.l.o.g. smaller values are preferred,i.e., we are interested in minimizing each attribute. 1 We say that p = (p.x1,..., p.xd) ∈ D dominates q = (q.x1, ..., q.xd) ∈ D (and write p ≺ q), when:∀i ∈ 1, ..., d, p.xi ≤ q.xi ∧ ∃j ∈ 1, ..., d : p.xj < q.xj . The skyline S ⊆ D, iscomposed of all points in D that are not dominated by any other point.
To overcome the limitations of a Euclidean space assumption, we proposeto use the Jaccard distance for diversity computation. Each skyline point p isassociated with the set of points that it dominates, denoted by Γ (p) = q ∈D|p ≺ q. The domination score of p is the cardinality of Γ (p). The similaritybetween p and q is defined as the Jaccard similarity between the sets Γ (p) andΓ (q), i.e.,
Js(p, q) =|Γ (p) ∩ Γ (q)||Γ (p) ∪ Γ (q)|
and ranges between 0 and 1. The corresponding distance measure is thus Jd(p, q) =1− Js(p, q) and it is well known that it satisfies all metric properties. We selectthe Jaccard distance as a measure of diversity because:
i) it relies solely on the dominance relations among points, therefore, no user-defined distance function or other input is required,
ii) the quality of the resulting set of points does not depend on the skyline Salone, but on the characteristics of D as well
iii) it leads to elegant ways of diversity computation by means of min-wise in-dependent permutations, and
iv) it is the most widely accepted measure for set (dis)similarity.
We model k-diversity as a k-dispersion problem, which is NP-Hard [9]. Ink-dispersion, the goal is to find k objects that optimize an objective function oftheir distance. The optimal solution is given by:
OPT = arg maxA⊆S|A|=k
f(A)
There are two basic alternatives for the objective function: i) maximize the sumof distances (k-MSDP) and ii) maximize the minimum distance (k-MMDP).Although both alternatives are valid, we choose to work with k-MMDP becausei) it leads to 2-approximation algorithms, instead of the 4-approximation ofk-MSDP [15], and ii) it intuitively returns results of better quality.Given theNP-Hardness of the problem, we resort to approximate solutions. In fact, thegreedy approach can be quite inefficient, due to a large number of range queries.Therefore, we propose the use of the MinHashing technique [5], that transforms
1 We focus on numerical attributes for ease of presentation. Our approach applies tocategorical ones equally well.

the original space into a more compact one, where computations are much faster.In particular, we develop the SkyDiver framework, which operates in two phases.
Phase 1: Fingerprinting. This phase generates a signature of reduced sizefor each skyline point, based on MinHashing. Alternatively, we can use LocalitySensitive Hashing (LSH) as a memory efficient alternative.
Phase 2: Selection. This phase is responsible for selecting the k most diverseskyline points, and can be applied to either the MinHash or the LSH signatures.
Assume that the data set is viewed as a matrix M with n − m rows andm columns, m = |S| and n = |D|. Each skyline point is represented by a sin-gle column, whereas a dominated point is represented by a row. In this matrix,M [i, j] = 1 iff the j-th skyline point dominates the i-th data point and 0 other-wise. Let H = h1, ..., ht be a set of t min-wise independent hash functions,where each hi performs a random permutation of the rows. The cardinality of H(i.e., the number of hash functions used) determines the size of each signature.To generate random permutations, each hash function hi ∈ H is of the form
hi(x) = ai · x+ bi mod P
where P is a prime number larger than n −m and ai, bi are randomly chosenconstants taking integer values in [1, P ]. According to [5], if Js(p, q) is the Jaccardsimilarity between skyline points p and q, then for each hash function hi it holds
Prob[hi(p) = hi(q)] = Js(p, q).
Recall that each row of the matrix M is a bit-array. If M [i, j] = 1 then theSj ≺ Di. Each row is hashed t times, by every hi ∈ H and the signature of eachskyline point is updated accordingly. Therefore, each signature is composed oft integer values. According to [7], if Ω(ε−3β−1 log(1/δ)) is the signature size,where ε is the maximum allowed error (0 < ε < 1), then with probability atleast 1− δ it holds
(1− ε)Js(p, q) + εβ ≤ Js(p, q) ≤ (1 + ε)Js(p, q) + εβ
where 0 < β < 1 is the required precision.Given the signature matrix M , we can select the k skyline points in the
transformed space, which is a metric space. Therefore we can use the greedyapproach on the signatures and acquire a 2-approximation solution. However,due to distance distortions, as a result of embedding the distances in lowerdimensionality (through MinHashing), it is possible to obtain a sub-optimalsolution. The following theorem relates the true optimal solution, to the onecomputed by working with MinHash signatures.
Theorem 1. Let OPT be the value of the optimal solution to the k-diversityproblem in the original space and let x, y denote the corresponding skyline points,
i.e., Jd(x, y) = OPT . Similarly, let OPT be the optimal value if the problemis solved using MinHash signatures and let a, b be the corresponding skyline
points, i.e., Jd(a, b) = OPT . For a given ε and sufficiently small δ, it holds that:Jd(a, b) ≥ 1+ε
1−εOPT −2ε1−ε .
2.2 Competitor Mining
Competitiveness is a challenge that every product or service provider has to face,regardless of the application domain. A significant amount of relevant work hasdemonstrated the strategic importance of identifying and monitoring an entity’scompetitors [14]. In this thesis we focus on a formal framework for competitoridentification:
Problem 1. We are given a set of items I, defined within the feature space Fof a particular domain. Then, given any pair of items I, I ′ from I we want todefine a function CF (I, I ′) that computes the competitiveness between the twoin the context of the domain.
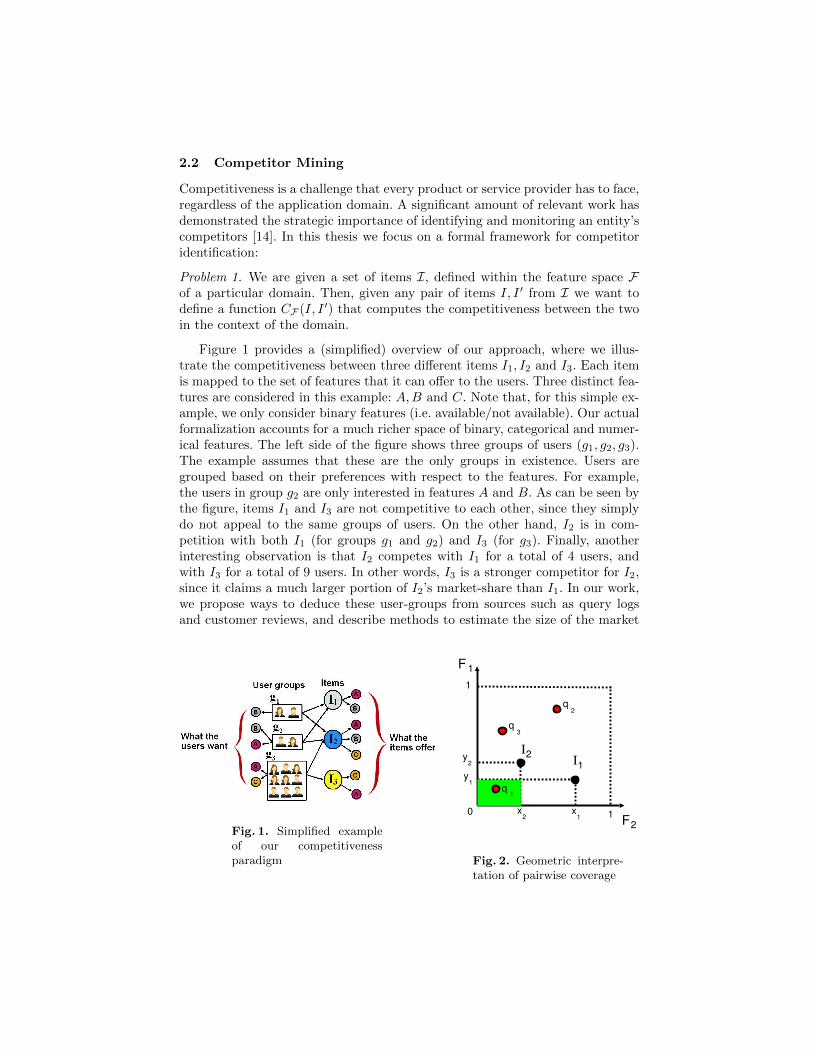
Figure 1 provides a (simplified) overview of our approach, where we illus-trate the competitiveness between three different items I1, I2 and I3. Each itemis mapped to the set of features that it can offer to the users. Three distinct fea-tures are considered in this example: A,B and C. Note that, for this simple ex-ample, we only consider binary features (i.e. available/not available). Our actualformalization accounts for a much richer space of binary, categorical and numer-ical features. The left side of the figure shows three groups of users (g1, g2, g3).The example assumes that these are the only groups in existence. Users aregrouped based on their preferences with respect to the features. For example,the users in group g2 are only interested in features A and B. As can be seen bythe figure, items I1 and I3 are not competitive to each other, since they simplydo not appeal to the same groups of users. On the other hand, I2 is in com-petition with both I1 (for groups g1 and g2) and I3 (for g3). Finally, anotherinteresting observation is that I2 competes with I1 for a total of 4 users, andwith I3 for a total of 9 users. In other words, I3 is a stronger competitor for I2,since it claims a much larger portion of I2’s market-share than I1. In our work,we propose ways to deduce these user-groups from sources such as query logsand customer reviews, and describe methods to estimate the size of the market
Fig. 1. Simplified exampleof our competitivenessparadigm
F 1
F2
I12y
1y
2x
1x
I2
1q
2q
3q
1
10
Fig. 2. Geometric interpre-tation of pairwise coverage

share that they represent. Our work is the first to utilize the opinions expressedin customer reviews as a resource for mining competitiveness.
In order to evaluate the competitiveness of two given items Ii, Ij in thecontext of a subset of features F ′, we need to compute the number of possiblevalue assignments over F ′ that are satisfied by both items. Formally, we definepairwise coverage as follows:
Definition 1. [Pairwise Coverage] Given the complete set of features F in adomain of interest, let VF ′ be the complete space of all possible value-assignmentsover the features in a subset F ′ ⊆ F . Then, the coverage cov(VF ′ , Ii, Ik) of apair of items Ii and Ij with respect to VF ′ is defined as the portion of VF ′ thatis covered by both items.
Considering the above definition, we observe that the coverage of each dimen-sion (i.e. each feature F ∈ F ′) is independent of the others. Therefore, we firstcompute the percentage of each dimension that is covered by the pair. We canthen optimally compute the coverage of the entire space VF ′ as the product ofthe respective coverage values VF for every F ∈ F ′. Formally:
cov(VF ′ , Ii, Ij) =∏
F∈F ′
cov(VF, Ii, Ij) (1)
This computation has a clear geometric interpretation: The portion of the spaceVF ′ that is covered by a pair of items can be represented as a hyper-rectanglein |F ′|-dimensional space. For each dimension F , cov(VF, Ii, Ij) gives us theportion of the dimension that is covered by the two items. Finally, by multi-plying the individual coverage values, we are essentially computing the volumeof the hyper-rectangle that represents the entire space VF ′ . This is graphicallyportrayed in Figure 2, which shows the common coverage of two items I1, I2(green area) in the context of a dimensional space F1, F2.
Definition 1 allows us to evaluate the coverage provided by a pair of itemsto (the value space of) any subset of features F ′. Conceptually, F ′ capturesthe fraction of the population that is interested in the features included in F ′.Further, we define Q to be the collection of subsets with a non-zero weight.Formally: Q = F ′ ∈ 2F : w(F ′) > 0. Taking the above into consideration, weformally define the competitiveness of two items Ii, Ii as follows:
Definition 2. [Competitiveness] Given the complete set of features F of adomain of interest, let Q be the set of all subsets of F that have a non-zeropopularity weight. Then, the competitiveness of two given items Ii and Ii isdefined as:
CF (Ii, Ij) =∑F ′∈Q
w(F ′)× cov(VF ′ , Ii, Ij) (2)
where cov(VF ′ , Ii, Ij) is the portion of VF ′ that is covered by both Ii and Ij.
Given this definition of competitiveness, we study the natural problem offinding the top-k competitors of a given item I∗:

Problem 2. We are given a set of items I, defined within the feature space F ofa domain. Then, given a single item I ∈ I, we want to identify the k items fromI \ I, that maximize the pairwise competitiveness with I:
I∗ = argmaxI′∈I\I
CF (I, I ′) (3)
Instead of finding the top-k competitors using a naive solution that iteratesover all items, computes their competitiveness with respect to I∗ and finally or-ders them, we develop a more efficient technique, namely CMiner. Our algorithmmakes use of an indexing scheme, called the Dominance Pyramid, which is builtbased on the dominance property of items, as discussed in the skyline section.It also applies very efficient pruning on the search space, by bounding the scoreof candidate points. Building upon a result from [4], in this thesis, we show thatthe algorithmic complexity of our technique is O( |I| * |Q| * k2 ), where Q isthe set of feature subsets with non-zero weights 2.
2.3 Event Detection
Our objective with social media data 3 can be summarized as follows:
Problem 3. [Event Detection] Given a time ordered stream of tweets, identifythose posts which i) alter significantly and abruptly the emotional state of a(potentially) large group of users, and ii) can be traced back to event e.
Event Extraction Workflow The problem we described fits nicely with anoutlier detection definition. Figure 3 shows a schematic overview of our system 4
2 This is to retrieve the top-k competitors of every item in the dataset3 We focus on Twitter, http://twitter.com4 Storage image by Barry Mieny, under CC BY-NC-SA license.
Fig. 3. Schematic interaction of our system’s components

used to identify events. The Twitter stream is our input, feeding two components,namely the emotions classifier and the location extraction subsystem. Througha custom geocoding component [18], each incoming tweet is mapped to a GPSlocation, which will also be the location of the event (assuming one occurs).
We classify tweets to 6 basic emotions, proposed by American psychologistPaul Ekman [8]: anger, fear, disgust, happiness, sadness, surprise, plus a neutralone (none), to describe the absence of an emotion. Tweets with non-neutral emo-tions are further processed by virtual sensors, one per location and per emotion.Virtual sensors count how many tweets they have received during the last aggre-gation interval a (system parameter). These values form the aggregate emotionalstate, which are fed to the event detection mechanism. By operating over thew most recent values, the event detection module approximates their distribu-tion using non-parametric models (kernel estimators in particular), estimatingthe Probability Density Function (PDF). The same models are used for eventdetection, identifying tuples which are outside of the norm over the most recenthistory of tuples, given by the combination of (a, w) parameters.
The Temporal Nature of Twitter Discussions Using a large crawl of Twit-ter data (2 month period), we evaluated the behavior of the medium and ourevent extraction approach. In particular, we computed the number of times a“trigger” was raised (which corresponds to an individual event in our case). Fig-ure 4 shows the number of times our approach raised an event as a function ofthe history it maintains, when aggregating emotions over the past 1 minute andmonitoring the entire stream at once (we use only one sensor).
Interestingly, a bigger sample size results in more triggers. This is due tomaintaining outdated information compared to the fast pace of the medium.Increasing the history length results in fewer triggers (Figure 4(b)), because newpoints can be matched against more sampled data, and are less likely to beflagged as outliers. On the other hand, Figure 4(a) leads to a very interestingobservation. Using a 50% sample, there is a dramatic drop in the number oftriggers, when we increase the window size from 10 to 15; from that point, until
200
400
600
800
1000
1200
1400
10 15 20 30 60 120
Trigger
Count
Window Size (points)
AngerJoy
SadnessSurprise
(a) Sample size = 50%
200
400 600
800 1000
1200
1400 1600
1800 2000
2200
10 15 20 30 60 120
Trigger
Count
Window Size (points)
AngerJoy
SadnessSurprise
(b) Sample size = 100%
Fig. 4. #Times a trigger was raised, w.r.t. the window size. a = 1min, r = 0.01, p=0.1

a window size of 30, triggering events increases slightly, and begins decreasingfrom that point on. This means that for 1 minute aggregations, there are rapidchanges in the observed emotions; therefore a window of 10 points may be toonarrow, to maintain a representative ”history”. On the other hand, a windowbetween 15 – 30 minutes seems like a better choice. This result correlates verywell with the real time nature of the medium, where people tend to speak andrespond very quickly to their tweets. It also means that events that are presentin our data create some momentum over a mid-size period (∼30minutes), andthen dissipate.
3 Conclusions
In this thesis, we considered various scenarios where user preferences can be takeninto account, in order to improve the quality of a provided service. In particular,we focused on different use cases, where user preferences play a vital role, namely:i) skyline queries, ii) review mining and competitor identification, and iii) socialmedia. The problems that arise in each of these domains are unique, and weproposed techniques to efficiently solve them, while providing quality guaranteeson our solutions. Our analysis also revealed some interesting properties for thesocial media domain. Finally, we effectively modeled competitors in a formalframework. User preferences and feedback may come in different forms, such asmouse movements [1], or interaction with online content [22].
References
1. I. Arapakis, M. Lalmas, and G. Valkanas. Understanding within-content engage-ment through pattern analysis of mouse gestures. In CIKM, pages 1439–1448,2014.
2. S. Bao, R. Li, Y. Yu, and Y. Cao. Competitor mining with the web. IEEETransactions on Knowledge Data Engineering, pages 1297–1310, 2008.
3. H. Becker, M. Naaman, and L. Gravano. Learning similarity metrics for eventidentification in social media. In WSDM, pages 291–300, 2010.
4. J. L. Bentley, H. T. Kung, M. Schkolnick, and C. D. Thompson. On the averagenumber of maxima in a set of vectors and applications. Journal of the ACM,25(4):536–543, 1978.
5. A. Z. Broder, M. Charikar, A. M. Frieze, and M. Mitzenmacher. Min-wise inde-pendent permutations. Journal of Computer and System Sciences, 60(3):630–659,2000.
6. C. Y. Chan, H. V. Jagadish, K.-L. Tan, A. K. H. Tung, and Z. Zhang. On highdimensional skylines. In EDBT, pages 478–495, 2006.
7. M. Datar and S. Muthukrishnan. Estimating rarity and similarity over data streamwindows. In ESA, pages 323–334, 2002.
8. P. Ekman, W. Friesen, and P. Ellsworth. Emotion in the human face: guide-linesfor research and an integration of findings. Pergamon Press, 1972.
9. C.-C. Kuo, F. Glover, and K. S. Dhir. Analyzing and modeling the maximumdiversity problem by zero-one programming. Decision Sciences, 24(6):1171–1185,1993.

10. T. Lappas, G. Valkanas, and D. Gunopulos. Efficient and domain-invariant com-petitor mining. In SIGKDD, pages 408–416, 2012.
11. R. Li, S. Bao, J. Wang, Y. Liu, and Y. Yu. Web scale competitor discovery usingmutual information. In ADMA, 2006.
12. X. Lin, Y. Yuan, Q. Zhang, and Y. Zhang. Selecting stars: The k most represen-tative skyline operator. In ICDE, pages 86–95, 2007.
13. M. Mathioudakis and N. Koudas. Twittermonitor: trend detection over the twitterstream. In SIGMOD, 2010.
14. M. E. Porter. Competitive Strategy: Techniques for Analyzing Industries and Com-petitors. Free Press, 1980.
15. S. S. Ravi, D. J. Rosenkrantz, and G. K. Tavyi. Heuristic and special case algo-rithms for dispersion problema. Operations Research, 42(2):299–310, 1994.
16. T. Sakaki, M. Okazaki, and Y. Matsuo. Earthquake shakes twitter users: real-timeevent detection by social sensors. In WWW, pages 851–860, 2010.
17. Y. Tao, L. Ding, X. Lin, and J. Pei. Distance-based representative skyline. InICDE, pages 892–903, 2009.
18. G. Valkanas and D. Gunopulos. Location extraction from social networks withcommodity software and online data. In ICDM Workshops (SSTDM), 2012.
19. G. Valkanas and D. Gunopulos. Event detection from social media data. IEEEData Eng. Bull., 36(3):51–58, 2013.
20. G. Valkanas and D. Gunopulos. How the live web feels about events. In CIKM,2013.
21. G. Valkanas and D. Gunopulos. A ui prototype for emotion-based event detectionin the live web. In SS-KDD-HCI @ SouthCHI, pages 89–100, 2013.
22. G. Valkanas and D. Gunopulos. Predicting download directories for web resources.In WIMS, page 8, 2014.
23. G. Valkanas, D. Gunopulos, I. Galpin, A. J. G. Gray, and A. A. A. Fernandes.Extending query languages for in-network query processing. In MobiDE, pages34–41, 2011.
24. G. Valkanas, I. Katakis, D. Gunopulos, and A. Stefanidis. Mining twitter datawith resource constraints. In IEEE/WIC/ACM International Conference on WebIntelligence, pages 182–187, 2014.
25. G. Valkanas, A. Ntoulas, and D. Gunopulos. Rank-aware crawling of hidden websites. In WebDB, 2011.
26. G. Valkanas, A. N. Papadopoulos, and D. Gunopulos. Skydiver: A framework forefficient skyline diversification. In EDBT, pages 406–417, 2013.
27. G. Valkanas, A. N. Papadopoulos, and D. Gunopulos. Skyline ranking a la IR. InExploreDB, pages 182–187, 2014.
28. G. Valkanas, A. Saravanou, and D. Gunopulos. A faceted crawler for the twitterservice. In WISE, pages 178–188, 2014.
29. A. Vlachou and M. Vazirgiannis. Ranking the sky: Discovering the importanceof skyline points through subspace dominance relationships. Data & KnowledgeEngineering, 69(9):943–964, 2010.
30. J. Weng and B.-S. Lee. Event detection in twitter. In ICWSM, 2011.31. M. L. Yiu and N. Mamoulis. Efficient processing of top-k dominating queries on
multi-dimensional data. In VLDB, pages 483–494, 2007.