Embed Size (px)
Citation preview
Orkustofnun, Grensasvegur 9, Reports 2015 IS-108 Reykjavik, Iceland Number 25
533
MINERAL SCALING POTENTIAL OF GEOTHERMAL FLUIDS IN WELL MW 01A IN MENENGAI, KENYA
John Kiplagat K. Mundui Geothermal Development Company, Ltd. – GDC
P.O. Box 1453 – 20117 Naivasha KENYA
ABSTRACT
The Menengai geothermal field was drilled in 2011. Some of the wells that have been discharging have recorded a decrease in productivity over time. In this study, geothermal water was sampled from well MW 01A in Menengai to determine the scaling potentials of calcite, amorphous silica, and anhydrite to understand the possible areas where scaling could occur. Simulations for fluids’ scaling potential was done for the reservoir fluid, discharge and reinjection by adiabatic boiling and conductive cooling by use of the WATCH program. Two conceptual models for these minerals’ saturation in the fluids are used. The results of simulations shows that calcite is expected to cause some scaling problems at the well during initial boiling and does not cause any problem at production, utilization, and reinjection. Amorphous silica may deposit during utilization especially if the water lowered below 100°C during discharges and reinjection. Anhydrite has no possibility of scaling in both boiling and cooling at any stage. Measures should be taken to avoid calcite mineral scaling at the well and amorphous silica deposition by saturated water at temperatures < 150°C during utilization.
1. INTRODUCTION The Menengai geothermal field, having a capacity of 700 MWe (Muchemi, 2010), is one of three geothermal fields in Kenya undergoing development for steam production for electricity generation and direct uses. The other developed fields are Olkaria and Eburru that are undergoing expansion. Geothermal Development Company (GDC) is currently drilling for steam at the Menengai caldera for 105 MWe production in phase one while heat energy is extracted for direct uses. Currently 29 wells have been drilled as of September 2015, of which eight wells are directional wells. Reservoir temperatures up to 400°C at 2,000 m have been encountered in several wells making it the hottest geothermal system in Kenya. The average temperature gradient of Menengai caldera is approximately 120°C/km. Steam production from the wells varies from relatively small to greater than 10 MWe. Currently 80 MWe of steam equivalent is on the wellhead and full steam production for the planned 105 MWe power plants is expected before the end of 2014. Three companies have been licensed for 20 years to operate 35 MWe modular plants each, which are due to be commissioned within 2015 (Omenda and Simiyu, 2015).
Mundui 534 Report 25
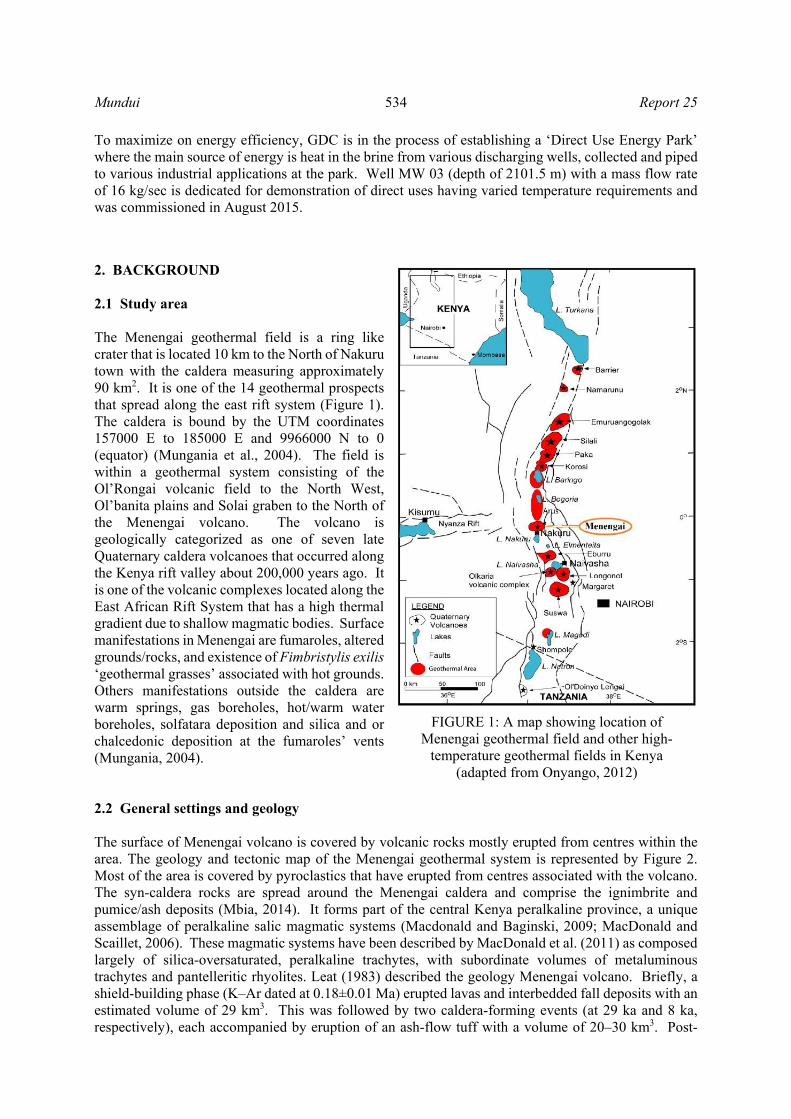
To maximize on energy efficiency, GDC is in the process of establishing a ‘Direct Use Energy Park’ where the main source of energy is heat in the brine from various discharging wells, collected and piped to various industrial applications at the park. Well MW 03 (depth of 2101.5 m) with a mass flow rate of 16 kg/sec is dedicated for demonstration of direct uses having varied temperature requirements and was commissioned in August 2015. 2. BACKGROUND 2.1 Study area The Menengai geothermal field is a ring like crater that is located 10 km to the North of Nakuru town with the caldera measuring approximately 90 km2. It is one of the 14 geothermal prospects that spread along the east rift system (Figure 1). The caldera is bound by the UTM coordinates 157000 E to 185000 E and 9966000 N to 0 (equator) (Mungania et al., 2004). The field is within a geothermal system consisting of the Ol’Rongai volcanic field to the North West, Ol’banita plains and Solai graben to the North of the Menengai volcano. The volcano is geologically categorized as one of seven late Quaternary caldera volcanoes that occurred along the Kenya rift valley about 200,000 years ago. It is one of the volcanic complexes located along the East African Rift System that has a high thermal gradient due to shallow magmatic bodies. Surface manifestations in Menengai are fumaroles, altered grounds/rocks, and existence of Fimbristylis exilis ‘geothermal grasses’ associated with hot grounds. Others manifestations outside the caldera are warm springs, gas boreholes, hot/warm water boreholes, solfatara deposition and silica and or chalcedonic deposition at the fumaroles’ vents (Mungania, 2004). 2.2 General settings and geology The surface of Menengai volcano is covered by volcanic rocks mostly erupted from centres within the area. The geology and tectonic map of the Menengai geothermal system is represented by Figure 2. Most of the area is covered by pyroclastics that have erupted from centres associated with the volcano. The syn-caldera rocks are spread around the Menengai caldera and comprise the ignimbrite and pumice/ash deposits (Mbia, 2014). It forms part of the central Kenya peralkaline province, a unique assemblage of peralkaline salic magmatic systems (Macdonald and Baginski, 2009; MacDonald and Scaillet, 2006). These magmatic systems have been described by MacDonald et al. (2011) as composed largely of silica-oversaturated, peralkaline trachytes, with subordinate volumes of metaluminous trachytes and pantelleritic rhyolites. Leat (1983) described the geology Menengai volcano. Briefly, a shield-building phase (K–Ar dated at 0.18±0.01 Ma) erupted lavas and interbedded fall deposits with an estimated volume of 29 km3. This was followed by two caldera-forming events (at 29 ka and 8 ka, respectively), each accompanied by eruption of an ash-flow tuff with a volume of 20–30 km3. Post-
FIGURE 1: A map showing location of Menengai geothermal field and other high-
temperature geothermal fields in Kenya (adapted from Onyango, 2012)

Report 25 535 Mundui
FIGURE 2: Geological and structural map of Menengai (adapted from Sekento, 2012)

Mundui 536 Report 25
caldera activity has largely been restricted to inside the second caldera and produced mainly lavas (at least 70 flows), sheet-forming fall pumice deposits and strombolian cinder cones. The volcano is built of Trachyte lavas and associated intermediate pyroclastics. Most of the pyroclastics activity accompanied caldera collapse. Post caldera activity (<0.1 Ma) mainly centred on the caldera floor with eruption of thick piles of trachyte lavas from various centres (Simiyu, 2010). The caldera and ring faults, Ol’ Rongai and Molo TVA trending NW- SE, and the Solai TVA trending N-S axis forms the three structures. The regional TVA’s in Menengai geothermal system are an important conduit of deep fluids thus an important geothermal controlling feature in the area (Lagat, 2011). These faults/fractures at the rift floor resulting from continental rifting joining the Molo and Solai scarps, allow water to recharge the aquifers below Menengai, where the water is heated up by intrusion of mantle-derived magma. Menengai has subsurface fractures and ring caldera faults that facilitate recharge of the aquifer with permeable zone observed between 1000 and 1600 m in three wells, MW-1, MW-2 and MW-3. The existence of these faults penetrated by well one (MW-01) was supported by Mibei and Lagat (2011) that lithological contacts indicated by high penetration rates, pH loss and chloride gains. These structures are therefore important controls in the Menengai geothermal field. Petrography and mineral chemistry of the basaltic and trachytic end members of the Menengai rocks indicate that two or more distinct magma types were involved in the formation of the volcano (Mbia et al., 2015). The mineral alteration resulting from longer residence time between geothermal fluids and rocks is evidenced by high concentration of dissolved solids. This is in concurrence with Mbia (2014) that at sea level high resistivity dominates almost the entire caldera, which could be attributed to alteration due to high temperature alteration minerals which are resistive. Drilling for steam in Menengai was targeted at a region with high permeability and MW 01 was the best target for exploration well and MW 01 A was drilled as a production well. 2.3 Geochemistry of Menengai fluids When a caldera geothermal field is drilled into, geothermal fluids (having dissolved solids in varying proportions) have their sources from geothermal reservoirs at different depths reflecting the subsurface thermal, chemical, and rock mineral properties. Those can then be used to predict subsurface temperatures, fluid flow, and the types of the reservoir fluids. Gas geothermometer temperatures for well MW 01, which lies adjacent to the well in study, indicate high values in excess of 300°C compared to the Na/K and quartz equilibrium temperatures of about 190°C and 220°C respectively (Kipng’ok, 2011). According to Kanda and Suwai (2013), well MW 01 geothermometry studies indicate that there exists a fairly shallow aquifer (i.e. ~1050 -1100 m) hosting predominantly liquids at temperatures about 190°C - 223°C as confirmed by Na/K and Quartz equilibrium geothermometers, and relatively deeper aquifer (~1800- 2050 m) hosting temperatures that exceed 300°C as indicated by gas geothermometers (Kanda and Suwai, 2013). This is in agreement with Mbia (2014) and GDC (2013) reports on 7 wells in Menengai geothermal field where quartz equilibrium and Na/K geothermometer temperatures are around 200°C indicating that the water is from relatively cold feed zones and therefore inferred to be shallow. Fluids encountered from 7 wells are of sodium bicarbonate type with HCO3 concentrations as high as 8,200 ppm (calculated as CO2) and average ~5,000 ppm (GDC, 2013) with near neutral pH, and close to equilibrium with respect to calcite (Malimo, 2013). Some of the boreholes drilled in the area have production capacity >20 m3/hr, with some on the northern sides having temperatures >30°C. Geochemical analyses indicate high CO2 values (>1.2%), especially along the fractured zones, with absolute values of Rn-222 indicating a NW-SE trend anomaly. These areas apparently coincide with high Rn-222 absolute values (anomalous values in the range of 2002-3700 cpm) in the caldera and to the north and northwest out of the caldera (GDC, 2010).

Report 25 537 Mundui
2.4 Mineral deposition chemistry Chemical equilibria between alteration minerals and solution is generally attained in geothermal systems for all major components except chloride (Arnórsson, 1983). Upon fluid ascent the equilibrium conditions may be disturbed, resulting in mineral over- or under-saturation. In this study, the saturation state of calcite, amorphous silica and anhydrite were investigated. 2.4.1 Silica In reservoirs, aqueous silica concentrations are commonly controlled by quartz solubility (Arnórsson, 1975; Arnórsson and Stefánsson, 1999). Reservoir fluids are saturated with respect to quartz but under-saturated with amorphous silica and exists as a reactive monomeric form H4SiO4 (aq) as shown by equation below:
Within the reservoirs, aqueous silica may dissociate to form silicic acid according to the reaction
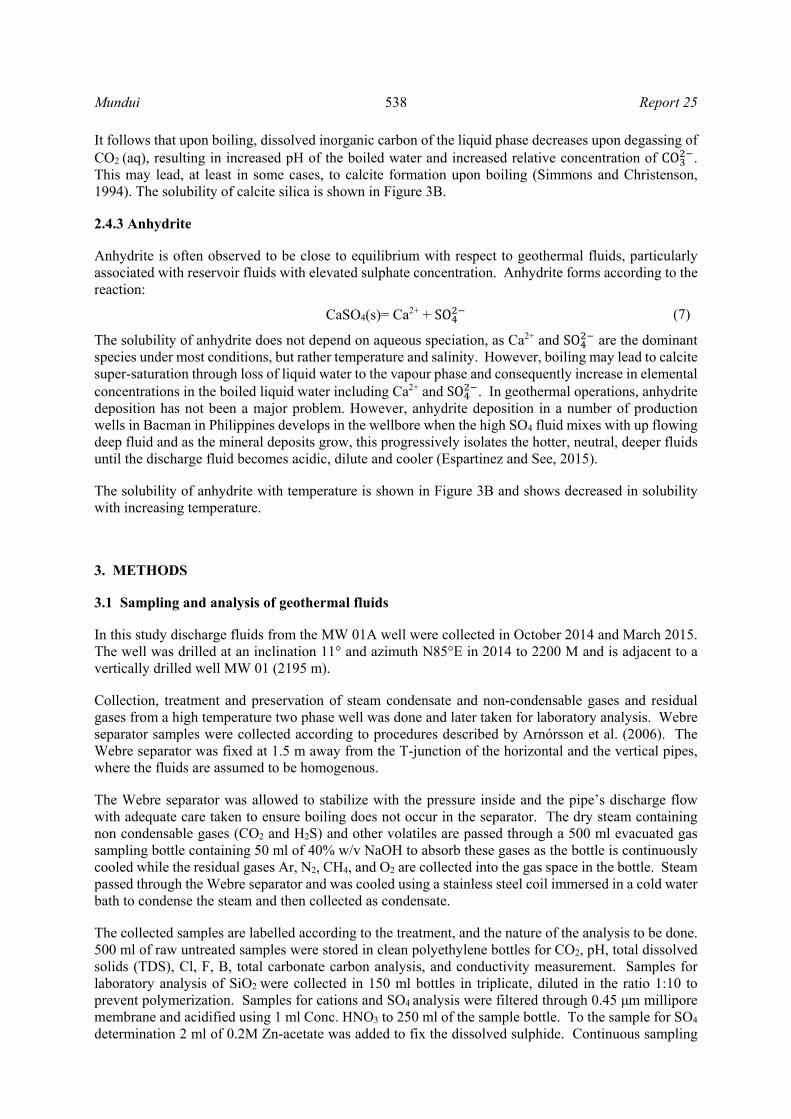
The solubility of silica minerals (quartz and amorphous silica) increases with an increase of pH and temperature. During steam production, utilization or discharges, three important factors affect silica solubility: CO2 and H2S partitions to vapour phase resulting in increased solution pH of the boiled liquid phase increasing the solubility of amorphous silica in solution; a pressure decrease causing temperature drop in separated water and decreasing silica solubility; and silica is concentrated in the separated water due to above two factors. The solubility of quartz, chalcedony and amorphous silica is shown in Figure 3A. 2.4.2 Calcite Calcite is another mineral commonly observed to be in equilibrium with respect to reservoir geothermal fluids. Calcite reaction may be described by the reaction,
CaCO Ca CO (3)
Calcite solubility decreases with increasing temperature. It also depends on the speciation of dissolved inorganic carbon in solution with the major species being CO2 (aq), HCO and CO and linked through the ionization constants,
CO2 (aq)+ H2O = H+ + HCO (4) HCO = H+ + CO (5)
With increasing pH, HCO and CO become progressively important, respectively. CO2 (aq) may also partition into the vapour phase through the reaction,
(6)
SiO s 2H O H SiO aq (1)
H SiO aq H SiO H (2)
FIGURE 3: Minerals solubility in geothermal water
Mundui 538 Report 25
It follows that upon boiling, dissolved inorganic carbon of the liquid phase decreases upon degassing of CO2 (aq), resulting in increased pH of the boiled water and increased relative concentration of CO . This may lead, at least in some cases, to calcite formation upon boiling (Simmons and Christenson, 1994). The solubility of calcite silica is shown in Figure 3B. 2.4.3 Anhydrite Anhydrite is often observed to be close to equilibrium with respect to geothermal fluids, particularly associated with reservoir fluids with elevated sulphate concentration. Anhydrite forms according to the reaction:
CaSO4(s)= Ca2+ + SO (7)
The solubility of anhydrite does not depend on aqueous speciation, as Ca2+ and SO are the dominant species under most conditions, but rather temperature and salinity. However, boiling may lead to calcite super-saturation through loss of liquid water to the vapour phase and consequently increase in elemental concentrations in the boiled liquid water including Ca2+ and SO . In geothermal operations, anhydrite deposition has not been a major problem. However, anhydrite deposition in a number of production wells in Bacman in Philippines develops in the wellbore when the high SO4 fluid mixes with up flowing deep fluid and as the mineral deposits grow, this progressively isolates the hotter, neutral, deeper fluids until the discharge fluid becomes acidic, dilute and cooler (Espartinez and See, 2015). The solubility of anhydrite with temperature is shown in Figure 3B and shows decreased in solubility with increasing temperature. 3. METHODS 3.1 Sampling and analysis of geothermal fluids In this study discharge fluids from the MW 01A well were collected in October 2014 and March 2015. The well was drilled at an inclination 11° and azimuth N85°E in 2014 to 2200 M and is adjacent to a vertically drilled well MW 01 (2195 m). Collection, treatment and preservation of steam condensate and non-condensable gases and residual gases from a high temperature two phase well was done and later taken for laboratory analysis. Webre separator samples were collected according to procedures described by Arnórsson et al. (2006). The Webre separator was fixed at 1.5 m away from the T-junction of the horizontal and the vertical pipes, where the fluids are assumed to be homogenous. The Webre separator was allowed to stabilize with the pressure inside and the pipe’s discharge flow with adequate care taken to ensure boiling does not occur in the separator. The dry steam containing non condensable gases (CO2 and H2S) and other volatiles are passed through a 500 ml evacuated gas sampling bottle containing 50 ml of 40% w/v NaOH to absorb these gases as the bottle is continuously cooled while the residual gases Ar, N2, CH4, and O2 are collected into the gas space in the bottle. Steam passed through the Webre separator and was cooled using a stainless steel coil immersed in a cold water bath to condense the steam and then collected as condensate. The collected samples are labelled according to the treatment, and the nature of the analysis to be done. 500 ml of raw untreated samples were stored in clean polyethylene bottles for CO2, pH, total dissolved solids (TDS), Cl, F, B, total carbonate carbon analysis, and conductivity measurement. Samples for laboratory analysis of SiO2 were collected in 150 ml bottles in triplicate, diluted in the ratio 1:10 to prevent polymerization. Samples for cations and SO4 analysis were filtered through 0.45 μm millipore membrane and acidified using 1 ml Conc. HNO3 to 250 ml of the sample bottle. To the sample for SO4
determination 2 ml of 0.2M Zn-acetate was added to fix the dissolved sulphide. Continuous sampling

Report 25 539 Mundui
and analysis was done for the entire period between October 2014 and March 2015 to assess the well performance to understand the reservoir conditions. Immediate analysis in the laboratory is done for pH, conductivity and total dissolved solids (TDS). Chloride concentrations we reanalysed by argentometric titration method. Major element concentrations were diluted to recommended limits followed by analysis of Na, K, and Ca using Inductively coupled plasma mass spectrometry (ICP-MS). Dissolved silica, B, and SO4 are done using UV-Vis spectrophotometer. Fluoride and NH3 were analysed using ion selective electrodes. Concentrations of CO2 and H2S were determined on site using modified alkalinity titration and Hg-precipitation titration, respectively. For steam samples, the concentrations of CO2 and H2S were measured in the steam condensate using the previously mentioned analytical method whereas the concentrations of non-condensable gases CH4, N2, H2, and O2 were analysed using gas chromatography. 3.2 Reservoir fluid composition The reservoir fluid composition was calculated from the samples of two-phase well discharges collected at surface. Comparison of wellhead and deep water calcium concentrations has been found the most useful method of predicting the extent of deposition (Ármannsson, 1989). In addition, the effects of depressurization boiling were simulated in a similar manner from the reservoir to 100°C and from the well head temperatures to 100°C. The calculations were carried out using the WATCH program (Arnórsson et al., 1982; Bjarnason, 2010) assuming conservation of enthalpy and mass. The calculations involve three steps: (i) assessment of the steam fraction at sampling and in the reservoir, (ii) assessment of reservoir fluid temperatures and (iii) reconstruction of the reservoir steam and liquid water composition from chemical data on steam and liquid water well discharges. The steam fraction is obtained assuming conservation of enthalpy:
= 1 (8)and (9)
where ht = is the enthalpy of the total fluid, hs is the enthalpy of steam, hlq is the enthalpy of liquid and Xs and Xlq are the steam and liquid fractions with Xs+Xlq = 1. Similarly, for the conservation of mass:
1 (10)
where is the concentration of the i-th component in the total fluid, is the concentration of the i-th
component in the steam phase and is the concentration of the i-th component in the liquid water phase. For non-volatile components that do not enter into the steam phase upon boiling:
1 (11)
For volatile components only partition into the steam phase:
(12)
Some components partition both into the steam and liquid water phase, like CO2 and H2S. The concentration ratios between the phases is given by:
⁄ (13)
where Ds is the distribution coefficient for the i-th component between the steam (s) and the liquid (lq) phase.

Mundui 540 Report 25
To calculate the reservoir fluid composition one needs to know the reservoir fluid temperature. In the present study, the reservoir fluid temperature was calculated assuming equilibrium with quartz, i.e. using the quartz geothermometry temperature. The enthalpy of the total fluids may be either obtained from measurements of well discharge at surface, i.e. ht=hmeasured, or assuming liquid only aquifer and taken the enthalpy of liquid at the reservoir temperature, i.e. . Here, the former is measured to as calculated enthalpy or model 1 and the latter as measured enthalpy or model 2. 3.3 Aqueous speciation and mineral saturation Aqueous speciation and mineral saturation were calculated with the aid of the WATCH program (Arnórsson et al., 1982; Bjarnason, 2010) The mineral saturation is expressed in terms of the mineral saturation index (SI) of a particular mineral, defined as the logarithm of the ratio of the reaction quotient (Q) to the equilibrium constant (K):
SI= log(Q/K) (14)where Q is defined as: (15)
where ai is the activity of aqueous species to the stoichiometric power v for the reaction, negative for reactants and positive for products. The three mineral reactions considered here were amorphous silica, calcite and anhydrite. The dissolution of these minerals is defined according to:
SiO2(s) + 2H2O = H4SiO4 (aq) (16) CaCO3(s) = Ca2+ + CO (17) CaSO4(s) = Ca2+ + SO (18)
The reaction quotients for these reactions are:
(19) (20) (21)
The equilibrium solubility of amorphous silica was taken from Gunnarsson and Arnórsson (2000) and the equilibrium solubility of calcite and anhydrite was taken from Arnórsson et al. (1982) represented by the equations:
logK . 8.476 485.24 ∗ T 2.268 ∗ 10 3.068 ∗ logT (22)
logK 10.22 0.0349T2476T
(23)
logK 6.20 0.0229 T
1217T
(24)
From the activities of the respective aqueous species and the mineral solubility constants, the mineral saturation state was assessed. At equilibrium, SI = 0, whereas if SI > 0 the fluid is supersaturated and the mineral can precipitate (i.e. form mineral scales) whereas if SI<1 the fluid is under-saturated with respect to the mineral and will no form and/or dissolve. 3.4 Boiling and cooling and mineral scaling The potential scaling of amorphous silica, calcite and anhydrite were assessed in the steps: (i) from the reservoir to the well head by boiling, (ii) from the wellhead to 100°C, both assuming the liquid and steam phases to be separated and coexisting upon boiling and cooling and (iii) upon reinjection of the geothermal wastewater.

Report 25 541 Mundui
The chemistry of the reservoir fluids was obtained both by assuming liquid only reservoir (model 1) and two-phase reservoir (model 2). These were boiled to 100°C and 1 bar and the mineral scaling potential assessed. The chemistry of the well discharge was obtained directly from the chemical analysis of the well head steam and liquid water phases. These were boiled and cooled to 100°C in order to simulate potential mineral scaling potential upon production and utilization. The boiled water at 100°C was then heated up to reservoir conditions and the mineral scaling potentials assessed upon re-injection of wastewater into the geothermal reservoir. 4. RESULTS 4.1 Sampled fluid composition Samples of discharge fluids from well MW 01A were collected October 2014 and March 2015. The discharge chemical composition was plotted against time to determine when stable discharge fluid composition had been achieved. Based on this analysis, selected samples of discharge fluid composition were selected for further study. Average composition of these selected analyses is listed in Table 1 together with an example of one sample. 4.2 Reservoir fluid composition The composition of the reservoir fluid composition for selected well discharges was calculated with the aid of the WATCH speciation program. The temperatures were calculated assuming equilibrium with quartz, i.e. the quartz geothermometry temperatures were used. The fluid discharges of well MW 01A display excess enthalpy, the cause being: two-phase liquid and vapour reservoir fluids and/or phase segregation upon depressurization boiling in the system (Arnórsson et al., 2007). Here two different approaches were selected to calculate the reservoir fluid composition: Model 1 assumes liquid only reservoir and model 2 assumes two phase reservoirs, liquid and vapour. For model 1, the reservoir enthalpy is calculated based on the reservoir temperatures and corresponding liquid enthalpy at that temperature whereas for model 2, the measured discharge enthalpy was selected. The results of the two models for a representative sample are listed in Table 1. The two models to calculate reservoir fluid composition differ mostly in respect to volatile composition. When assuming liquid only reservoir, all the volatiles in the sampled vapour phase are dissolved into the liquid phase including CO2 and H2S, resulting in higher liquid concentrations of these elements and lower pH values. However, when assuming reservoir liquid and vapour, large fraction of volatiles like CO2 and H2S are present in the reservoir vapour phase, hence the reservoir liquid exhibit lower CO2 and H2S concentration and higher pH (more alkaline). With respect to non-volatile concentrations the difference is less between the two models. 5. DISCUSSION Utilization of geothermal fluids for electricity production and for direct use poses several problems, among these being scaling. Scaling is the precipitation and growth of minerals from the fluids that can coat the surfaces of equipment during geothermal utilization, from the casing of the well, in the steam gathering systems, separation stations, other pipelines and upon reinjection. Scaling inside wells lead to decreased productivity with time. Scaling within surface infrastructure can also lead to flow-problems and corrosion. I n Figures 4, 5 and 6, the grey and black symbols represents model 1 (liquid phase

Mundui 542 Report 25
TABLE 1: Average chemical composition and physical properties of the well MW 01A stabilised
Well discharge a Well discharge Reservoir fluid Reservoir fluid model 1 b model 2 c # Average 2015-0238 2015-0238 2015-0238 Sampling p (bar-g) 13,6 13,1 t °C 192 276 230 Enthalpy (kJ/kg) 2419 2429 1218 2429 Liquid phase (ppm) pH/T 9,43/23 9,20/22 7,51/276 8,44/230 CO2 2513 2333 7668 2157 H2S 184 156 181 175 B 0,27 0,29 0,23 0,25 SiO2 757 762 607 670 Na 2286 2443 1945 2146 K 198 173 138 152 Ca 0,049 0,030 0,02 0,03 F 352 342 272 300 Cl 963 899 716 790 SO4 127 75 59,7 65,9 NH3 21,1 13,7 13,3 0,44 Vapor phase (mmol/kg condensate) CO2 768 648 668 H2S 11,4 8,2 8,2 H2 59,4 62,9 65,0 CH4 4,08 4,30 4,43 N2 2,30 0 0 O2 0,54 0 0
a Average compostion of well discharge fluids b Liquid only reservoir, i.e. enthalpy of the reservoir fluid is calculated c Liquid and vapour reservoir, i.e. the measured discharge enthalpy is taken to represent reservoir enthalpy
reservoir) and model 2 (two-phase reservoir) respectively. The potential of scaling during production of well MW 01A was examined in this report. 5.1. Mineral saturation within the reservoir The mineral saturation state of potential minerals forming scaling including calcite, amorphous silica and anhydrite were assessed for the two models applied for calculation of reservoir fluid composition. 5.1.1 Calcite saturation state The saturation state of the reservoir fluids with respect to calcite is shown in Figure 4. The results of both models are shown. Somewhat higher temperatures were calculated assuming liquid only reservoirs compared to two phase reservoirs or in the range 252-301°C and 198-250°C, respectively. The cause of this has to do with the
FIGURE 4: Calcite saturation state at reservoir conditions

Report 25 543 Mundui
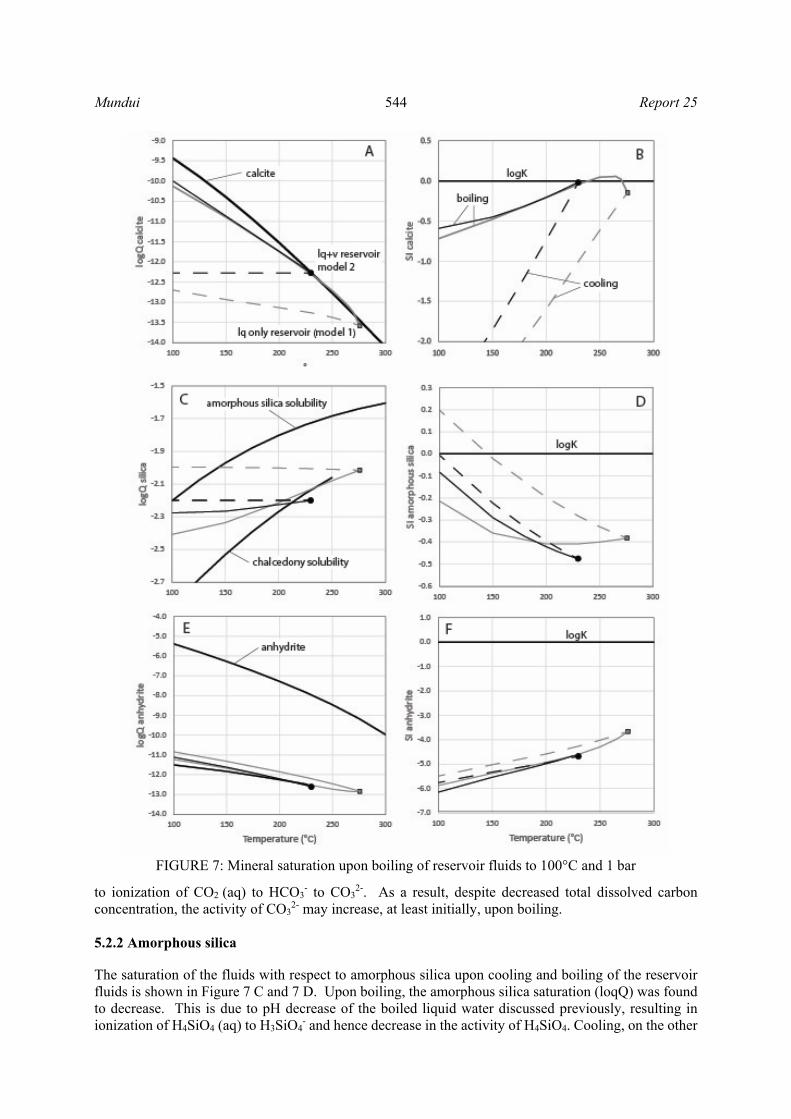
fraction of vapour in the reservoir to the surface. Independent of the model selected for calculation of reservoir fluids shows calcite saturation. 5.1.2 Amorphous silica state The saturation state of the reservoir fluids with respect to amorphous silica is shown in Figure 5. In all cases, the fluids are observed to be under-saturated. However, it should be pointed out that the temperatures were calculated assuming equilibrium with respect to quartz, and hence amorphous silica will be calculated to be under-saturated as amorphous silica is more soluble than quartz at all temperatures. 5.1.3 Anhydrite The saturation state of the reservoir fluids with respect to anhydrite are shown in Figure 6. In all cases and for both models 1 and 2, the fluids were observed to be under-saturated with respect to anhydrite. This is in accordance with low Ca and SO4 concentrations in the reservoir fluids and well discharges of well MW 01A. 5.2 Scaling potentials upon cooling and boiling of reservoir fluids The mineral saturation state of potential minerals forming scaling including calcite, amorphous silica and anhydrite were assessed for the two models applied for calculation of reservoir fluid composition upon conductive cooling and adiabatic boiling from the reservoir conditions to 100°C and 1 bar. In this way, potential mineral scaling within the well and in surface pipelines and infrastructure in a closed system was assessed. 5.2.1 Calcite The saturation of the fluids with respect to calcite upon cooling and boiling of the reservoir fluids is shown in Figure 7 A and 7 B. One sample was used to represent the reservoir fluid composition, #2015-0238. The results demonstrate that both upon adiabatic boiling and conductive cooling of the fluids form the reservoir temperature to 100°C and 1 bar, calcite is under-saturated, suggesting that calcite scaling will not occur. The only exception of this is initial boiling of reservoir fluids when assuming liquid only reservoir. In this case, slight calcite supersaturation is observed upon the first boiling, possibly resulting in calcite formation. The saturation state of calcite (logQ) is observed to increase both in the case of boiling and cooling. This is despite the fact that dissolved CO2 is lost upon boiling into the vapour phase. The reason for this has to do with speciation of Ca and CO2 in the water phase upon temperature decrease and boiling. Firstly, possible ion association to form various Ca2+ and CO3
2-. Ion pairs decrease with decreasing temperature, leading to increased activity of Ca2+ and CO3
2-. Secondly, boiling and loss of volatiles including CO2 and H2S results in increased pH value (more alkaline) of the boiled liquid water, leading
FIGURE 5: Amorphous silica saturation state at reservoir
FIGURE 6: Anhydrite saturation state at the reservoir conditions
Mundui 544 Report 25
to ionization of CO2 (aq) to HCO3- to CO3
2-. As a result, despite decreased total dissolved carbon concentration, the activity of CO3
2- may increase, at least initially, upon boiling. 5.2.2 Amorphous silica The saturation of the fluids with respect to amorphous silica upon cooling and boiling of the reservoir fluids is shown in Figure 7 C and 7 D. Upon boiling, the amorphous silica saturation (loqQ) was found to decrease. This is due to pH decrease of the boiled liquid water discussed previously, resulting in ionization of H4SiO4 (aq) to H3SiO4
- and hence decrease in the activity of H4SiO4. Cooling, on the other
FIGURE 7: Mineral saturation upon boiling of reservoir fluids to 100°C and 1 bar

Report 25 545 Mundui
hand results in less changes of the liquid water pH value, eventually resulting in amorphous silica super-saturation independent of the model applied to calculate the reservoir fluid composition. However, it should be pointed out that the sampling pressures were 13.1 bar corresponding to 192°C. For the temperature interval from the reservoir to the well discharge, silica scaling is not expected according to the results presented in Figure 7C and 7D. 5.2.3 Anhydrite The saturation of the fluids with respect to amorphous silica upon cooling and boiling of the reservoir fluids is shown in Figure 7E and 7F. In all cases, the fluids are observed to be under-saturated at all conditions for both models 1 and 2 and for boiling and cooling. This indicate that cooling and boiling of reservoir fluids to 100°C and 1 bar will not result in anhydrite scaling. 5.3 Scaling potentials upon cooling and boiling of liquid well discharges The mineral saturation state of potential minerals forming scaling including calcite, amorphous silica and anhydrite were assessed after separation of the vapour and liquid phase at the well-head conditions to 100°C and 1 bar. In this way, potential mineral scaling within surface pipelines and infrastructure in a closed system after vapour separation is assessed. 5.3.1 Calcite The saturation of the fluids with respect to calcite upon cooling and boiling of the liquid only phase from well head conditions at 192°C to 100°C and bar is shown in Figure 8A. As observed, upon conductive cooling and boiling of the well head liquid the value of logQ increases, yet the fluids are always observed to be under-saturated with respect to calcite, hence limited if any calcite scaling is expected. 5.3.2 Amorphous silica state The saturation of the fluids with respect to amorphous silica upon cooling and boiling of the liquid only phase from well head conditions at 192°C to 100°C and bar is shown in Figure 8B. As observed, upon boiling the fluids become progressively more under-saturated. The reason for this is the alkaline pH values formed with increasing boiling resulting in quantitative ionization of H4SiO4 (aq) to H3SiO4
-. In contrast, cooling has limited effects on the fluid pH value,
FIGURE 8: Mineral saturation upon boiling and cooling of liquid at well discharges

Mundui 546 Report 25
hence, the fluids become close to saturation with respect to amorphous silica at 100°C, possibly resulting in scaling formation. Cooling to temperatures <100°C would most likely result in formation of amorphous silica. 5.3.3 Anhydrite The saturation of the fluids with respect to anhydrite upon cooling and boiling of the liquid only phase from well head conditions (192°C) to 100°C and 1 bar is shown in Figure 8 C. In all cases, considerable under-saturation is observed with respect to anhydrite indicating no potential risk of anhydrite scaling upon cooling and boiling of well head liquid phase. 5.4 Scaling potentials upon reinjection of waste water The scaling potential upon reinjection of waste water, i.e. liquid phase that has been cooled or boiled to 100°C and re-injected into the reservoir. Such calculations affectively involve heating up the 100°C liquid phase to the reservoir temperatures of ~250°C. Such type of scaling may be significant due to decreased solubility of minerals like calcite and anhydrite with increasing temperature, and changes in aqueous speciation with temperature. 5.4.1 Calcite The saturation of the fluids with respect to calcite upon re-injection and subsequent heating of waste water from 100°C to the reservoir temperature of ~250°C is shown in Figure 8 A. The fluids display under-saturation at all temperatures to 250°C, whereas they become close to the saturation state of the reservoir fluids. This suggest that calcite scaling upon reinjection will most likely not be a major problem, except possibly at >200°C. It should be pointed out, however, that the calculations are very sensitive to the aqueous speciation and possible ion pair formation of Ca2+ and CO3
2-, something that is not well constrained at high temperatures (Stefánsson et al., 2014). 5.4.2 Amorphous silica The saturation of the fluids with respect to amorphous silica upon re-injection and subsequent heating of waste water from 100°C to the reservoir temperature of ~250°C is shown in Figure 8 B. The fluids display under-saturation with respect to amorphous silica at all temperatures to 250°C. However, they become saturated with both chalcedony and quartz with increasing temperature, possible resulting in silica scaling down-hole. 5.4.3 Anhydrite The saturation of the fluids with respect to anhydrite upon re-injection and subsequent heating of waste water from 100°C to the reservoir temperature of ~250°C is shown in Figure 8 C. In all cases, considerable under-saturation is observed with respect to anhydrite indicating no potential risk of anhydrite scaling upon re-injection. 6. CONCLUSIONS Well MW 01A poses a great risk to calcite scaling upon initial boiling for both single and two phase reservoir and this could lead to decrease in productivity of the well. Amorphous silica saturation is expected to occur for fluids cooled to temperatures below 150°C and especially at <100°C. Direct use applications that require temperatures below 100°C may become a problem in utilising this water. Care should be taken to ensure heat energy is extracted from separated water at temperatures that do not

Report 25 547 Mundui
favour oversaturation and deposition of amorphous silica at the equipment. Anhydrite is not found to be a problem from the reservoir through to reinjection. All the minerals under study will not be a problem upon fluid re-injection
ACKNOWLEDGEMENTS I wish to acknowledge the United Nations University, the Icelandic government and UNU Geothermal Training Programme Director Dr. Lúdvík S. Georgsson for giving me the opportunity to attend 2015 UNU geothermal training program. The author is much indebted to other UNU-GTP staff: Ms. Thórhildur Ísberg, Mr. Ingimar G. Haraldsson, Mr. Markús A.G. Wilde, Ms. Málfrídur Ómarsdóttir. Special thanks to Prof. Andri Stefansson for his guidance, encouragement and advice in writing this report. Many thanks to the staff of Orkustofnun, University of Iceland, University of Reykjavik, Reykjavik energy who taught us and those who participated in one way or another towards the success of this course. I am grateful to my colleagues in the 2015 UNU GTP program. I thank my employer, Geothermal Development Company (GDC) for granting me the opportunity for this training. Special thanks also go to my dear wife June, and my children Lindy and Gabriel for the moral support and prayers during my stay in Iceland
REFERENCES Ármannsson, H., 1989: Predicting calcite deposition in Krafla boreholes. Geothermics, 18, 25-32.
Arnórsson, S., 1975: Application of the silica geothermometer in low hydrothermal areas in Iceland. Am J. Sci, 275, 763-784.
Arnórsson, S., 1983: Chemical equilibria in Icelandic geothermal systems. Implications for chemical geothermometry investigations. Geothermics, 12, 119-128.
Arnórsson, S., Bjarnason, J.Ö., Giroud, N., Gunnarson, I., and Stefánsson, A., 2006: Sampling and analysis of geothermal fluids. Geofluids 6, 203-216.
Arnórsson, S., and Stefánsson, A., 1999: Assessment of feldspar solubility constants in water in the range 0 degrees to 350 degrees C at vapor saturation pressures. Am J. Sci, 299, 173-209.
Arnórsson, S., Sigurdsson, S. and Svavarsson, H., 1982: The chemistry of geothermal waters in Iceland I. Calculation of aqueous speciation from 0°C to 370°C. Geochim. Cosmochim. Acta, 46, 1513-1532.
Arnórsson, S., Stefánsson, A., and Bjarnason, J.Ö., 2007: Fluid-fluid interaction in geothermal systems. Rev. Min. Geochem. 65, 259-312.
Bjarnason, J.Ö., 2010: The speciation program WATCH, version 2.4. ÍSOR, Reykjavík, Iceland, 7 pp.
Espartinez, C.M.R., and See, F.S., 2015: The BacMan geothermal field, Philippines: Geochemical changes and challenges after twenty years of operation. Proceedings of the World Geothermal Congress 2015, Melbourne, Australia, 8 pp.
GDC, 2010: Menengai geothermal prospect; an investigation for its geothermal potential. Geothermal Development Company (GDC), unpublished report.
GDC., 2013: Menengai geothermal project; Data integration report. Geothermal Development Company (GDC), unpublished report.
Gunnarsson, I., and Arnórsson, S., 2000: Amorphous silica solubility and the thermodynamic properties of H4SIO°
4 in the range of 0° to 350 °C at Psat. Geochim. Cosmochim. Acta, 64, 2295-2307.

Mundui 548 Report 25
Kanda, I., and Suwai, J., 2013: Hydrogeochemistry of shallow and deep water aquifers of Menengai geothermal area, Kenya Rift Valley. GRC Transactions, 37, 403-410.
Kipng’ok, J.K., 2011: Fluid chemistry, feed zones and boiling in the first geothermal exploration well at Menengai, Kenya. Report 15 in: Geothermal training in Iceland 2011. UNU-GTP, Iceland, 281-302.
Lagat J., 2011: Geothermal surface exploration approach: Case study of Menengai geothermal field, Kenya. Proceedings of the Kenya Geothermal Conference 2011, Nairobi, Kenya, 10 pp.
Leat, P.T., 1983: The structural and geochemical evolution of Menengai caldera volcano, Kenya Rift Valley. PhD thesis, University of Lancaster, Lancaster, United Kingdom, 482 pp.
Macdonald, R., and Baginski, B., 2009: The central Kenya peralkaline province: a unique assemblage of magmatic systems. Mineralogical Magazine, 73, 1-16.
Macdonald, R., and Scaillet, B., 2006: The central Kenya peralkaline province: insights into the evolution of peralkaline salic magmas. Lithos, 91, 59-73.
Macdonald, R., Baginski, B., Leat, P.T., White, J.C., and Dzierzanowski, 2011: Mineral stability in peralkaline silicic rocks: Information from trachytes of the Menengai volcano, Kenya. Lithos, 125, 553-568.
Malimo, S.J., 2013: Fluid chemistry of Menengai geothermal wells, Kenya. GRC Transactions, 37, 425-430.
Mbia, P.K., 2014: Sub-surface geology, petrology and hydrothermal alteration of menengai geothermal field, Kenya. University of Iceland, MSc thesis, UNU-GTP, Iceland, report 1, 87 pp.
Mbia, P.K., Mortensen, A.K., Óskarsson, N., and Hardarson, B.S., 2015: Sub-surface geology, petrology and hydrothermal alteration of the Menengai geothermal field, Kenya: Case study of wells MW-02, MW-04, MW-06 and MW-07. Proceedings of the World Geothermal Congress 2015, Melbourne, Australia, 20 pp.
Mibei, G., and Lagat, J., 2011: Structural controls in Menengai geothermal field. Proceedings of the Kenya Geothermal Conference 2011, Kenya, 5 pp.
Muchemi, G., 2010: Current status of the geothermal development in Kenya. Proceeding of ARGEO C-3 third East African Rift Geothermal Conference, Djibouti, 2010 8pp.
Mungania, J., 2004: Geological studies of Menengai geothermal prospects. Kenya Electricity Generating Company Ltd. (KenGen), internal report, 18 pp.
Mungania, J., Lagat, J., Mariita, N.O., Wambugu, J.M., Ofwona, C.O., Kubo, B.M., Kilele, D.K., Mudachi, V.S., Wanjie, C.K., 2004: Menengai prospect: Investigations for its geothermal potential. The Government of Kenya and Kenya Electricity Generating Company Ltd., internal report, 91 pp.
Omenda, P., and Simiyu, S., 2015: Country update report for Kenya 2010-2014. Proceedings of the World Geothermal Congress 2015, Melbourne, Australia, 11 pp.
Onyango S. O., 2012: Preliminary design of the Menengai phase I steam gathering system. Report 26 in: Geothermal training in Iceland 2012. UNU-GTP, Iceland, 601-641.
Sekento L. R., 2012: Geochemical and isotopic study of the menengai geothermal field, Kenya. Report 31 in: Geothermal training in Iceland 2012. UNU-GTP, Iceland, 769-792.
Simiyu, S.M., 2010: Status of geothermal exploration in Kenya and future plans for its development. Proceedings of the World Geothermal Congress 2010, Bali, Indonesia, 11 pp.
Simmons, S.F., and Christenson, B.W., 1994: Origins of calcite in a boiling geothermal system. American Journal of Science, 294, 361-400.
Stefánsson, A., Benezeth, P., and Schott, J., 2014: Potentiometric and spectrophotometric study of the stability of magnesium carbonate and bicarbonate ion pairs to 150°C and aqueous inorganic carbon speciation and magnesite solubility. Geochim. Cosmochim. Acta, 138, 21–31.