Embed Size (px)
Citation preview

J. Non-Newtonian Fluid Mech. 96 (2001) 405–425
On two distinct types of drag-reducing fluids, diameterscaling, and turbulent profiles
K. Gasljevic, G. Aguilar, E.F. Matthys∗Department of Mechanical and Environmental Engineering, University of California at Santa Barbara,
Santa Barbara, CA 93106, USA
Received 29 October 1999; received in revised form 17 August 2000
Abstract
Two distinct scaling procedures were found to predict the diameter effect for different types of drag-reducingfluids. The first one, which correlates the relative drag reduction (DR) with flow bulk velocity (V), appears applicableto fluids that comply with the 3-layers velocity profile model. This model has been applied to many polymer solutions;but the drag reduction versusV scaling procedure was successfully tested here for some surfactant solutions as well.This feature, together with our temperature profile measurements, suggest that these surfactant solutions may alsoshow this type of 3-layers velocity profiles (3L-type fluids).
The second scaling procedure is based on a correlation ofτw versusV, which is found to be applicable to somesurfactant solutions but appears to be applicable to some polymer solutions as well. The distinction between thetwo procedures is therefore not simply one between polymer and surfactants. It was also seen that theτw versusV correlation applies to fluids which show a stronger diameter effect than those scaling with the other procedure.Moreover, for fluids that scale according to theτw versusV procedure, the drag-reducing effects extend throughoutthe whole pipe cross section even at conditions close to the onset of drag reduction, in contrast to the behavior of3L fluids. This was shown by our measurements of temperature profiles which exhibit a fan-type pattern for theτwversusV fluids (F-type), unlike the 3-layers profile for the fluids well correlated by drag reduction versusV. Finally,mechanically-degraded polymer solutions appeared to behave in a manner intermediate between the 3L and F fluids.
Furthermore, we also showed that a given fluid in a given pipe may transition from a Type A drag reduction atlow Reynolds number to a Type B at high Reynolds number, the two types apparently being more representativeof different levels of fluid/flow interactions than of fundamentally different phenomena of drag reduction. Aftertransition to the non-asymptotic Type B regime, our results suggest that, without degradation, the friction becomesindependent of pipe diameter and that the drag reduction level becomes also approximately independent of theReynolds number, in a strong analogy to Newtonian flow. © 2001 Elsevier Science B.V. All rights reserved.
Keywords:Drag reduction; Diameter effect; Scaling; Turbulence; Temperature profiles; Surfactants; Polymers; Newtonianflow; Reynolds number
∗ Corresponding author.
0377-0257/01/$ – see front matter © 2001 Elsevier Science B.V. All rights reserved.PII: S0377-0257(00)00169-5

406 K. Gasljevic et al. / J. Non-Newtonian Fluid Mech. 96 (2001) 405–425
Nomenclature
CF = 2τw/ρV 2 friction coefficientCp heat capacity (J kg−1 K−1)DR = (1 − CF/CF,S) × 100 drag reduction level (%)q ′′
w heat flux at the wall (W m−2)Re= VD/ν Reynolds numberT + = (T w − T )u∗ρCp/q ′′
w dimensionless wall-to-local temperature differenceu∗ = √
τw/ρ shear velocity (m s−1)V bulk velocity (m s−1)y distance from the wall (m)y+ = yu∗/ν dimensionless distance from the wall
Greek lettersν kinematic viscosity (m2 s−1)ρ density (kg m−3)τw shear stress at the wall (N m−2)
Subscriptsa apparentS solvent (water)w wall
1. Introduction
It is well known that the presence in water of small amounts of certain additives (such as polymersor surfactants) can result in a considerable reduction of drag in turbulent flow. One of many interestingaspects of these drag-reducing flows is the so-called ‘diameter effect’. This effect is seen as the additionaldependence of the friction coefficient (CF) on the pipe diameter, in addition to the dependence on theReynolds number which is the only parameter needed to define the friction coefficient for Newtonianfluids in smooth pipes.
In a recent study [1], we addressed the diameter effect on polymeric drag-reducing fluids and proposeda scaling procedure which proved to be very simple and accurate. We showed that the drag reduction levelis better correlated by the flow bulk velocity (V) than by other more complicated parameters proposedearlier. Our analysis also showed that this scaling procedure ties in very well with Virk’s 3-layers model[2] which was experimentally found to fit most polymer solutions; and that the thickness of the elastic layer(as defined by the1B+ displacement of the Newtonian core) is better defined as a function ofV than ofτw
or u∗, as previously believed. This suggests that solutions which conform to the 3-layers model and to a1B+ defined uniquely by velocity should also conform to the drag reduction versusV scaling procedure.
Although several studies were published about the diameter effect of drag-reducing polymer solutions,we are only aware of a few covering drag-reducing surfactant solutions, e.g. [3,4]. Schmitt et al. [3] pro-posed a compound procedure where the drag reduction was plotted as a function ofτw (i.e. essentially the

K. Gasljevic et al. / J. Non-Newtonian Fluid Mech. 96 (2001) 405–425 407
same as drag reduction versusu∗) for highτw, andVas a function ofτw for lowerτw. This procedure fittedwell the experimental data for their solution of C16TaSal surfactant. However, their procedure shows about15% of systematic deviation in drag reduction when applied to experimental data for polymer solutionsfor which our drag reduction versusVprocedure, on the other hand, provides close to a perfect fit [1]. Thisis a significant difference which could presumably suggest that polymer macromolecules and surfactantmicelles interact with turbulence in different ways. Indeed, although at first sight most aspects of drag re-duction (DR) by surfactant solutions seem to be the same as those of drag reduction by polymer solutions,there are, however, significant rheological and phenomenological differences [5,6]. For instance, it hasbeen shown consistently that higher levels of drag reduction and HTR can be achieved by surfactant solu-tions than by polymer solutions. Also, measurements of the velocity profile in pipe flow of drag-reducingsurfactant solutions apparently showed some departures, e.g. a noticeable ‘S’ shape, from Virk’s 3-layersvelocity profile suggested for polymer solutions [6,7]. These differences raised questions about a possiblefundamental difference in the drag reduction behavior of both types of solutions. On the other hand, Bew-ersdorff and Berman [8] suggested that the difference in the velocity profiles may be explained merely bythe effect of changing viscosity, which may be much higher than the viscosity of the solvent in the case ofsurfactant solutions. This is a complex issue because it may not be easy to define meaningfully the solutionshear viscosity in a turbulent flow field. Drag-reducing polymer solutions at the concentrations generallyused, do not show at high shear rates a viscosity differing significantly from that of the solvent, however.
The significance of the use of proper shear viscosity for surfactant solutions is also stressed in anotherscaling procedure, proposed by Usui et al. [9]. This procedure is harder to test than the one proposed bySchmitt et al., because it relies on the use of a fluid relaxation time, or more precisely, on its dependenceon the shear rate, which is diameter dependent. A previously published eddy diffusivity model by Usuiet al. was used as a basis for this relatively complex numerical scaling procedure. In another recent paperon the diameter effect, Sood and Rhodes [4] propose a scaling procedure claimed to be of general validityfor all drag-reducing solutions. Their numerical method assumes a damping factor applied to the VonKarman constant (usually assumed to be a constant value applicable to the whole Newtonian core region).This damping factor as well as the effective thickening of the viscous sublayer are determined from theexperimental friction measurements on one single diameter test tube.
There is another phenomenological difference between polymers and surfactants that is seen in theregion where mechanical degradation effects are present (the supercritical region). This is not directlyrelated to different mechanisms of drag reduction, but rather to differences in the nature of the degradationprocess, which should be understood as a change of fluid properties. Degradation of polymer solutions isa process which develops on a relatively long time scale but is cumulative and permanent. This means thatunder steady flow conditions (i.e. constant wall shear rate) the fluid shows a permanent decrease in thedrag reduction level due to the scission of large polymer molecules. This effect occurs mostly at singularpoints along the circulation system where shear and elongational stresses are highest (at the pipe entrancefor example). On the other hand, in the case of pipe flow of surfactant solutions, the drag reduction for agiven fluid is a fixed function of the wall shear rate, and the (reversible) degradation almost immediatelyreaches an equilibrium and no longer changes with time. This allows us to define a steady state dragreduction for surfactant solutions in the supercritical region, which is not possible for polymer solutions.
Note that the supercritical region, even for surfactant solutions, is controlled by physical processes thatare very different than those influencing the subcritical one, and no single correlation is therefore likelyto address satisfactorily the diameter effect in both regions. In this article we are focusing our attentionon the subcritical region, where there is no degradation.

408 K. Gasljevic et al. / J. Non-Newtonian Fluid Mech. 96 (2001) 405–425
Given all these distinctions between polymers and surfactants, the question of whether or not thediameter effect scheme we proposed earlier for polymers could work equally well for surfactants isquite interesting. In addition, the diameter effect can be related to the broader issue of the comparisonof polymeric and surfactant drag-reducing fluids, and, therefore, to the elucidation of the mechanismsresponsible for the drag reduction phenomenon.
Another important context in which the diameter effect can be examined is the Type A/Type B distinctionproposed for drag-reducing polymer solutions. The idea of two types of drag reduction has been discussedin detail by Virk and Wagger [10,11], and they have shown that a variation in NaCl concentration from10−2 to 10−5 ppm may lead to a change from Type A to Type B behaviors. This difference was relatedto the conformation of the polymer molecules, which in turn seemed to vary dramatically depending onthe concentration of ions in the solution (e.g. the amount of NaCl in the polyacrylamide solutions). TheType A drag reduction is typical for coiled polymer molecules (e.g. at high salt content), which require acertain level of wall shear stress before the onset of drag reduction takes place. As flow velocity increasesfurther, so does the drag reduction, until degradation becomes apparent later on. This kind of polymersolutions exhibits a 3-layers velocity profile (referred hereafter as ‘3L’ fluids), and their diameter effectis correlated well by our scaling procedure drag reduction versusV. This was the case, for instance, forpolyacrylamide, polyox, and guar gum solutions [1]. On the other hand, Type B drag reduction is typicalof extended polymer molecules (e.g. polyacrylamide solutions with very low salt content), which exhibitasymptotic drag reduction immediately after transition from laminar to turbulent flow. With increasingflow velocity, the asymptotic friction coefficients are maintained until a retro-onset point is reached, afterwhich the drag reduction level remains approximately constant for a given pipe diameter with the furtherincrease of velocity. If this is correct, for Type B drag reduction a true diameter effect could only be seenin the region after the drag reduction departs from the maximum drag reduction asymptote (MDRA) andbefore degradation takes place.
2. Experimental setup and procedure
Details of the experimental setup used for the friction coefficient measurements have been described inprevious articles (e.g. [12]). It consists basically of a set of five pipes of different diameters (2, 5, 10, 20,and 52 mm). All of them can be supplied with fluid by either variable speed pumps or pressurized tanks.This setup allows us to obtain a wide range of mean flow velocities (up to about 20 m s−1). Since the testsfor the supercritical region require higher mean velocities, and, therefore, larger available pressures, afew modifications were done to the existing setup, such as providing smaller pressurized vessels (whichcan stand higher pressures) to drive the fluid through the pipes of smallest diameters. In this case, littlefluid is required, but high pressures are needed to obtain the high flow velocities. On the other hand,reaching steady state with weak surfactant solutions may require a long pipe, especially at low velocitiesin large pipes, i.e. at low shear stress. This is due to the long induction time needed for the formation of theshear-induced state (SIS), a superstructure of micelles induced by the shear. Note that in this case we aredealing with the simultaneous development of fluid properties and flow field. Of course, both processesmay be present as well in the flow of polymer solutions, but in this latter case (and likely for strongsurfactant solutions also), the time scale characteristic of fluid change due to flow is probably negligiblecompared with the time scale for flow development. For polymer solutions (which were used in mostentry lengths studies found in the literature), the development of the flow takes place over entry lengths

K. Gasljevic et al. / J. Non-Newtonian Fluid Mech. 96 (2001) 405–425 409
fairly well quantified by a known L/D (say, 200 for momentum and 1000 for heat), whereas the pipelengths needed for SIS formation may be considerably longer. Therefore, pipes of length and diametersimilar to those of the test pipes were installed upstream of the test section, and the friction coefficientswere also measured in that region to ensure fully-developed flow.
As in the tests with polymer solutions, the pressure drop measurements were taken by differentialpressure transducers over the section of pipe where flow is already fully developed. Temperature wasalways monitored, to ensure that the diameter effect tests were as close to isothermal conditions aspossible. Altogether, the experimental error in drag reduction is expected to be within 1–2% for the foursmallest pipes, and between 2 and 3% for the biggest (details of error estimates can be found elsewhere[1]).
To resolve some uncertainties, we made use of local measurements of turbulent exchange mechanismsacross the pipe cross section in addition to the classic integral measurements of friction coefficient. How-ever, rather than measuring velocity profiles, we measured temperature profiles, for reasons explainedhereafter. For this purpose we developed a temperature sensor made from 0.003 in. E-type thermocouplewire, and which can be moved across the pipe cross section. The full description of this setup can befound elsewhere [13]. Besides temperature profile measurements for each run, we also measured theoverall heat transfer coefficient at the same location. The agreement between Nusselt number calcu-lated from the overall heat transfer measurements and Nusselt number calculated from the temperatureprofile measurements was within 10%. Drag reduction was measured as well during the heat transfermeasurements.
As our objective was to study the large differences in the level of drag reduction in different tubes at agiven Reynolds number, strong drag-reducing solutions (e.g. high concentrations) are obviously a poorchoice, because they would show asymptotic drag reduction in all tubes. Solutions with lower concentra-tions are good from this point of view, but their structures break more easily at higher velocities (Reynoldsnumbers), thus limiting the subcritical range. The two requirements, lower drag-reducing effectivenessand higher critical stress, are, unfortunately, generally mutually exclusive. A proper compromise musttherefore be found in choosing the best concentration for a given fluid. Those two fluid properties, and theirrelationship, depend on the chemistry of the fluid, however, and during our experimenting with surfactantsolutions, we noticed that the fluid’s drag-reducing properties were changing with time. Chemical agents(most noticeably copper hydroxide, Cu(OH)2 originating from copper or brass parts in the circulationloops) caused a phenomenon which we refer to as ‘stiffening’ [12]. In general, a stiffened fluid is ableto stand higher shear stresses, whereas it shows less drag reduction at lower Reynolds numbers. Sucha stiffened surfactant solution is therefore a good choice for the study of the diameter effect. Not onlydoes it have higher critical shear stress and shows less drag reduction at lower Reynolds numbers, butit is also more chemically stable than the ‘unconditioned’ fluid at the same concentration. An additionalbenefit of the conditioned fluid is that its viscosity is practically the same of water, which simplifies theinterpretation of results.
It was decided therefore to prepare the fluid for the diameter effect tests by adding 3.75 mM of Cu(OH)2
to a solution of 2000 ppm of fresh active surfactant (from an Ethoquad T13-27 master solution by AKZOChemicals) mixed with 1740 ppm of sodium salicylate (NaSal) as counterion (a counterion to surfactantmolar ratio of 2.5), all in tap water. Ethoquad T13 is a tris (2-hydroxy-ethyl) tallowalkyl ammoniumacetate [(tallowalkyl-N-(C2H4)OH)3 Ac]. (In this article, when quoting concentrations we refer to thefraction of actual surfactant in the test solution we prepared, not including solvent already present in themaster solution as received from the manufacturer.)

410 K. Gasljevic et al. / J. Non-Newtonian Fluid Mech. 96 (2001) 405–425
In the course of our experiments we realized that some other surfactant had to be used besides theEthoquad because of the non-suitability of the scaling procedure reported by Schmitt et al. [3] for theEthoquad data. Accordingly, we also used a 4000 ppm nonionic surfactant solution in tap water. Thisbiodegradable surfactant, SPE95285, was kindly developed for our experiments by Dr. M. Hellstenof AKZO-Nobel Chemicals. It is a mixture of two nonionic surfactants. One consists of ethoxylatedunsaturated fatty alcohols (mainly oleyl alcohol) and the other of ethoxylated unsaturated fatty acidethanolamides, where the main component of the fatty acids is oleic acid. The chemical structure ofthese two components isR(OCH2CH2)mOH andR1CONH(CH2CH2O)nH, respectively, whereR andR1 stand for the unsaturated alkyl chains andm andn represent the mean number of ethylene oxidegroups in the hydrophilic chains [22]. This surfactant was developed to operate effectively in the 5–25◦Crange, but still showed drag reduction ability up to 40◦C at concentrations of about 4000 ppm. Besidesits nonionic nature, this surfactant has very different properties than those of Ethoquad. In the nonioniccase, a reduction of viscosity relative to water and an eventual loss of drag-reducing ability at increasedtemperatures is seen, and is due to phase separation (solubility problem). Transition from cylindrical toglobular micelles appears at low temperatures. Both are the opposite of what happens with Ethoquadsolutions. This nonionic surfactant was chemically stable, but an initial concentration of about 500 ppmof biocide (Nalco 2810) had to be added to prevent biodegradation. The surfactant shear viscosity wasmore than twice as high as that of water at room temperature for the relevant shear rates, however. Asmentioned above, the interpretation of the results is easier if the fluid viscosity is kept as close to wateras possible, and the viscosity of this solution was therefore controlled by conducting the tests at highertemperatures (around 34◦C), where this fluid shows water-like viscosity due to surfactant precipitation,but yet exhibits high levels of drag reduction [13].
Somewhat lower concentrations of the same types of surfactants were prepared to measure temperatureprofiles, namely a 1500 ppm Ethoquad solution with a 2.5 M ratio of NaSal counterion to surfactantdiluted in tap water, but without the Cu(OH)2; and also a 2000 ppm of SPE 95285 nonionic surfactantsolution with a small amount of biocide (100 ppm of Nalco 2810), also diluted in tap water.
Finally, two types of polymer solutions were also used: (1) two intentionally degraded solutions (500and 1500 ppm) of polyacrylamide (Separan AP-273 by Dow Chemicals) diluted in deionized (DI) water.These highly concentrated solutions were continuously circulated around a short loop with a partiallythrottled valve, until constant shear rate capillary viscosity measurements at 1000 s−1 showed a decreasein the viscosity of both solutions from about 15 and 20 cP, respectively, to 5 and 8 cP. (2) a 150 ppmpolysaccharide (Xanthan gum by Kelco) solution in deionized water. The latter polymer solution wasused to study Types A and B characteristics in light of the scaling procedures. Unfortunately, for bothkind of polymer solutions, it was not possible to obtain water-like viscosities, even at the high wallshear stresses that were expected in the actual diameter effect experiments. Therefore, a reasonableway to calculate the solution friction coefficients was by the use of the ‘apparent’ viscosity at the wall,which is the viscosity measured under laminar flow at the same wall shear stress expected in the ac-tual turbulent test. For this purpose we used a capillary viscometer with tube diameters ranging from0.178 to 2 mm in order to cover the range of shear rates present in turbulent flow, as described in detailin [12].
Evidently, there are many more drag-reducing fluids available. However, as we have shown before [1],most of the well-known fluids usually are of the 3L-type, and therefore should scale according to the dragreduction versusV correlation. One of our objectives was to see if fluids which do not follow this patternmight be classified according to different types of scaling and turbulent profiles.

K. Gasljevic et al. / J. Non-Newtonian Fluid Mech. 96 (2001) 405–425 411
3. Results
3.1. Integral measurements of friction
Fig. 1 shows results of the drag reduction tests with the Xanthan gum, a well known Type B drag-reducer.Although Rochefort and Middleman [14] showed that this polymer exhibits Type B drag reduction even ata very high salt content, we prepared our solution with deionized water. As can be seen, for pipe diametersof 10, 5, and 2 mm, there is typical Type B behavior, i.e. an asymptotic drag reduction starting from thelaminar-turbulent transition region. At a Reynolds number of about 10,000, however, theCF versusRecurves for the smaller pipe diameters depart from the asymptote, in most cases ending up approximatelyparallel to the Prandtl–Karman curve for Newtonian turbulent flow (this translates to a constant valueof drag reduction) before degradation. (Of course, eventually, at a large enough shear stress, the fluidwill begin to experience permanent mechanical degradation, as is seen shortly after the departure fromthe asymptote for the 2 mm pipe and later for the 5 mm pipe.) The two larger pipes (20 and 52 mm)show, however, more typical Type A behavior. (Liaw et al. [21] in a study of the effect of molecularcharacteristics of polymers on drag reduction, observed a similar effect of pipe diameter for polyethyleneoxide in Benzene.) This suggests that Types A and B drag reduction s may be the expressions of tworegions of drag reduction process that can be encountered for a given fluid in a given pipe. In pipes ofsmaller diameters, the flow intensity (shear stress) at a given Reynolds number may be large enoughto stretch the molecules of the fluid enough to provide asymptotic drag reduction immediately after the
Fig. 1. Friction coefficient for five pipe diameters (52, 20, 10, 5 and 2 mm) as a function of apparent Reynolds number for a150 ppm Xanthan gum solution in DI water. Virk’s MDRA for polymers is shown for reference.
412 K. Gasljevic et al. / J. Non-Newtonian Fluid Mech. 96 (2001) 405–425
laminar-turbulent transition region. (Of course, this is more likely for a solution with molecules alreadymore extended under static conditions.) On the other hand, for pipes with very large diameters, evenmolecules already very stretched under static conditions may need shear beyond the laminar-turbulenttransition region to show drag reduction effects. Looking at one given pipe diameter exhibiting Type Abehavior, say the 52 mm diameter pipe, the drag reduction process consist of Type A-like behavior (i.e.onset from Newtonian friction and strong diameter effect) at low velocities, followed by Type B-likebehavior (i.e. constant drag reduction level as extended from asymptotic value at retro-onset) at highvelocities. We do not have additional data to confirm this conclusively, but Fig. 1 also strongly suggeststhat the friction curves for all diameters merge into one master curve. (A similar convergence may alsobe present in Liaw et al. [21] data for 0.05% WSR in benzene.) Furthermore, this master curve appearsapproximately parallel to the Newtonian curve at high Reynolds numbers. (Some indications of such afeature may also perhaps be extrapolated from data shown in Ollis [23].)
Of course, this effect can only be seen clearly if there is little or no degradation taking place, which iswhy we used a Xanthan gum solution which exhibits a high resistance to mechanical degradation. Thiswas verified by repeating some runs with a fluid sample that had already passed through a given pipe, andtesting it again at about the same shear stress conditions (ranging from 1200 to 50,000 N m−2). For testscarried out in the region where theCF curves depart from the MDRA, but remains approximately parallelto the Newtonian curve, we only found differences in theCF measurements between successive runs thatfall within the experimental uncertainty. (Of course, at high enough shear rate, mechanical degradationwill indeed eventually take place as seen for the 2 mm pipe and perhaps the 5 mm one.) This suggests thatthe departure from the MDRA at higher Reynolds numbers is not related to a mechanical degradation,and suggests instead that the drag-reducing effectiveness of the fluid has reached a maximum. Thisis contrary to prevalent belief among many drag reduction researchers, who sometimes automaticallyassociate the apparent ‘loss’ of drag reduction after retro-onset to fluid degradation, be it mechanical,chemical, biological, etc.
If we add stretching of the molecules to our interpretation of the interactions between flow and poly-mer molecules, this would mean that polymer molecules are ‘fully’ stretched after the retro-onset, and,therefore, that a further increase in the frequency of the turbulence dynamics cannot be followed bychanges in the polymer molecules. Other interpretations are possible, of course. Excluding the signs ofdegradation for the 2 mm and maybe 5 mm pipes, we can see from Fig. 1 that the friction curves for allpipe diameters exhibiting Type B at low velocities converge to the same line, approximately parallel tothe Prandtl–Karman curve, and thus exhibit a roughly constant drag reduction. Therefore, this alreadysuggests that the diameter effect is not significant for pipes showing an initial Type B behavior, in this casethose with diameters equal or less than 10 mm, assuming no mechanical degradation. Furthermore, forthe 20 and 52 mm pipes, those showing Type A behavior at low velocities, the diameter effect apparentlyexists only in the region where molecules are likely still affected by the flow, i.e. before they merge withthe other curves and become then more Type B-like themselves.
Altogether, all the friction curves, whether they correspond to Type A or B at low velocities, suggestthat the diameter effect disappears at high Reynolds numbers if no degradation is involved, and also thatthe drag reduction level becomes thereafter a parameter approximately independent of Reynolds number.If this observation is of general validity, it would constitute a very interesting development towards abetter fundamental understanding of the drag reduction phenomenon, in that a much stronger and simplercorrespondence to Newtonian flow could be made in that region. Further work should be conducted toverify this hypothesis.

K. Gasljevic et al. / J. Non-Newtonian Fluid Mech. 96 (2001) 405–425 413
Some extension of the Type A/Type B relationship may hold for surfactant solutions as well. Both TypesA and B behaviors are also observed for surfactant solutions. However, in the case of surfactant solutionsthe flow affects primarily the formation of the SIS rather than of the micelles themselves. Mechanicaldegradation is also harder to avoid, although it is only temporary.
Note that data in Fig. 1 lie below Virk’s asymptote at lowRe. Indeed, it is now believed that asymptoticpolymer solutions can give drag reduction greater than that predicted by Virk’s earlier MDRA, and alsothat the latter may be underestimating even more asymptotic drag reduction forsurfactantsolutions. Zakinet al. [15], for example, showed a lower asymptote for surfactants based on their compilation of data fromdifferent authors; and a recent correlation we developed for asymptotic drag reduction for surfactantsolutions [13] shows even somewhat higher level of drag reduction in the region of low Reynolds numberthan that proposed by Zakin et al.; and therefore much higher than Virk’s.
In Fig. 2, the friction coefficients for a conditioned Ethoquad solution are plotted as a function ofReynolds number. A strong diameter effect is seen in both subcritical and supercritical regions. Anenvelope of minimalCF is approximately parallel to the curve for turbulent flow of Newtonian fluids(i.e. showing constant drag reduction). This could again mean that there is a maximum achievable drag
Fig. 2. Friction coefficient for five pipe diameters (52, 20, 10, 5 and 2 mm) as a function of solvent Reynolds number fora 2000 ppm Ethoquad T13/27 solution in tap water plus 1740 ppm of NaSal and 3.75 mM l−1 of Cu(OH)2. The MDRA forpolymers (Virk) and surfactants (Zakin et al.) are plotted for reference.
414 K. Gasljevic et al. / J. Non-Newtonian Fluid Mech. 96 (2001) 405–425
reduction level for this fluid that is independent on pipe diameter, but conceivably the temporary degra-dation effects seen for surfactant solutions could have affected the shape of this envelope.
Note that this fluid exhibits a shear viscosity very close to that of water and that the diameter effectshown here is therefore indeed a true one, unlike some apparent diameter effects that are merely a resultof the use of an inadequate viscosity (the solvent viscosity for example) in the Reynolds number, as weshowed in earlier work. Although the data in Fig. 2 does not extend to the onset region for all pipes, itis nevertheless possible to extrapolate the curves and to estimate the onset shear stress for each pipe. Ifwe do so, we find onset shear stresses of 1.06, 0.45, 1.0, and 0.446 N m−2 for the 5, 10 20, and 52 mmpipes, respectively. This suggests that the onset shear stress is also relatively independent of diameter, asis believed to be the case for polymer solutions.
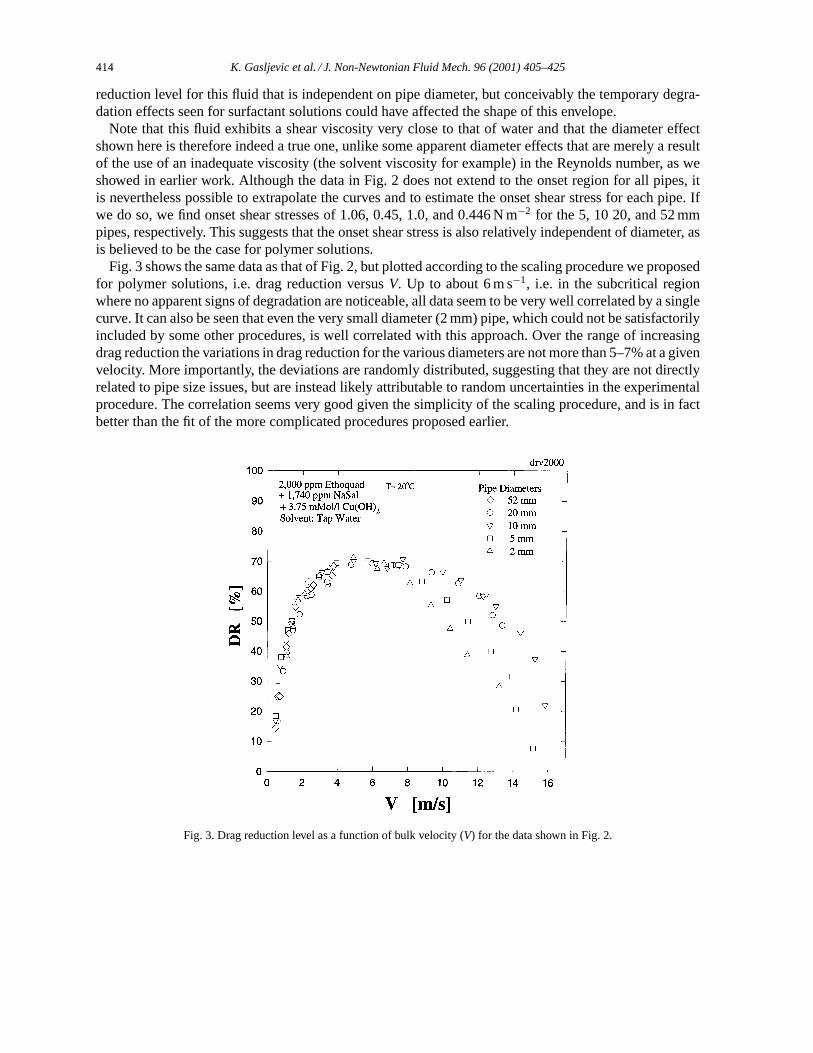
Fig. 3 shows the same data as that of Fig. 2, but plotted according to the scaling procedure we proposedfor polymer solutions, i.e. drag reduction versusV. Up to about 6 m s−1, i.e. in the subcritical regionwhere no apparent signs of degradation are noticeable, all data seem to be very well correlated by a singlecurve. It can also be seen that even the very small diameter (2 mm) pipe, which could not be satisfactorilyincluded by some other procedures, is well correlated with this approach. Over the range of increasingdrag reduction the variations in drag reduction for the various diameters are not more than 5–7% at a givenvelocity. More importantly, the deviations are randomly distributed, suggesting that they are not directlyrelated to pipe size issues, but are instead likely attributable to random uncertainties in the experimentalprocedure. The correlation seems very good given the simplicity of the scaling procedure, and is in factbetter than the fit of the more complicated procedures proposed earlier.
Fig. 3. Drag reduction level as a function of bulk velocity (V) for the data shown in Fig. 2.

K. Gasljevic et al. / J. Non-Newtonian Fluid Mech. 96 (2001) 405–425 415
Fig. 4. Drag reduction level as a function of solvent shear velocity (u∗S) for the data shown in Fig. 2.
In the supercritical region, the dominant process is the fluid’s degradation [16], which is of differentnature for surfactant and for polymer solutions. For the polymer solutions, it is a cumulative effectwhich leads to a continuous change in the fluid properties due to permanent degradation, whereas forthe surfactant solutions, the change in the fluid properties is only temporary. It is generally believedfrom previous work that the temporary degradation of surfactant solutions begins at a critical shear stressapproximately independent of pipe diameter. This can indeed be seen in Fig. 4, where drag reduction isplotted versus shear velocity (u∗), as taking place for au∗ of about 0.3 m s−1. It is therefore not surprisingthat in the supercritical region the shear stress (or shear velocity) is a better parameter for predicting thelevel of drag reduction for a given fluid than is the velocity. The difference between Figs. 3 and 4 does notappear large in the subcritical region because of the scale used for the figures, but the drag reduction/Vapproach does indeed lead to a significantly better correlation of all the diameters in that region. Perhapsmore importantly, it is also much more meaningful physically. The reader is referred elsewhere for a moreelaborate discussion of this issue [1].
We also tested with our Ethoquad data theτw versusV procedure which Schmitt et al. applied suc-cessfully to a C16TaSal surfactant solution. As can be seen in Fig. 5, at a given flow velocity, the wallshear stresses between the 2 and 52 mm tube differ by a factor of about 2 for a given velocity, whichis a large difference compared with the good fit achieved by Schmitt et al. for their surfactant solution(C16TaSal). Apparently, these two surfactant solutions scale best in two completely different represen-tations: the Ethoquad surfactant scales exceptionally well using the same correlation as most polymer

416 K. Gasljevic et al. / J. Non-Newtonian Fluid Mech. 96 (2001) 405–425
Fig. 5. Wall shear stress for five pipe diameters (52, 20, 10, 5 and 2 mm) as a function of bulk velocity for the data shown inFig. 2. The straight lines are the theoretical values for water.
solutions, i.e. drag reduction versusV, whereas the C16TaSal surfactant scales best according to theτw
versusV correlation.Our earlier analyses of the drag reduction versusV scaling procedure for polymer solutions showed
that any given solution which conforms to the 3-layers model in conjunction with the displacement of theelastic sublayer (1B+) being function ofV rather thanu∗, should satisfy a fixed relationship between dragreduction andV that is independent of the tube diameter (and better correlated than the correspondingdrag reduction versusu∗ [1]). The Ethoquad surfactant is therefore likely to have a velocity profile similarto the 3-layers model for polymers, whereas the surfactant used by Schmitt et al. is not.
To attempt to resolve this issue, we decided to test another surfactant. This is a nonionic surfactant(SPE 95285) with very different properties than Ethoquad’s. Its phase diagram is a ‘mirror’ image of thatfor Ethoquad in that phase separation takes place at higher temperatures for a given concentration of thenonionic solution, and transition from cylindrical to globular micelles takes place at low temperatures.
In addition, we also decided to test polymer solutions with characteristics rather different from thoseof commonly used solutions, e.g. in our case high concentrations of low molecular weight polymerrather than the usual dilute solutions of high molecular weight polymers. To achieve this, we preparedhigh concentrations of Separan solutions (500 and 1500 ppm), the molecular weight of which was in-tentionally reduced by mechanically degrading the fluids through circulation for several hours through apartially-closed control valve. These degraded high-concentration fluids provided a level of drag reduc-tion comparable with that of solutions with 20 or 30 times lower concentrations of very high molecularweight polymers.

K. Gasljevic et al. / J. Non-Newtonian Fluid Mech. 96 (2001) 405–425 417
Fig. 6. Drag reduction level as a function of bulk velocity (V) for a 4000 ppm SPE 95285 (nonionic surfactant solution) in tapwater plus an initial 500 ppm of biocide. Note how this representation fails to correlate the diameter effect by as much as 30%between the 2 and 20 mm diameter pipes, and how smaller diameter pipes show larger drag reduction than bigger ones.
Results for the nonionic surfactant are presented in Figs. 6 and 7. Scaling drag reduction with velocity(Fig. 6) obviously does not work satisfactorily, as seen when compared with Fig. 3 for Ethoquad. For agiven velocity, there is up to 30% more drag reduction in the 2 mm tube than in the 20 mm tube. The data forthe other two tube diameters lie in between. On the other hand, Fig. 7 shows the data for all four diameterswell correlated by a straight line when the data are plotted asτw versusV (except for a few data aroundthe onset points, and for some showing signs of degradation in the 2 and 5 mm tubes at high velocities).This surfactant solution shows therefore the same diameter scaling pattern as that tested by Schmitt et al.
The situation with the partially degraded high concentration polymer solutions shows an intermediatebehavior. Fig. 8 shows that our proposed scaling correlation, drag reduction versusV, does not work asadequately for these fluids (especially for the 1500 ppm Separan solution as shown by the solid line) as itdoes for the Ethoquad solution seen in Fig. 3, or for the other polymer solutions reported on in Gasljevicet al. [1]. Similarly, the alternative approach,τw versusV, as shown in Fig. 9 does not correlate well thedata for all diameter pipes in one single curve, as it did on the other hand for the nonionic surfactant seenin Fig. 7. Apparently then, the two scaling correlations discussed above may well represent two limitingcases, and although the diameter effect problem for a large variety of fluids may be taken successfully

418 K. Gasljevic et al. / J. Non-Newtonian Fluid Mech. 96 (2001) 405–425
Fig. 7. Wall shear stress as a function of bulk velocity for the data shown in Fig. 6. The straight lines are the theoretical valuesfor water. This representation provides a good scaling procedure for this particular fluid. The solid line through the data showsa best-fit power-law correlation in the intermediate non-degraded regime.
predicted using one of these correlations, some other fluids may indeed show intermediate behaviors thatwould not be well represented by either one of these correlations.
To summarize, we have distinguished two types of representations correlating the diameter scaling fordrag-reducing solutions: drag reduction versusV, andτw versusV; and drag-reducing solutions whichscale well in one representation do not scale well in the other. It appears that those solutions which scalewell in theτw versusV representation show a stronger diameter effect than those which scale well in thedrag reduction versusV representation. Indeed, when plotted in drag reduction versusV presentation, thefluids that scale well withτw versusV, still show a higher drag reduction in smaller pipes than in biggerones at the sameV. In addition, as the 500 and 1500 ppm Separan solution suggest, some other fluidsmay show an intermediate behavior between these two extremes.
Also, our measurements suggest that Types A and B drag reduction are more likely pertaining totwo different regions of the same process rather than to two distinct types of fluids or of drag reductionphenomena. As mentioned above, in the case of Type B fluids, polymer molecules may be ‘stretched’ fullyafter the retro-onset, and, therefore, a further increase in frequency of the turbulence dynamics could notresult readily in changes in molecular configuration. The diameter effect also appears to disappear in thatregion. A more detailed analysis of the Type A versus Type B behaviors will be presented shortly in anotherarticle. Again, it is worth noting also that the distinction between the two scaling behaviors identifiedhere is not simply one between polymer and surfactant solutions as one might perhaps have expected.

K. Gasljevic et al. / J. Non-Newtonian Fluid Mech. 96 (2001) 405–425 419
Fig. 8. Drag reduction as a function of bulk velocity for two mechanically degraded Separan solutions (500 and 1500 ppm).Curve fits for the 1500 ppm solution data are shown by the solid lines. Note the larger spread between data than in Fig. 3 beforedegradation.
3.2. Local measurements-temperature profiles
The two different scaling procedures suggest distinct interactions between the flow and the drag-reducingagent in the velocity regime where the solution properties (such as shear viscosity and elasticity) are af-fected by the flow. Some departure from optimal scaling may be attributed to the effects of a shear-dependentviscosity, which for some drag-reducing fluids (especially surfactant solutions) may indeed sometimesbe significant. However, as mentioned before, we have taken steps to minimize these effects, and we haveused fluids with water-like viscosities for the purpose of clearly showing the distinction between the twoprocedures. To understand better the nature of the fluid/flow interaction, one can also make use of localmeasurements such as the velocity or temperature profiles, rather than integral measurements like thefriction or heat transfer coefficients.
Velocity profile measurements for Separan and other polymer solutions that conform to the drag reduc-tion versusVscaling procedure have been published earlier. Those velocity profiles are in good agreementwith Virk’s 3-layers velocity profile, and as our analyses suggest [1], there is a correlation between the3-layers velocity profile and the proposed drag reduction versusV scaling procedure. (We call hereafterfluids of this kind ‘3L’ fluids.) Instead of measuring velocity profiles, however, we decided to measuretemperature profiles for the fluids we used in our study of the diameter effect. We have indeed recentlydeveloped a technique for measuring the temperature profiles of drag-reducing fluids in the context of astudy of the turbulent Prandtl number (Prt). For asymptotic fluids (for which velocity profiles are well

420 K. Gasljevic et al. / J. Non-Newtonian Fluid Mech. 96 (2001) 405–425
Fig. 9. Wall shear stress as a function of bulk velocity for the data shown in Fig. 8. The dashed lines are the theoretical valuesfor water. Note the larger spread between data than in the intermediate region of Fig. 7.
known both for some polymers and surfactants), we measured various temperature profiles, and, cameto the conclusion that thePrt is about constant across the pipe, with a numerical value of 5–8 dependingon the fluid [13]. This implies a good analogy between the velocity and temperature profiles, allowingus therefore to use measurements of the temperature profile instead of velocity profiles for the analysisof drag-reducing flows. As our technique for temperature measurements is also fast and accurate, it wasmore convenient to use temperature profile measurements considering the large number of measurementsneeded. In addition, our measurements showed that for all fluids tested, the diameter effect on drag re-duction was analogous to the diameter effect on heat transfer reduction [17], another indication of strongcorrelation between the momentum and heat transfers.
In the present article we show only results of two typical temperature profile measurements pertaining tothe surfactant solutions discussed above (others will be published elsewhere). Fig. 10 shows temperatureprofiles for an older 1500 ppm Ethoquad solution with a 2.5 M ratio of NaSal to surfactant, a fluid whichshowed excellent agreement with the drag reduction versusV scaling procedure. Temperature profileswere measured at various bulk flow velocities. As expected, the temperature profiles are analogousto the velocity profiles in Virk’s 3-layers model: the elastic layer appears to grow with increasing bulkvelocity, and the slope of the temperature profile in the elastic layer remaining approximately constant. Notsurprisingly, the slope of the temperature elastic layer for this surfactant solution is about twice as large asthat of the elastic layer in the temperature profiles of other 3L-type polymers [13]. For example, the elasticlayer for the asymptotic profiles of polyacrylamide solutions is given byT + = (75±10) ln(y+)+constant,

K. Gasljevic et al. / J. Non-Newtonian Fluid Mech. 96 (2001) 405–425 421
Fig. 10. Dimensionless temperature profiles for a 1500 ppm Ethoquad solution. Each profile was measured at a different Reynoldsnumber (i.e. bulk velocity). ID= 20 mm.T avg = 20◦C. Note how the profiles vary in a fashion similar to that of 3-layers velocityprofiles. The solid lines are best fit linear regressions for profile T5 and correspond to asymptotic heat transfer (and drag) reductionconditions.
whereas for these asymptotic profiles of Ethoquad it is given byT + = (185± 10) ln(y+) + constant.Similarly, it is also believed that the elastic layer in the velocity profile of some surfactant systems is abouttwice as steep as the velocity elastic layer for most polymers, consistent with the larger maximum dragand heat transfer reduction asymptotes observed for surfactants compared with polymers [18]. (Virk’sasymptotic profile for polymers is given byu+ = 11.7 ln(y+) + constant, whereas Zakin et al. proposedan asymptotic profile for surfactants given byu+ = 22.4 ln(y+) + constant.) Measurements of dragreduction conducted simultaneously with each of these profiles indicated that at the highest Reynoldsnumber measured (about 98,000), we had asymptotic drag reduction (according to the Zakin et al. [15]MDRA correlation). The corresponding temperature profile is seen in Fig. 10 with upright triangles (runT5), a best fit curve for this profile being shown in Fig. 10 as a solid line. However, as can be seen, arelatively large Newtonian core region remains towards the pipe center, unlike in the 3L model. This hasalso been observed for the velocity profile measurements of surfactant solutions which are presumablyasymptotic as well [6,19]. We have recently shown, however, that upon the addition of small amounts ofcontaminants (such as copper hydroxide to Ethoquad solutions or sodium salicylate to nonionic surfactantsolutions), a larger (e.g. 13% higher) elastic-layer slope may be seen, perhaps due to water-like viscosityin this case. Also, the Newtonian core seen in profile T5 of Fig. 10 disappears then, at least at low Reynoldsnumbers, with the elastic layer extending to the centerline, leading to an even lower friction coefficient,which means an even larger maximum drag reduction than that corresponding to the asymptote proposedby Zakin et al. These results will be shown in detail elsewhere.

422 K. Gasljevic et al. / J. Non-Newtonian Fluid Mech. 96 (2001) 405–425
Fig. 11. Temperature profiles for a 2000 ppm SPE 95285 nonionic surfactant solution.T avg = 34◦C. Each profile was measuredat a different Reynolds number. Note how the profiles vary in a fan-type fashion. The solid line through the data is a best-fitlinear regression for profile T19.
Fig. 11 shows temperature profile measurements for the nonionic surfactant SPE 95285, which conformsvery well to theτw versusVscaling procedure. We can see that there are no distinct elastic and core regions,and that the whole cross-section is affected by the drag-reducing effects, even at reduced levels of heattransfer. With larger flow velocity, the level of heat transfer reduction is increased by a steepening ofthe slope of the temperature profile rather than by growth of the elastic layer. In this case we can talkof a fan-type evolution of the temperature profiles (or velocity profiles) with the slope changing withincreasing flow velocity and extending practically all the way to the center of the pipe; instead of theelastic layer growing in thickness with a constant slope, as was the case with Ethoquad. Bewersdorffand Ohlendorf [6] measured velocity profiles for the same C16TaSal solution for which Schmitt et al.showed good agreement with theτw versusVscaling procedure, and not surprisingly, the velocity profilesshowed a fan-type development with increasing flow velocity, confirming a likely relationship betweenthe fan-type profiles and theτw versusV correlation. As in the case of the profile measurements for theEthoquad solution, the drag reduction measurement for our nonionic surfactant solution correspondingto the profile measured atRe= 67,000 (T19) is in reasonably good agreement with the MDRA proposedby Zakin et al. However, the addition of small amounts of NaSal enhanced the drag reduction (and heattransfer reduction) effectiveness of the fluid by about the same amount (10% inCF) as the Cu(OH)2 didfor the Ethoquad solution [13], possibly because of lower viscosity.
We can then summarize the difference between the two groups of drag-reducing fluids as follows: inone case (e.g. a solution of the cationic surfactant Ethoquad), the drag-reducing effects associated withthe presence of an elastic layer are seen to be present over a region increasing in thickness as the velocity

K. Gasljevic et al. / J. Non-Newtonian Fluid Mech. 96 (2001) 405–425 423
increases, and the better scaling correlation for this type of fluids (3L) is drag reduction versusV, thecorrelation that we have recently proposed [1] and shown to be applicable to the majority of drag-reducingfluids reported on in the literature until now (particularly polymer solutions). In the other case (e.g. asolution of nonionic surfactant), the drag-reducing effects are seen across most of the pipe cross-section,even at very low levels of drag reduction. This group of fluids (F-type) scales better according to theτw
versusV correlation. Only one of the fluids we have tested in our laboratory (nonionic SPE 95285 surfac-tant) has clearly shown good agreement with this kind of correlation; however, the C16TaSal surfactantsolutions tested in two other experimental studies does also appear to satisfy this kind of scaling.
These two distinct patterns may indicate a different fluid/flow interaction for the two types of drag-reducing fluids. In addition, we also saw some fluids (e.g. a degraded high molecular weight polymer)exhibiting an intermediate behavior, i.e. that did not scale well according to the drag reduction versusVcor-relation nor to theτw versusVone. It is difficult to ascertain conclusively at this time why some fluids wouldfollow a ‘3L’ pattern, and some others a ‘F’ one. Based on our results, it seems that, at least for polymers,long molecules may tend to generate 3-layers profiles, while shorter molecules may lean more towardssatisfying theτw versusVscaling procedure more typical of F-type profiles, but this remains to be proven.
The discussions above pertained mostly to what was previously termed Type A fluids, and it is notyet entirely clear how the temperature profiles of a fluid exhibiting Type B characteristics would differfrom those of the 3L and F types defined above. Velocity profile measurements by Escudier et al. [20] forfluids showing Type B friction coefficient characteristics were indeed similar to typical 3-layers models,however. Some of our recent temperature profile measurements [13] showed some slight differences inthe slope and thickness of the different regions of the profiles between Types A and B fluids, but only athigh concentrations. The issue of the Type B drag reduction will be addressed in details in a future article.
4. Summary and conclusions
In this article we extended our earlier study of the diameter effect to both polymer and surfactantsolutions. With respect to the Type A/Type B distinction made earlier, it appears that instead of twodistinct types of fluids or of drag reduction, it may perhaps be better to think of two regions of flow/additiveinteractions reflecting different levels of additive response to the flow, with some fluids in a given pipeexhibiting Type A friction behavior at low Reynolds numbers yet also Type B at high Reynolds numbers.The diameter effect appears to be found only in the region where flow may change the fluid properties(Type A). For Type B drag reduction, we see no true diameter effect after the friction coefficients departfrom the asymptote at higher Reynolds numbers, a region of likely constant fluid properties (and, of course,there is no diameter effect in the asymptotic regime either). In the Type B region, not only is the frictiondependent only on the Reynolds number, but the data suggest that the drag reduction level becomes alsoabout independent of Reynolds number, in a stronger analogy to Newtonian flow. Type B drag reductioncould then be simply interpreted as an extension of Type A drag reduction, and to reflect the region wherethe fluid properties are no longer affected by turbulence, but not yet by mechanical degradation. Truediameter effect would pertain then only to the region where turbulence has a (non-degrading) effect onthe fluid properties responsible for the drag reduction.
For Type A, where the fluid properties may still undergo some changes with increasing flow intensity(e.g. with bulk velocity), two types of fluid-flow interactions were found: 3L and F types, each reflectinga different effect of the pipe diameter and turbulent profiles.

424 K. Gasljevic et al. / J. Non-Newtonian Fluid Mech. 96 (2001) 405–425
Firstly, our earlier scaling procedure (drag reduction versusV) appears to work well for most polymersolutions. As we have shown before, this scaling procedure is valid for drag-reducing fluids which exhibit3-layers velocity profiles. Some surfactant solutions, like the Ethoquad cationic surfactant used in thisstudy, scale also very well with this procedure, and, not surprisingly, we measured similar 3-layerstemperature profiles, with spreading of the drag-reducing effects from the wall towards the pipe center asV increases. We call these fluids 3L-type. We saw that the slope of the elastic layer is about twice that ofpolymer solutions, however, for both temperature and velocity. In most cases, the temperature and velocityprofiles of these surfactant solutions show a separate core region, even for asymptotic levels of drag andheat transfer reductions. The existence of such a core region may not be universal nor fundamental,however, given our observation that the addition of small amounts of Cu(OH)2 to a solution of Ethoquadeliminates this region, leading to a constant slope all the way to the pipe center, as in the case of asymptoticpolymer solutions, at least at low Reynolds numbers.
Secondly, a nonionic surfactant solution we studied (SPE 95285) scales well with another procedure,namelyτw versusV. Our temperature profile measurements show a very different type of fluid–flowinteractions for this kind of solution. From the very onset of drag reduction, drag-reducing effects arepresent in the entire cross-section of the pipe. Instead of the growth of an elastic layer, the slope of theprofile increases with increasing flow velocity, showing a fan-type evolution of temperature profiles. Ourobservation that the fan-type temperature profiles are associated with theτw versusV scaling procedureis also supported by earlier measurements of velocity profiles.
Finally, another fluid, a highly-concentrated but degraded polymer solutions exhibited scaling that wasnot correlated as well as the other fluids by either approach, and may well belong to an intermediatecategory.
Since the two scaling procedures give significantly different results, i.e. fluids which scale well withone procedure show large disagreement with the other (about 30% in terms of drag reduction), we believethat there may be two basic modes of interaction between additive and flow, the distinction between themnot simply one between polymer and surfactants. These modes are reflected in very different velocity andtemperature profiles, the reasons behind this difference not being known at this time.
On the practical side, it is important to note that we now have available two very good methods forthe prediction of the diameter effect for drag-reducing solutions. Adequate predictive scaling is indeeda very important issue for industrial applications, especially those involving very large pipes that cannotreadily be studied in the laboratory. Of course, one would have to find out which type of fluid the solutionof interest belongs to before choosing the type of correlation to use, but even if the fluid has not yet beenreported on in the literature, one could likely make an educated guess, or better still, conduct some simpleexperiments to determine the type of fluid in question. Hopefully, once this issue will have been studiedfurther, researchers will be able to understand better what flow or fluid characteristic make a fluid belongto one category rather than the other, and perhaps predict this as well.
Acknowledgements
We acknowledge gratefully the financial support of the California Institute for Energy Efficiency, and ofthe California Energy Commission (D. Hatfield, program manager) and the generous supply of surfactantsby Drs. S. Shapiro and M. Hellsten (AKZO-Nobel Chemicals). GA also wishes to acknowledge the

K. Gasljevic et al. / J. Non-Newtonian Fluid Mech. 96 (2001) 405–425 425
Universidad Nacional Autonoma de Mexico, and especially the DGAPA and the IIM for support grantedthrough their scholarship program.
References
[1] K. Gasljevic, G. Aguilar, E.F. Matthys, An improved diameter scaling correlation for turbulent flow of drag-reducingpolymer solutions, J. Non-Newtonian Fluid Mech. 84 (2/3) (1999) 131–148.
[2] P.S. Virk, H.S. Mickley, K.A. Schmitt, The ultimate asymptote and mean flow structure in Toms’ phenomenon, ASME J.Appl. Mech. 37 (2) (1970) 488–493.
[3] K. Schmitt, P.O. Brunn, F. Durst, Scaling-up correlations for drag reducing surfactants, in: Progress and Trends in RheologyII, 1988, pp. 249–252.
[4] A. Sood, E. Rhodes, Pipeline scale-up in drag reducing turbulent flow, Can. J. Chem. Eng. 76 (1998) 11–18.[5] A.V. Shenoy, A review of drag reduction with special reference to micellar systems, Colloid Polym. Sci. 262 (1984) 319–337.[6] H.W. Bewersdorff, D. Ohlendorf, The behavior of drag-reducing cationic surfactant solutions, Colloid Polym. Sci. 266
(1988) 941–953.[7] I.L. Povkh, A.V. Stupin, Turbulent Flows of Solutions of Micelle-Forming Surfactants, Mechanics of Turbulent Flows,
Nauka, Moscow, Russia, 1980, pp. 44–49.[8] H.W. Bewersdorff, N.S. Berman, The influence of flow-induced non-Newtonian properties on turbulent drag reduction,
Rheol. Acta 27 (1988) 130–136.[9] H. Usui, T. Itoh, T. Saeki, On pipe diameter effect in surfactant drag-reducing pipe flows, Rheol. Acta 37 (1998) 122–128.
[10] P.S. Virk, D.L. Wagger, Aspects of mechanisms in Type B drag reduction, in: A. Gyr (Ed.), Structure of Turbulence andDrag Reduction, IUTAM Symposium, Zurich, Switzerland, 25–28 July, Springer, Berlin, 1989.
[11] P.S. Virk, D.L. Wagger, The effect of salinity on turbulent drag reduction by polyelectrolyte additives at high Reynoldsnumbers, in: Addendum to the Proceedings of the International Symposium on Seawater Drag Reduction, 22–23 July 1998,Newport, Rhode Island, 1998.
[12] K. Gasljevic, An experimental investigation of drag-reduction by surfactant solutions and of its implementation in hydronicsystems, Ph.D. dissertation, UCSB, April 1995.
[13] G. Aguilar, An experimental study of drag and heat transfer reductions in turbulent pipe flows for polymer and surfactantsolutions, Ph.D. dissertation, UCSB, August 1999.
[14] S. Rochefort, S. Middleman, Effect of molecular configurations on Xanthan gum drag reduction, in: Y. Rabin (Ed.), AIPProceedings Polymer-Flow Workshop, No. 137, 1985, pp. 117–127.
[15] J.L. Zakin, J. Myska, Z. Chara, New limiting drag reduction and velocity profile asymptotes for nonpolymeric additivessystems, AIChE J. 42 (12) (1996) 3544–3546.
[16] K. Gasljevic, E.F. Matthys, Experimental investigation of thermal and hydrodynamic development regions for drag-reducingsurfactant solutions, J. Heat Transfer 119 (1) (1997) 80–88.
[17] G. Aguilar, K. Gasljevic, E.F. Matthys, Coupling between heat and momentum transfer mechanisms for drag-reducingpolymer and surfactant solutions, J. Heat Transfer 121 (4) (1999) 796–802.
[18] J. Myska, J.L. Zakin, Comparison of flow behaviors of polymeric and cationic surfactant drag reducing additives, in:Proceedings of the 1996 ASME Fluids Engineering Division Summer Meeting, ASME Publication, Vol. FED 237, No. 2,1996, pp. 165–168.
[19] Z. Chara, J.L. Zakin, M. Severs, J. Myska, Turbulence measurements of drag-reducing surfactant systems, Exp. Fluids 16(1993) 36–41.
[20] M.P. Escudier, F. Presti, S. Smith, Drag reduction in turbulent pipe flow of polymers, J. Non-Newtonian Fluid Mech. 81(1999) 197–213.
[21] G.-C. Liaw, J.L. Zakin, G.K. Patterson, Effects of molecular characteristics of polymers on drag reduction, AIChE J. 17 (2)(1971) 391–397.
[22] M. Hellsten, I. Harwigsson, US Patent No. 5,339,855 and Swedish Patent No. 502,764, 1996.[23] M. Ollis, The scaling of drag-reducing turbulent pipe flow, Ph.D. dissertation, University of Bristol, 1981.


![Computers and Fluids 148, 137-156. ... · optimal. Equally, the aerospike design used on Trident II missiles [2, 3] would ... including the design of minimum drag con gurations in](https://img.dokumen.tips/doc/110x75/5ee35fa8ad6a402d666d4897/computers-and-fluids-148-137-156-optimal-equally-the-aerospike-design-used.jpg)


![L-14 Fluids [3] Fluids at rest Fluids at rest Why things float Archimedes’ Principle Fluids in Motion Fluid Dynamics Fluids in Motion Fluid Dynamics](https://img.dokumen.tips/doc/110x75/56649d845503460f94a6ab30/l-14-fluids-3-fluids-at-rest-fluids-at-rest-why-things-float-archimedes.jpg)