Embed Size (px)
DESCRIPTION
Migration - Eugene F. Fama and Kenneth R. French (SSRN-Id926556)
Citation preview

Electronic copy of this paper is available at: http://ssrn.com/abstract=926556
First draft: November 2005 This draft: February 2007
Not for quotation: Comments welcome
Migration
Eugene F. Fama and Kenneth R. French*
Abstract
We study how migration of stocks across size and value portfolios contributes to the size and
value premiums in average stock returns. The size premium is almost entirely due to the small stocks that
earn extreme positive returns and as a result become big stocks. The value premium has three sources: (i)
value stocks that improve in type either because they are acquired by other firms or because they earn
high returns and so migrate to a neutral or growth portfolio; (ii) growth stocks that earn low returns and as
a result move to a neutral or value portfolio; and (iii) slightly higher returns on value stocks that remain in
the same portfolio compared to growth stocks that do not migrate.
* Graduate School of Business, University of Chicago (Fama), and Amos Tuck School of Business, Dartmouth College (French).

Electronic copy of this paper is available at: http://ssrn.com/abstract=926556
Banz (1981) documents a size premium in average returns: small stocks, with low market
capitalization, have higher average returns than big stocks. Many papers (for example, Rosenberg, Reid,
and Lanstein 1985, Fama and French 1992, Lakonishok, Shleifer, and Vishny 1994) identify a value
premium in average returns: stocks with low ratios of price to book value (value stocks) have higher
average returns than stocks with high price-to-book ratios (growth stocks).
Fama and French (2005) find that convergence of price-to-book ratios – downward for growth
stocks and upward for value stocks – plays an important role in the higher average returns of value stocks.
They suggest a simple economic story. At the time firms are allocated to value and growth portfolios,
they tend to occupy opposite ends of the profitability spectrum. Growth firms tend to be highly profitable
and fast-growing, while value firms are less profitable and grow less rapidly if at all (Lakonishok,
Shleifer, and Vishny 1994, Fama and French 1995). High expected profitability and growth combine
with low expected returns (discount rates) to produce high price-to-book ratios (P/B) for growth stocks,
while low profitability, slow growth, and high expected returns produce low P/B for value stocks.
Competition from other firms, however, tends to erode the high profitability of growth stocks,
and profitability also declines as they exercise their most profitable growth options. Thus, each year some
growth stocks cease to be highly profitable fast-growing firms that are rewarded by the market with low
discount rates (expected stock returns). As a result, the price-to-book ratios of growth portfolios tend to
fall in the years after portfolio formation. Conversely, the price-to-book ratios of value portfolios tend to
rise in the years after portfolio formation, as some value firms restructure, their profitability improves,
and they are rewarded by the market with lower discount rates.
The evidence that convergence in price-to-book ratios is an important component of the value
premium in average stock returns suggests that migration of stocks across groups, which gives rise to
convergence, is important in describing the cross-section of average returns. In this paper we examine a
breakdown of average returns that focuses directly on migration. At the end of each June from 1926 to
2005, we form six value-weight portfolios on size (market cap) and P/B. We split each portfolio into four
migration groups: (i) Same – stocks that stay in the same portfolio when portfolios are rebalanced at the

Electronic copy of this paper is available at: http://ssrn.com/abstract=926556
end of June of the following year; (ii) dSize – small stocks that become big and big stocks that become
small; (iii) Plus – stocks that improve in type, that is, they move toward growth or are acquired by another
firm; and (iv) Minus – stocks that deteriorate, that is, they move toward value, are delisted for cause, or
book equity goes negative. We examine how much each migration group contributes to excess returns on
the six size-P/B portfolios, where, in this paper, an excess return is a return minus the value-weight
market return. The market return (the return on stock market wealth) is thus the reference point for
evaluating the returns on the six size-P/B portfolios and the contributions of the Same, Plus, Minus, and
dSize groups to these returns.
To set the stage for a brief summary of our results, we begin by emphasizing that a migration
group’s contribution to a portfolio’s excess return depends both on the group’s excess return and its
weight in the portfolio. For example, a group return close to the market return contributes little to a
portfolio’s excess return even when the group is a large share of the portfolio. Conversely, a group with a
high excess return may not have much effect on a portfolio’s excess return if the group has little weight in
the portfolio.
Size Premium – The higher average returns of small stocks are due primarily to one type of
migration: small stocks that become big – specifically, price appreciation moves a stock’s market cap
from below to above the NYSE median from one year to the next. Big stocks that become small have
strong negative average excess returns, but they contribute little to the size premium. This perhaps
surprising result arises because, unlike stocks that move from small to big, stocks that become small
account for tiny fractions of the market cap of big stock portfolios. Small and big stocks that improve in
type from one year to the next (move toward growth or merge into other firms) have high average excess
returns, but improvements in type make similar contributions to small and big stock returns. As a result,
they are a minor factor in the size premium. Stocks that deteriorate in type or stay in the same portfolio
from one year to the next actually lean against the size premium; that is, they contribute more to returns
on portfolios of big stocks. In the end, the size premium in average returns for 1927-2006 traces almost
2

entirely to the high average excess returns (more than 50%) earned by the 8-12% of small stock market
cap that moves to a big portfolio from one year to the next.
Value Premium – Three of the four migration groups (Same, Plus, and Minus) contribute to the
value premiums in the average returns of 1927-2006. Stocks that stay in the same portfolio from one year
to the next contribute a modest 1.0% (one percentage point) to the value premium for small stocks and
1.7% to the premium for big stocks. These contributions to the value premium trace to the fact that value
stocks that do not migrate have higher average returns than growth stocks that do not migrate.
In contrast, differences in transition frequencies for value and growth stocks largely drive the
contributions of Plus and Minus migration to value premiums. Without changing size groups, there is
little room for growth stocks to improve in type or for value stocks to deteriorate. Thus, Plus transitions
are common for value stocks, but they are rare for growth stocks, and Minus transitions are common for
growth stocks, but they are rare for value stocks. As a result, Plus transitions, which are accompanied by
high returns, contribute about 3.5% (3.5 percentage points) more per year to the excess returns of small
and big value portfolios than they do to the matching growth portfolios. Similarly, Minus transitions and
their low returns are a bigger drag on the excess returns of growth portfolios. The impact is particularly
large for the spread between small value and small growth returns. Minus transitions contribute 5.1% per
year to the 1927-2006 small stock value premium, versus 1.2% for big stocks.
One type of migration acts to lower the small stock value premium. Small value and growth
stocks have high returns when they move to a big stock portfolio; the 1927-2006 average excess returns
exceed 60%, per year and are about the same for growth and value stocks. But migration to a big stock
portfolio from one year to the next is more common among small growth stocks (on average, 11.8% of
market cap) than among small value stocks (8.5%). As a result, moves from small to big add 2.9% per
year more to the average return on the small growth portfolio and so lean against the value premium.
We proceed as follows. Section I describes our portfolios and presents evidence on transition
frequencies. Section II discusses the average returns associated with transitions. Section III studies in
detail how different transition types contribute to the size and value premiums in average returns. Section
3

IV concludes and suggests how our results can be interpreted in terms of rational versus irrational views
of asset pricing.
I. Transition Frequencies
Our tests center on six portfolios formed on size and price-to-book ratios. As in Fama and French
(1993), at the end of each June from 1926 to 2005, we sort stocks into two size groups, S (small, that is,
NYSE, AMEX (after 1962), and (after 1972) Nasdaq stocks with market capitalization (cap) below the
NYSE median) and B (big, market cap above the NYSE median), and three price-to-book groups, G
(growth stocks, that is, NYSE, AMEX, and Nasdaq stocks in the top 30% of NYSE P/B), N (neutral,
middle 40% of NYSE P/B), and V (value, bottom 30% of NYSE P/B). The intersection of these
independent sorts produces six portfolios, SG, SN, SV, BG, BN, and BV, refreshed at the end of June
each year, where SG and BG are small and big growth portfolios, SN and BN are small and big neutral
portfolios, and SV and BV are small and big value portfolios.
To be included in our analysis, a stock must be on the files of the Center for Research in Security
Prices (CRSP) and have a share code of 10 or 11 (ordinary shares), so ADRs and closed end funds are
excluded. We also exclude tracking stock. When forming the size-P/B portfolios at the end of June of
year t, a stock’s size is its June market cap and its price-to-book ratio is its market cap at the end of
December of t-1 divided by its book equity at the end of the last fiscal year in calendar year t-1. Thus,
stocks in the portfolios formed in year t must have market cap data for June of t and December of t-1 and
book equity data for t-1. (The tables explain how we compute book equity.)
A. Migration within the Six Size-P/B Portfolios
Our goal is to measure how migration contributes to the excess returns on our six size-P/B
portfolios for the year after portfolio formation. As noted earlier, the contribution of each type of
transition to a portfolio’s return depends on both the transition’s frequency and the excess return
associated with the transition. Table 1 summarizes the transition frequencies for portfolios formed at the
end of each June from 1926 to 2005.
4

Table 1 reports transition frequencies in two ways: (i) as percents of the market cap of a portfolio
and (ii) as percents of the number of stocks in a portfolio. Specifically, the year t transition vector for a
size-P/B portfolio is the percent of the total market cap of the portfolio (or the percent of the number of
stocks in the portfolio) when formed at the end of June of year t that falls into each of the six portfolios
and other groups when portfolios are rebalanced at the end of June of t+1. Since stocks in our portfolios
are value-weighted (that is, cap-weighted), the fractions of market cap that move across groups from June
of year t to June of t+1 are the appropriate metric for measuring how migration contributes to average
returns, but the fractions of firms that migrate also provide interesting perspective.
The transition frequencies in Part A of Table 1 say that stocks allocated to a portfolio in year t
typically remain in that portfolio in year t+1. Big growth stocks are most likely to stay put; on average,
77.5% of the stocks in BG in year t – representing 86.8% of BG market cap when the portfolio is formed
– remain in BG in year t+1. One-year persistence rates for big neutral and big value are only a bit lower;
on average, about 69% of the stocks and 75% of the market cap of BN and BV remain in these portfolios
from one year to the next. The small growth and small neutral portfolios are the least sticky, but even
here one-year persistence rates are close to 60% for both percent of firms and percent of market cap.
When stocks do migrate, they are more likely to change type (moving across a P/B boundary)
than size (moving between small and big). For example, averaging over 1926-2005, 14.7% of the stocks
and 15.7% of the market cap in SV in year t move to SN in year t+1, but only 2.8% of the stocks and
8.5% of the market cap in SV move to one of the three big portfolios. Similarly, 19.6% of the stocks and
20.8% of the market cap in BV in year t move to BN, but only 7.9% of the stocks and 2.3% of the market
cap move to the small portfolios.
It is rare for stocks to migrate across two P/B boundaries in one year. For example, 24.3% of the
stocks and 22.6% of the market cap in the small growth portfolio in t move to small neutral in t+1, but
only 2.7% of the stocks and 1.7% of the market cap move to small value. Large changes in P/B are even
less common for big stocks. On average, only 0.7% of the stocks and 0.6% of the market cap in BV
move to BG in one year, and a tiny 0.2% of the stocks and market cap in BG move to BV.
5
If we use the percent of stocks to measure transition frequencies, movement across the size
boundary is more likely for big stocks. On average, 6.5% of the stocks in big growth, 6.3% of those in
big neutral, and 7.9% of the stocks in big value move to small. The comparable 1926-2005 averages for
small stocks that become big are 6.3% for SG, 4.7% for SN, and 2.8% for SV. If we look at the percent
of market cap that moves across the size boundary, however, the story is different; migration from small
to big is much more likely than migration from big to small. On average, 8.5% of the time t market cap in
the small value portfolio, 10.2% in small neutral, and 11.7% in small growth move to a big portfolio at
t+1. In contrast, in terms of market cap, the average transition frequencies from big to small are 2.3% for
big value, 1.2% for big neutral, and a tiny 0.9% for big growth.
Why is the fraction of stocks that migrates across the size boundary higher for big portfolios than
for small portfolios? The answer is straightforward. We use only NYSE stocks to define the boundary
between big and small, and there are many tiny Amex (after 1962) and Nasdaq (after 1972) stocks that are
far from the median NYSE market cap. Since these tiny stocks rarely become big in one year, they weigh
down the average fraction of small stocks that move to big. As confirmation, if we look at only NYSE
firms, small stocks are about as likely to cross the size boundary as big stocks. (We do not report these
NYSE-only results in full.)
Why is the fraction of market cap that migrates across the size boundary higher for small
portfolios than for big portfolios? This answer is also straightforward. By definition, stocks near the size
boundary must be larger than the other stocks in a small portfolio and smaller than the other stocks in a
big portfolio. Thus, the likely candidates to move across the size boundary are a relatively large fraction
of the market cap in a (value weight) small portfolio and a small fraction of the market cap in a (value
weight) big portfolio. It is then no surprise that, measured as a percent of the market cap in a portfolio,
there is more migration from small to big than from big to small.
This observation has a significant implication for our decomposition of portfolio returns. As we
shall see, the average returns for stocks that migrate across the size boundary are extreme; small stocks
that become big have large positive returns and big stocks that become small have large negative returns.
6

Because they are typically a tiny part of the three big stock portfolios, the extreme returns on big stocks
that become small have little impact on the returns of these portfolios. In contrast, the combination of
relatively large weights and extraordinary returns implies that small stocks that become big have a large
impact on the returns of the three small stock portfolios.
Stocks in the small growth portfolio are more likely to become big than stocks in the small
neutral or small value portfolios. Similarly, stocks in big value are more likely to become small than
stocks in big growth or big neutral. The explanation is again tied to the fraction of market cap in each
portfolio that is near the size boundary. Value stocks tend to be smaller than growth stocks. Thus, the
fraction of market cap near the size boundary is higher in the small growth portfolio than the small value
portfolio, and it is higher in big value than big growth.
Finally, when stocks move across the size boundary they typically do not change style category.
About two thirds of the small value stocks that become big, for example, move to the big value portfolio,
and two thirds of the big growth stocks that become small move to the small growth portfolio. The most
extreme results are for the small growth and big value portfolios. On average, 10.4% of the SG market
cap in year t moves to BG in t+1 and only 1.3% moves to BN. Similarly, 2.0% of the BV market cap
moves to SV and only 0.3% moves to SN. The extreme results for SG and BV make sense. Since the
increase in market value that makes a small firm big is likely to increase the firm’s price-to-book ratio, we
expect small growth firms to remain growth firms when they become big. Conversely, the decline in
market value that makes a BV stock small is likely to leave it in the value category.
B. Migration Out of the Six Size-P/B Portfolios
Migration to one of the six size-P/B portfolios is not the only possible outcome for a stock. Part
B of Table 1 reports transition frequencies for four other outcomes. Bad Delists are stocks that disappear
between t and t+1 because they no longer meet listing requirements. Good Delists disappear when they
merge into another firm. We are unable to assign firms to one of the six portfolios in t+1 when their book
7

equity goes negative (Neg in Table 1) or when the necessary book or market equity is not available (NA).
Transitions to these groups are relatively infrequent, especially for big stocks.
For example, big stocks rarely delist for cause. The 1926-2005 average fraction of stocks that
become Bad Delists is 0.2% or less for the three big portfolios, and on average these stocks account for
only 0.1% of the market cap of each of these portfolios. Delisting for cause is a bigger threat for small
stocks; on average, 2.2% of small growth stocks, 1.2% of small neutral stocks, and 2.5% of small value
stocks become Bad Delists in the year after they are assigned to a portfolio. Measured as a percent of
market cap, however, the fractions delisting from the small portfolios are lower, 0.6% for SG, 0.4% for
SN, and 0.8% for SV. Thus, the typical Bad Delist is small even among the stocks in the small portfolios.
Finally, it is worth noting that, whether we measure by percent of firms or percent of market cap, small
value stocks are only slightly more likely to delist for cause than small growth stocks.
Small stocks disappear in mergers more often than big stocks, and acquisition by another firm
occurs a bit more often among value stocks than growth stocks. The 1926-2005 average fraction of firms
that become Good Delists is 2.0% for the small growth portfolio, 2.4% for small value, 1.4% for big
growth, and 1.6% for big value. The average fractions of market cap acquired from the small portfolios,
2.4% for SG and 2.7% for SV, are slightly higher than the average fractions of firms acquired, so we can
infer that acquisitions from the small portfolios are typically bigger than the average small stock. On the
other hand, the average fractions of market cap acquired from the big portfolios are a bit lower than the
average fractions of firms. Thus, acquisitions from the big portfolios are typically smaller than the
average big stock.
Finally, the Neg category in Table 2 offers a surprise. Book equity is more likely to go negative
for growth stocks, particularly small growth stocks, than for stocks in the matching neutral and value
portfolios. On average, only 0.4% of stocks and 0.2% of market cap migrate from the small neutral and
small value portfolios to the negative book equity category, but 1.7% of stocks, representing 0.9% of
market cap, migrate from small growth to Neg. This suggests that some firms in the growth portfolios are
8

actually distressed companies that have been misclassified, with high price-to-book ratios only because
their book value has fallen even more than their market value.
II. Migration Returns
Our goal is to understand how migration contributes to the excess returns on the six size-P/B
portfolios in the year after portfolio formation. The transition frequencies in Table 1 describe the relative
importance of each outcome, but an outcome’s contribution also depends on the magnitude of its excess
return. Table 2 shows, for the six size-P/B portfolios formed at the end of June of each year from 1926 to
2005, the average annual excess returns for June 1927 to June 2006 for the different possible outcomes.
The size and value effects are apparent in the average excess returns for the six portfolios in
Table 2. Controlling for size, the average excess returns for the value portfolios, 9.2% for SV and 4.8%
for BV, exceed the average excess returns for the growth portfolios, 2.2% for SG and -0.9% for BG. And
controlling for style, the average excess returns for the small portfolios exceed those of the big portfolios.
As one would expect, most of the action in average returns is associated with migration. The
average (value-weight) excess returns for moves from small to big are particularly impressive, ranging
from 34.3% to 165.8% per year. And we shall see that because they hit non-trivial fractions of market
cap, these outcomes are important in the small portfolio returns. Migration of big stocks to a small stock
portfolio is associated with strong negative average excess returns, from -24.1% to -53.2% per year, but
because such moves affect tiny fractions of portfolio market cap, we shall see that they do not contribute
much to the average returns of the big stock portfolios.
Good Delists have a positive effect on the average excess returns of all six portfolios. Since these
firms are the targets in successful mergers, it is not surprising that their average excess returns are large,
15.6% or higher. The strong negative excess returns for Bad Delists are also not surprising; the average
excess return for five of the six portfolios is -17.8% or lower, and the sixth portfolio, big growth, does not
have enough Bad Delists to draw a meaningful inference.
9

Finally, migration to a lower price-to-book category – from SG to SN or SV, for example, or
from BG to BN or BV – is associated with consistently large negative average excess returns, from
-15.0% to -36.0% for small stocks and from -11.7% to -13.6% for big stocks. Similarly, migration to a
higher P/B category produces consistently large positive average excess returns, from 18.8% to 50.3% for
small and from 16.5% to 29.7% for big. As we see next, these changes in type contribute a lot to the size
and value effects in the average returns of the six size-P/B portfolios.
III. Migration and Returns: A More Manageable Grid
Table 3 provides a more concise perspective on how migration affects the average returns on the
six size-P/B portfolios. The table collapses migration into four groups. The first is Same, which includes
stocks that are in the same size-P/B portfolio when allocations are made in June of year t and June of t+1.
Same also includes NA, the stocks allocated to the portfolio at t that are traded at t+1 but are missing
book equity or shares outstanding at t+1. Allocating NA stocks to the Same group is our best guess at
where they would go if we had the relevant data, but the choice is innocuous since the NA group is
always tiny relative to the total market cap in the Same group. The second migration group, Plus,
includes stocks that improve in type from t to t+1 because they (i) move to a higher P/B portfolio in the
same size group (for example, from value toward growth), or (ii) become a Good Delist (merger). The
third migration group, Minus, is stocks that deteriorate in type, which means (i) they move to a lower P/B
portfolio in the same size group (for example, from growth toward value), or (ii) they become a Bad
Delist, or (iii) book equity goes negative. The final migration group, dSize, includes stocks that change
size groups from t to t+1, that is, small stocks that become big and big stocks that become small.
For each size-P/B portfolio, there are three sets of results in Table 3: (i) value-weight average
annual returns in excess of the value-weight market return for a portfolio and for its Minus, Same, Plus,
and dSize groups; (ii) average transition probabilities for the four groups, and (iii) average contributions
of the groups to the portfolio’s overall average excess return. The full sample period for annual returns in
Table 3 is 1927-2006 (more precisely, June 1927 through June 2006, for portfolios formed at the end of
10

each June from 1926 to 2005), but results are also shown for 1927-1963 (June 1927 through June 1963)
and 1964-2006 (June 1964 through June 2006). June 1963 is the initial portfolio formation date in most
previous work on the value premium. The discussion focuses on the full sample period, but we also note
the instances where subperiod and full period results differ.
A. Group Average Returns
Comparing average excess returns for the Minus, Same, Plus, and dSize groups of a portfolio
with its overall average excess return tells us which transitions increase a portfolio’s average return and
which push it down. Many of the results are predictable. For example, the average excess return for
Minus transitions (deterioration in type) by the stocks in a portfolio is always far less than the portfolio’s
average excess return, so Minus transitions reduce a portfolio’s average excess return. Conversely, the
average excess return for Plus transitions by stocks in a portfolio is almost always more than 10% above
the portfolio’s average excess return.
Small stocks that migrate to a big stock portfolio have the highest average excess returns. The
1927-2006 average excess returns for such dSize transitions, 50.1% to 61.6% per year, are far above the
average excess returns of the parent small stock portfolios, which range from 2.2% to 9.2% per year.
Similarly, the average excess returns for big stocks that migrate to small, between -31.1% and -37.4% for
1927-2006, are far below the average excess returns of the parent big stock portfolios.
A somewhat surprising result in the group average returns in Table 3 is that staying in the Same
portfolio is bad news for stocks in five of the six size-P/B portfolios; that is, the average excess return for
stocks that remain in a portfolio is lower than the portfolio’s overall excess return. It makes sense that the
big growth portfolio, BG, is the exception. Most routes out of BG are bad; on average 10.9% of BG
market cap experiences Minus transitions in the year after portfolio formation, and 0.9% of market cap
moves to one of the small stock portfolios. The only good way to leave BG is acquisition by another firm
– an event that on average hits only 0.7% of BG market cap each year. The status quo is thus a good
outcome for a big growth firm. In contrast, the greater chance of moving toward growth, or from small to
11

big, or being acquired, makes staying in the Same portfolio bad news for stocks in the other five
portfolios. Finally, staying in the same portfolio is worse news for small stocks. The reason is that from
one year to the next about 10% of small stock market cap migrates to a big portfolio, an outcome
associated with extreme positive returns well outside the range of average returns for outcomes
experienced by big stocks.
There are some subtle surprises in the average excess returns for the Same groups in Table 3. For
example, big growth stocks have no place to go (they remain big growth stocks) when they experience
high returns. But when big value stocks have high returns, they can migrate to the big neutral portfolio or
(less often) to the big growth portfolio. As a result, we might expect that staying in the Same portfolio is
associated with higher average returns for big growth stocks. Table 3 shows, however, that for the full
1927-2006 period, the average excess return for big growth stocks that remain big growth stocks from one
year to the next, 0.8% per year, is lower than the 3.2% excess return for big value stocks that do not
move. This result, however, seems to be special to 1927-1963. The 1964-2006 average annual excess
return for big growth stocks that do not change type is 1.0% higher than the average for big value stocks
that do not migrate.
Similarly, small growth stocks can migrate to one of the big portfolios when they experience high
returns, but otherwise high returns leave them in SG. Small value stocks with high returns can also
migrate to one of the big portfolios, but they have the additional option of moving to the small neutral or
the small growth portfolio. One might then expect that staying in the Same portfolio is associated with
higher average returns for SG than for SV stocks. The opposite is true; for 1927-2006 and for the two
subperiods, SV stocks that do not migrate have higher average returns than SG stocks that do not move.
B. Group Contributions to Portfolio Average Returns
Our main focus in Table 3 is the evidence on the contributions of the four migration groups
(Minus, Same, Plus, and dSize) to the average excess returns of the six size-P/B portfolios. These results
produce our insights about the size and value premiums in returns.
12

Expressed in terms of group outcomes, a portfolio’s average excess return is,
(1) , P,t+1 M,t+1 iPt iP,t+1 M,t+1 iPt iP,t+1 M,t+1t t i i t
(R R )/T = w (R R )/T w (R R )/T− − =∑ ∑∑ ∑∑ −
where RP,t+1 and RM.t+1 are the returns for the year from t to t+1 on portfolio P and the value-weight
market, RiP,t+1 is the return for outcome i (Minus, Same, Plus, or dSize) of portfolio P, wiPt is the fraction
of P’s market cap at t that migrates to outcome i at t+1, and T is the number of years in the sample period.
Two observations about equation (1) warrant emphasis. First, an outcome’s contribution to a
portfolio’s excess return depends not just on the outcome’s excess return but also on its likelihood. For
example, an outcome that produces large returns can contribute little to an overall portfolio return if it is
rare. Second, a portfolio’s average excess return is the sum of the average contributions of the four
possible outcomes for stocks in the portfolio. This makes it easy to explore how outcomes contribute to
portfolio average excess returns and to the size and value premiums.1
Size Premium – Consider first the size premium (higher average returns of small stocks relative
to big stocks). With the single exception of value stocks in 1927-1963, Minus transitions (deteriorations
in type) reduce the average excess returns of the three small portfolios more than they reduce the returns
of the matching (growth, neutral, or value) big stock portfolio. Similarly, the Same groups of the big
stock portfolios generally contribute more to average excess returns than the Same groups of the matching
small stock portfolios, in part because the average excess returns of big stocks that do not migrate tend to
be higher, but more importantly because more big stock market cap stays in the same portfolio from one
year to the next. Since the Minus and Same groups contribute more to the average excess returns on big
stock portfolios, they lean against the size premium in average returns. This is true for 1927-1963 and
1963-2006 as well as for the full 1927-2006 period.
In the results for 1927-2006 and 1963-2006, the return contributions from Plus transitions
(improvements in type) for small stocks are equal to or a bit higher than the contributions for big stocks of
1 Because of covariance effects, however, the time series average of the product of each outcome’s return and the fraction of the market cap that migrates to that outcome is not the product of the outcome’s average return times its average transition probability [E(XY) ≠ E(X)E(Y)].
13
the same type. Thus, Plus transitions add a little to the size premium in the full sample period and in the
second subperiod. The opposite is true in the first subperiod. During 1927-1963 the return contributions
from Plus transitions are slightly larger for big stocks than for small stocks of the same type.
These nuances aside, the dominant source, by far, of the size premium is migration by small
stocks to a big stock portfolio. Transitions by big stocks to a small stock portfolio produce strong
negative excess returns that pull down the returns of the big portfolios and reinforce the size premium.
But such transitions carry little weight; on average, only 0.9% to 2.2% of big stock market cap moves to a
small stock portfolio from one year to the next. As a result, the contributions to average portfolio excess
returns of big stocks that become small are near zero (-0.4% to -0.7%, that is, less than one percentage
point per year for 1927-2006).
In contrast, the 1927-2006 average fractions of small stock market cap that migrate to a big
portfolio from one year to the next are 8.5% (SV), 10.2% (SN) and 11.8% (SG). The average excess
returns from such moves are enormous, 61.5% (SV), 50.1% (SN), and 61.6% (SG) per year. The result is
large contributions to overall average portfolio excess returns by small stocks that become big, 5.6 (SV),
5.1 (SN), and 8.5 (SG) percentage points per year.
It is not surprising that small stocks that migrate to one of the big portfolios are an important
factor in the size premium in average returns, but it may seem surprising that big stocks that become
small are a trivial factor. There is a simple explanation. As discussed earlier, migration across the size
boundary is more likely for stocks near the boundary when portfolios are formed at time t. Small stocks
near the size boundary are the bigger stocks in a small portfolio, whereas stocks near the size boundary in
a big stock portfolio are the smaller stocks in the portfolio. As a result, the fractions of small stock
market cap that move to a big portfolio from one year to the next are much larger than the rather tiny
fractions of big stock market cap that cross the size boundary. Nevertheless, we are surprised that
migration from small to big totally dominates migration from big to small, and all other transitions, as the
source of the size premium in average returns.
14

Value Premiums – Migration from small to big is more common for growth stocks than for value
stocks, and these high-return transitions contribute more to the 1927-2006 average excess return of SG
(8.5%) than to the excess return of SV (5.6%). On the other hand, migration from big to small is less
common for growth stocks, and these low-return transitions put a bit less drag on the average excess
return of BG (-0.4%, versus -0.7% for BV). In both cases, the dSize contributions to excess returns are
larger for growth stocks, so these transitions tend to reduce the value premiums for small and big stocks.
The three remaining outcomes make positive contributions to value premiums.
Minus transitions add a substantial 5.1 percentage points to the 1927-2006 spread between small
value and small growth returns and 1.2% to the value spread for big stocks. Similarly, Plus transitions
contribute 3.7% to the value spread for small stocks and 3.2% to the spread for big stocks. In each case,
most of the difference between an outcome’s contributions to value and growth returns is explained by
differences in the likelihood of the outcome. Minus transitions, for example, are consistently bad news,
with 1927-2006 average excess returns between -11.5% and -36.3%. This negative outcome is common
for growth stocks, but because they are already relatively distressed, it is rare for value stocks. On
average, 25.8% of the market cap of the small growth portfolio and 10.9% of the big growth portfolio fall
into the Minus category, but only 1.0% of SV and 0.1% of BV suffer this fate. There is a similar but
symmetric story for Plus transitions. Plus transitions are consistently good news, with average excess
returns between 15.6% and 21.9%. This positive outcome is common for value stocks, but because they
are already growth stocks, few SG and BG stocks experience these high returns.
Stocks that do not change type (Same) contribute a modest 1.0% to the 1927-2006 value spread
for small stocks and 1.7% to the spread for big stocks. Unlike Plus and Minus transitions, which increase
the value premium because the frequencies of the outcomes are a lot different for value and growth
stocks, differences in the excess returns of value and growth stocks that remain in their initial portfolio are
the main factor in the Same category’s contributions to the value premium. The average excess return for
small value stocks that do not change type, -0.3%, is 2.7% higher than the average for SG, -3.0%.
15

Similarly, the average excess return for big value stocks in the Same category is 2.4% higher than the
average for big growth.
III. Bottom Line
Our results on how migration leads to the size and value premiums in average returns are easily
summarized. The size premium is due almost entirely to the extreme positive returns of small stocks that
move to a big stock portfolio from one year to the next. Three factors contribute to the value premium.
(i) Plus transitions, with their high returns, occur more often for value stocks than for growth stocks. (ii)
Minus transitions and their low returns are more likely for growth stocks. (iii) Value stocks that remain in
the Same portfolio from one year to the next have higher average returns than the matching (small or big)
growth stocks. These positive contributions to the value premium are somewhat offset by small stocks
that become big. Small growth stocks are more likely than small value stocks to move to a big portfolio
from one year to the next. The average returns from these dSize transitions are huge, and their greater
weight in the small growth portfolio pushes up its average return and lowers the value premium.
Finally, when stocks are allocated to portfolios in June of year t, one does not know where they
will fall with respect to the possible outcomes (Same, Plus, Minus, dSize) to be observed in June of t+1.
If prices are rational, however, the prices set at t reflect the best possible forecasts of (i) transition
probabilities and (ii) the prices at t+1 that will be observed as a result of transitions. And equilibrium
prices at t will imply expected returns that compensate the relevant risks of securities. In this view the
size and value premiums in average returns are the result of rational risks of concern to investors, the
view we espouse in Fama and French (1993) and other papers.
This rational view of asset pricing has a well-known competitor. Behaviorists like Lakonishok,
Shleifer, and Vishny (1994) argue that the size and value premiums are the result of irrational pricing,
specifically, consistently biased estimates of transition probabilities. For example, behaviorists would
argue that the irrational investors who dominate prices underestimate the probabilities that small stocks
become big, that value stocks improve in type, and that growth stocks deteriorate. The result is
16

unexpected low returns for growth stocks in the year after portfolio formation and unexpected high
returns for small stocks and value stocks. In this view, migration and its implications for payoffs are in
part unexpected, at least by the consistently irrational (and learning impaired) investors that dominate
asset prices.
Our results do not allow us to distinguish between the rational and irrational views of asset
pricing. But they do help frame the issues.
17

18
References
Banz, Rolf W., 1981, The relationship between return and market value of common stocks, Journal of Financial Economics 9, 3-18.
Fama, Eugene F. and Kenneth R. French, 1992, The cross-section of expected stock returns, Journal of
Finance 47, 427-465. Fama, Eugene F. and Kenneth R. French, 1993, Common risk factors in the returns on stocks and bonds,
Journal of Financial Economics 33, 3-56. Fama, Eugene F. and Kenneth R. French, 1995, Size and book-to-market factors in earnings and returns,
Journal of Finance 50, 131-156 . Fama, Eugene F. and Kenneth R. French, 2005, The anatomy of value and growth returns, working paper,
University of Chicago. Lakonishok, Josef, Andrei Shleifer, and Robert W. Vishny, 1994, Contrarian investment, extrapolation,
and risk, Journal of Finance 49, 1541-1578. Rosenberg, Barr, Kenneth Reid, and Ronald Lanstein, 1985, Persuasive evidence of market inefficiency,
Journal of Portfolio Management 11, 9-17.

Table 1 – Average transition vectors for stocks that migrate within or exit the group of six size-B/P portfolios, as a percent of firms in a portfolio and as a percent of the portfolio’s market cap in June of the portfolio formation year We form six value weight portfolios, SG, SN, SV, BG, BN, and BV, at the end of each June from 1926 to 2005 as the intersections of two size groups, small (S, firms with June market cap below the NYSE median) and big (B, above the median), and three price-to-book (P/B) groups, growth (G, firms in the top 30% of NYSE P/B), neutral (N, middle 40%), and value (V, bottom 30%). In the P/B sorts for portfolios formed in June of year t, book equity is for the fiscal year ending in calendar year t-1 and market equity is for the end of December of t-1. The portfolios for year t include NYSE, Amex (after 1962), and Nasdaq (after 1972) stocks with positive book equity in t-1. Book equity for 1963 to 2005 is Compustat’s total assets (data item 6), minus liabilities (181), plus deferred taxes and investment tax credit (35) if available, minus (as available) liquidating (10), redemption (56), or carrying value (130) of preferred stock. Book equity for years before 1963, and for some NYSE firms after 1963, is hand collected from Moody’s manuals. The transition vectors in Part A are for the firms assigned to a portfolio in June of year t that are also in one of the six portfolios in t+1. The transition vectors in Part B are for the firms assigned to a portfolio in June of year t that are not in any of the six portfolios in t+1. These include (i) Good Delists, which stop trading between June of t and June of t+1 because they are acquired by another firm (CRSP delist codes 200 to 399); (ii) Bad Delists, which stop trading because they no longer meet listing requirements (CRSP delist codes below 200 and above 399), (iii) firms with negative book equity for the fiscal year ending in calendar year t (Neg); and (iv) firms missing book equity for year t or market equity for December of t or June of t+1 (NA). The year t transition vector for a portfolio is the fraction of firms in the portfolio or the fraction of the total market cap in the portfolio when formed at the end of June of year t that falls into each of the groups at the end of June of t+1. The table reports averages of the annual transition vectors. Each row in Part A or Part B shows the average transition vector for a particular portfolio. Up to rounding error, the overall sum of the transition percents for a portfolio in Parts A and B is 100, both for percents of portfolio stocks and for percents of portfolio market cap. Part A: Average Transition Vectors within the Group of Six Size-B/P Portfolios, for Portfolio Formation Years 1926-2005 Percent of Portfolio Stocks in June of Formation Year Percent of Portfolio Market Cap in June of Formation Year SG SN SV BG BN BV SG SN SV BG BN BV SG 59.0 24.3 2.7 5.5 0.8 0.0 58.7 22.6 1.7 10.4 1.3 0.0 SN 10.9 58.5 20.1 1.2 3.2 0.3 9.1 59.8 16.1 2.5 7.1 0.6 SV 1.8 14.7 73.5 0.1 0.9 1.8 1.2 15.7 69.4 0.3 2.9 5.3 BG 4.4 1.9 0.2 77.5 13.1 0.2 0.6 0.3 0.0 86.8 10.4 0.2 BN 0.4 4.3 1.6 12.5 68.8 9.2 0.1 0.8 0.3 13.7 74.7 8.5
74.3 BV 0.1 1.0 6.8 0.7 19.6 69.0 0.0 0.3 2.0 0.6 20.8

Table 1 (continued)
Part B: Average Transition Vectors for Stocks that Leave the Six Size-B/P Portfolios, for Portfolio Formation Years 1926-2005 Percent of Portfolio Firms in June of Formation Year Percent of Portfolio Market Cap in June of Formation Year Bad Good Bad Good Delists Delists Neg NA Delists Delists Neg NA SG 2.2 2.0 1.7 1.8 0.6 2.4 0.9 1.3 SN 1.2 2.6 0.4 1.6 0.4 2.8 0.2 1.3 SV 2.5 2.4 0.4 1.8 0.8 2.7 0.2 1.4 BG 0.2 1.4 0.2 1.0 0.1 0.7 0.1 0.7 BN 0.2 2.0 0.1 0.8 0.1 1.3 0.0 0.4 BV 0.1 1.6 0.0 1.0 0.1 1.1 0.0 0.9
2
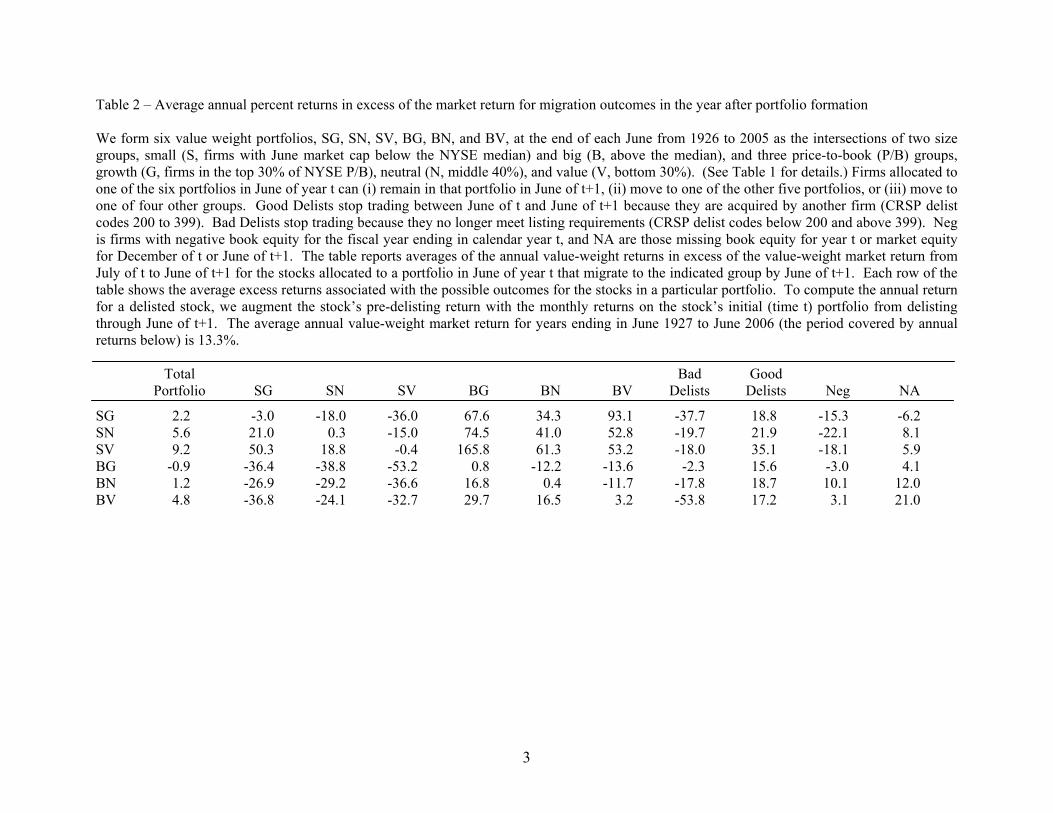
Table 2 – Average annual percent returns in excess of the market return for migration outcomes in the year after portfolio formation We form six value weight portfolios, SG, SN, SV, BG, BN, and BV, at the end of each June from 1926 to 2005 as the intersections of two size groups, small (S, firms with June market cap below the NYSE median) and big (B, above the median), and three price-to-book (P/B) groups, growth (G, firms in the top 30% of NYSE P/B), neutral (N, middle 40%), and value (V, bottom 30%). (See Table 1 for details.) Firms allocated to one of the six portfolios in June of year t can (i) remain in that portfolio in June of t+1, (ii) move to one of the other five portfolios, or (iii) move to one of four other groups. Good Delists stop trading between June of t and June of t+1 because they are acquired by another firm (CRSP delist codes 200 to 399). Bad Delists stop trading because they no longer meet listing requirements (CRSP delist codes below 200 and above 399). Neg is firms with negative book equity for the fiscal year ending in calendar year t, and NA are those missing book equity for year t or market equity for December of t or June of t+1. The table reports averages of the annual value-weight returns in excess of the value-weight market return from July of t to June of t+1 for the stocks allocated to a portfolio in June of year t that migrate to the indicated group by June of t+1. Each row of the table shows the average excess returns associated with the possible outcomes for the stocks in a particular portfolio. To compute the annual return for a delisted stock, we augment the stock’s pre-delisting return with the monthly returns on the stock’s initial (time t) portfolio from delisting through June of t+1. The average annual value-weight market return for years ending in June 1927 to June 2006 (the period covered by annual returns below) is 13.3%. Total Bad Good Portfolio SG SN SV BG BN BV Delists Delists Neg NA SG 2.2 -3.0 -18.0 -36.0 67.6 34.3 93.1 -37.7 18.8 -15.3 -6.2 SN 5.6 21.0 0.3 -15.0 74.5 41.0 52.8 -19.7 21.9 -22.1 8.1 SV 9.2 50.3 18.8 -0.4 165.8 61.3 53.2 -18.0 35.1 -18.1 5.9 BG -0.9 -36.4 -38.8 -53.2 0.8 -12.2 -13.6 -2.3 15.6 -3.0 4.1 BN 1.2 -26.9 -29.2 -36.6 16.8 0.4 -11.7 -17.8 18.7 10.1 12.0 BV 4.8 -36.8 -24.1 -32.7 29.7 16.5 3.2 -53.8 17.2 3.1 21.0
3

Table 3 – Migration: Average annual excess returns, average transition vectors, and average contributions to average excess returns For each of the six size-P/B portfolios, we group the ten outcomes in Table 1 into four categories. Same includes firms allocated to the same size-P/B portfolio when it is formed in June of year t and when it is reformed in June of t+1. It also includes NA, firms missing book equity for year t or market equity for December of t or June of t+1. Minus includes stocks in a portfolio that (i) move to a lower P/B portfolio in the same size group, or (ii) no longer meet listing requirements (Bad Delists in Table 1), or (iii) have negative book equity for the fiscal year ending in calendar year t (Neg in Table 1). Plus includes stocks in a portfolio that (i) move to a higher P/B portfolio in the same size group or (ii) are acquired by another firm (Good Delists in Table 1). For a small stock portfolio (SG, SN, or SV), dSize includes firms that move to any of the big stock portfolios (BG, BN, or BV). For a big stock portfolio (BG, BN, or BV), dSize includes firms that move to any of the small stock portfolios (SG, SN, or SV). Average Excess Return is the average of the annual value-weight returns in excess of the value-weight market return for the year after portfolio formation for all stocks in a size-P/B portfolio (Portfolio) or for the Minus, Same, Plus, or dSize groups of the portfolio. The year t transition vector for a portfolio is the fraction of the aggregate market cap of the portfolio when formed at the end of June of year t that is in the Minus, Same, Plus, or dSize group at the end of June of t+1. The Average Transition Vector is the average of the annual vectors. The Minus, Same, Plus, or dSize group’s contribution to a portfolio’s average return for year t is the fraction of the year t market cap that migrates to the group in t+1 times the value weight average excess return for the group from t to t+1. The Average Contribution to the Average Excess Return is the average of the annual contributions. The average annual value-weight market return is 13.3% for years ending in June 1927 to June 2006, 14.7% for June 1927 to June 1963, 12.1% for June 1964 to June 2006, and these are the periods covered by returns.
Average Contribution to Portfolio’s Average Excess Return Average Transition Vector Average Excess Return
Portfolio Minus Same Plus dSize Minus Same Plus dSize Minus Same Plus dSize Annual returns ending in June 1927 to June 2006 for portfolios formed at the end of each June of 1926 to 2005 SG 2.2 -19.3 -3.0 18.8 61.6 25.8 60.0 2.4 11.8 -5.3 -1.5 0.5 8.5 SN 5.6 -15.3 0.5 21.9 50.1 16.7 61.1 11.9 10.2 -2.7 0.6 2.6 5.1 SV 9.2 -17.1 -0.3 21.5 61.5 1.0 70.9 19.6 8.5 -0.2 -0.5 4.2 5.6 BG -0.9 -12.0 0.8 15.6 -37.4 10.9 87.5 0.7 0.9 -1.2 0.6 0.1 -0.4 BN 1.2 -11.5 0.4 16.6 -31.1 8.6 75.1 15.0 1.2 -0.9 0.3 2.2 -0.4 BV 4.8 -36.3 3.2 16.9 -31.7 0.1 75.2 22.5 2.2 0.0 2.3 3.3 -0.7
4

Table 3 (Continued)
Average Contribution to Portfolio’s Average Return in Excess of Market Return Average Transition Vector Average Excess Return
Portfolio Minus Same Plus dSize Minus Same Plus dSize Minus Same Plus dSize Annual returns ending in June 1927 to June 1963 for portfolios formed at the end of each June of 1926 to 1962 SG 4.7 -13.6 -3.2 -0.9 61.8 28.5 56.4 1.2 13.9 -4.5 -1.4 -0.1 10.7 SN 5.3 -13.9 0.9 18.7 48.6 15.4 65.7 7.2 11.7 -2.4 1.1 1.1 5.6 SV 10.7 -12.0 1.0 21.7 70.7 0.8 75.7 13.3 10.1 0.0 0.0 2.8 7.8 BG -1.1 -10.5 0.4 9.5 -30.8 10.5 88.8 0.2 0.5 -1.0 0.1 0.0 -0.2 BN 1.8 -11.4 0.4 17.7 -29.7 5.7 77.4 15.8 1.1 -0.5 0.2 2.4 -0.3 BV 7.1 -75.4 6.7 20.4 -31.9 0.0 78.1 19.1 2.8 0.0 4.8 3.3 -1.0 Annual returns ending in June 1964 to June 2006 for portfolios formed at the end of each June of 1963 to 2005 SG 0.0 -24.1 -2.8 25.2 61.4 23.4 63.1 3.5 9.9 -6.0 -1.6 1.0 6.6 SN 5.8 -16.5 0.1 24.6 51.5 17.8 57.2 16.0 9.0 -2.9 0.1 4.0 4.6 SV 8.0 -20.7 -1.4 21.4 53.8 1.1 66.7 25.1 7.2 -0.3 -1.0 5.5 3.8 BG -0.8 -13.2 1.2 17.8 -43.0 11.2 86.3 1.2 1.3 -1.4 1.1 0.2 -0.6 BN 0.6 -11.6 0.4 15.6 -32.3 11.1 73.2 14.3 1.4 -1.3 0.3 2.0 -0.5 BV 2.8 -29.2 0.2 14.0 -31.6 0.1 72.7 25.5 1.7 0.0 0.0 3.3 -0.5
5


![Ssrn Id241350[1]](https://img.dokumen.tips/doc/110x75/54bda6554a7959b7088b46e1/ssrn-id2413501.jpg)