Embed Size (px)
DESCRIPTION
Migration and Wellbeing: Some reflections. Mauricio Cárdenas ( with Vincenzo Di Maro and Carolina Mejía) InterAmerican Development Bank’s project on Quality of Life Conference on Regional Trade Agreements, Migration and Remittances: Focus on CAFTA and Latin America - PowerPoint PPT Presentation
Citation preview

Migration and Wellbeing: Some reflections
Mauricio Cárdenas
(with Vincenzo Di Maro and Carolina Mejía)
InterAmerican Development Bank’s project on Quality of Life
Conference on Regional Trade Agreements, Migration and Remittances: Focus on CAFTA and Latin America
Sam Houston State University, Huntsville, TXApril 12, 2008

Research Questions• Effects of migration on wellbeing.• Previous emphasis on the effects of remittances
on poverty and human capital investment. • Interesting to go beyond the relationship between
migration, income, and choice (consumption of tangible goods and services).
• Migration may have welfare reducing effects such as family fragmentation.
• For example, does migration offset (or amplify) vulnerabilities?

Outline
1. The four dimensions of “Quality of Life”
2. Livability and migration
3. Satisfaction with life, vulnerabilities and migration
4. Econometric results
5. Conclusions

Outline
1. The four dimensions of “Quality of Life”
2. Livability and migration
3. Satisfaction with life, vulnerabilities and migration
4. Econometric results
5. Conclusions

Veenhoven’s (2000) taxonomy of QoL
The Four Qualities of Life Outer Quality Inner Quality
Life Chances Livability of environment
Life-ability of person
Life Results Utility of life
Satisfaction with life
The Four Qualities of Life Outer Quality Inner Quality
Life Chances Livability of environment
Life-ability of person
Life Results Utility of life
Satisfaction with life
Focus on two QoL dimensions and their relationship with migration

Outline
1. The four dimensions of “Quality of Life”
2. Livability and migration
3. Satisfaction with life, vulnerabilities and migration
4. Econometric results
5. Conclusions
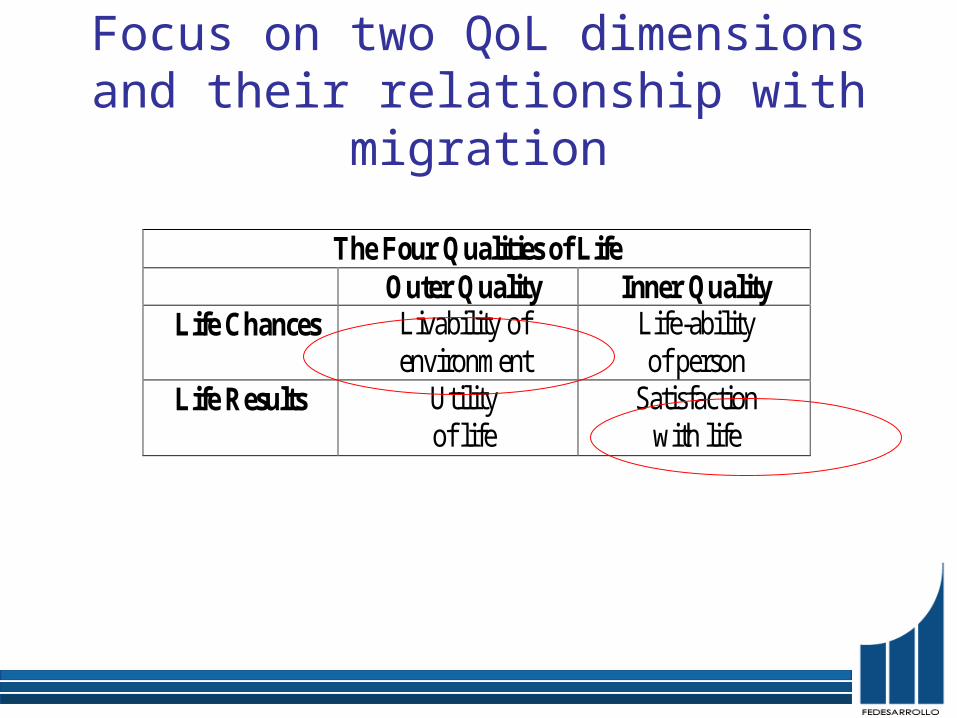
Outer quality of life chances: Livability
Rojas (2008)The external conditions or environmental
opportunities that are assumed to be relevant for living a good life
Three livability areas
Economic livability
Social livability
Political livability

Outer quality of life chances Livability
Yearly GNP growth
Yearly inflation rate
Per capita GNP
Gini Coefficient
People below poverty line
Economic index

Public expenditure on health
Public expenditure on education
Social contributions
Subsidies and other transfers
Social index
Outer quality of life chances Livability

Political rights
Civil Freedoms
Voice and accountability
Political stability
Rule of law
Control over corruption
Political index
Outer quality of life chances Livability

• Variables from various sources• Country-level variables
• Categories• Ordinal codification: 1 to 6• Aggregation by livability area: mean values• Three livability-area indicators
» Economic, social, and political
– Overall livability indicator
Outer quality of life chances Livability

1/3 Economic Index
1/3 Social Index
1/3 Political Index
=Overall livability
Index
Continuous on scale of 1 to 6
Country level variable
Outer quality of life chances Livability

Country Economic Rank Social Rank Political Rank Overall Rank Chile 1 9 1 1 Uruguay 2 6 3 2 Costa Rica 5 2 2 3 Argentina 6 1 7 4 Belize 3 10 4 5 Panama 7 11 5 6 Brazil 13 4 8 7 Mexico 8 13 9 8 Colombia 10 3 17 9 Dominican Rep 4 20 6 10 Ecuador 9 14 14 11 Guyana 17 5 12 12 Peru 11 15 10 13 Nicaragua 18 7 13 14 Bolivia 20 8 16 15 Honduras 14 16 15 16 Venezuela 12 12 20 17 El Salvador 15 19 11 18 Guatemala 16 17 19 19 Paraguay 19 18 18 20
Outer quality of life chances Livability

Livability and net outflow of emigrants (% pop.):
Averages for 1995, 2000, and 2005
CRI
PANCHL VENBRAARGURY BLZ HND PRYCOL SLV
PER BOLDOM
ECUMEX NICGTM
GUY-2
02
46
net e
mig
ratio
n (%
of t
otal
)
0 5 10 15 20livability ranking
Fitted values net emigration (% of total)

CRIPAN
CHLVEN
BRAARG
URYBLZ
HNDPRY
COLSLV
PERBOL
DOMECU
MEXNIC
GTMGUY
05
1015
20ne
t em
igra
tion
(% o
f tot
al) r
anki
ng
0 5 10 15 20livability ranking
Fitted values net emigration ranking
Livability and net outflow of emigrants (rankings):
Averages for 1995, 2000, and 2005

CRI
PAN
CHL
VENBRA
ARG
URY
HNDPRY
COL
SLV
PER
BOL
DOM
ECU
MEX
NIC
GTM
05
1015
20em
igra
nts
stoc
k (%
of t
otal
)
0 5 10 15 20livability ranking
Fitted values emigrants stock (% of total)
Livability ranking and percentage of population living abroad in 2005

CRIPAN
CHL VENBRAARGURY
BLZ
HND
PRY
COL
SLV
PER BOL
DOM
ECU
MEX
NIC
GTM
GUY
05
1015
rem
ittan
ces
(% o
f GD
P)
0 5 10 15 20livability ranking
Fitted values Workers' remittances (% of GDP)
Livability and remittances as percentage of GDP:2005

Outline
1. The four dimensions of “Quality of Life”
2. Livability and migration
3. Satisfaction with life, vulnerabilities, and migration
4. Econometric results
5. Conclusions

The Four Qualities of Life Outer Quality Inner Quality
Life Chances Livability of environment
Life-ability of person
Life Results Utility of life
Satisfaction with life
Veenhoven’s taxonomy of QoL

Data• Gallup World Poll (2006 and 2007), 132 countries.
– Sample: cross section; around 1000 individual observations per country.
• Latinobarómetro survey (1995-2005), 18 LAC countries.– Sample: representative of 100% of population in
all countries but Chile (70%).
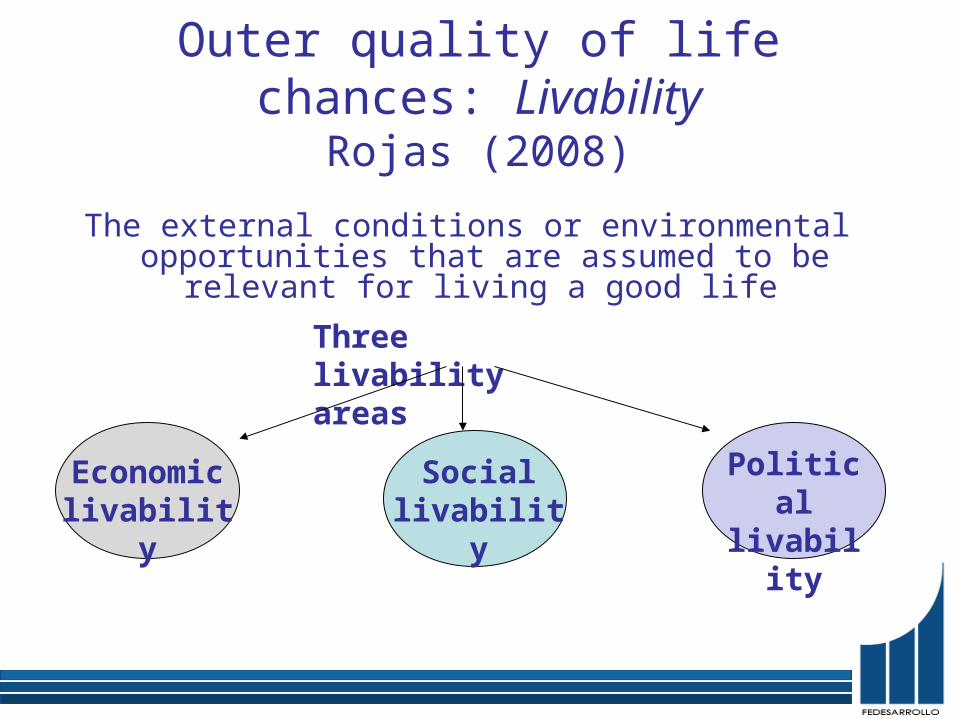
We focus on three measures of perceived wellbeing from the Gallup Survey and one
from LatinobarómetroGallup World Poll
1. Overall satisfaction with life (ladder question): From zero to ten, where do you personally feel at this time, assuming that the higher score the better you feel about your life, and the lower score the worse you feel about it?
2. Satisfaction with living standards: Are you satisfied or dissatisfied with your standard of living, all the things you can buy and do?
3. Satisfaction with freedom: [In your country] Are you satisfied with the freedom to choose what you do with your life?
Latinobarómetro 4. Overall satisfaction with life: In general terms, how
satisfied are you with your life? (1) Very satisfied, (2) fairly satisfied, (3) satisfied or (4) not very satisfied.

Life satisfaction (ladder question)
02
46
8
Note: Black bar is average value, white bar is standard deviation.Source: Authors’ calculations using Gallup World Poll wave 2007.

Box Plot of (current) life satisfaction measure or ladder
question
02
46
810
excludes outside values
Source: Authors’ calculations using Gallup World Poll wave 2007.

Satisfaction with living standards
0.2
.4.6
.8
Note: Black bar is average value, white bar is standard deviation.Source: Authors’ calculations using Gallup World Poll wave 2007.

Life Satisfaction – Latinobarómetro, waves 2001, 2003 and 2004
0.2
.4.6
Source: Authors’ calculations using Latinobarómetro waves 2001, 2003 and 2004 ; Notes: first bar is “not satisfied at all with one’s life”, second bar “not much satisfied”, third bar “quite satisfied” and, fourth bar “very satisfied”
Recent interest in the relation of perceived wellbeing and income
• Wealthier people are, on average, happier than poor ones (Easterlin, 1974; Oswald, 1997; Diener et al, 2003).
• Easterlin Paradox: Wealthier countries are found to be happier than poor ones but happiness seems to rise with income up to a point, but not beyond it.
• However, Deaton (2007) using the 2006 Gallup Poll shows that across countries average happiness is strongly related to per capita national income.
• This would rule out the existence of a critical level of per capita income above which income has no further effect on happiness.

Life satisfaction, GDP per capita and age
Note: Deaton (2007).
Not just income: the role of insecurity
• Deprivation tends to reduce happiness, but very poor people can be happier than other groups.
• The wellbeing of those who escaped poverty is often undermined by insecurity associated to the risk of falling back to poverty. – For these individuals, reported well-being is often
lower than that of the poor (Graham and Pettinato, 2002).
• In particular, the issue we want to study is how insecurity at different levels affects perceived well-being.
• We focus on three measures of insecurity: nutritional, personal, and income insecurity.

Strategy• We want to know which type of insecurity (nutritional,
personal, and income) plays a greater role. A few caveats:– Interconnections between measures of insecurity
(likely to confound results) – Selection issues (job insecurity proxies are defined
only for those who work). • We first study the relationship between perceived
well-being and each of the types of insecurity in isolation, and then study of the relative importance of different types of insecurity in an unified framework.
• Secondly, we analyze if migration (or having a migrant relative or friend to rely on) is related to wellbeing and if attenuates (or amplify) the relationship between insecurities and wellbeing.

Outline
1. The four dimensions of “Quality of Life”
2. Livability and migrations
3. Satisfaction with life, vulnerabilities and migration
4. Econometric results
5. Conclusions

Nutritional insecurity • Have there been times in the past twelve months
when you did not have enough money to buy food that you or your family needed? (NI money, not enough money)
• Have there been times in the past 12 months when you or your family have gone hungry? (NI hungry, gone hungry)
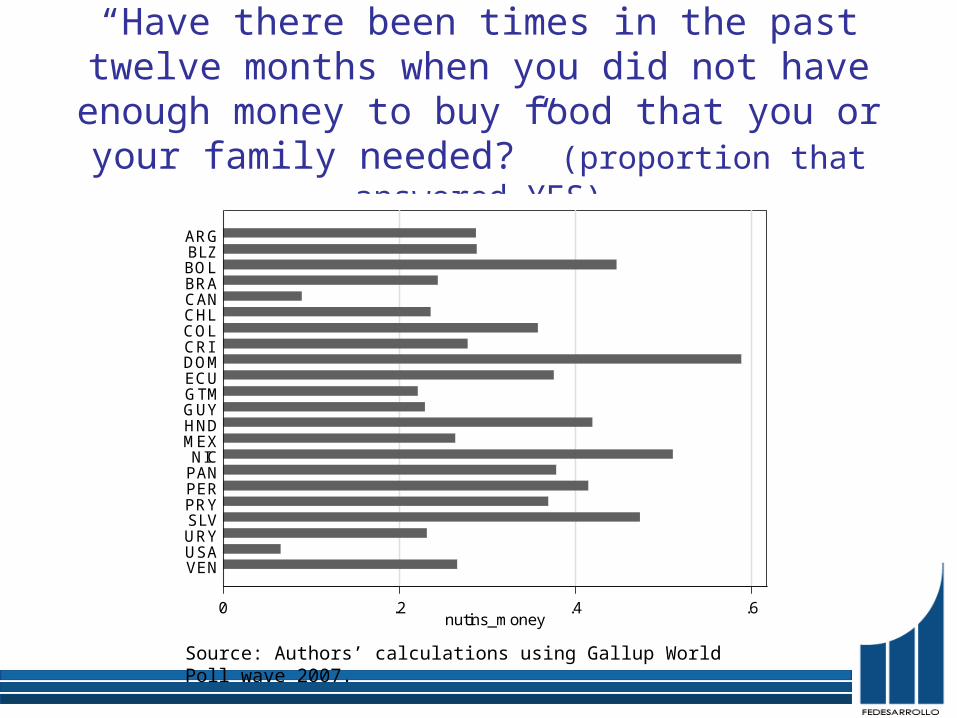
“Have there been times in the past twelve months when you did not have enough money to buy food that you or your family needed?”
(proportion that answered YES)
0 .2 .4 .6nutins_money
VENUSAURYSLVPRYPERPANNIC
MEXHNDGUYGTMECUDOM
CRICOLCHLCANBRABOLBLZ
ARG
Source: Authors’ calculations using Gallup World Poll wave 2007.

“Have there been times in the past 12 months when you or your family have gone
hungry?” (proportion that answered YES)
0 .1 .2 .3 .4nutins_hungry
VENUSAURYSLVPRYPERPANNIC
MEXHNDGUYGTMECUDOM
CRICOLCHLCANBRABOLBLZ
ARG
Source: Authors’ calculations using Gallup World Poll wave 2007.

Nutritional insecurity by income quintiles
0.2
.4.6
1 2 3 4 5
Note: For each income quintile first bar is “nutins money”, second=”nutins hungry”.Source: Authors’ calculations using Gallup World Poll wave 2007.

Income (job) insecurity• Do you think you could lose your job in the next six
months? (job_insec)• How worried you are of losing your job or staying
unemployed in the next 12 months? “Not worried”, “Just a bit worried”, “Worried”, “Very worried” (Latinobarómetro)
• Do you think the labour regulation protects workers in this country? “Not protected at all”, “just a bit protected”, “Quite protected”, “Very protected” (Latinobarómetro)
• From 1 to 10 where 1 is “completely secure” “ and 10 is “no job security at all” how much job security do you feel you have currently? … you had 5 years ago? (Latinobarómetro)

“Do you think you could loose your job in the next six months?” (proportion that
answered YES)
0 .1 .2 .3job_insec
VENUSAURYSLVPRYPERPANNIC
MEXHNDGUYGTMECUDOM
CRICOLCHLCANBRABOLBLZ
ARG
Source: Authors’ calculations using Gallup World Poll wave 2007.

Income/job insecurity by income quintiles
0
.05
.1.1
5.2
.25
1 2 3 4 5
Source: Authors’ calculations using Gallup World Poll wave 2007.

Personal insecurity• Do you feel safe walking alone at night in the city
or area where you live? (safe walking)• Have you had money or property stolen from you
or another household member within the past 12 months? (stolen)
• Have you been assaulted or mugged within the past 12 months? (mugged)
• Are there gangs in the area where you live? (2007) (gangs)
• Are there illicit drug trafficking or drug sales in the area where you live? (2007) (drug)

“Do you feel safe walking alone at night in the city or area where you live?” (proportion that
answered YES)
0 .2 .4 .6 .8safe_walking
VENUSAURYSLVPRYPERPANNIC
MEXHNDGUYGTMECUDOM
CRICOLCHLCANBRABOLBLZ
ARG
Source: Authors’ calculations using Gallup World Poll wave 2007.
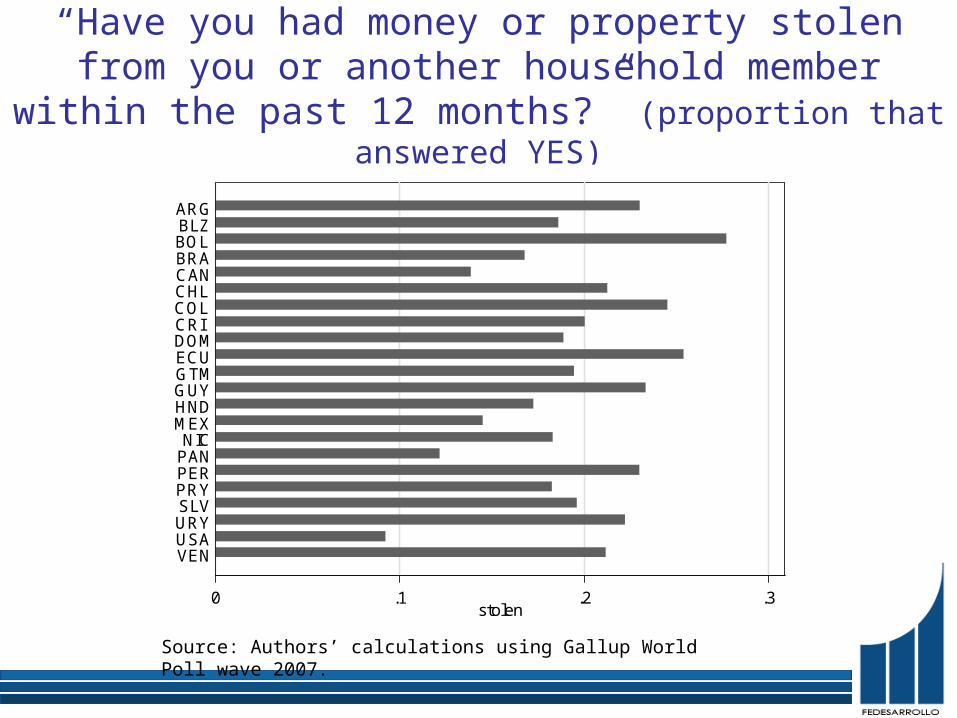
“Have you had money or property stolen from you or another household member within the past 12 months?” (proportion that answered YES)
0 .1 .2 .3stolen
VENUSAURYSLVPRYPERPANNIC
MEXHNDGUYGTMECUDOM
CRICOLCHLCANBRABOLBLZ
ARG
Source: Authors’ calculations using Gallup World Poll wave 2007.

“Have you been assaulted or mugged within the past 12 months?” (proportion that
answered YES)
0 .05 .1 .15 .2mugged
VENUSAURYSLVPRYPERPANNIC
MEXHNDGUYGTMECUDOM
CRICOLCHLCANBRABOLBLZ
ARG
Source: Authors’ calculations using Gallup World Poll wave 2007.

“Are there gangs in the area where you live?” (proportion that
answered YES)
0 .2 .4 .6gangs
VENUSAURYSLVPRYPERPANNIC
MEXHNDGUYGTMECUDOM
CRICOLCHLCANBRABOLBLZ
ARG
Source: Authors’ calculations using Gallup World Poll wave 2007.

“Are there illicit drug trafficking or drug sales in the area where you live?”
(proportion that answered YES)
0 .2 .4 .6 .8drug
VENUSAURYSLVPRYPERPANNIC
MEXHNDGUYGTMECUDOM
CRICOLCHLCANBRABOLBLZ
ARG
Source: Authors’ calculations using Gallup World Poll wave 2007.

Victimization indicators by income quintiles
0.1
.2.3
.4.5
1 2 3 4 5Income quintiles
Note: For each income quintile first bar is “safe walking”, second=”stolen”, third=”mugged”, 4=”gangs”, 5=”drug”. Source: Authors’ calculations using Gallup World Poll wave 2007.

Incidence of different types of insecurities in Latin America
0
.1.2
.3.4
.5
NI money NI hungry safe walking stolen mugged gangs drug job_insec
Source: Authors’ calculations using Gallup World Poll 2007 wave.

Migration related questions• Have any members of your household, aged 15 to
60, gone to live in a foreign country permanently or temporarily in the past five years? – Two variables: family abroad 1 (yes, still there),
family abroad 2 (yes, still there and yes, has returned)
• Do you have relatives or friends who are living in another country whom you can count on to help you when you need them, or not? (help from abroad)
• Is the city or area where you live a good place or not for immigrants from other countries?
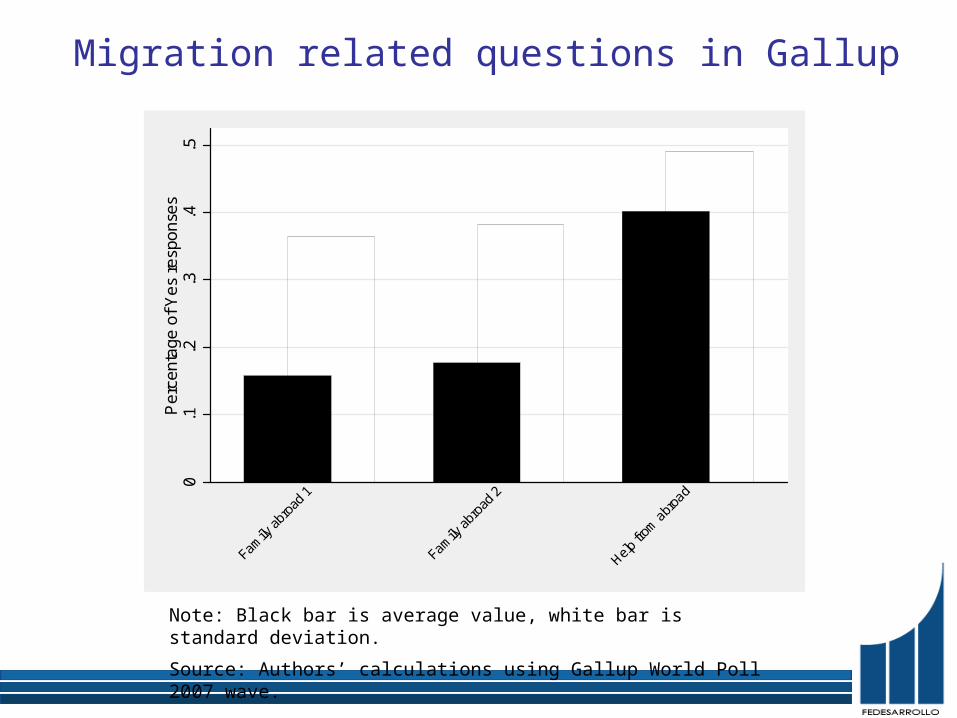
Migration related questions in Gallup
Note: Black bar is average value, white bar is standard deviation.Source: Authors’ calculations using Gallup World Poll 2007 wave.
0.1
.2.3
.4.5
Per
cent
age
of Y
es re
spon
ses
Family
abro
ad 1
Family
abroa
d 2
Help fro
m abroa
d

“Have any members of your household, aged 15 to 60, gone to live in a foreign country permanently or
temporarily in the past five years?” (proportion that answered YES, still there)
Source: Authors’ calculations using Gallup World Poll 2007 wave.
0 .1 .2 .3 .4family_abroad1
URYSLVPRYPERPANNIC
MEXHNDGUYGTMECUDOMCRICOLCHLBRABOLBLZ
ARG

“Have any members of your household, aged 15 to 60, gone to live in a foreign country permanently or
temporarily in the past five years?” (proportion that answered YES, still there and returned)
Source: Authors’ calculations using Gallup World Poll 2007 wave.
0 .1 .2 .3 .4 .5family_abroad2
URYSLVPRYPERPANNIC
MEXHNDGUYGTMECUDOMCRICOLCHLBRABOLBLZ
ARG

“Do you have relatives or friends who are living in another country whom you can count on to help you
when you need them, or not” (proportion that answered YES)
0 .2 .4 .6 .8help_abroad
URYSLVPRYPERPANNIC
MEXHNDGUYGTMECUDOMCRICOLCHLBRABOLBLZ
ARG
Source: Authors’ calculations using Gallup World Poll 2007 wave.
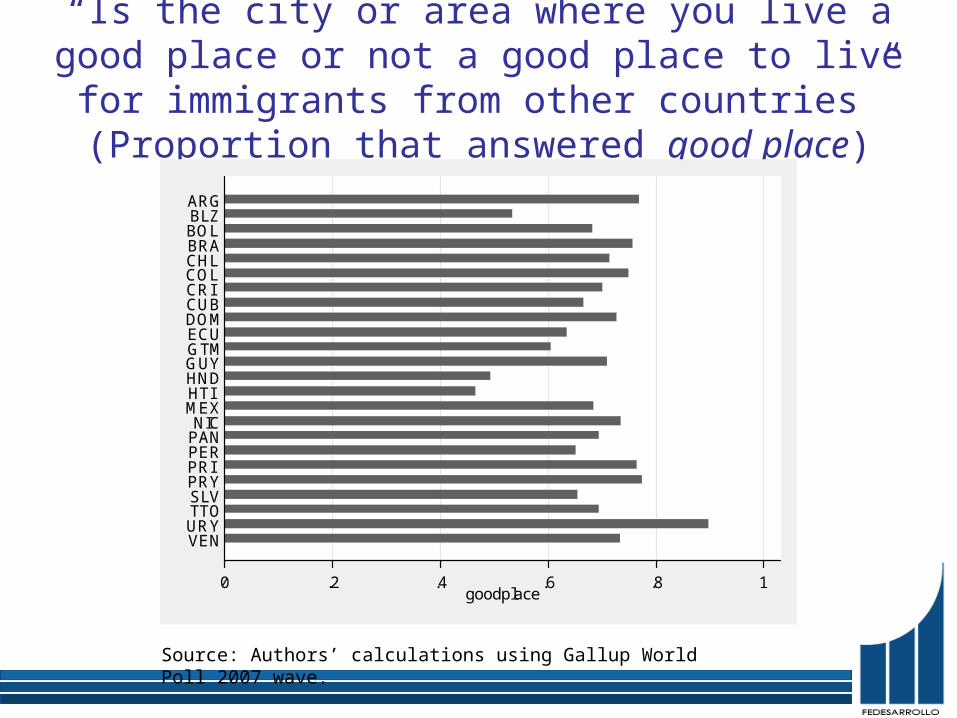
“Is the city or area where you live a good place or not a good place to live for immigrants from
other countries” (Proportion that answered good place)
0 .2 .4 .6 .8 1goodplace
VENURYTTOSLVPRYPRI
PERPANNIC
MEXHTI
HNDGUYGTMECUDOMCUBCRICOLCHLBRABOLBLZ
ARG
Source: Authors’ calculations using Gallup World Poll 2007 wave.

Migration related questions by income quintile
0.2
.4.6
.8
1 2 3 4 5
Source: Authors’ calculations using Gallup World Poll wave 2007; Notes: first bar is “family abroad1”, second bar “family abroad2”, third bar “help from abroad”, fourth bar “good place for immigrants”.

Types of insecurities according to “help from abroad” question - Gallup
0.1
.2.3
.4.5
does not have family/friends abroad you can count on has family/friends abroad you can count on
Source: Authors’ calculations using Gallup World Poll wave 2007; Notes: first bar is Nutritional insecurity “not enough money”; second bar job insecurity, third bar “have you been mugged?” fourth “are there gangs in the area where you live”.

Job insecurity and “Did you and your family seriously considered that you all could live abroad?” -
Latinobarómetro
0.2
.4.6
Pro
porti
on o
f res
pond
ents
Did not consider to move abroad Considered to move abroad
Source: Authors’ calculations using Latinobarometro waves 2002, 2003 and 2004: ; Notes: first bar is “not worried at all of losing one’s job”, second bar “just a bit worried”, third bar “Worried” and, fourth bar “very worried”.

Outline
1. The four dimensions of “Quality of Life”
2. Livability and migrations
3. Satisfaction with life, vulnerabilities and migration
4. Gallup World Poll and Latinobarómetro
5. Econometric results
6. Conclusions

Life satisfaction decreases with nutritional insecurity…
AUT
SGP
IRL
FINNOR
KWT
CHE
ARE
CANBEL
CYP
NLD
DEU
SWE
JPN
AUS
SVN
GBR
HKG
DNK
NPL
SVK
HRV
PRT
THA
ESPNZL
ITAFRA
BIH
DZALTU
SAUISR
LAO
LBN
LVAMKDSRB
IRN
USA
CZEJOR
HUN
BRA
ESTMNE
BLR
KOR
ALB
ARG
BGD
KAZ
URY
CRI
SEN
TTO
ETH
GTMCHL
PRI
RUS
VNM
IDN
POL
PAN
UKR
YEM
MDA
COL
LKA
PAK
MMR
BGR
BWA
IND
GRC
MEX
CHN
ECUAZEMAR
UZBMRT
PRYKGZ
SLV
BOL
VEN
HND
GHA
ZAF
ARM
TURTJK
DOMROMPER
BFAGEO
NIC
TZA
BDI
ZMB
SLE
MDG
NGAPHL
MLIRWA
UGA
TGO
MOZ
HTI
AGO
CMR
BENKHM
KENZWE
TCD
NERMWI
34
56
78
Life
Sat
isfa
ctio
n
0 .2 .4 .6 .8Nutritional Insecurity
Curve is a LOWESS smoother; bandwidth=0.6
Source: Authors’ calculations using Gallup World Poll wave 2006.

…and with victimization…
JPN
MMRHKG
SGP
AZEALB
CYP
IND
IDN
CAN
SVK
TJK
FIN
KOR
KGZ
NZL
LTU
UZB
BLR
MDG
ITA
SVNTHA
LKAARM
JOR
ARE
LVA
DNK
CHE
NPL
GEO
NOR
USA
JAM
KAZ
PAK
KHM
SWE
DEUPRI
AUT
KOS
IRL
TWN
ISR
ROM
BGR
BGD
UKRLAORUS
NLD
SAU
TZA
EST
YEM
BEL
MLI
MNECUB
NER
GRC
BFA
FRA
HUN
ESP
PAN
MKD
BIHMRT
GBR
TUR
ZWE
SENMAR
AUS
LBN
MYS
POL
VNMMDA
PALPHL
ZAFZMB
NICPRY
HRV
AFG
TGO
URYCHL
CZE
CRI
GHA
BEN
PRT
TTO
ARGKWT
DOM
UGA
RWA
BOL
COL
SRBPER
SLV
CMR
DZA
BWA
KEN
GTM
BRAMEX
ETH
NGA
ECU
HND
MWI
TCD
IRN
VEN
MOZ
AGO
SLEHTI
BDI
34
56
78
Life
Sat
isfa
ctio
n
0 .1 .2 .3 .4Assaulted or Mugged
bandwidth = .8
Source: Authors’ calculations using Gallup World Poll wave 2006.

But increases if person has a relative or friend abroad he can
count on
BRA
CHL
ARG
URY
PER
PAN
CRI
GTMCOL
MEX
ECU
SLV
DOMNIC
HNDPRYBOL
BLZ
GUY
55.
56
6.5
77.
5Li
fe s
atis
fact
ion
0 .1 .2 .3 .4bandwidth = .8
Lowess smoother
Source: Authors’ calculations using Gallup World Poll wave 2007.

Analytical framework
• where i means country averages or individuals• t refers to wave 2006, 2007• Y = measures of perceptions of well-being• INS = various measures of insecurity (nutritional, job,
personal) • M = migration related variables (relative abroad, can count on
help from abroad and considers city a good place for immigrants)
• EXP = alternative (to nutritional insecurity) explanatory variables
• X = control variables• e = error term

Some methodological issues• Categorical variables (such as the ladder question): neglects
cardinal information of the question. A “7”, could be either a 6.8 or a 7.2.
• COLS and POLS procedure: cardinalizes original satisfaction variable, POLS is used for non-numeric categories (both based on Van Praag and Ferrer-i-Carbonell, 2008). – Main results hold
• An additional (and more critical) issue: self-reported satisfaction might be affected by unobserved individual personality traits (optimism and pessimism, mood on the day of the interview, among others), biasing the results.
• Routine to capture individual traits (also based on Van Praag and Ferrer-i-Carbonell, 2008).– Regress several satisfaction related questions on same set
of covariates, use principal components method to obtain common factor of residuals (that should include this unobservable traits), and use it as a control.

Life satisfaction (ladder question) and types of insecurities - Gallup, individual data, 2007
Notes: Standard errors clustered at country level; Country and time fixed effects are included; Controls included: income Gallup brackets; income country: countries grouped in 6 categories (high_income_OECD; high_income_nonOECD; low_income; lower_middle_income; upper_middle_income); Age categories.
1 2 3 4 5 6OLS OLS COLS OLS OLS OLS
Nutritional insecurity -0.690*** -0.721*** -0.283*** -0.728*** -0.720*** -0.721***(0.113) (0.083) (0.045) (0.081) (0.082) (0.084)
Job insecurity -0.390*** -0.223** -0.159*** -0.186** -0.186** -0.190**(0.102) (0.091) (0.042) (0.087) (0.087) (0.084)
property stolen -0.001 -0.001 -0.002(0.062) (0.053) (0.026)
mugged 0.017 0.036 0.007(0.142) (0.108) (0.058)
presence of gangs 0.029 0.003 0.012(0.081) (0.043) (0.033)
presence of drug trafficking/sales -0.077 0.064 -0.032
(0.067) (0.051) (0.027)1 victimization issue -0.151**
(0.054)2 victimization events -0.012
(0.057)3 victimization events 0.075
(0.095)4 victimization events 0.152
(0.123)stolen and/or mugged 0.021
(0.061)gangs and/or drug trafficking -0.002
(0.048)Personality trait No Yes No Yes Yes Yes
Number of observations 3,855 3,254 3,855 3,859 3,850 3,737R2 0.222 0.605 0.223 0.610 0.609 0.607
note: .01 - ***; .05 - **; .1 - *;

Other dimensions of life satisfaction and types of insecurities – Gallup, individual
data, 20071 2 3 4 5 6
Nutritional insecurity -0.188*** -0.187*** -0.189*** -0.042** -0.043** -0.044**(0.016) (0.016) (0.018) (0.018) (0.018) (0.019)
Job insecurity -0.094*** -0.096*** -0.100*** -0.039** -0.042** -0.036**(0.025) (0.025) (0.025) (0.016) (0.017) (0.016)
1 victimization issues -0.007 -0.028(0.019) (0.021)
2 victimization events -0.015 -0.051***(0.017) (0.018)
3 victimization events -0.105*** -0.089***(0.027) (0.021)
4 victimization events -0.128*** -0.148***(0.043) (0.047)
stolen and/or mugged -0.072*** -0.057***(0.019) (0.017)
gangs and/or drug trafficking -0.032** -0.055***(0.014) (0.012)
Number of observations 4,648 4,639 4,488 4,555 4,548 4,403R2 0.117 0.116 0.116 0.057 0.054 0.054
note: .01 - ***; .05 - **; .1 - *;
Satisfaction with standard of living
Probit
Satisfaction with freedom to choose life
Probit
Notes: Standard errors clustered at country level; Country and time fixed effects are included; Controls included: income Gallup brackets; income country: countries grouped in 6 categories (high_income_OECD; high_income_nonOECD; low_income; lower_middle_income; upper_middle_income); Age categories.

Life satisfaction (ladder question) and migration – Gallup, individual data
1 2 3 4 5 6OLS OLS OLS OLS OLS OLS
Family abroad 1 0.108** 0.061(0.053) (0.046)
Family abroad 2 0.082* 0.052(0.048) (0.047)
Help from abroad 0.240*** 0.128***(0.052) (0.045)
Personality trait factor 1.007*** 1.007*** 1.005***(0.013) (0.013) (0.013)
Availability of social networks 0.630*** 0.631*** 0.727*** 0.727*** 0.595*** 0.706***(0.071) (0.071) (0.059) (0.059) (0.070) (0.059)
Status of unemployment 0.114** 0.114** 0.056 0.056 0.111** 0.053(0.049) (0.049) (0.044) (0.044) (0.049) (0.044)
Presence of health problems -0.260*** -0.260*** -0.211*** -0.211*** -0.258*** -0.212***(0.081) (0.081) (0.048) (0.048) (0.082) (0.048)
Think religion is important 0.250*** 0.251*** 0.247*** 0.247*** 0.244*** 0.239***(0.071) (0.071) (0.061) (0.061) (0.071) (0.061)
Being married -0.067 -0.067 -0.050 -0.051 -0.062 -0.050(0.052) (0.052) (0.041) (0.041) (0.052) (0.042)
Being widow 0.113 0.114 0.140** 0.140** 0.118 0.145**(0.101) (0.101) (0.067) (0.067) (0.103) (0.068)
Experienced depression -0.666*** -0.666*** -0.654*** -0.655*** -0.654*** -0.645***(0.075) (0.075) (0.064) (0.064) (0.074) (0.062)
Number of observations 11,773 11,773 9,500 9,500 11,779 9,508R2 0.198 0.198 0.599 0.598 0.198 0.598
note: .01 - ***; .05 - **; .1 - *;
Notes: Standard errors clustered at country level; Country and time fixed effects are included; Controls included: income Gallup brackets; income country: countries grouped in 6 categories (high_income_OECD; high_income_nonOECD; low_income; lower_middle_income; upper_middle_income); Age categories.

Satisfaction with living standards(1 if satisfied) and migration – Gallup, individual
data
Notes: Standard errors clustered at country level; Country and time fixed effects are included; Controls included: income Gallup brackets; income country: countries grouped in 6 categories (high_income_OECD; high_income_nonOECD; low_income; lower_middle_income; upper_middle_income); Age categories.
1 2 5Probit Probit Probit
Family abroad 1 0.020(0.015)
Family abroad 2 0.011(0.014)
Help from abroad 0.033***(0.012)
Availability of social networks 0.147*** 0.147*** 0.142***(0.019) (0.019) (0.019)
Status of unemployment 0.022** 0.022** 0.021**(0.009) (0.009) (0.009)
Presence of health problems -0.068*** -0.067*** -0.068***(0.015) (0.015) (0.015)
Think religion is important 0.061*** 0.061*** 0.062***(0.015) (0.015) (0.015)
Being married 0.027** 0.027** 0.027**(0.012) (0.012) (0.012)
Being widow 0.039 0.039 0.038(0.026) (0.026) (0.026)
Experienced depression -0.165*** -0.165*** -0.164***(0.017) (0.017) (0.017)
Number of observations 11,861 11,861 11,866R2 0.087 0.086 0.087
note: .01 - ***; .05 - **; .1 - *;

Satisfaction with freedom to choose(1 if satisfied) and migration – Gallup, individual
data
Notes: Standard errors clustered at country level; Country and time fixed effects are included; Controls included: income Gallup brackets; income country: countries grouped in 6 categories (high_income_OECD; high_income_nonOECD; low_income; lower_middle_income; upper_middle_income); Age categories.
1 2 5Probit Probit Probit
Family abroad 1 -0.003(0.010)
Family abroad 2 -0.003(0.008)
Help from abroad 0.016(0.010)
Availability of social networks 0.075*** 0.075*** 0.071***(0.015) (0.015) (0.014)
Status of unemployment 0.006 0.006 0.007(0.008) (0.008) (0.008)
Presence of health problems -0.024*** -0.024*** -0.024***(0.007) (0.007) (0.007)
Think religion is important 0.057*** 0.057*** 0.058***(0.016) (0.016) (0.016)
Being married 0.020* 0.020* 0.021*(0.011) (0.011) (0.011)
Being widow 0.024 0.024 0.021(0.016) (0.016) (0.015)
Experienced depression -0.055*** -0.055*** -0.054***(0.016) (0.016) (0.015)
Number of observations 11,569 11,569 11,573R2 0.045 0.045 0.045
note: .01 - ***; .05 - **; .1 - *;

Life satisfaction (ladder question), migration and types of insecurities – Gallup, individual data
1 2 3 4 5 6OLS OLS OLS OLS OLS OLS
Family abroad 1 0.054 0.081(0.110) (0.083)
Family abroad 2 0.034 0.086(0.091) (0.074)
Help from abroad 0.212*** 0.123***(0.073) (0.039)
Personality trait factor 0.992*** 0.992*** 0.988***(0.018) (0.018) (0.018)
Nutritional insecurity -0.638*** -0.638*** -0.694*** -0.694*** -0.626*** -0.683***(0.099) (0.099) (0.080) (0.080) (0.099) (0.080)
Job Insecurity -0.366*** -0.366*** -0.157* -0.156* -0.354*** -0.150*(0.094) (0.093) (0.084) (0.084) (0.090) (0.081)
1 victimization issue -0.047 -0.048 -0.140*** -0.141*** -0.047 -0.135***(0.093) (0.093) (0.052) (0.053) (0.092) (0.051)
2 victimization events 0.008 0.008 -0.001 -0.002 0.000 -0.004(0.088) (0.088) (0.060) (0.060) (0.087) (0.059)
3 victimization events 0.048 0.049 0.103 0.101 0.018 0.089(0.104) (0.105) (0.091) (0.092) (0.110) (0.095)
4 victimization events -0.065 -0.065 0.164 0.163 -0.052 0.182(0.168) (0.168) (0.115) (0.116) (0.169) (0.124)
Number of observations 4,560 4,560 3,843 3,843 4,559 3,842R2 0.230 0.230 0.621 0.621 0.231 0.620
note: .01 - ***; .05 - **; .1 - *;
Notes: Standard errors clustered at country level; Country and time fixed effects are included; Controls included: income Gallup brackets; income country: countries grouped in 6 categories (high_income_OECD; high_income_nonOECD; low_income; lower_middle_income; upper_middle_income); Age categories.
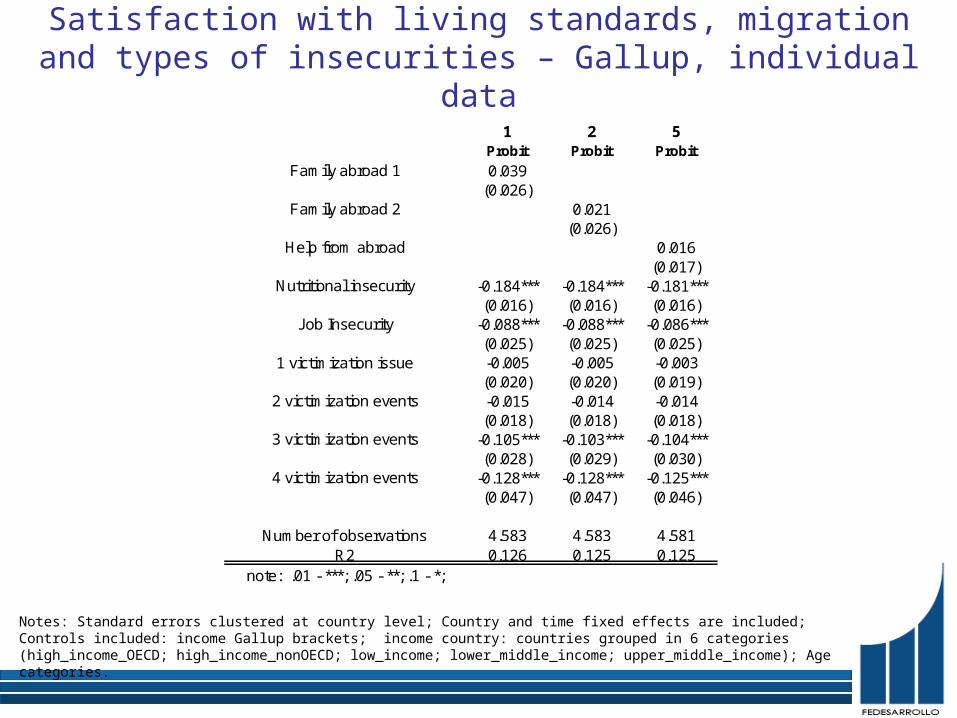
Satisfaction with living standards, migration and types of insecurities – Gallup, individual data
Notes: Standard errors clustered at country level; Country and time fixed effects are included; Controls included: income Gallup brackets; income country: countries grouped in 6 categories (high_income_OECD; high_income_nonOECD; low_income; lower_middle_income; upper_middle_income); Age categories.
1 2 5Probit Probit Probit
Family abroad 1 0.039(0.026)
Family abroad 2 0.021(0.026)
Help from abroad 0.016(0.017)
Nutritional insecurity -0.184*** -0.184*** -0.181***(0.016) (0.016) (0.016)
Job Insecurity -0.088*** -0.088*** -0.086***(0.025) (0.025) (0.025)
1 victimization issue -0.005 -0.005 -0.003(0.020) (0.020) (0.019)
2 victimization events -0.015 -0.014 -0.014(0.018) (0.018) (0.018)
3 victimization events -0.105*** -0.103*** -0.104***(0.028) (0.029) (0.030)
4 victimization events -0.128*** -0.128*** -0.125***(0.047) (0.047) (0.046)
Number of observations 4,583 4,583 4,581R2 0.126 0.125 0.125
note: .01 - ***; .05 - **; .1 - *;

Life satisfaction (ladder question), migration and types of insecurities – Gallup, individual data
1 2 3 4 5 6OLS OLS OLS OLS OLS OLS
Nutritional insecurity -0.616*** -0.577*** -0.645*** -0.634*** -0.606*** -0.702***(0.099) (0.098) (0.072) (0.071) (0.089) (0.065)
X Family abroad 1 -0.093 -0.250(0.180) (0.160)
X Family abroad 2 -0.294 -0.282*(0.194) (0.154)
X Help from abroad -0.034 0.070(0.151) (0.131)
Job insecurity -0.411*** -0.420*** -0.207** -0.217** -0.327*** -0.166**(0.084) (0.086) (0.088) (0.088) (0.090) (0.081)
X Family abroad 1 0.294 0.332* -0.218** -0.218**(0.308) (0.176) (0.105) (0.105)
X Family abroad 2 0.319 0.357**(0.294) (0.166)
X Help from abroad -0.070 0.047(0.173) (0.094)
Personal insecurity -0.040 -0.050 0.061 0.063 0.028 0.060(0.077) (0.070) (0.070) (0.067) (0.085) (0.081)
X Family abroad 1 0.031 -0.155(0.144) (0.145)
X Family abroad 2 0.083 -0.149(0.131) (0.126)
X Help from abroad -0.167 -0.069(0.116) (0.106)
Family abroad 1 0.020 0.144(0.158) (0.104)
Family abroad 2 0.048 0.155*(0.146) (0.093)
Help from abroad 0.281** 0.114(0.116) (0.076)
Personality trait factor 0.991*** 0.991*** 0.986***(0.019) (0.019) (0.018)
Number of observations 4,551 4,551 3,834 3,834 4,550 3,833R2 0.230 0.231 0.620 0.621 0.231 0.619
note: .01 - ***; .05 - **; .1 - *;
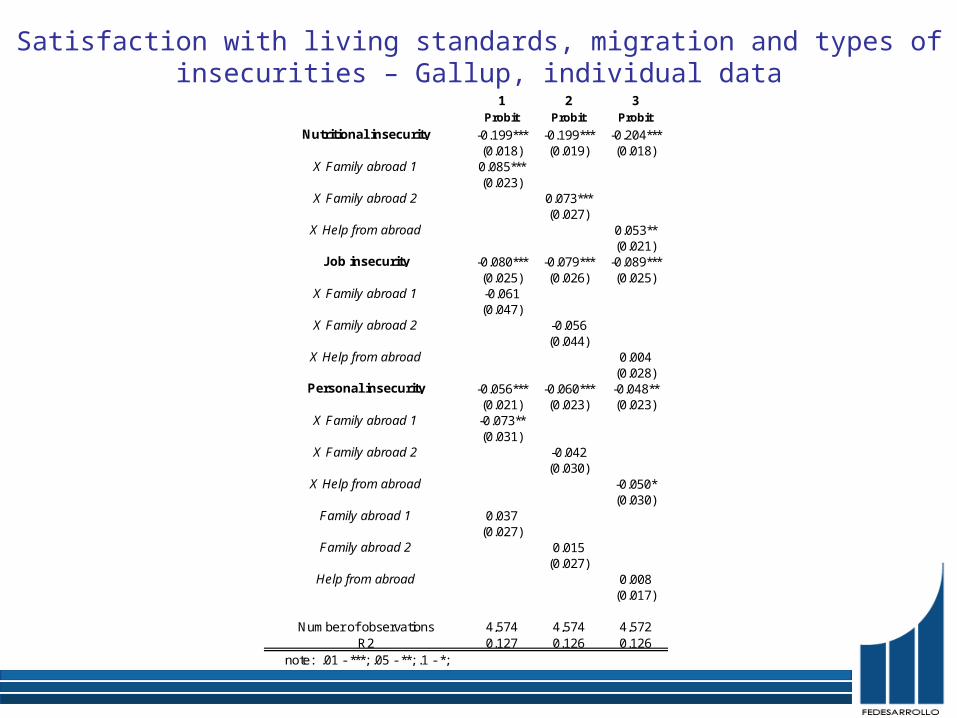
Satisfaction with living standards, migration and types of insecurities – Gallup, individual data
1 2 3Probit Probit Probit
Nutritional insecurity -0.199*** -0.199*** -0.204***(0.018) (0.019) (0.018)
X Family abroad 1 0.085***(0.023)
X Family abroad 2 0.073***(0.027)
X Help from abroad 0.053**(0.021)
Job insecurity -0.080*** -0.079*** -0.089***(0.025) (0.026) (0.025)
X Family abroad 1 -0.061(0.047)
X Family abroad 2 -0.056(0.044)
X Help from abroad 0.004(0.028)
Personal insecurity -0.056*** -0.060*** -0.048**(0.021) (0.023) (0.023)
X Family abroad 1 -0.073**(0.031)
X Family abroad 2 -0.042(0.030)
X Help from abroad -0.050*(0.030)
Family abroad 1 0.037(0.027)
Family abroad 2 0.015(0.027)
Help from abroad 0.008(0.017)
Number of observations 4,574 4,574 4,572R2 0.127 0.126 0.126
note: .01 - ***; .05 - **; .1 - *;
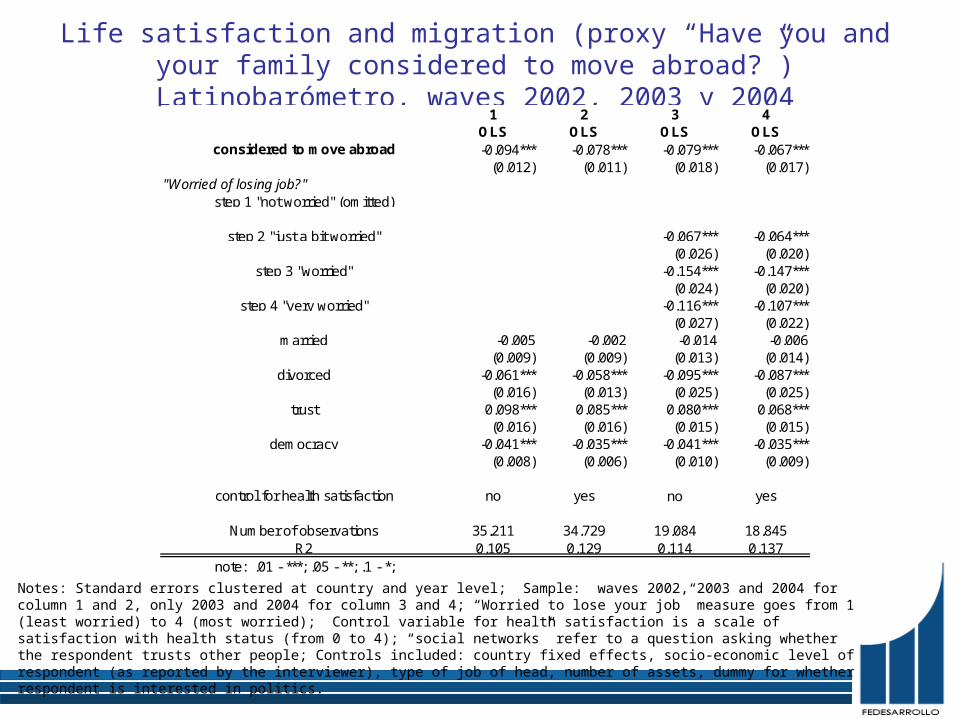
Life satisfaction and migration (proxy “Have you and your family considered to move abroad?”) Latinobarómetro, waves 2002, 2003
y 2004
Notes: Standard errors clustered at country and year level; Sample: waves 2002, 2003 and 2004 for column 1 and 2, only 2003 and 2004 for column 3 and 4; “Worried to lose your job” measure goes from 1 (least worried) to 4 (most worried); Control variable for health satisfaction is a scale of satisfaction with health status (from 0 to 4); “social networks” refer to a question asking whether the respondent trusts other people; Controls included: country fixed effects, socio-economic level of respondent (as reported by the interviewer), type of job of head, number of assets, dummy for whether respondent is interested in politics.
1 2 3 4OLS OLS OLS OLS
considered to move abroad -0.094*** -0.078*** -0.079*** -0.067***(0.012) (0.011) (0.018) (0.017)
"Worried of losing job?"step 1 "not worried" (omitted)
step 2 "just a bit worried" -0.067*** -0.064***(0.026) (0.020)
step 3 "worried" -0.154*** -0.147***(0.024) (0.020)
step 4 "very worried" -0.116*** -0.107***(0.027) (0.022)
married -0.005 -0.002 -0.014 -0.006(0.009) (0.009) (0.013) (0.014)
divorced -0.061*** -0.058*** -0.095*** -0.087***(0.016) (0.013) (0.025) (0.025)
trust 0.098*** 0.085*** 0.080*** 0.068***(0.016) (0.016) (0.015) (0.015)
democracy -0.041*** -0.035*** -0.041*** -0.035***(0.008) (0.006) (0.010) (0.009)
control for health satisfaction no yes no yes
Number of observations 35,211 34,729 19,084 18,845R2 0.105 0.129 0.114 0.137
note: .01 - ***; .05 - **; .1 - *;

Wellbeing and attitude towards immigrants– Gallup, individual data
1 2 3 4 5 6
All, 06 LAC, 06-07 All, 06 LAC, 06-07 All, 06 LAC, 06-07Country good place for immigrants 0.026 0.056* 0.058*** 0.051*** 0.101*** 0.068***
(0.019) (0.030) (0.008) (0.012) (0.009) (0.015)Personality trait factor 0.788*** 0.965***
(0.009) (0.017)Availability of social networks 0.555*** 0.695*** 0.173*** 0.144*** 0.059*** 0.058***
(0.026) (0.047) (0.009) (0.015) (0.008) (0.009)Status of unemployment 0.078*** 0.086** 0.009* 0.017*** 0.015** -0.003
(0.021) (0.036) (0.006) (0.006) (0.006) (0.007)Presence of health problems -0.273*** -0.265*** -0.050*** -0.060*** -0.023*** -0.035***
(0.016) (0.032) (0.008) (0.009) (0.008) (0.008)Think religion is important 0.095*** 0.184*** 0.066*** 0.061*** 0.038*** 0.052***
(0.021) (0.036) (0.008) (0.013) (0.009) (0.012)Being married 0.056*** 0.010 0.026*** 0.025*** 0.019*** 0.015*
(0.021) (0.028) (0.007) (0.009) (0.006) (0.008)Being widow -0.007 0.074 0.031** 0.057*** 0.020* 0.008
(0.030) (0.058) (0.014) (0.020) (0.011) (0.010)Experienced depression -0.512*** -0.595*** -0.150*** -0.161*** -0.081*** -0.049***
(0.028) (0.056) (0.010) (0.012) (0.010) (0.013)
Number of observations 47,250 17,680 57,171 21,934 55,569 22,070R2 0.667 0.568 0.176 0.088 0.134 0.066
note: .01 - ***; .05 - **; .1 - *;
Ladder Satisfaction with standard of living
Satisfaction with freedom to choose
Notes: Standard errors clustered at country level; Country and time fixed effects are included; Controls included: income Gallup brackets; income country: countries grouped in 6 categories (high_income_OECD; high_income_nonOECD; low_income; lower_middle_income; upper_middle_income); Age categories.

Outline
1. The four dimensions of “Quality of Life”
2. Livability and migrations
3. Satisfaction with life, vulnerabilities and migration
4. Econometric results
5. Conclusions

Conclusions• Nutritional, income (job) and personal insecurity
negatively affect life satisfaction. • Households with migration experience seem to have
greater life satisfaction.• This result is robust to taking into account several
potentially important determinants of life satisfaction (income measures, health status, unemployment and availability of social networks).
• Evidence suggests that the nutritional insecurity is the component that plays the biggest role. The effect of job insecurity is still significant but smaller in magnitude.

Conclusions• Migration related questions do not seem to have any
relationship with individuals’ perception on their freedom to choose.
• Results hold, even when the different types of insecurities are included in the analysis.
• Finally, migration offsets nutritional insecurity, but amplifies job insecurity.