Embed Size (px)
Citation preview

MID-YEAR BUDGET AND PERFORMANCE ASSESSMENT
J a n u a r y 2 0 1 3

REPORT SUBMITTED TO –
THE MAYORAL COMMITTEE ON 23 JANUARY 2013 THE COUNCIL ON 31 JANUARY 2013

TABLE OF CONTENTS
PART 1: IN-YEAR REPORT 1 Executive Mayor's report 1
1.1 Implementation of the Municipality's budget in accordance with the service delivery and budget implementation plan 1 1.2 Any financial problems or risks facing the Municipality 2 1.3 Annual Report and Audit Report 2 1.4 National and Provincial adjustments budgets 6 1.5 Necessity of an adjustments budget for the Municipality 6 1.6 Non-financial performance 6
2 Resolutions 7 2.1 Monthly budget statement and any supporting documents 7 2.2 Quarterly report on the implementation of the budget and the financial affairs for the municipality 7 2.3 Mid-year budget and performance assessment 8
3 Executive summary 8 3.1 Introduction 8 3.2 Consolidated performance 9
4 In-year budget statement tables 9 4.1 Table C1 s71 Monthly Budget Statement Summary 10 4.2 Table C2Monthly Budget Statement - Financial Performance (standard classification) 12 4.3 Table C3 Monthly Budget Statement - Financial Performance (revenue and expenditure by municipal vote) 14 4.4 Table C4 Monthly Budget Statement - Financial Performance (revenue and expenditure) 15 4.5 Table C5 Monthly Budget Statement - Capital Expenditure (municipal vote, standard classification and funding) 18 4.6 Table C6 Monthly Budget Statement - Financial Position 21 4.7 Table C7 Monthly Budget Statement - Cash Flow 23
PART 2: SUPPORTING DOCUMENTATION 1 Debtors' Analysis (Supporting Table SC3) 25 2 Creditors' Analysis (Supporting Table SC4) 26 3 Investment portfolio analysis (Supporting Table SC5) 27 4 Allocation and grant receipts and expenditure (Supporting Tables SC6 and SC7) 28 5 Councillor allowances and employee benefits (Supporting Table SC8) 31 6 Material variances to the service delivery and budget implementation plan 32 7 Capital programme performance 32 8 Capital budget expenditure (Supporting Tables SC12 and SC13) 64 9 Non-financial performance 71
QUALITY CERTIFICATION


Mid-year budget and performance assessment i.r.o. the first half of the 2012/13 financial year 1
PART 1: IN-YEAR REPORT
1 EXECUTIVE MAYOR'S REPORT
1.1 Implementation of the Municipality's budget in accordance with the service delivery and budget implementation plan
There are 87 projects on the capital budget for 2012/2013 with a total budget of R88 million. This includes multi-year projects. By end of December 2012 R38 million (44%) of the R88 million was spent. The breakdown per department is as follows:
Department Nr of projects Budget 2012/13 Exp to date - Dec 2012 % spent - Dec 2012
Civil Engineering 44 R66 596 546 R29 899 802 44.9%
Electrical Engineering 25 R17 895 000 R8 081 795 45.2%
Development Services 5 R2 173 040 R97 648 4.5%
Protection Services 7 R1 058 000 R474 713 44.9%
Financial Services 2 R175 980 R123 347 70.1%
Corporate Services 2 R153 240 R60 354 39.4%
Office of the Municipal Manager 2 R31 097 R20 779 66.8%
Of the total operating budget of R439 million for 2012/2013 R202 million (46%) was spent by December 2012. The breakdown per department is as follows:
Department Budget 2012/13 Exp to date - Dec 2012 % spent - Dec 2012
Civil Engineering R182 465 429 R84 766 069 46%
Electrical Engineering R154 260 725 R72 271 931 47%
Development Services R12 261 414 R5 552 988 45%
Protection Services R25 484 974 R11 876 884 47%
Financial Services R34 240 688 R13 469 139 39%
Corporate Services R16 981 356 R8 233 094 48%
Office of the Municipal Manager R3 758 176 R1 649 471 44%
No significant problems are experienced with implementing the service delivery and budget implementation plan.

2 Mid-year budget and performance assessment i.r.o. the first half of the 2012/13 financial year
The document included under Section 7 of Part 2 of this report reflects the following: (a) Projected expenditure per project per month (b) Actual expenditure per project per month (c) Notes where necessary regarding progress, problems, reasons and/or explanations
1.2 Any financial problems or risks facing the Municipality
The 2012-2017 Integrated Development Plan identified the following two major financial risks facing the Municipality and the root causes for each of the risks:
Risk Impact Likelihood Root causes If there is insufficient revenue to meet the demand for services
5/5 4/5 Non-core operational functions Incomplete / inaccurate revenue database Long term strategy not based on a realistic income potential External funding not investigated fully Tariffs that are not cost recoverable Surplus generated from electricity sales under serious threat
due to increase in cost causing reduced consumption and conversion to renewable energy
If services are expensive and unaffordable
4/5 3/5 Non-core operational functions High cost of maintaining and replacing services infrastructure No standard costing Tariffs that are not cost recoverable High increases in the cost of bulk increases (ESKOM, Water) Collective agreements regarding salaries Unfunded mandates
1.3 Annual Report and Audit Report
Status of implementation of Auditor-General recommendations:
Below is our assessment of the progress on commitments made by the accounting officer to address audit outcomes in the prior and current years relating to the AGSA key focus areas, as at 1 December 2012. The municipality is encouraged to strengthen its internal monitoring by assessing the fundamentals of internal controls on a frequent basis to ensure sustainable clean administration.

Mid-year budget and performance assessment i.r.o. the first half of the 2012/13 financial year 3
No Audit Outcomes Commitment made by Implementation Date Status LEADERSHIP 1 Business Continuity Plan
An IT business continuity plan and disaster recovery plan has been documented. However, it has not been included as part of business continuity plan or disaster recovery plan for the municipality or tested.
Accounting Officer All Directors
30 April 2013 The actions taken by Management are not yet complete as a disaster recovery team is yet to be established and the plans documented to be approved.
2 IT Governance Framework Some controls have been implemented to establish an IT Governance Framework. However, there was inadequate management of IT service performance. This was due to reliance being placed on informal processes which mitigated the risks of poor service delivery.
Director: Electrical Engineering Services Director: Financial Services Director: Corporate Services
31 January 2013 A formalised process is not in place. Standard operating procedures in this regard will be compiled and assigned. The responsibilities of the System Administrator for R-Data will be revised and assigned.
FINANCIAL AND PERFORMANCE MANAGEMENT 3 Record management
No liability in respect of the payment of thirteenth cheque/bonuses to personnel at year end was disclosed in the financial statements. This was due to management not properly reviewing the financial statements to ensure adherence to paragraph 52 of the Framework for the Preparation and Presentation of Financial Statements before submitting it for audit purposes.
Manager: Financial Statements and Control
Finalised The misstatement has been corrected. The relevant officials have now been instructed to inform the compiler of the financial statements immediately if any of the reports that have an influence on the financial statements are changed.
4 Regular, accurate and complete financial reports 4.1 The total for capital commitments approved and
contracted for, as disclosed in note 46 to the financial statements, was materially misstated by R11 243 497. The schedule submitted to populate the relevant amounts and information in the financial statements, was not properly reviewed and checked for the accuracy thereof by the Head: Budget office before submitting it to the Manager: Financial Statements and Control.
Manager: Financial Statements and Control
Finalised The corrections made by Management have been confirmed to be correct and were accepted by the Auditor-General.

4 Mid-year budget and performance assessment i.r.o. the first half of the 2012/13 financial year
No Audit Outcomes Commitment made by Implementation Date Status 4.2 The statutory staff leave liability comparative
amount, as disclosed in the financial statements, was understated by R514 973.66. This was due to the new formula adjustment in the relevant accounting system for leave pay accruals in the current year was not adequately evaluated by the Head of Payroll for possible comparative restatement impact thereof in the municipality’s financial records.
Manager: Financial Statements and Control
Finalised The corrections made by Management have been confirmed to be correct and were accepted by the Auditor-General.
4.3 Long term liabilities were overstated and short term liabilities understated by R2 279 822 respectively at year end in the financial statements. This occurred due to an oversight on the part of the preparer of the financial statements which resulted in the current portion of the long-term loans amount not being updated at year end.
Manager: Financial Statements and Control
Finalised The misstatement has been corrected. An attempt will be made to complete the Financial Statements earlier to allow sufficient time for the independent review thereof.
5 Compliance monitoring The municipality is in non-compliance with section 64(2)(h) of the MFMA (Act No 56 of 2003) as revenue received in respect traffic fines that is collected on behalf of the municipality by a collecting agent, has since March 2012, only been reconciled on a monthly basis instead of on a weekly basis. Prior to March 2012, revenue received in this regard was reconciled on a daily basis by the bank reconciliation clerk. However, the relief clerk (previous clerk took maternity leave) was not appropriately informed of the requirements due to a lack of standard operating procedures.
Manager: Financial Statements and Control Accountant: Expenditure
31 January 2013 The reconciliation is now performed on a daily basis. Standard operating procedures are being compiled and will be implemented to address this weakness.
6 IT systems 6.1 Security management
Weak password controls being enforced on Active Directory is attributed to the inadequacy in the design of the Information Security Policy due to management oversight.
Director: Electrical Engineering Services Manager: ITC
31 January 2013 The Information Security Policy will be updated accordingly and the minimum password age parameters set within the recommended value.

Mid-year budget and performance assessment i.r.o. the first half of the 2012/13 financial year 5
No Audit Outcomes Commitment made by Implementation Date Status 6.2 User access control
Inadequate user access management controls is attributed to IT management only formalising controls in the form of a user account management policy which was completed and approved in July 2012.
Director: Electrical Engineering Services Director: Financial Services Director: Corporate Services
31 January 2013 Unrestricted vendor access to the financial application, Promun will be investigated to ensure daily uninterrupted system operations as well as adequate mitigated controls are implemented to lower the risk for the municipality.
6.3 IT service continuity Inadequate IT service continuity controls are attributed by the fact that although daily backups were performed, no evidence of backup restorations was retained due to the responsibility not being assigned to anyone.
Director: Electrical Engineering Services
Finalised A schedule for the restoration of back-ups has been compiled. Restorations are now being performed and evidence thereof is kept for audit purpose.
7 Predetermined objectives 7.1 Certain planned performance measures /
indicators / targets were not well defined and/or clear. The planned targets should be clearly defined upfront to be able to accurately measure it at year end.
Accounting Officer All Directors Manager: Strategic Services
31 January 2013 The actual outcome will be indicated as not applicable for 2011/2012. A target will be set for 2012/2013 which will be determined according to the previous years’ actual jobs that have been created. All targets will be reviewed to ensure that it has been well defined.
7.2 Actual output of three indicators not accurately reported and measured. The relevant directors of the applicable departments did not properly review the actual outcomes of the targets that are being reported on and therefore there is a risk of targets not being accurately reported on.
Accounting Officer All Directors Manager: Strategic Services
31 January 2013 The actual outcomes of the three indicators have been corrected. Management will ensure that outcomes are measurable and evidence thereof linked to the PMS system. Directors will verify outcomes prior to allocating scores.

6 Mid-year budget and performance assessment i.r.o. the first half of the 2012/13 financial year
1.4 National and Provincial adjustments budgets
There were small adjustments to certain grants only which had no major impact on the Municipality’s budget. Any changes will be tabled with the Municipality’s adjustments budget on 31 January 2013.
1.5 Necessity of an adjustments budget for the Municipality
There have been a few important changes to the operating budget. These changes make up the bulk of the reason why the Municipality has moved from a deficit of -R25 526 520 to a deficit of -R13 414 961. Some of the major changes are as follows:
On the expenditure side:
Employee related costs increased by R2 489 465. The Municipality originally budgeting for a 5% increase and the actual increase was 6.5% plus 0.25%.
Depreciation was recalculated using the audited asset register and decreased by R8 307 171. Main sewerage increased by R198 950 as a result of a blockage underneath Bokomo Pasta. The Municipality needed to make use of a
specialist to unblock the pipe. By-laws: R300 000 has been requested for the review of by-laws (mainly financial). No budget was originally provided. Commission: Pre-paid electricity increased by R277 894 due the original budget not being sufficient. Membership Fees: Salga membership fees increased by R376 284. Occupational Rent: R851 790 has been requested to pay Korjon interest on non-vacant plots in Chatsworth. No budget was originally
provided. Valuations: R246 793 has been requested for the valuation court and appeals. No budget was originally provided for the general
valuation.
On the income side:
All unspent grants and additional grants that were not originally budgeted for, as well as other conditional receipts not requested for roll over have been listed.
Capital projects which are already completed and whose final expenditure are known, are also adjusted. Items that are influenced by virement, incomplete projects for 2011/2012 as well as new projects for 2012/2013 as a result of emergencies are also included in the adjustments budget.

Mid-year budget and performance assessment i.r.o. the first half of the 2012/13 financial year 7
2 RESOLUTIONS
2.1 Monthly budget statement and any supporting documents
Monthly budget statements and supporting documents in terms of section 71 of the MFMA are submitted by the Director Financial Services to the Mayoral Committee or a Council Portfolio Committee. The reports cover the following: Investment portfolio (section 13 of the MFMA) Long term debt (section 46 of the MFMA) Revenue and expenditure (sections 64 and 65 of the MFMA) Capital budget SDBIP Debtors report Stand by and overtime Performance targets and actuals Personnel expenses (section 66 of the MFMA)
The following resolutions were recorded:
Resolution (Item 5.1.2 of the Portfolio Committee held on 5 September 2012, Mayoral Committee 12 September 2012) That the monthly report for July 2012 of the Municipal Manager, the Directorate Financial Services and the Directorate Corporate Services respectively, be noted.
Resolution (Item 5.1.2 of the Portfolio Committee held on 3 October 2012, Mayoral Committee 10 October 2012) That the monthly report for August 2012 of the Municipal Manager, the Directorate Financial Services and the Directorate Corporate Services respectively, be noted.
The monthly report for October 2012 will be submitted as part of the quarterly report for October to December 2012.
2.2 Quarterly report on the implementation of the budget and the financial affairs for the municipality
A quarterly report in terms of section 52 of the MFMA is submitted by the Director Financial Services to the Mayoral Committee or a Council Portfolio Committee. The report covers the same information as is mentioned in respect of monthly budget statements in paragraph 2.1 above
The following resolutions were recorded:
Resolution (Mayoral Committee 14 November 2012) That the quarterly report for July to September 2012 of the Municipal Manager, the Directorate Financial Services and the Directorate Corporate Services respectively, be noted

8 Mid-year budget and performance assessment i.r.o. the first half of the 2012/13 financial year
2.3 Mid-year budget and performance assessment
At its meeting held on 23 January 2013 the Executive Mayoral Committee resolved -
(a) that cognizance be taken of the mid-year budget and performance assessment i.r.o. the first half of the 2012/13 financial year;
(b) that the assessment report be submitted to Council on 31 January 2013 in terms of Section 54(1)(f) of the MFMA;
(c) that, following the above [and with reference to regulation 23(1) above], an adjustments budget on the 2012/13 budget be tabled for consideration at the council meeting on 31 January 2013; and
(d) that the Strategic Manager in cooperation with the Director Financial Services ensure that, in terms of Section 72 of the MFMA as well as regulation 35 above, the mid-year budget and performance assessment report -
(i) be submitted to National Treasury and Provincial Treasury, in both printed and electronic format, on 25 January 2013; and
(ii) in terms of regulation 34(1), by no later than 1 February 2013, be placed on the website for public scrutiny.
3 EXECUTIVE SUMMARY
3.1 Introduction
The Municipal Manager, as accounting officer of the Municipality, is required by Section 72(1) of the Municipal Finance Management Act (MFMA) No 56 of 2003, to -
(a) assess the performance of the municipality during the first half of the financial year, taking into account-
(i) the monthly statements referred to in section 71 for the first half of the financial year;
(ii) the municipality's service delivery performance during the first half of the financial year, and the service delivery targets and performance indicators set in the service delivery and budget implementation plan;
(iii) the past year's annual report, and progress on resolving problems identified in the annual report; and
(iv) the performance of every municipal entity under the sole or shared control of the municipality, taking into account reports in terms of section 88 from any such entities; and
(b) submit a report on such assessment to-
(i) the mayor of the municipality;
(ii) the National Treasury; and
(iii) the relevant provincial treasury
3.2 Consolidated performance
The following table summarises the overall position on the capital and operating budgets

Mid-year budget and performance assessment i.r.o. the first half of the 2012/13 financial year 9
4 IN-YEAR BUDGET STATEMENT TABLES
The in-year budget statement tables are presented in the paragraphs below. Supporting information, charts and explanations of trends and anomalies are given for each table where such information will assist with understanding the information contained in the tables.
Operating ExpenditureOperating RevenueCapital Expenditure
Original Budget Adjustment Budget Actual
211,306,023
Variance Variance %430,479,736 404,953,216 86,848,463
0 197,317,440 233,162,296 54%0 193,647,193 48%0 40,077,962 46,770,501 54%

10 Mid-year budget and performance assessment i.r.o. the first half of the 2012/13 financial year
4.1 Monthly Budget Statement Summary
WC015 Swartland - Table C1 Monthly Budget Statement Summary - Q2 Second Quarter2011/12Audited
OutcomeOriginal Budget
Adjusted Budget
Monthly actual YearTD actual YearTD
budgetYTD
variance YTD variance Full Year Forecast
R thousands %Financial Performance
Property rates – 67 476 – 5 751 37 379 33 763 3 616 11% 67 476 Service charges – 240 767 – 20 847 119 427 128 591 (9 164) -7% 240 767 Investment revenue – 13 218 – 126 770 668 102 15% 13 218 Transfers recognised - operational – 34 701 – – 20 064 11 076 8 988 81% 34 701 Other own revenue – 29 310 – 3 864 17 678 13 975 3 703 26% 29 310
Total Revenue (excluding capital transfers and contributions)
– 385 473 – 30 588 195 317 188 072 7 246 4% 385 473
Employee costs – 117 689 – 8 830 55 929 58 310 (2 381) -4% 117 689 Remuneration of Councillors – 7 016 – 532 3 244 3 309 (65) -2% 7 016 Depreciation & asset impairment – 76 853 – 6 394 38 366 38 427 (61) -0% 76 853 Finance charges – 15 864 – 8 053 8 072 8 436 (365) -4% 15 864 Materials and bulk purchases – 145 447 – 9 691 64 748 78 866 (14 119) -18% 145 447 Transfers and grants – 1 363 – 215 808 770 38 1 363 Other expenditure – 66 247 – 4 855 26 151 30 247 (4 096) -14% 66 247
Total Expenditure – 430 480 – 38 571 197 317 218 366 (21 048) -10% 430 480 Surplus/(Deficit) – (45 007) – (7 982) (2 000) (30 294) 28 294 -93% (45 007)
Transfers recognised - capital – 19 480 – – – 9 020 (9 020) -100% 19 480 Contributions & Contributed assets – – – – – – – –
Surplus/(Deficit) after capital transfers & contributions
– (25 527) – (7 982) (2 000) (21 274) 19 274 -91% (25 527)
Share of surplus/ (deficit) of associate – – – – – – – – Surplus/ (Deficit) for the year – (25 527) – (7 982) (2 000) (21 274) 19 274 -91% (25 527)
DescriptionBudget Year 2012/13

Mid-year budget and performance assessment i.r.o. the first half of the 2012/13 financial year 11
2011/12Audited
OutcomeOriginal Budget
Adjusted Budget
Monthly actual YearTD actual YearTD
budgetYTD
variance YTD variance Full Year Forecast
R thousands %Capital expenditure & funds sourcesCapital expenditure – 86 848 – 9 364 40 078 43 574 (3 496) -8% 86 848
Capital transfers recognised – 19 480 – 3 099 15 989 14 875 1 114 7% 19 480 Public contributions & donations – – – – – – – – Borrowing – 22 948 – 8 86 11 748 (11 662) -99% 22 948 Internally generated funds – 44 420 – 5 427 24 003 16 951 7 051 42% 44 420
Total sources of capital funds – 86 848 – 8 534 40 078 43 574 (3 496) -8% 86 848
Financial positionTotal current assets – 216 792 – 249 370 216 792 Total non current assets – 1 757 528 – 1 763 832 1 757 528 Total current liabilities – 55 648 – 50 684 55 648 Total non current liabilities – 182 728 – 176 860 182 728
Community wealth/Equity – 1 735 945 – 1 785 658 1 735 945
Cash flowsNet cash from (used) operating – 51 551 – 10 425 (167 652) 16 985 (184 638) -1087% 51 551 Net cash from (used) investing – (80 459) – (7 739) (33 853) (37 204) 3 351 -9% (80 459) Net cash from (used) financing – (6 233) – (3 034) (2 679) (3 116) 438 -14% (6 233)
Cash/cash equivalents at the month/year end – 177 433 – – 15 008 189 239 (174 230) -92% 184 051
Debtors & creditors analysis 0-30 Days 31-60 Days 61-90 Days 91-120 Days 121-150 Dys 151-180 Dys 181 Dys-1 Yr Over 1Yr Total
Debtors Age AnalysisTotal By Revenue Source 24 868 4 216 1 066 1 569 629 581 291 7 774 40 994 Creditors Age AnalysisTotal Creditors – 38 11 – 0 – – – 50
DescriptionBudget Year 2012/13

12 Mid-year budget and performance assessment i.r.o. the first half of the 2012/13 financial year
4.2 Monthly Budget Statement - Financial Performance (standard classification)
2011/12 Budget Year 2012/13Audited
OutcomeOriginal Budget
Adjusted Budget
Monthly actual YearTD actual YearTD
budgetYTD
varianceYTD
varianceFull Year Forecast
R thousands 1 %Revenue - Standard
Governance and administration – 122 217 – 7 523 48 164 61 074 (12 910) -21% 122 217 Executive and council – 2 541 – 0 21 1 415 (1 394) -98% 2 541 Budget and treasury office – 119 676 – 7 473 47 614 59 159 (11 545) -20% 119 676 Corporate services – – – 49 529 500 29 6% –
Community and public safety – 11 588 – 659 4 585 5 786 (1 201) -21% 11 588 Community and social services – 5 253 – 47 416 2 626 (2 210) -84% 5 253 Sport and recreation – 2 056 – 239 1 577 1 021 556 55% 2 056 Public safety – 4 028 – 356 2 470 2 013 456 23% 4 028 Housing – 251 – 17 122 125 (3) -3% 251 Health – – – – – – – –
Economic and environmental services – 6 769 – 635 3 933 3 383 550 16% 6 769 Planning and development – 1 312 – 145 958 656 303 46% 1 312 Road transport – 5 456 – 490 2 975 2 727 248 9% 5 456 Environmental protection – – – – – – – –
Trading services – 264 362 – 21 770 138 626 132 127 6 499 5% 264 362 Electricity – 171 059 – 13 941 86 034 85 494 540 1% 171 059 Water – 35 245 – 3 729 15 464 17 615 (2 151) -12% 35 245 Waste water management – 32 939 – 2 403 21 920 16 463 5 458 33% 32 939 Waste management – 25 119 – 1 698 15 208 12 555 2 652 21% 25 119
Other 4 – 18 – 1 9 9 0 1% 18 Total Revenue - Standard 2 – 404 953 – 30 588 195 317 202 379 (7 062) -3% 404 953
RefDescription
WC015 Swartland - Table C2 Monthly Budget Statement - Financial Performance (standard classification) - Mid-Year Assessment

Mid-year budget and performance assessment i.r.o. the first half of the 2012/13 financial year 13
2011/12 Budget Year 2012/13Audited Outcome
Original Budget
Adjusted Budget
Monthly actual YearTD actual YearTD
budgetYTD
varianceYTD
varianceFull Year Forecast
R thousands 1 %Expenditure - Standard
Governance and administration – 73 525 – 4 972 29 213 31 568 (2 355) -7% 73 525 Executive and council – 18 305 – 910 5 847 6 900 (1 053) -15% 18 305 Budget and treasury office – 55 220 – 1 184 10 961 11 962 (1 001) -8% 55 220 Corporate services – – – 2 878 12 405 12 706 (301) -2% –
Community and public safety – 46 769 – 3 812 20 954 22 583 (1 628) -7% 46 769 Community and social services – 10 289 – 784 4 614 4 561 53 1% 10 289 Sport and recreation – 15 610 – 1 139 6 638 7 488 (850) -11% 15 610 Public safety – 19 670 – 1 799 9 145 9 968 (824) -8% 19 670 Housing – 1 200 – 90 557 565 (8) -1% 1 200 Health – – – – – – – –
Economic and environmental services – 54 336 – 5 418 28 979 29 133 (154) -1% 54 336 Planning and development – 7 638 – 616 3 215 3 783 (568) -15% 7 638 Road transport – 46 698 – 4 802 25 764 25 350 414 2% 46 698 Environmental protection – – – – – – – –
Trading services – 254 809 – 24 189 117 556 125 192 (7 636) -6% 254 809 Electricity – 152 751 – 10 789 72 199 74 986 (2 786) -4% 152 751 Water – 42 310 – 3 567 17 304 19 114 (1 810) -9% 42 310 Waste water management – 38 078 – 8 268 18 121 19 716 (1 595) -8% 38 078 Waste management – 21 669 – 1 566 9 932 11 377 (1 446) -13% 21 669
Other – 1 041 – 179 614 510 104 20% 1 041 Total Expenditure - Standard 3 – 430 480 – 38 571 197 317 208 986 (11 669) -6% 430 480 Surplus/ (Deficit) for the year – (25 527) – (7 982) (2 000) (6 607) 4 607 -70% (25 527) References1. Government Finance Statistics Functions and Sub-functions are standardised to assist the compilation of national and international accounts for comparison purposes2. Total Revenue by standard classification must reconcile to Total Operating Revenue shown in the Financial Performance Statement3. Total Expenditure by standard classification must reconcile to total operating expenditure shown in 'Financial Performance Statement'
RefDescription
4. All amounts must be classified under a standard classification (modified GFS). The GFS function 'Other' is only for Abbatoirs, Air Transport, Markets and Tourism - and if used must be supported by footnotes. Nothing else may be placed under 'Other'. Assign associate share to relevant classification

14 Mid-year budget and performance assessment i.r.o. the first half of the 2012/13 financial year
4.3 Monthly Budget Statement - Financial Performance (revenue and expenditure by municipal vote)
Vote Description 2011/12Audited
OutcomeOriginal Budget
Adjusted Budget
Monthly actual YearTD actual YearTD
budgetYTD
varianceYTD
varianceFull Year Forecast
R thousands %Revenue by Vote 1
Vote 1 - Corporate Services – 5 453 – 32 524 2 726 (2 202) -80.8% 5 453 Vote 2 - Civil Services – 94 676 – 8 047 53 411 47 320 6 091 12.9% 94 676 Vote 3 - Council – 2 492 – 0 21 1 415 (1 394) -98.5% 2 492 Vote 4 - Electricity Services – 171 059 – 13 941 86 034 85 494 540 0.6% 171 059 Vote 5 - Financial Services – 118 724 – 7 473 47 614 59 159 (11 545) -19.5% 118 724 Vote 6 - Development Services – 3 158 – 285 2 334 1 571 763 48.5% 3 158 Vote 7 - Municipal Manager – – – – – – – – Vote 8 - Protection Services – 9 391 – 810 5 379 4 693 686 14.6% 9 391
Total Revenue by Vote 2 – 404 953 – 30 588 195 317 202 379 (7 062) -3.5% 404 953
Expenditure by Vote 1Vote 1 - Corporate Services – 16 556 – 1 829 8 155 8 452 (297) -3.5% 16 556 Vote 2 - Civil Services – 170 867 – 20 253 80 513 85 221 (4 708) -5.5% 170 867 Vote 3 - Council – 9 523 – 652 4 197 4 944 (747) -15.1% 9 523 Vote 4 - Electricity Services – 152 751 – 10 789 72 199 74 986 (2 786) -3.7% 152 751 Vote 5 - Financial Services – 40 174 – 1 572 13 391 14 727 (1 336) -9.1% 40 174 Vote 6 - Development Services – 11 920 – 988 5 455 5 998 (543) -9.0% 11 920 Vote 7 - Municipal Manager – 3 578 – 259 1 649 1 956 (306) -15.7% 3 578 Vote 8 - Protection Services – 25 111 – 2 230 11 758 12 703 (945) -7.4% 25 111
Total Expenditure by Vote 2 – 430 480 – 38 571 197 317 208 986 (11 669) -5.6% 430 480 Surplus/ (Deficit) for the year 2 – (25 527) – (7 982) (2 000) (6 607) 4 607 -69.7% (25 527) References1. Insert 'Vote'; e.g. Department, if different to standard classification structure2. Must reconcile to Monthly Budget Statement - Financial Performance Statement (standard classification)
WC015 Swartland - Table C3 Monthly Budget Statement - Financial Performance (revenue and expenditure by municipal vote) - Mid-Year
Ref
Budget Year 2012/13

Mid-year budget and performance assessment i.r.o. the first half of the 2012/13 financial year 15
4.4 Monthly Budget Statement - Financial Performance (revenue and expenditure)
The statement of financial performance compares the expenditure and revenue against budget for the period ended 31 December 2012. Revenue received from property rates exceeds initial budgeted projections by 11%. As for water and electricity, the opposite is the case. The Municipality received 23% and 8% less than the initial projections. Water’s variance decreased by 9% from November to December and electricity’s variance by 3%. Water and electricity are both showing an upward trend in consumption, as predicted. Revenue received from water consumption increased by ±R1.2 million from November to December and from electricity consumption by ±R700 000. These increases are as a result of the holiday season. One of the Municipality’s investments totalling R85 million matured on 31 December 2012. Revenue received from fines is 32% higher than initial projections. Grants and subsidies received variance currently stands at 81%. This is due to the fact that the initial assumption of when the equitable share tranches will be paid out to Swartland was out by roughly a month. Revenue received in the month of November stands at R30.6 million. Revenue-to-date stands at R195.3 million. Variance for revenue received stands at 4% for the first half of the financial year.
2011/12Audited
OutcomeOriginal Budget
Adjusted Budget
Monthly actual YearTD actual YearTD
budgetYTD
varianceYTD
varianceFull Year Forecast
R thousands %Revenue By Source
Property rates 67 476 – 5 751 37 379 33 763 3 616 11% 67 476 Property rates - penalties & collection charges – – – – – – – Service charges - electricity revenue 169 402 – 13 848 84 765 91 848 (7 083) -8% 169 402 Service charges - water revenue 32 285 – 3 581 13 142 17 071 (3 929) -23% 32 285 Service charges - sanitation revenue 20 934 – 1 886 12 187 10 573 1 614 15% 20 934 Service charges - refuse revenue 18 147 – 1 533 9 333 9 098 235 3% 18 147 Service charges - other – – – – – – – Rental of facilities and equipment 2 407 – 174 1 711 1 373 338 25% 2 407 Interest earned - external investments 12 023 – 11 97 71 26 36% 12 023 Interest earned - outstanding debtors 1 195 – 115 673 596 76 13% 1 195 Dividends received – – – – – – – Fines 4 040 – 358 2 459 1 861 598 32% 4 040 Licences and permits 2 724 – 217 1 535 1 342 193 14% 2 724 Agency services 2 416 – 195 1 239 1 208 31 3% 2 416 Transfers recognised - operational 34 701 – – 20 064 11 076 8 988 81% 34 701 Other revenue 11 360 – 1 381 6 797 5 192 1 605 31% 11 360 Gains on disposal of PPE 6 365 – 1 539 3 938 2 999 939 31% 6 365
Total Revenue (excluding capital transfers and contributions)
– 385 473 – 30 588 195 317 188 072 7 246 4% 385 473
Description RefBudget Year 2012/13
WC015 Swartland - Table C4 Monthly Budget Statement - Financial Performance (revenue and expenditure) - Mid-Year Assessment

16 Mid-year budget and performance assessment i.r.o. the first half of the 2012/13 financial year
2011/12Audited
OutcomeOriginal Budget
Adjusted Budget
Monthly actual YearTD actual YearTD
budgetYTD
varianceYTD
varianceFull Year Forecast
R thousands %Expenditure By Type
Employee related costs 117 689 – 8 830 55 929 58 310 (2 381) -4% 117 689 Remuneration of councillors 7 016 – 532 3 244 3 309 (65) -2% 7 016 Debt impairment 9 636 – – 343 2 832 (2 489) -88% 9 636 Depreciation & asset impairment 76 853 – 6 394 38 366 38 427 (61) 0% 76 853 Finance charges 15 864 – 8 053 8 072 8 436 (365) -4% 15 864 Bulk purchases 145 447 – 9 691 64 748 78 866 (14 119) -18% 145 447 Other materials – – – – – – – Contracted services 3 345 – 270 1 457 1 495 (38) -3% 3 345 Transfers and grants 1 363 – 215 808 770 38 5% 1 363 Other expenditure 53 267 – 4 586 24 351 25 921 (1 570) -6% 53 267 Loss on disposal of PPE – – – – – – –
Total Expenditure – 430 480 – 38 571 197 317 218 366 (21 048) -10% 430 480
Surplus/(Deficit) – (45 007) – (7 982) (2 000) (30 294) 28 294 (0) (45 007) Transfers recognised - capital 19 480 – – – 9 020 (9 020) (0) 19 480 Contributions recognised - capital – – – – – – – Contributed assets – – – – – – –
Surplus/(Deficit) after capital transfers & contributions – (25 527) – (7 982) (2 000) (21 274) (25 527) Taxation – – – – – – –
Surplus/(Deficit) after taxation – (25 527) – (7 982) (2 000) (21 274) (25 527) Attributable to minorities – – – – – –
Surplus/(Deficit) attributable to municipality – (25 527) – (7 982) (2 000) (21 274) (25 527)
Share of surplus/ (deficit) of associate – – – – – – Surplus/ (Deficit) for the year – (25 527) – (7 982) (2 000) (21 274) (25 527) References1. Material variances to be explained on Table SC1
Description RefBudget Year 2012/13

Mid-year budget and performance assessment i.r.o. the first half of the 2012/13 financial year 17
Overall, operating expenditure is at an acceptable level i.e. currently standing at 10% below the initial expenditure projection. Employee related costs are right on par with projections for the first five months of the financial year. The variance is a mere 4% (no movement from November to December). The Municipality is very reluctant to write-off bad debts as we do not want to foster the habit of non-payment even though we make provision for it. Depreciation has been corrected and currently the Year-to-date variance stands at 0%. The Municipality’s loans are paid back bi-annually i.e. December and June. Bulk purchases for the year are currently 18% below the initial projected expenditure for the first six months of the financial year. Grants and subsidies paid are 5% above initial budget projections.

18 Mid-year budget and performance assessment i.r.o. the first half of the 2012/13 financial year
4.5 Monthly Budget Statement - Capital Expenditure (municipal vote, standard classification and funding)
2011/12 Budget Year 2012/13Audited
OutcomeOriginal Budget
Adjusted Budget
Monthly actual YearTD actual YearTD
budgetYTD
varianceYTD
varianceFull Year Forecast
R thousands 1 %Multi-Year expenditure appropriation 2
Vote 1 - Corporate Services – – – – – – – – Vote 2 - Civil Services – 37 507 – 3 726 10 258 23 000 (12 742) -55% 37 507 Vote 3 - Council – – – – – – – – Vote 4 - Electricity Services – – – – – – – – Vote 5 - Financial Services – – – – – – – – Vote 6 - Development Services – – – – – – – – Vote 7 - Municipal Manager – – – – – – – – Vote 8 - Protection Services – – – – – – – –
Total Capital Multi-year expenditure 4,7 – 37 507 – 3 726 10 258 23 000 (12 742) -55% 37 507
Single Year expenditure appropriation 2Vote 1 - Corporate Services – 269 – – 1 208 78 1 130 1449% 269 Vote 2 - Civil Services – 29 090 – 4 994 19 803 12 390 7 413 60% 29 090 Vote 3 - Council – 13 – – – 5 (5) -100% 13 Vote 4 - Electricity Services – 17 060 – 532 7 562 5 984 1 577 26% 17 060 Vote 5 - Financial Services – 1 011 – 25 654 752 (98) -13% 1 011 Vote 6 - Development Services – 823 – 16 98 483 (385) -80% 823 Vote 7 - Municipal Manager – 18 – – 21 10 10 100% 18 Vote 8 - Protection Services – 1 058 – 71 475 872 (397) -46% 1 058
Total Capital single-year expenditure 4 – 49 341 – 5 639 29 820 20 574 9 246 45% 49 341 Total Capital Expenditure – 86 848 – 9 364 40 078 43 574 (3 496) -8% 86 848
WC015 Swartland - Table C5 Monthly Budget Statement - Capital Expenditure (municipal vote, standard classification and funding) - Mid-Year Assessment
Vote Description Ref

Mid-year budget and performance assessment i.r.o. the first half of the 2012/13 financial year 19
2011/12 Budget Year 2012/13Audited
OutcomeOriginal Budget
Adjusted Budget
Monthly actual YearTD actual YearTD
budgetYTD
varianceYTD
varianceFull Year Forecast
R thousands 1 %Capital Expenditure - Standard Classification
Governance and administration – 1 275 – 25 2 165 975 1 190 122% 1 275 Executive and council 31 – – 21 16 5 34% 31 Budget and treasury office 326 – 23 235 190 45 23% 326 Corporate services 918 – 2 1 910 770 1 140 148% 918
Community and public safety – 5 041 – 490 1 579 2 663 (1 083) -41% 5 041 Community and social services 747 – 16 138 453 (314) -69% 747 Sport and recreation 2 685 – 403 966 988 (22) -2% 2 685 Public safety 1 058 – 71 475 872 (397) -46% 1 058 Housing 550 – – – 350 (350) -100% 550 Health –
Economic and environmental services – 13 495 – 1 510 13 225 8 302 4 923 59% 13 495 Planning and development 200 – – – – – 200 Road transport 13 295 – 1 510 13 225 8 302 4 923 59% 13 295 Environmental protection –
Trading services – 67 037 – 7 340 23 108 31 634 (8 526) -27% 67 037 Electricity 17 060 – 532 7 562 5 984 1 577 26% 17 060 Water 8 013 – 1 243 2 056 2 163 (107) -5% 8 013 Waste water management 39 779 – 3 773 11 670 23 437 (11 767) -50% 39 779 Waste management 2 186 – 1 791 1 820 50 1 770 3540% 2 186
Other – Total Capital Expenditure - Standard Classification 3 – 86 848 – 9 364 40 078 43 574 (3 496) -8% 86 848
Vote Description Ref

20 Mid-year budget and performance assessment i.r.o. the first half of the 2012/13 financial year
The total capital expenditure as at 31 December 2012 amounts to R 40.1 million which is 8% below our projected expenditure for the first six months of the financial year. This is well in line with the initial budgeted figures for the first six months which is positive for the Municipality as it means the variance between the projected implementation and the actual implementation of the capital projects is low. Also it mitigates the risk of a sharp increase in capital expenditure in the last quarter which is unfortunately a trend for many municipalities with poor financial controls. With current spending trends on capital projects the way they are, we can expect our capital budget to be no less than 95% spent at the 30 June 2013.
2011/12 Budget Year 2012/13Audited
OutcomeOriginal Budget
Adjusted Budget
Monthly actual YearTD actual YearTD
budgetYTD
varianceYTD
varianceFull Year Forecast
R thousands 1 %Funded by:
National Government 18 025 – 3 096 15 614 14 625 989 7% 18 025 Provincial Government 116 – – – – – 116 District Municipality – – – – – – – Other transfers and grants 1 339 – 3 374 250 124 50% 1 339
Transfers recognised - capital – 19 480 – 3 099 15 989 14 875 1 114 7% 19 480 Public contributions & donations 5 – – Borrowing 6 22 948 – 8 86 11 748 (11 662) -99% 22 948 Internally generated funds 44 420 – 5 427 24 003 16 951 7 051 42% 44 420
Total Capital Funding – 86 848 – 8 534 40 078 43 574 (3 496) -8% 86 848 References1. Municipalities may choose to appropriate for capital expenditure for three years or for one year (if one year appropriation projected expenditure required for yr2 and yr3).
5. Must reconcile to Monthly Budget Statement Financial Performance (revenue and expenditure)6. Include finance leases and PPP capital funding component of unitary payment - total borrowing/repayments to reconcile to changes in Table SA17
2. Include capital component of PPP unitary payment
4. Include expenditure on investment property, intangible and biological assets3. Capital expenditure by standard classification must reconcile to the total of multi-year and single year appropriations
Vote Description Ref

Mid-year budget and performance assessment i.r.o. the first half of the 2012/13 financial year 21
4.6 Monthly Budget Statement - Financial Position
2011/12 Budget Year 2012/13Audited
OutcomeOriginal Budget
Adjusted Budget YearTD actual Full Year
ForecastR thousands 1ASSETSCurrent assets
Cash 28 805 – 194 382 28 805 Call investment deposits 148 628 – – 148 628 Consumer debtors 28 315 – 46 345 28 315 Other debtors 6 835 – 1 117 6 835 Current portion of long-term receivables 14 – 12 14 Inventory 4 195 – 7 514 4 195
Total current assets – 216 792 – 249 370 216 792
Non current assetsLong-term receivables 229 – 469 229 Investments – – – Investment property 33 957 – 33 933 33 957 Investments in Associate – – – – Property, plant and equipment 1 723 020 – 1 729 144 1 723 020 Agricultural – – – – Biological assets – – – – Intangible assets 98 – 286 98 Other non-current assets 224 – – 224
Total non current assets – 1 757 528 – 1 763 832 1 757 528 TOTAL ASSETS – 1 974 320 – 2 013 202 1 974 320
Description Ref
WC015 Swartland - Table C6 Monthly Budget Statement - Financial Position - Q2 Second Quarter

22 Mid-year budget and performance assessment i.r.o. the first half of the 2012/13 financial year
2011/12 Budget Year 2012/13Audited
OutcomeOriginal Budget
Adjusted Budget YearTD actual Full Year
ForecastR thousands 1LIABILITIESCurrent liabilities
Bank overdraft – – – – Borrowing 5 176 – 6 826 5 176 Consumer deposits 6 741 – 6 447 6 741 Trade and other payables 41 801 – 33 977 41 801 Provisions 1 930 – 3 434 1 930
Total current liabilities – 55 648 – 50 684 55 648
Non current liabilitiesBorrowing 155 449 – 143 555 155 449 Provisions 27 279 – 33 305 27 279
Total non current liabilities – 182 728 – 176 860 182 728 TOTAL LIABILITIES – 238 376 – 227 544 238 376
NET ASSETS 2 – 1 735 945 – 1 785 658 1 735 945
COMMUNITY WEALTH/EQUITYAccumulated Surplus/(Deficit) 1 590 493 – 1 785 176 1 590 493 Reserves 145 452 – 482 145 452
TOTAL COMMUNITY WEALTH/EQUITY 2 – 1 735 945 – 1 785 658 1 735 945 References
2. Net assets must balance with Total Community Wealth/Equity
Description Ref
1. Material variances to be explained in Table SC1

Mid-year budget and performance assessment i.r.o. the first half of the 2012/13 financial year 23
4.7 Monthly Budget Statement - Cash Flow
2011/12 Budget Year 2012/13Audited Outcome
Original Budget
Adjusted Budget
Monthly actual YearTD actual YearTD
budgetYTD
varianceYTD
varianceFull Year Forecast
R thousands 1 %CASH FLOW FROM OPERATING ACTIVITIESReceipts
Ratepayers and other 326 824 – 67 107 373 140 173 329 199 811 115% 326 824 Government - operating 34 701 – 63 26 514 11 076 15 438 139% 34 701 Government - capital 19 480 – – 9 337 9 020 317 4% 19 480 Interest 12 023 – 11 97 668 (570) -85% 12 023 Dividends – – – – – – –
PaymentsSuppliers and employees (324 250) – (48 647) (568 342) (167 901) 400 441 -238% (324 250) Finance charges (15 864) – (8 053) (8 071) (8 436) (366) 4% (15 864) Transfers and Grants (1 363) – (57) (328) (770) (442) 57% (1 363)
NET CASH FROM/(USED) OPERATING ACTIVITIES – 51 551 – 10 425 (167 652) 16 985 (184 638) -1087% 51 551
CASH FLOWS FROM INVESTING ACTIVITIESReceipts
Proceeds on disposal of PPE 6 365 – 1 533 3 931 2 999 933 31% 6 365 Decrease (Increase) in non-current debtors – – – – – – – Decrease (increase) other non-current receivables 25 – – – 12 (12) -100% 25 Decrease (increase) in non-current investments – – – – – – –
PaymentsCapital assets (86 848) – (9 271) (37 784) (40 215) (2 431) 6% (86 848)
NET CASH FROM/(USED) INVESTING ACTIVITIES – (80 459) – (7 739) (33 853) (37 204) (3 351) 9% (80 459)
Description Ref
WC015 Swartland - Table C7 Monthly Budget Statement - Cash Flow - Mid-Year Assessment

24 Mid-year budget and performance assessment i.r.o. the first half of the 2012/13 financial year
As cash flow budgeting is a fairly new concept within the municipal space, it is evident with all the major variances that the initial budget projections are not in line with what is actually realising. At a workshop in Hermanus in October 2012, Carl Stroud of National Treasury took municipal representatives through a methodology based on realistic yet conservative assumptions in order to draw up an acceptable cash flow budget over the MTREF. Swartland Municipality has done a dry run using this methodology and intend to implement it with the next budget process.
2011/12 Budget Year 2012/13Audited
OutcomeOriginal Budget
Adjusted Budget
Monthly actual YearTD actual YearTD
budgetYTD
varianceYTD
varianceFull Year Forecast
R thousands 1 %CASH FLOWS FROM FINANCING ACTIVITIESReceipts
Short term loans – – – – – – – Borrowing long term/refinancing – – – – – – – Increase (decrease) in consumer deposits 321 – 62 449 160 289 180% 321
PaymentsRepayment of borrowing (6 553) – (3 096) (3 128) (3 277) (149) 5% (6 553)
NET CASH FROM/(USED) FINANCING ACTIVITIES – (6 233) – (3 034) (2 679) (3 116) (438) 14% (6 233)
NET INCREASE/ (DECREASE) IN CASH HELD – (35 141) – (347) (204 184) (23 335) (35 141) Cash/cash equivalents at beginning: 212 573 – 219 192 212 573 219 192 Cash/cash equivalents at month/year end: – 177 433 – 15 008 189 239 184 051
References1. Material variances to be explained in Table SC1
Description Ref

Mid-year budget and performance assessment i.r.o. the first half of the 2012/13 financial year 25
PART 2: SUPPORTING DOCUMENTATION
1 DEBTORS' ANALYSIS
Outstanding debt 150 days and older decreased from R8.7 million in October 2012 to R8.6 million in December 2012. This equates to a decrease of roughly R100 000. However, when comparing December 2012 to December 2011, there was an increase of roughly R1.8 million in outstanding debt for 150 days and older.
Swartland is currently preparing the list for the next round of write-offs which will be taken to council for consideration and approval. Write-offs only occur after the end of each quarter.
Description Budget Year 2012/13 0-30 Days 31-60 Days 61-90 Days 91-120 Days 121-150 Dys 151-180 Dys 181 Dys-1 Yr Over 1Yr
R thousandsDebtors Age Analysis By Revenue Source
Rates 1200 4 813 1 013 372 1 043 213 178 59 2 388 10 080 – 3 881 Electricity 1300 11 286 1 284 78 63 44 36 14 480 13 285 – 637 Water 1400 3 990 600 126 87 72 64 57 1 145 6 142 – 1 425 Sewerage / Sanitation 1500 1 956 627 204 161 129 113 58 1 676 4 924 – 2 137 Refuse Removal 1600 1 703 547 189 149 126 113 67 1 210 4 104 – 1 664 Housing (Rental Revenue) 1700 33 16 3 3 3 2 2 48 108 – 57 Other 1900 1 088 129 94 63 41 74 34 828 2 351 – 1 041
Total By Revenue Source 2000 24 868 4 216 1 066 1 569 629 581 291 7 774 40 994 – 10 843 2011/12 - totals only – – Debtors Age Analysis By Customer Category
Government 2200 930 54 10 154 1 4 1 25 1 178 – Business 2300 9 387 589 66 33 17 16 11 387 10 508 – Households 2400 13 562 3 362 857 673 536 497 263 6 762 26 512 – Other 2500 989 211 132 710 75 64 16 599 2 795 –
Total By Customer Category 2600 24 868 4 216 1 066 1 569 629 581 291 7 774 40 994 – NotesMaterial increases in value of debtors' categories compared to previous month to be explainedBad debts = amounts actually written off in the monthTotal by Revenue Source must reconcile with Total by Customer Group
WC015 Swartland - Supporting Table SC3 Monthly Budget Statement - aged debtors - Mid-Year Assessment
Bad Debts >90 days
NT Code Total

26 Mid-year budget and performance assessment i.r.o. the first half of the 2012/13 financial year
2 CREDITORS' ANALYSIS
The creditors older than 60 days has a dispute hanging over the services rendered by the supplier and most of those between 31 – 60 days was because of invoices that was received late – close to a month and more after the date on the invoice (These are paid as soon as they were receive).
Budget Year 2012/13
R thousands
Creditors Age Analysis By Customer TypeBulk Electricity 0100 – – – – – – – – – – Bulk Water 0200 – – – – – – – – – – PAYE deductions 0300 – – – – – – – – – – VAT (output less input) 0400 – – – – – – – – – – Pensions / Retirement deductions 0500 – – – – – – – – – – Loan repayments 0600 – – – – – – – – – – Trade Creditors 0700 – 38 11 – 0 – – – 50 Auditor General 0800 – – – – – – – – – – Other 0900 – – – – – – – – – –
Total By Customer Type 2600 – 38 11 – 0 – – – 50 – NotesMaterial increases in value of creditors' categories compared to previous month to be explained
121 - 150 Days
151 - 180 Days
Description NT Code 0 -
30 Days31 -
60 Days
Prior year totals for chart (same
period)
WC015 Swartland - Supporting Table SC4 Monthly Budget Statement - aged creditors - Mid-Year Assessment
181 Days -1 Year
Over 1Year
Total61 - 90 Days
91 - 120 Days

Mid-year budget and performance assessment i.r.o. the first half of the 2012/13 financial year 27
3 INVESTMENT PORTFOLIO ANALYSIS
The R85 million invested in Standard Bank matured on the 31 December 2012. The funds were redeemed from the fixed deposit and moved to the call account.
Investments by maturityName of institution & investment ID
Period of Investment
R thousands Yrs/Months
MunicipalityABSA 361 Days Fixed Deposit 28 June 2013 6.1% 85 000 85 000 ABSA Call 157 5.3% 31 198 68 112 99 311 Standard Bank 182 Days Fixed Deposit 31 Dec 2012 2 455 5.8% 85 000 (85 000) –
Municipality sub-total 2 612 201 198 (16 888) 184 311
EntitiesN/A
Entities sub-total – – – –
TOTAL INVESTMENTS AND INTEREST 2 2 612 201 198 (16 888) 184 311 References1. Yield is calculated as the annualised equivalent2. Total market value must reconcile with the total of investments on the 'Financial Position statement'
WC015 Swartland - Supporting Table SC5 Monthly Budget Statement - investment portfolio - Mid-Year Assessment
Ref
Type of Investment
Expiry date of investment
Market value at end of the
month
Accrued interest for the month
Yield for the month 1
(%)
Market value at beginning of the month
Change in market value

28 Mid-year budget and performance assessment i.r.o. the first half of the 2012/13 financial year
4 ALLOCATION AND GRANT RECEIPTS AND EXPENDITURE
2011/12 Budget Year 2012/13Audited
OutcomeOriginal Budget
Adjusted Budget
Monthly actual YearTD actual YearTD
budgetYTD
varianceYTD
varianceFull Year Forecast
R thousands %RECEIPTS: 1,2
Operating Transfers and Grants
National Government: – 29 802 – – 13 897 13 016 881 6.8% 29 802 Local Government Equitable Share 26 752 – – 11 147 9 966 1 181 11.8% 26 752 Municipal Systems Improvement 800 – – 800 800 – 800 Finance Management 1 250 – – 1 250 1 250 – 1 250 EPWP Incentive 1 000 – – 700 1 000 (300) -30.0% 1 000
Provincial Government: – 4 899 – – 3 253 4 527 (1 274) -28.1% 4 899 Community Development: Workers 27 – – 27 27 – 27 Libraries 4 500 – – 3 226 4 500 (1 274) -28.3% 4 500 Proclaimed Roads Subsidy 172 – – – – – 172 PAWK: Sport and Recreation 4 200 – – – – – 200
Total Operating Transfers and Grants 5 – 34 701 – – 17 150 17 543 (393) -2.2% 34 701
Capital Transfers and Grants
National Government: – 18 025 – – 9 337 18 025 (8 688) -48.2% 18 025 Municipal Infrastructure Grant (MIG) 14 525 – – 9 337 14 525 (5 188) -35.7% 14 525 Department of Water 3 500 – – – 3 500 (3 500) -100.0% 3 500
Provincial Government: – 116 – – 200 – 200 #DIV/0! 116 PAWK 116 – – 200 – 200 #DIV/0! 116
Other grant providers: – 1 339 – – – – – 1 339 Lotto 1 339 – – – – – 1 339
Total Capital Transfers and Grants 5 – 19 480 – – 9 537 18 025 (8 488) -47.1% 19 480
TOTAL RECEIPTS OF TRANSFERS & GRANTS 5 – 54 181 – – 26 687 35 568 (8 881) -25.0% 54 181 References1. Each grant is listed by name as gazetted together with the name of the transferring department or municipality, donor or other organisation2. Grant expenditure must be separately listed for each grant received3. Replacement of RSC levies4. Housing subsidies for housing where ownership transferred5. Total recurrent/capital grants and subsidies must reconcile to the 'Financial Performance' Statement
Description Ref
WC015 Swartland - Supporting Table SC6 Monthly Budget Statement - transfers and grant receipts - Mid-Year Assessment

Mid-year budget and performance assessment i.r.o. the first half of the 2012/13 financial year 29
2011/12 Budget Year 2012/13Audited
OutcomeOriginal Budget
Adjusted Budget
Monthly actual YearTD actual YearTD
budgetYTD
varianceYTD
varianceFull Year Forecast
R thousands %EXPENDITURE
Operating expenditure of Transfers and GrantsNational Government: – 29 802 – 2 054 12 028 11 105 924 8.3% 29 802
Local Government Equitable Share 26 752 – 1 764 10 457 10 062 395 3.9% 26 752 Municipal Systems Improvement 800 – 18 205 400 (195) -48.7% 800 Finance Management 1 250 – 101 637 642 (5) -0.8% 1 250 EPWP Incentive 1 000 – 171 728 728 1 000
Provincial Government: – 4 899 – 670 2 049 1 517 532 35.1% 4 899 Community Development: Workers 27 – 4 11 13 (2) -18.4% 27 Libraries 4 500 – 494 1 866 1 267 599 47.3% 4 500 Proclaimed Roads Subsidy 172 – 172 172 136 36 26.2% 172 PAWK: Sport and Recreation 200 – – – 100 (100) -100.0% 200
District Municipality: – – – – – – – – [insert description] –
Other grant providers: – – – – – – – – –
Total operating expenditure of Transfers and Grants: – 34 701 – 2 724 14 077 12 621 1 456 11.5% 34 701
Description Ref
WC015 Swartland - Supporting Table SC7 Monthly Budget Statement - transfers and grant expenditure - Mid-Year Assessment

30 Mid-year budget and performance assessment i.r.o. the first half of the 2012/13 financial year
2011/12 Budget Year 2012/13Audited
OutcomeOriginal Budget
Adjusted Budget
Monthly actual YearTD actual YearTD
budgetYTD
varianceYTD
varianceFull Year Forecast
R thousands %Capital expenditure of Transfers and Grants
National Government: – 18 025 – 1 958 15 604 14 625 979 6.7% 18 025 Municipal Infrastructure Grant (MIG) 14 525 – 1 262 14 522 13 725 797 5.8% 14 525 Department of Water 3 500 – 696 1 082 900 182 20.2% 3 500
Provincial Government: – 116 – – – – – 116 PAWK 116 – – – – – 116
District Municipality: – – – – – – – – –
Other grant providers: – 1 339 – 371 374 250 124 49.7% 1 339 Lotto 1 339 – 371 374 250 124 49.7% 1 339
– Total capital expenditure of Transfers and Grants – 19 480 – 2 329 15 978 14 875 1 103 7.4% 19 480
TOTAL EXPENDITURE OF TRANSFERS AND GRANTS – 54 181 – 5 053 30 055 27 496 2 559 9.3% 54 181
Description Ref

Mid-year budget and performance assessment i.r.o. the first half of the 2012/13 financial year 31
5 COUNCILLOR ALLOWANCES AND EMPLOYEE BENEFITS
2011/12 Budget Year 2012/13Audited
OutcomeOriginal Budget
Adjusted Budget
Monthly actual YearTD actual Full Year
ForecastR thousands
1 A B C DCouncillors (Political Office Bearers plus Other)
Basic Salaries and Wages 4 034 – 309 1 843 4 034 Pension and UIF Contributions 555 – 44 274 555 Medical Aid Contributions 444 – 33 197 444 Motor Vehicle Allowance 1 678 – 115 582 1 678 Cellphone Allowance 305 – 26 169 305 Housing Allowances – – – – – Other benefits and allowances – – – – –
Sub Total - Councillors – 7 016 – 527 3 066 7 016
Senior Managers of the Municipality 3Basic Salaries and Wages 4 264 – 363 2 185 4 264 Pension and UIF Contributions 906 – 77 459 906 Medical Aid Contributions 264 – 20 102 264 Overtime – – – – – Performance Bonus – – – – – Motor Vehicle Allowance 996 – 101 470 996 Cellphone Allowance – – – – – Housing Allowances – – – – – Other benefits and allowances 355 – – 155 355 Payments in lieu of leave – – 33 63 – Long service awards 32 – – 45 32 Post-retirement benefit obligations 2 – – – – –
Sub Total - Senior Managers of Municipality – 6 817 – 594 3 479 6 817
Summary of Employee and Councillor remuneration Ref
WC015 Swartland - Supporting Table SC8 Monthly Budget Statement - counillor and staff benefits - Q2 Second Quarter

32 Mid-year budget and performance assessment i.r.o. the first half of the 2012/13 financial year
6 MATERIAL VARIANCES TO THE SERVICE DELIVERY AND BUDGET IMPLEMENTATION PLAN The document under Section 7 below contains notes where material deviations from the approved annual budget were experienced with reasons why it occurred. The notes also indicate the actions that were or will be taken to rectify the situation.
7 CAPITAL PROGRAMME PERFORMANCE
The following document reflects: (a) Projected expenditure per project per month (b) Actual expenditure per project per month (c) Notes where necessary regarding progress, problems, reasons and/or explanations

2012/3 - [SDBIP] PROJECT SCHEDULES
SWARTLAND MUNICIPALITY
STRATEGIC MANAGEMENT SYSTEM
16 January 2013����
����
����
Planned Activity
Actual Milestone
Planned Milestone
Actual Milestone on Planned Milestone
Actual Activity

Office of the Municipal Manager
Office of the Municipal Manager General
pj-09-0021aa - Equipment Council Municipal areaProject: Location:
Vote Nos: 10 80 567 0002 0
Grp No Activity Jul12 Aug12 Sep12 Oct12 Nov12 Dec12 Jan13 Feb13 Mar13 Apr13 May13 Jun13 Notes (Activity)Activity Type
1 1 Equipment/appliance - purcha N/A
Sept 12: UBM sal gedurende Okt/Nov behoeftes finaliseer waarna die balans, indien enige, tydens die aansuiweringsbegroting teruggegee sal word.S/Notes:
Projected/Actual ETD Jul12 Aug12 Sep12 Oct12 Nov12 Dec12 Jan13 Feb13 Mar13 Apr13 May13 Jun13Bdgt Type YTDDec Budget YTD Var Var % Year Bal Bal %
6 4003 200 3 200 3 200 3 347CapitalProjected Cash Flow 12 947 12 947 100.0%-6 400 -100.0%
pj-09-0021ab - Equipment Municipal Manager Municipal areaProject: Location:
Vote Nos: 10 80 567 0003 0
Grp No Activity Jul12 Aug12 Sep12 Oct12 Nov12 Dec12 Jan13 Feb13 Mar13 Apr13 May13 Jun13 Notes (Activity)Activity Type
1 1 Equipment/appliance - purcha N/A
Sept 12: Nuwe laptop word benodig vir Strategiese Bestuurder (huidige reeds 3½ jaar oud). Benodig ook 'n meer funksionele drasak (met meer afskortings) asook 'n "sleeve" vir die tablet om dit te beskerm teen krapskade. Okt 12: 'n Goedkoper opsie is aangewend deurdat die SB se rekenaar geruil is met 'n minder funksionele ampsdraer. Enige balans sal tydens aansuiweringsbegroting teruggegee word.
S/Notes:
Projected/Actual ETD Jul12 Aug12 Sep12 Oct12 Nov12 Dec12 Jan13 Feb13 Mar13 Apr13 May13 Jun13Bdgt Type YTDDec Budget YTD Var Var % Year Bal Bal %
9 0004 500 4 500 4 500 4 650CapitalProjected Cash Flow 18 150 -2 629 -14.5%11 779 130.9%
20 7792 916 17 863CapitalExpenditure to date
Integrated Development Planning
pj-10-0150 - MSIG: Changes and extensions to the Strategic Management System Municipal areaProject: Location:
Vote Nos: 11 42 520 0096 0
Grp No Activity Jul12 Aug12 Sep12 Oct12 Nov12 Dec12 Jan13 Feb13 Mar13 Apr13 May13 Jun13 Notes (Activity)Activity Type
1 1 Implementation N/A
Projected/Actual ETD Jul12 Aug12 Sep12 Oct12 Nov12 Dec12 Jan13 Feb13 Mar13 Apr13 May13 Jun13Bdgt Type YTDDec Budget YTD Var Var % Year Bal Bal %
40 000 40 000OperatingProjected Cash Flow 80 000 7 000 8.8%73 000 ??%
73 00053 500 19 500OperatingExpenditure to date
pj-10-0151 - MSIG: Contract appointment of an IDP Practitioner in the Office of the Municipal Manager Municipal areaProject: Location:
Vote Nos: 11 42 520 0198 9
Grp No Activity Jul12 Aug12 Sep12 Oct12 Nov12 Dec12 Jan13 Feb13 Mar13 Apr13 May13 Jun13 Notes (Activity)Activity Type
1 1 Monthly remuneration N/A
Projected/Actual ETD Jul12 Aug12 Sep12 Oct12 Nov12 Dec12 Jan13 Feb13 Mar13 Apr13 May13 Jun13Bdgt Type YTDDec Budget YTD Var Var % Year Bal Bal %
90 10012 900 12 900 12 900 12 900 25 600 12 900 12 900 12 900 12 900 12 900 12 900 12 900OperatingProjected Cash Flow 167 500 109 394 65.3%-31 994 -35.5%
58 10611 994 13 547 19 117 842 6 763 5 845OperatingExpenditure to date
16 January 2013 2012/3 - [SDBIP] PROJECT SCHEDULES 33

pj-11-0109 - MSIG: Development of a new 5 year macro strategy for the Municipality Municipal areaProject: Location:
Vote Nos: 11 42 520 0155 5
Grp No Activity Jul12 Aug12 Sep12 Oct12 Nov12 Dec12 Jan13 Feb13 Mar13 Apr13 May13 Jun13 Notes (Activity)Activity Type
1 1 Implementation and review N/A
Projected/Actual ETD Jul12 Aug12 Sep12 Oct12 Nov12 Dec12 Jan13 Feb13 Mar13 Apr13 May13 Jun13Bdgt Type YTDDec Budget YTD Var Var % Year Bal Bal %
15 000 15 000 20 000OperatingProjected Cash Flow 50 000 39 206 78.4%10 794 ??%
10 7941 194 9 600OperatingExpenditure to date
16 January 2013 2012/3 - [SDBIP] PROJECT SCHEDULES 34

Civil Engineering Services
Notes: aaa
Civil Engineering Services General
pj-09-0021ac - Equipment Civil Services Municipal areaProject: Location:
Vote Nos: 52 80 567 0013 0
Grp No Activity Jul12 Aug12 Sep12 Oct12 Nov12 Dec12 Jan13 Feb13 Mar13 Apr13 May13 Jun13 Notes (Activity)Activity Type
1 1 Equipment - purchasing N/A
Projected/Actual ETD Jul12 Aug12 Sep12 Oct12 Nov12 Dec12 Jan13 Feb13 Mar13 Apr13 May13 Jun13Bdgt Type YTDDec Budget YTD Var Var % Year Bal Bal %
80 00040 000 40 000 20 000 40 000 20 000 13 030CapitalProjected Cash Flow 173 030 59 641 34.5%33 389 41.7%
113 38912 756 11 646 81 141 7 845CapitalExpenditure to date
Buildings and Maintenance
pj-11-0088 - Vehicles Building Maintenance: Replace CK20381 (Bakkie) Municipal areaProject: Location:
Vote Nos: 10 80 588 0014 0
Grp No Activity Jul12 Aug12 Sep12 Oct12 Nov12 Dec12 Jan13 Feb13 Mar13 Apr13 May13 Jun13 Notes (Activity)Activity Type
1 1 Procurement process AgehandelN/A
1 2 Delivery/collection N/A
Aug 2012: TTK goedeuring vir aankoop op 02 Aug 2012. Aankoopprys R167 960.05. Besparing van R12 039.95 verwys na aansuiweringsbegroting om LAV vir lynverwer aan te koop. Voertuig ontvang. Nuwe registrasienommer CK23064. CK20381 geneem na skut vir veiling.
S/Notes:
Projected/Actual ETD Jul12 Aug12 Sep12 Oct12 Nov12 Dec12 Jan13 Feb13 Mar13 Apr13 May13 Jun13Bdgt Type YTDDec Budget YTD Var Var % Year Bal Bal %
180 000180 000CapitalProjected Cash Flow 180 000 18 619 10.3%-18 619 -10.3%
161 381161 381CapitalExpenditure to date
pj-12-0016 - Equipment Building and Maintenance Municipal areaProject: Location:
Vote Nos: 10 80 567 0015 0
Grp No Activity Jul12 Aug12 Sep12 Oct12 Nov12 Dec12 Jan13 Feb13 Mar13 Apr13 May13 Jun13 Notes (Activity)Activity Type
1 1 Equipment - purchasing N/A
Projected/Actual ETD Jul12 Aug12 Sep12 Oct12 Nov12 Dec12 Jan13 Feb13 Mar13 Apr13 May13 Jun13Bdgt Type YTDDec Budget YTD Var Var % Year Bal Bal %
48 00048 000CapitalProjected Cash Flow 48 000 16 719 34.8%-16 719 -34.8%
31 2812 290 17 329 5 439 6 223CapitalExpenditure to date
16 January 2013 2012/3 - [SDBIP] PROJECT SCHEDULES 35

Cemeteries
pj-09-0066 - Cemeteries: Fencing Malmesbury (Old town) MalmesburyProject: Location:
Vote Nos: 34 80 021 0016 0
Grp No Activity Jul12 Aug12 Sep12 Oct12 Nov12 Dec12 Jan13 Feb13 Mar13 Apr13 May13 Jun13 Notes (Activity)Activity Type
1 1 Tender process N/A
1 2 Construction N/A
Aug 2012: Tenders word geadverteer 14 Sept 2012. Sluit op 5 Okt 2012.Okt 2012: Tenderprys is R159 735.30. Onderbegroting van R1 235.30 word reggestel met besparing van ander twee tenders vir die aanbring van omheinings wat R92 219.19 beloop. Dien voor BEK van 25 Oktober 20Nov 2012: Konstruksie begin 23 Nov 2012.
S/Notes:
Projected/Actual ETD Jul12 Aug12 Sep12 Oct12 Nov12 Dec12 Jan13 Feb13 Mar13 Apr13 May13 Jun13Bdgt Type YTDDec Budget YTD Var Var % Year Bal Bal %
70 00050 000 20 000 50 000 38 500CapitalProjected Cash Flow 158 500 158 500 100.0%-70 000 -100.0%
pj-10-0045 - Cemeteries: Grave box for collapsing graves Municipal areaProject: Location:
Vote Nos: 34 80 819 0017 0
Grp No Activity Jul12 Aug12 Sep12 Oct12 Nov12 Dec12 Jan13 Feb13 Mar13 Apr13 May13 Jun13 Notes (Activity)Activity Type
1 1 Equipment - purchasing N/A
Okt 2012: Besig met ontwerp en kwotasies.Nov 2012: Besig met ontwerp en kwotasies.
S/Notes:
Projected/Actual ETD Jul12 Aug12 Sep12 Oct12 Nov12 Dec12 Jan13 Feb13 Mar13 Apr13 May13 Jun13Bdgt Type YTDDec Budget YTD Var Var % Year Bal Bal %
120 00060 000 60 000CapitalProjected Cash Flow 120 000 120 000 100.0%-120 000 -100.0%
pj-12-0017 - Cemeteries: Fencing Kalbaskraal KalbaskraalProject: Location:
Vote Nos: 34 80 021 0018 0
Grp No Activity Jul12 Aug12 Sep12 Oct12 Nov12 Dec12 Jan13 Feb13 Mar13 Apr13 May13 Jun13 Notes (Activity)Activity Type
1 1 Tender process N/A
1 2 Construction N/A
Aug 2012: Tenders word aangevra op 14 Sept 2012.Sep 12: Tender sluit 5 Okt 2012Okt 12: Tenderprys R 125 183.22. Besparing van R54 816.78 word na die aansuiweringsbegroting verwys. Dien voor BEK op 25 Okt 2012.Nov 2012: Konstruksie begin 23 Nov 2012.
S/Notes:
Projected/Actual ETD Jul12 Aug12 Sep12 Oct12 Nov12 Dec12 Jan13 Feb13 Mar13 Apr13 May13 Jun13Bdgt Type YTDDec Budget YTD Var Var % Year Bal Bal %
80 00050 000 30 000 50 000 50 000CapitalProjected Cash Flow 180 000 179 630 99.8%-79 630 -99.5%
370370CapitalExpenditure to date
16 January 2013 2012/3 - [SDBIP] PROJECT SCHEDULES 36

Parks and Amenities
pj-09-0211 - Vehicles Parks: Replace CK22740 (Tracktor) MalmesburyProject: Location:
Vote Nos: 52 80 588 0020 0
Grp No Activity Jul12 Aug12 Sep12 Oct12 Nov12 Dec12 Jan13 Feb13 Mar13 Apr13 May13 Jun13 Notes (Activity)Activity Type
1 1 Procurement process AfgehandelN/A
1 2 Delivery/collection N/A
Aug 2012: TTK goekeuring op 02 Aug 2012. Aankoop prys van R234 800.00. Besparing van R115 200.00 verwys na aansuiweringsbegroting. R39 800.26 daarvan aangewend vir aankoop van LAV vir lynverwer. Wag aflewering.Okt 2012: Trekker is ontvang maar teruggestuur agv foute met kajuit.Nov 2012: Kajuit is herstel, nuwe trekkier in diens, CK 22740 na veiling.
S/Notes:
Projected/Actual ETD Jul12 Aug12 Sep12 Oct12 Nov12 Dec12 Jan13 Feb13 Mar13 Apr13 May13 Jun13Bdgt Type YTDDec Budget YTD Var Var % Year Bal Bal %
350 000350 000CapitalProjected Cash Flow 350 000 115 200 32.9%-115 200 -32.9%
234 800234 800CapitalExpenditure to date
pj-11-0058 - Equipment Parks: Global amount Municipal areaProject: Location:
Vote Nos: 52 80 567 0021 0
Grp No Activity Jul12 Aug12 Sep12 Oct12 Nov12 Dec12 Jan13 Feb13 Mar13 Apr13 May13 Jun13 Notes (Activity)Activity Type
1 1 Equipment - purchasing N/A
Projected/Actual ETD Jul12 Aug12 Sep12 Oct12 Nov12 Dec12 Jan13 Feb13 Mar13 Apr13 May13 Jun13Bdgt Type YTDDec Budget YTD Var Var % Year Bal Bal %
100 00050 000 50 000 50 000 100 000 100 000 120 000CapitalProjected Cash Flow 470 000 144 077 30.7%225 923 225.9%
325 923170 341 110 492 19 742 25 348CapitalExpenditure to date
pj-12-0021 - Vehicles Parks: Replace CK15244 (Bakkie) Municipal areaProject: Location:
Vote Nos: 52 80 588 0019 0
Grp No Activity Jul12 Aug12 Sep12 Oct12 Nov12 Dec12 Jan13 Feb13 Mar13 Apr13 May13 Jun13 Notes (Activity)Activity Type
1 1 Procurement process AfgehandelN/A
1 2 Delivery/collection N/A
Aug 2012: TTK goedkeuring 02 Aug 2012: Aankoopprys van R167 960.05. Besparing van R12 039.95 verwys na aansuiweringsbegroting om LAV vir lynverwer aan te koop. Wag vir aflewering.Okt 2012: Nuwe voertuig ontvang, CK 15244 na skut vir veiling.
S/Notes:
Projected/Actual ETD Jul12 Aug12 Sep12 Oct12 Nov12 Dec12 Jan13 Feb13 Mar13 Apr13 May13 Jun13Bdgt Type YTDDec Budget YTD Var Var % Year Bal Bal %
260 000260 000CapitalProjected Cash Flow 260 000 98 619 37.9%-98 619 -37.9%
161 381161 381CapitalExpenditure to date
16 January 2013 2012/3 - [SDBIP] PROJECT SCHEDULES 37

Roads
pj-10-0078 - Roads: Main Road 25 MalmesburyProject: Location:
Vote Nos: 70 20 084 0046 0 [Kelder Pad 80/20]
Grp No Activity Jul12 Aug12 Sep12 Oct12 Nov12 Dec12 Jan13 Feb13 Mar13 Apr13 May13 Jun13 Notes (Activity)Activity Type
1 1 Contribution to PGWC AfgehandelN/A
Aug 2012: Afgehandel. Betaling van R1 7000 000 (BTW uitgesluit) aangevra op 18 Julie 2012.S/Notes:
Projected/Actual ETD Jul12 Aug12 Sep12 Oct12 Nov12 Dec12 Jan13 Feb13 Mar13 Apr13 May13 Jun13Bdgt Type YTDDec Budget YTD Var Var % Year Bal Bal %
1 700 000CapitalProjected Cash Flow 1 700 000 -238 000 -14.0%1 938 000 ??%
1 938 0001 938 000CapitalExpenditure to date
pj-10-0121 - Vehicles Roads: Replace CK30032 (Truck) Municipal areaProject: Location:
Vote Nos: 70 80 588 0023 0
Grp No Activity Jul12 Aug12 Sep12 Oct12 Nov12 Dec12 Jan13 Feb13 Mar13 Apr13 May13 Jun13 Notes (Activity)Activity Type
1 1 Procurement process AfgehandelN/A
1 2 Delivery/collection N/A
Aug 2012: TTK goedkeuring op 02 Aug 2012. Aankoopprys van R500 485.26. Besparing van R99 514.74 verwys na aansuiweringsbegroting om onderbegrotings te finansier. Wag vir aflewering.Okt 2012: Ontvang, CK 30032 na skut vir veiling.
S/Notes:
Projected/Actual ETD Jul12 Aug12 Sep12 Oct12 Nov12 Dec12 Jan13 Feb13 Mar13 Apr13 May13 Jun13Bdgt Type YTDDec Budget YTD Var Var % Year Bal Bal %
600 000CapitalProjected Cash Flow 600 000 99 515 16.6%500 485 ??%
500 485500 485CapitalExpenditure to date
pj-10-0132 - Vehicles Roads: Replace CK15665 (Water truck) Municipal areaProject: Location:
Vote Nos: 70 80 588 0022 0
Grp No Activity Jul12 Aug12 Sep12 Oct12 Nov12 Dec12 Jan13 Feb13 Mar13 Apr13 May13 Jun13 Notes (Activity)Activity Type
1 1 Procurement process AfgehandelN/A
1 2 Delivery/collection N/A
Aug 2012: TTK van 28 Aug 2012 goedgekeur. Aankoopprys van R1 090 271.05. Besparing van R9728.95 na aansuiweringsbegroting verwys. Wag vir aflewering.Okt 2012: Wag vir aflewering.Nov 2012: Afgelewer op 07 Nov 2012, CK 15665 na veiling.
S/Notes:
Projected/Actual ETD Jul12 Aug12 Sep12 Oct12 Nov12 Dec12 Jan13 Feb13 Mar13 Apr13 May13 Jun13Bdgt Type YTDDec Budget YTD Var Var % Year Bal Bal %
1 100 000CapitalProjected Cash Flow 1 100 000 7 027 0.6%1 092 973 ??%
1 092 9731 090 271 2 702CapitalExpenditure to date
16 January 2013 2012/3 - [SDBIP] PROJECT SCHEDULES 38

pj-11-0032 - Roads Swartland: Upgrading Municipal areaProject: Location:
Vote Nos: 70 20 084 0043 0 [Abbotsdale 4]; 70 20 084 0041 0 [Abbotsdale 1]; 70 20 084 0039 0 [Kalbaskraal: Gousblom]; 70 20 084 0038 0 [Kalbaskraal: Leeubekkie]; 70 20 084 0037 0 [Kalbaskraal: Essenhout]; 70 20 0840036 0 [Kalbaskraal: Bloekom]; 70 20 084 0035 0 [Kalbaskraal: Dennehout Link]; 70 20 084 0034 0 [Kalbaskraal: Dennehout]; 70 20 084 0030 0 [Riebeek Kasteel: Watsonia]; 70 20 084 0029 0 [Riebeek Kasteel: Daisie]; 70 20 084 0028 0 [Riebeek Kasteel: Petunia]; 70 20 084 0027 0 [Darling: Eikeboom]; 70 20 084 0025 0 [Darling: Kareeboom]; 70 20 084 0024 0 [Global]
Grp No Activity Jul12 Aug12 Sep12 Oct12 Nov12 Dec12 Jan13 Feb13 Mar13 Apr13 May13 Jun13 Notes (Activity)Activity Type
1 1 Construction AfgehandelN/A
Aug 2012: Kosntruksie 53%. Spandering 42%Okt 2012: Konstruksie 80%. Sandering 70%Nov 2012: Konstruksie 90%. Spandering 80%Des 2012: Projek voltooi.
S/Notes:
Projected/Actual ETD Jul12 Aug12 Sep12 Oct12 Nov12 Dec12 Jan13 Feb13 Mar13 Apr13 May13 Jun13Bdgt Type YTDDec Budget YTD Var Var % Year Bal Bal %
7 666 0001 200 000 1 300 000 1 400 000 1 500 000 1 500 000 766 000 800 000CapitalProjected Cash Flow 8 466 000 3 240 0.0%796 760 10.4%
8 462 760368 826 1 997 280 1 791 547 1 643 683 1 717 615 943 809CapitalExpenditure to date
pj-11-0060 - Equipment Streets and Storm Water: Global amount Municipal areaProject: Location:
Vote Nos: 70 80 567 0070 0
Grp No Activity Jul12 Aug12 Sep12 Oct12 Nov12 Dec12 Jan13 Feb13 Mar13 Apr13 May13 Jun13 Notes (Activity)Activity Type
1 1 Equipment - purchasing N/A
Projected/Actual ETD Jul12 Aug12 Sep12 Oct12 Nov12 Dec12 Jan13 Feb13 Mar13 Apr13 May13 Jun13Bdgt Type YTDDec Budget YTD Var Var % Year Bal Bal %
96 11320 000 20 000 20 000 20 000 16 113CapitalProjected Cash Flow 96 113 4 898 5.1%-4 898 -5.1%
91 2152 035 75 431 13 749CapitalExpenditure to date
Sewerage
pj-09-0001 - Sewerage: WWTW Malmesbury MalmesburyProject: Location:
Vote Nos: 64 20 126 0053 0 [CRRF]; 64 20 126 0052 0 [MIG]; 64 20 126 0051 0 [External Loan]
Grp No Activity Jul12 Aug12 Sep12 Oct12 Nov12 Dec12 Jan13 Feb13 Mar13 Apr13 May13 Jun13 Notes (Activity)Activity Type
1 1 Construction N/A
Nov 2012: Tans besig met terreinwerke en meganiese en elektriese installasie. Alle strukture is volooi. Finale voltooiing teen einde Maart 2013.S/Notes:
Projected/Actual ETD Jul12 Aug12 Sep12 Oct12 Nov12 Dec12 Jan13 Feb13 Mar13 Apr13 May13 Jun13Bdgt Type YTDDec Budget YTD Var Var % Year Bal Bal %
22 500 0003 700 000 3 700 000 3 700 000 3 700 000 4 000 000 3 700 000 2 000 000 1 306 970CapitalProjected Cash Flow 25 806 970 15 613 385 60.5%-12 306 415 -54.7%
10 193 585237 961 1 727 840 4 700 3 078 074 1 419 204 3 725 806CapitalExpenditure to date
pj-09-0003 - Telemetry: New installations Municipal areaProject: Location:
Vote Nos: 64 80 126 0058 0
Grp No Activity Jul12 Aug12 Sep12 Oct12 Nov12 Dec12 Jan13 Feb13 Mar13 Apr13 May13 Jun13 Notes (Activity)Activity Type
1 1 Equipment - purchasing and i N/A
Nov 2012: Nuwe telemetrie toerusting aangekoop vir Kalbaskraal.S/Notes:
Projected/Actual ETD Jul12 Aug12 Sep12 Oct12 Nov12 Dec12 Jan13 Feb13 Mar13 Apr13 May13 Jun13Bdgt Type YTDDec Budget YTD Var Var % Year Bal Bal %
30 00010 000 10 000 10 000 10 000 10 000 15 000CapitalProjected Cash Flow 65 000 20 587 31.7%14 413 48.0%
44 41344 413CapitalExpenditure to date
16 January 2013 2012/3 - [SDBIP] PROJECT SCHEDULES 39

pj-10-0043 - Sewerage: WWTW Koringberg KoringbergProject: Location:
Vote Nos: 64 20 126 0055 0
Grp No Activity Jul12 Aug12 Sep12 Oct12 Nov12 Dec12 Jan13 Feb13 Mar13 Apr13 May13 Jun13 Notes (Activity)Activity Type
1 1 Environmental process N/A
1 2 Design and tender documenta N/A
1 3 Tender process N/A
1 4 Construction N/A
Aug 2012: Waterwese versoek alternatiewe ontwerp (stort in stroompie). Ingenieurs besig met verslag en ontwerp.Sep 12: Vergadering met Omgewingsake en DWA gehou op 5 Sep 2012. DS besig met voorbereiding. Finale besluit sal by aansuiweringsbegroting geneem word.Okt 2012: Ingenieurs besig met verandering van die voorlopige ontwerp aangesien DWA steeds nie tevrede is nie.Nov 2012: Besig om verslag te wysig om die veranderinge by te werk soos deur DWA versoek.
S/Notes:
Projected/Actual ETD Jul12 Aug12 Sep12 Oct12 Nov12 Dec12 Jan13 Feb13 Mar13 Apr13 May13 Jun13Bdgt Type YTDDec Budget YTD Var Var % Year Bal Bal %
300 000300 000 200 000 500 000 1 000 000 1 000 000CapitalProjected Cash Flow 3 000 000 3 000 000 100.0%-300 000 -100.0%
pj-10-0044 - Sewerage: Darling sewerage works (planning and design) DarlingProject: Location:
Vote Nos: 64 20 126 0056 0
Grp No Activity Jul12 Aug12 Sep12 Oct12 Nov12 Dec12 Jan13 Feb13 Mar13 Apr13 May13 Jun13 Notes (Activity)Activity Type
1 1 Preliminary design N/A
1 2 Environmental authorisation N/A
Aug 2012: Raadgewende ingenieurs aangestel, besig met proses en invloei ontleding.Nov 2012: Besig met invloeiontleding.
S/Notes:
Projected/Actual ETD Jul12 Aug12 Sep12 Oct12 Nov12 Dec12 Jan13 Feb13 Mar13 Apr13 May13 Jun13Bdgt Type YTDDec Budget YTD Var Var % Year Bal Bal %
200 000200 000 300 000CapitalProjected Cash Flow 500 000 435 939 87.2%-135 939 -68.0%
64 06164 061CapitalExpenditure to date
pj-10-0114 - Equipment Sewerage Municipal areaProject: Location:
Vote Nos: 64 80 126 0059 0
Grp No Activity Jul12 Aug12 Sep12 Oct12 Nov12 Dec12 Jan13 Feb13 Mar13 Apr13 May13 Jun13 Notes (Activity)Activity Type
1 1 Equipment - purchasing N/A
Projected/Actual ETD Jul12 Aug12 Sep12 Oct12 Nov12 Dec12 Jan13 Feb13 Mar13 Apr13 May13 Jun13Bdgt Type YTDDec Budget YTD Var Var % Year Bal Bal %
47 00047 000CapitalProjected Cash Flow 47 000 34 243 72.9%-34 243 -72.9%
12 757375 394 11 291 697CapitalExpenditure to date
16 January 2013 2012/3 - [SDBIP] PROJECT SCHEDULES 40

pj-10-0157 - Sewerage: Upgrading of WWTW - Riebeek Kasteel and Riebeek West Various locationsProject: Location:
Vote Nos: 64 20 126 0054 0
Grp No Activity Jul12 Aug12 Sep12 Oct12 Nov12 Dec12 Jan13 Feb13 Mar13 Apr13 May13 Jun13 Notes (Activity)Activity Type
1 1 Environmental authorisation N/A
1 2 Detail design and tender docu N/A
1 3 Tender process N/A
1 4 Construction N/A
Aug 12: Versoek van Omgewingsake vir addisionele inligting. Ingenieurs besig met opdatering van verslag wat teen 07 Sept 2012 vir 21 dae kommentaar geadverteer sal word.Sep 12: Vergadering gehou op 5 Sep 2012 met DWA en Omgewingsake om kommentare op verslag te akkommodeer. Finale besluit oor fondse sal by aansuiweringsbegroting geneem word.Okt 12: Besig om verslag en ontwerp te wysig in reaksie op die kommentare van verskeie departemente. Vorderingskedule is gewysig en sal met aansuiweringsbegroting reggestel word. Finale besluit sal by aansuiweringsbegroting geneem word.Nov 2012: Omgewingsverslag is gewysig en ingedien, nou beskikbaar vir 21 dae finale kommentaar. Omgewingsgoedkeuring word verwag teen einde Maart 2012.
S/Notes:
Projected/Actual ETD Jul12 Aug12 Sep12 Oct12 Nov12 Dec12 Jan13 Feb13 Mar13 Apr13 May13 Jun13Bdgt Type YTDDec Budget YTD Var Var % Year Bal Bal %
1 000 000 2 000 000 2 000 000 3 000 000CapitalProjected Cash Flow 8 000 000 8 000 000 100.0%0%
pj-11-0027 - Sewerage: Flow meters for Chatsworth/Riverlands pump stations ChatsworthProject: Location:
Vote Nos: 64 80 126 0060 0; 64 20 126 0057 0
Grp No Activity Jul12 Aug12 Sep12 Oct12 Nov12 Dec12 Jan13 Feb13 Mar13 Apr13 May13 Jun13 Notes (Activity)Activity Type
1 1 Equipment - purchasing and i N/A
Projected/Actual ETD Jul12 Aug12 Sep12 Oct12 Nov12 Dec12 Jan13 Feb13 Mar13 Apr13 May13 Jun13Bdgt Type YTDDec Budget YTD Var Var % Year Bal Bal %
100 000 100 000CapitalProjected Cash Flow 200 000 200 000 100.0%0%
pj-11-0087 - Vehicles Sewerage: Replace CK33244 (Bakkie) Municipal areaProject: Location:
Vote Nos: 64 80 588 0048 0
Grp No Activity Jul12 Aug12 Sep12 Oct12 Nov12 Dec12 Jan13 Feb13 Mar13 Apr13 May13 Jun13 Notes (Activity)Activity Type
1 1 Procurement process AfgehandelN/A
1 2 Delivery/collection N/A
Aug 2012: TTK goedkeuring op 02 Aug 2012: Aakoopprys R167 960.05. Besparing van R12 039.95 verwys na aansuiweringbegroting om LAV vir lynverwer aan te koop. Voertuig ontvang. Nuwe registrasienommer CK18173. CK33244 na skut geneem vir veiling.
S/Notes:
Projected/Actual ETD Jul12 Aug12 Sep12 Oct12 Nov12 Dec12 Jan13 Feb13 Mar13 Apr13 May13 Jun13Bdgt Type YTDDec Budget YTD Var Var % Year Bal Bal %
180 000180 000CapitalProjected Cash Flow 180 000 18 619 10.3%-18 619 -10.3%
161 381161 381CapitalExpenditure to date
16 January 2013 2012/3 - [SDBIP] PROJECT SCHEDULES 41

pj-11-0095 - Sewerage: Chatsworth sewerage works (design work and determination of standards) ChatsworthProject: Location:
Vote Nos: 64 20 126 0057 0
Grp No Activity Jul12 Aug12 Sep12 Oct12 Nov12 Dec12 Jan13 Feb13 Mar13 Apr13 May13 Jun13 Notes (Activity)Activity Type
1 1 Environmental authorisation N/A
1 2 Detail design and tender docu N/A
Aug 2012: Kommentare ontvang op scoping report. Bykomentde inligting word verlang. Sodra bykomende inligting bygewerk is sal vir finale 21 dae kommentaar geadverteer word.Sep 12: Bykomende inligting bygewerk. Aansoek is gedoen by DWA vir waterlisensie aangesien storting in Swartrivier plaasvind.Okt 2012: Scoping report ingedien op 09 Oktober 2012.Nov 2012: Wag vir die kommentare van die onderskeie Departemente.
S/Notes:
Projected/Actual ETD Jul12 Aug12 Sep12 Oct12 Nov12 Dec12 Jan13 Feb13 Mar13 Apr13 May13 Jun13Bdgt Type YTDDec Budget YTD Var Var % Year Bal Bal %
200 000CapitalProjected Cash Flow 200 000 200 000 100.0%0%
pj-12-0014 - Vehicles Sewerage: Replace CK19529 (Bakkie) Municipal areaProject: Location:
Vote Nos: 64 80 588 0049 0
Grp No Activity Jul12 Aug12 Sep12 Oct12 Nov12 Dec12 Jan13 Feb13 Mar13 Apr13 May13 Jun13 Notes (Activity)Activity Type
1 1 Procurement process AfgehandelN/A
1 2 Delivery/collection N/A
Aug 2012: TTK goedkeuring op 02 Aug 2012. Aankoopprys R167 960.05. Besparing van R12 039.95 verwys na aansuiweringsbergroting om LAV vir lynverwer aan te koop. Voertuig ontvang. Nuwe Reg Nr CK11942. CK19529 na skut geneem vir veiling.
S/Notes:
Projected/Actual ETD Jul12 Aug12 Sep12 Oct12 Nov12 Dec12 Jan13 Feb13 Mar13 Apr13 May13 Jun13Bdgt Type YTDDec Budget YTD Var Var % Year Bal Bal %
180 000180 000CapitalProjected Cash Flow 180 000 18 619 10.3%-18 619 -10.3%
161 381161 381CapitalExpenditure to date
pj-12-0015 - Sewerage: Switching of pumps - Swartland Municipal areaProject: Location:
Vote Nos: 64 80 126 0062 0
Grp No Activity Jul12 Aug12 Sep12 Oct12 Nov12 Dec12 Jan13 Feb13 Mar13 Apr13 May13 Jun13 Notes (Activity)Activity Type
1 1 Equipment - purchasing and i N/A
Nov 2012: Raadgewende Ingenieur aangestel, besig met ondersoek.S/Notes:
Projected/Actual ETD Jul12 Aug12 Sep12 Oct12 Nov12 Dec12 Jan13 Feb13 Mar13 Apr13 May13 Jun13Bdgt Type YTDDec Budget YTD Var Var % Year Bal Bal %
50 000 50 000CapitalProjected Cash Flow 100 000 97 450 97.5%2 550 ??%
2 5502 550CapitalExpenditure to date
16 January 2013 2012/3 - [SDBIP] PROJECT SCHEDULES 42

Sports Fields
pj-11-0122 - Sport: Kalbaskraal Sports grounds (irregation system, supply network and new borehole pump) KalbaskraalProject: Location:
Vote Nos: 52 80 315 0066 0
Grp No Activity Jul12 Aug12 Sep12 Oct12 Nov12 Dec12 Jan13 Feb13 Mar13 Apr13 May13 Jun13 Notes (Activity)Activity Type
1 1 Design and tender documenta N/A
1 2 Tender process N/A
1 3 Construction N/A
Aug 2012: TEK aanbeveling 16 Aug 2012. Totale projekkoste R513 830.00. Tekort van R30 000 na aansuiweringsbegroting verwys. TTK is gehou op 28 Aug 2012. Terrein oorhandig aan kontrakteur. Beplande voltooingsdatum 26 Nov 2012.Nov 2012: Besig met konstruskie, 90% voltooi.Des 2012: Besig met konstruksie, projek 95% voltooi.
S/Notes:
Projected/Actual ETD Jul12 Aug12 Sep12 Oct12 Nov12 Dec12 Jan13 Feb13 Mar13 Apr13 May13 Jun13Bdgt Type YTDDec Budget YTD Var Var % Year Bal Bal %
250 00050 000 100 000 100 000 100 000 134 000CapitalProjected Cash Flow 484 000 109 713 22.7%124 287 49.7%
374 2873 300 370 987CapitalExpenditure to date
pj-11-0123 - Sport: Riebeek Wes Sports grounds Riebeek-WesProject: Location:
Vote Nos: 52 80 315 0067 0
Grp No Activity Jul12 Aug12 Sep12 Oct12 Nov12 Dec12 Jan13 Feb13 Mar13 Apr13 May13 Jun13 Notes (Activity)Activity Type
1 1 Information to follow (discussio N/A
Aug 12: Gesprekke moet in Sept 2012 gevoer word met die skenker asook die betrokke sportklub.Sep 12: Projek is gekoppel aan 'n behuisingsprojek. Gesprek het plaasgevind op 13 Sept 2012 by 'n Behuising Tegniese vergadering. Ontwikkeling is ook gekoppel aan 'n finansiële bydrae van PPC.Okt 2012: Item 5.13 van die Bestruurspanvergadering van 21 Okt 2012 verwys. MB in gesprek met PPC. PPC se finansiele jare is van Oktober tot September. Gaan fondse van R15 miljoen in volgende jaar voorsien. Gesprekke moet met Lotto en sportkodes gevoer word.
S/Notes:
Projected/Actual ETD Jul12 Aug12 Sep12 Oct12 Nov12 Dec12 Jan13 Feb13 Mar13 Apr13 May13 Jun13Bdgt Type YTDDec Budget YTD Var Var % Year Bal Bal %
855 000CapitalProjected Cash Flow 855 000 855 000 100.0%0%
pj-12-0018 - Sport: Fencing Dieprivier Sport Grounds MalmesburyProject: Location:
Vote Nos: 52 20 315 0063 0
Grp No Activity Jul12 Aug12 Sep12 Oct12 Nov12 Dec12 Jan13 Feb13 Mar13 Apr13 May13 Jun13 Notes (Activity)Activity Type
1 1 Tender process N/A
1 2 Construction N/A
Aug 2012: Tenders word op 14 September 2012 aangevra.Sep 12: Tender sluit 5 Okt 2012.Okt 2012: Tenderprys R129 518.58. Besparing van R37 402.41 varwys na aasuiweringsbegroting.Nov 2012: Konstruksie begin op 23 Nov 2012.
S/Notes:
Projected/Actual ETD Jul12 Aug12 Sep12 Oct12 Nov12 Dec12 Jan13 Feb13 Mar13 Apr13 May13 Jun13Bdgt Type YTDDec Budget YTD Var Var % Year Bal Bal %
90 00040 000 50 000 60 000 16 921CapitalProjected Cash Flow 166 921 166 921 100.0%-90 000 -100.0%
16 January 2013 2012/3 - [SDBIP] PROJECT SCHEDULES 43

pj-12-0019 - Sport: Ilinge Lethu Community Gym (concrete slab, 3 containersand a roof structure for the containers) Ilinge LethuProject: Location:
Vote Nos: 52 10 315 0065 0 [Other]; 52 10 315 0064 0 [CRRF]
Grp No Activity Jul12 Aug12 Sep12 Oct12 Nov12 Dec12 Jan13 Feb13 Mar13 Apr13 May13 Jun13 Notes (Activity)Activity Type
1 1 Design and tender documenta N/A
1 2 Tender process N/A
1 3 Construction N/A
Aug 12: Tenders reeds in pers aangevra en sluit 14 Sept 2012.Sep 12: Besig met tenderevaluering.Okt 12: Tenderprys van R641 157.66. Projek word afgeskaal om binne begroting te bly. Dien voor BEK van 12 November 2012.Nov 2012: Tender word op 4 Des 2012 toegeken vir 'n alles insluitende bedrag van R401 512.00 welke tekant op die begroting ten bedrae van R90 000 d.m.v. veriment vanaf pj. 10-0033 ten einde van die projek onsuksesvol af te handel.Des 2012: Konstruksie begin Jan 2013.
S/Notes:
Projected/Actual ETD Jul12 Aug12 Sep12 Oct12 Nov12 Dec12 Jan13 Feb13 Mar13 Apr13 May13 Jun13Bdgt Type YTDDec Budget YTD Var Var % Year Bal Bal %
150 000150 000 161 512CapitalProjected Cash Flow 311 512 311 512 100.0%-150 000 -100.0%
Storm Water
pj-09-0009 - Storm water: Upgrading of old networks (Swartland) Municipal areaProject: Location:
Vote Nos: 70 20 819 0068 0
Grp No Activity Jul12 Aug12 Sep12 Oct12 Nov12 Dec12 Jan13 Feb13 Mar13 Apr13 May13 Jun13 Notes (Activity)Activity Type
1 1 Construction N/A
Nov 2012: Konstruksievordering 80%Des 2012: Konstruksievordering 90%
S/Notes:
Projected/Actual ETD Jul12 Aug12 Sep12 Oct12 Nov12 Dec12 Jan13 Feb13 Mar13 Apr13 May13 Jun13Bdgt Type YTDDec Budget YTD Var Var % Year Bal Bal %
200 000100 000 100 000 200 000 200 000CapitalProjected Cash Flow 600 000 34 959 5.8%365 041 182.5%
565 041184 017 381 024CapitalExpenditure to date
pj-09-0074 - Storm water Riebeek-Wes Riebeek-WesProject: Location:
Vote Nos: 70 20 819 0069 0
Grp No Activity Jul12 Aug12 Sep12 Oct12 Nov12 Dec12 Jan13 Feb13 Mar13 Apr13 May13 Jun13 Notes (Activity)Activity Type
1 1 Construction AfgehandelN/A
Aug 2012: Konstruksievordering 50%Okt 2012: Konstruksie 100%Des 2012. Konstruksie voltooi, finale betaling moet nog gemaak word
S/Notes:
Projected/Actual ETD Jul12 Aug12 Sep12 Oct12 Nov12 Dec12 Jan13 Feb13 Mar13 Apr13 May13 Jun13Bdgt Type YTDDec Budget YTD Var Var % Year Bal Bal %
300 000CapitalProjected Cash Flow 300 000 0.0%300 000 ??%
300 00075 201 14 257 28 441 182 101CapitalExpenditure to date
16 January 2013 2012/3 - [SDBIP] PROJECT SCHEDULES 44

Water
pj-10-0038 - Water: Reservoir - Koringberg (0.25 Ml) KoringbergProject: Location:
Vote Nos: 76 20 210 0071 0
Grp No Activity Jul12 Aug12 Sep12 Oct12 Nov12 Dec12 Jan13 Feb13 Mar13 Apr13 May13 Jun13 Notes (Activity)Activity Type
1 1 Design and tender documenta N/A
Nov 2013: Raadgewende Ingenieurs aangestel, besig met ondersoek.S/Notes:
Projected/Actual ETD Jul12 Aug12 Sep12 Oct12 Nov12 Dec12 Jan13 Feb13 Mar13 Apr13 May13 Jun13Bdgt Type YTDDec Budget YTD Var Var % Year Bal Bal %
100 000CapitalProjected Cash Flow 100 000 36 425 36.4%63 575 ??%
63 57510 398 24 905 28 272CapitalExpenditure to date
pj-10-0041 - Water: Panorama pump station PanoramaProject: Location:
Vote Nos: 76 20 189 0072 0
Grp No Activity Jul12 Aug12 Sep12 Oct12 Nov12 Dec12 Jan13 Feb13 Mar13 Apr13 May13 Jun13 Notes (Activity)Activity Type
1 1 Equipment - purchasing and i N/A
Des 2012: Raadgwende Ingenieurs aangestel. Besig met ontwerp en tenderdokumentasie.S/Notes:
Projected/Actual ETD Jul12 Aug12 Sep12 Oct12 Nov12 Dec12 Jan13 Feb13 Mar13 Apr13 May13 Jun13Bdgt Type YTDDec Budget YTD Var Var % Year Bal Bal %
100 000 100 000 100 000 150 000CapitalProjected Cash Flow 450 000 450 000 100.0%0%
pj-11-0021 - Water reservoir - Riebeek West (1.0 ML) Riebeek-WesProject: Location:
Vote Nos: 76 20 210 0073 0
Grp No Activity Jul12 Aug12 Sep12 Oct12 Nov12 Dec12 Jan13 Feb13 Mar13 Apr13 May13 Jun13 Notes (Activity)Activity Type
1 1 Detail design and tender docu N/A
1 2 Tender process N/A
1 3 Construction N/A
Aug 12: Tenders gesluit op 15 Aug 2012. Besig met evaluering. Tender hoër as begrote bedrag (±R1m) as gevolg van ontwerp (omgewingsvoorwaardes stipuleer hoogtebeperking). Verwys na aansuiweringsbegrotingaddisionele geld gefinansier uit besparings op ander projekte.Sep 12: Herskedulering van projek moet oorweeg word sodra tenderevalueringsresultate bekend is.Okt 2012: Reservoir sou op erf 705 gebou word maar dit sou omgewingsgoedkeuring vereis. Verdere oorweging is gegee en besluit om nuwe reservior op die terrein van die bestaande reservoirs te bou (erf 555). Projekkoste van R3 537 510.34 word finansier deur R1 500 000 (huidige begroting, R1 188 1900 (besparings 2012/2013), en R850 000 (2013/2014 begroting).Nov 2012: Tender toegeken op 12 Nov 2012. Projek word afgehandel hierdie finasiele jaar. Begroting word reggestel met aansuiweringsbegroting.Des 2012: Kosntruksie het begin.
S/Notes:
Projected/Actual ETD Jul12 Aug12 Sep12 Oct12 Nov12 Dec12 Jan13 Feb13 Mar13 Apr13 May13 Jun13Bdgt Type YTDDec Budget YTD Var Var % Year Bal Bal %
700 000100 000 300 000 300 000 400 000 300 000 100 000CapitalProjected Cash Flow 1 500 000 1 059 840 70.7%-259 840 -37.1%
440 16086 780 353 379CapitalExpenditure to date
pj-11-0062 - Equipment Water: Global amount Municipal areaProject: Location:
Vote Nos: 70 80 567 0078 0
Grp No Activity Jul12 Aug12 Sep12 Oct12 Nov12 Dec12 Jan13 Feb13 Mar13 Apr13 May13 Jun13 Notes (Activity)Activity Type
1 1 Equipment - purchasing N/A
Projected/Actual ETD Jul12 Aug12 Sep12 Oct12 Nov12 Dec12 Jan13 Feb13 Mar13 Apr13 May13 Jun13Bdgt Type YTDDec Budget YTD Var Var % Year Bal Bal %
163 00040 000 40 000 40 000 43 000CapitalProjected Cash Flow 163 000 96 486 59.2%-96 486 -59.2%
66 51429 089 37 425 9 950CapitalExpenditure to date
16 January 2013 2012/3 - [SDBIP] PROJECT SCHEDULES 45

pj-12-0013 - Water: Upgrading/Replacement water reticulation network Municipal areaProject: Location:
Vote Nos: 76 20 189 0076 0
Grp No Activity Jul12 Aug12 Sep12 Oct12 Nov12 Dec12 Jan13 Feb13 Mar13 Apr13 May13 Jun13 Notes (Activity)Activity Type
1 1 Detail design and tender docu N/A
1 2 Tender process N/A
1 3 Construction N/A
Aug 12: Besig met ontwerp en tenderdokumentasie.Sep 12: Tenders word op 12 Okt in pers aangevra.Okt 12: Tenders sluit op 26 Okt 2012.Nov 2012: Besig met tenderevaluering. DS onderneem dat die R2 000 000 wel teen 30 Jun 2013 gespandeer sal word.Des 2012: Aanstelling kon nie gemaak word met die tenders wat ontvang was nie. Tenders word weer in Januarie 2013 aangevra.
S/Notes:
Projected/Actual ETD Jul12 Aug12 Sep12 Oct12 Nov12 Dec12 Jan13 Feb13 Mar13 Apr13 May13 Jun13Bdgt Type YTDDec Budget YTD Var Var % Year Bal Bal %
400 000200 000 200 000 300 000 300 000 300 000 300 000 300 000 100 000CapitalProjected Cash Flow 2 000 000 1 595 899 79.8%4 101 1.0%
404 1019 372 157 969 109 261 127 500CapitalExpenditure to date
pj-12-0022 - Water: Secondary Chlorination Municipal areaProject: Location:
Vote Nos: 76 20 189 0074 0
Grp No Activity Jul12 Aug12 Sep12 Oct12 Nov12 Dec12 Jan13 Feb13 Mar13 Apr13 May13 Jun13 Notes (Activity)Activity Type
1 1 Equipment - purchasing and i N/A
Projected/Actual ETD Jul12 Aug12 Sep12 Oct12 Nov12 Dec12 Jan13 Feb13 Mar13 Apr13 May13 Jun13Bdgt Type YTDDec Budget YTD Var Var % Year Bal Bal %
100 000CapitalProjected Cash Flow 100 000 100 000 100.0%0%
pj-12-0023 - Water: Chatsworth new reservoir ChatsworthProject: Location:
Vote Nos: 76 20 210 0075 0
Grp No Activity Jul12 Aug12 Sep12 Oct12 Nov12 Dec12 Jan13 Feb13 Mar13 Apr13 May13 Jun13 Notes (Activity)Activity Type
1 1 Design and tender documenta N/A
Nov 2012: Raadgewende Ingenieur aangestel.S/Notes:
Projected/Actual ETD Jul12 Aug12 Sep12 Oct12 Nov12 Dec12 Jan13 Feb13 Mar13 Apr13 May13 Jun13Bdgt Type YTDDec Budget YTD Var Var % Year Bal Bal %
200 000CapitalProjected Cash Flow 200 000 200 000 100.0%0%
pj-12-0024 - Water: Bulk water meters Municipal areaProject: Location:
Vote Nos: 70 80 567 0077 0
Grp No Activity Jul12 Aug12 Sep12 Oct12 Nov12 Dec12 Jan13 Feb13 Mar13 Apr13 May13 Jun13 Notes (Activity)Activity Type
1 1 Design and tender documenta N/A
1 2 Tender process N/A
1 3 Construction N/A
Aug 12: TEK 24 Aug 2012. TTK goedkeuring 28 Aug 2012. Fondse van DWA ontvang.Sep 12: Projekkoste: R3 003 962.33. Besparing van R496 037.67. Besparing sal aangewend word vir 'n waterprojek(te) soos deur DWA goedgekeur en met aansuiweringsbegroting reggestel word.Des 2012: Kostruksie het begin en projek geskeduleer vir voltooing einde Maart 2013.
S/Notes:
Projected/Actual ETD Jul12 Aug12 Sep12 Oct12 Nov12 Dec12 Jan13 Feb13 Mar13 Apr13 May13 Jun13Bdgt Type YTDDec Budget YTD Var Var % Year Bal Bal %
900 000300 000 300 000 300 000 600 000 600 000 700 000 700 000CapitalProjected Cash Flow 3 500 000 2 417 977 69.1%182 023 20.2%
1 082 02310 088 127 967 115 460 65 635 66 484 696 389CapitalExpenditure to date
16 January 2013 2012/3 - [SDBIP] PROJECT SCHEDULES 46

Cleaning Services
pj-09-0027 - Refuse bins, traps, skips Municipal areaProject: Location:
Vote Nos: 64 80 546 0080 0
Grp No Activity Jul12 Aug12 Sep12 Oct12 Nov12 Dec12 Jan13 Feb13 Mar13 Apr13 May13 Jun13 Notes (Activity)Activity Type
1 1 Equipment - purchasing N/A
Okt 2012: Besig met beplanning.Nov 2012: Besig met die bou van die bakke.
S/Notes:
Projected/Actual ETD Jul12 Aug12 Sep12 Oct12 Nov12 Dec12 Jan13 Feb13 Mar13 Apr13 May13 Jun13Bdgt Type YTDDec Budget YTD Var Var % Year Bal Bal %
34 000CapitalProjected Cash Flow 34 000 4 600 13.5%29 400 ??%
29 40016 600 12 800CapitalExpenditure to date
pj-10-0126 - Vehicles Refuse: Replace CK29939 (Compactor) Municipal areaProject: Location:
Vote Nos: 64 80 588 0079 0
Grp No Activity Jul12 Aug12 Sep12 Oct12 Nov12 Dec12 Jan13 Feb13 Mar13 Apr13 May13 Jun13 Notes (Activity)Activity Type
1 1 Procurement process N/A
1 2 Delivery/collection N/A
Aug 2012: Tenders het op 17 Aug 2012 gesluit. Tender toegeken vir R1 766 276.32. Besparing van R133 723.68.Okt 2012: Wag vir aflewering.Nov 2012: CK 29939 na skut vir veiling. Aflewering word in Desember 2012 verwag.
S/Notes:
Projected/Actual ETD Jul12 Aug12 Sep12 Oct12 Nov12 Dec12 Jan13 Feb13 Mar13 Apr13 May13 Jun13Bdgt Type YTDDec Budget YTD Var Var % Year Bal Bal %
1 900 000CapitalProjected Cash Flow 1 900 000 133 724 7.0%1 766 276 ??%
1 766 2761 766 276CapitalExpenditure to date
pj-11-0059 - Equipment Refuse Removal: Global amount Municipal areaProject: Location:
Vote Nos: 64 80 546 0082 0
Grp No Activity Jul12 Aug12 Sep12 Oct12 Nov12 Dec12 Jan13 Feb13 Mar13 Apr13 May13 Jun13 Notes (Activity)Activity Type
1 1 Equipment - purchasing N/A
Projected/Actual ETD Jul12 Aug12 Sep12 Oct12 Nov12 Dec12 Jan13 Feb13 Mar13 Apr13 May13 Jun13Bdgt Type YTDDec Budget YTD Var Var % Year Bal Bal %
20 00020 000 20 000 11 500CapitalProjected Cash Flow 51 500 27 332 53.1%4 168 20.8%
24 16811 954 12 214CapitalExpenditure to date
pj-12-0026 - Refuse: Upgrading Recycling Plant Municipal areaProject: Location:
Vote Nos: 64 10 042 0081 0
Grp No Activity Jul12 Aug12 Sep12 Oct12 Nov12 Dec12 Jan13 Feb13 Mar13 Apr13 May13 Jun13 Notes (Activity)Activity Type
1 1 Pre-investigation N/A
1 2 Planning and documentation N/A
1 3 Procurement process N/A
Aug 2012: Jan Palm Ing reeds 'n aanvang geneem met voorafondersoek en kosteberaming.Nov 2012: Voorlopige ontwerp ontvang. Aansoek om befondsing ingedien by "Greenfund". Voorlopige beraming op R3 492 500 (BTW uitgesluit). Bedrag sal reggestel word met die finanlisering van die 2013/2014 kapitale begroting.
S/Notes:
Projected/Actual ETD Jul12 Aug12 Sep12 Oct12 Nov12 Dec12 Jan13 Feb13 Mar13 Apr13 May13 Jun13Bdgt Type YTDDec Budget YTD Var Var % Year Bal Bal %
30 00030 000 150 000 20 000CapitalProjected Cash Flow 200 000 200 000 100.0%-30 000 -100.0%
16 January 2013 2012/3 - [SDBIP] PROJECT SCHEDULES 47

Corporate Services
Corporate Services General
pj-09-0021ad - Equipment Corporate Municipal areaProject: Location:
Vote Nos: 10 80 567 0084 0
Notes: 2010/11 fin year: Subdivided - see projects 10-0141, 10-0142 and 10-0143
Grp No Activity Jul12 Aug12 Sep12 Oct12 Nov12 Dec12 Jan13 Feb13 Mar13 Apr13 May13 Jun13 Notes (Activity)Activity Type
1 1 Equipment - purchasing N/A
Projected/Actual ETD Jul12 Aug12 Sep12 Oct12 Nov12 Dec12 Jan13 Feb13 Mar13 Apr13 May13 Jun13Bdgt Type YTDDec Budget YTD Var Var % Year Bal Bal %
28 00028 000 25 240CapitalProjected Cash Flow 53 240 33 020 62.0%-7 780 -27.8%
20 220499 1 095 15 145 3 481CapitalExpenditure to date
pj-12-0037 - MSIG: Preparation for an Organisation and Work Study Municipal areaProject: Location:
Vote Nos: 11 42 520 0249 7
Grp No Activity Jul12 Aug12 Sep12 Oct12 Nov12 Dec12 Jan13 Feb13 Mar13 Apr13 May13 Jun13 Notes (Activity)Activity Type
1 1 Planning of process and scop N/A
Okt 12: Discussions to be held with potencial service providerS/Notes:
Projected/Actual ETD Jul12 Aug12 Sep12 Oct12 Nov12 Dec12 Jan13 Feb13 Mar13 Apr13 May13 Jun13Bdgt Type YTDDec Budget YTD Var Var % Year Bal Bal %
25 000 25 000OperatingProjected Cash Flow 50 000 50 000 100.0%0%
Administration: Properties and Contracts
pj-09-0024 - Halls and buildings: Sundry equipment Swartland Halls Municipal areaProject: Location:
Vote Nos: 10 80 567 0085 0
Grp No Activity Jul12 Aug12 Sep12 Oct12 Nov12 Dec12 Jan13 Feb13 Mar13 Apr13 May13 Jun13 Notes (Activity)Activity Type
1 1 Equipment - purchasing N/A
Okt 12: R53 679 is reeds committed op PromunS/Notes:
Projected/Actual ETD Jul12 Aug12 Sep12 Oct12 Nov12 Dec12 Jan13 Feb13 Mar13 Apr13 May13 Jun13Bdgt Type YTDDec Budget YTD Var Var % Year Bal Bal %
50 00050 000 50 000CapitalProjected Cash Flow 100 000 59 866 59.9%-9 866 -19.7%
40 13439 344 789CapitalExpenditure to date
16 January 2013 2012/3 - [SDBIP] PROJECT SCHEDULES 48

Development Services
Development Services General
pj-11-0097 - Equipment Development Services Municipal areaProject: Location:
Vote Nos: 34 80 567 0086 0
Grp No Activity Jul12 Aug12 Sep12 Oct12 Nov12 Dec12 Jan13 Feb13 Mar13 Apr13 May13 Jun13 Notes (Activity)Activity Type
1 1 Equipment - purchasing N/A
Nov 12: R 87481.70 is committed on PromunS/Notes:
Projected/Actual ETD Jul12 Aug12 Sep12 Oct12 Nov12 Dec12 Jan13 Feb13 Mar13 Apr13 May13 Jun13Bdgt Type YTDDec Budget YTD Var Var % Year Bal Bal %
100 00010 000 30 000 30 000 30 000 30 000 30 000 30 000 30 000 30 000 22 600CapitalProjected Cash Flow 272 600 174 952 64.2%-2 352 -2.4%
97 648789 16 525 52 600 11 283 16 451CapitalExpenditure to date
Community Development
pj-11-0119 - Thusong Centre Ilinge LethuProject: Location:
Grp No Activity Jul12 Aug12 Sep12 Oct12 Nov12 Dec12 Jan13 Feb13 Mar13 Apr13 May13 Jun13 Notes (Activity)Activity Type
1 1 See note N/A
Sep 12: PRT van Dept Menslike Nedersettings is tans besig met die beplaning van die gebou. Sodra planne gefinaliseer is sal tenders aangevra word. Verwagte voltooiingsdatum is 31 Maart 2013..
Okt 2012 Planne ontvang van DMN. SASSA en SM lewer finale kommentaar. Afsnydatum vir indien van munisipale planne is 31 Oktober 2012. Projek kan steeds in tydraamwerk afgehandel word, maar daar kan gladvan tydskedule afgewyk word nie.Nov 2012 Bouplanne is goedgekeur. Wag vir gespesifiseerde bouplanne ten einde op tender uit te gaan. Projek sal 'n aanvang neem in Jan 2013 en sal voltooi wees voor 30 Jun 2013.Nov 2012 - Ingenieur versoek verdere spesifikasies van tekenaars. Projek sal voor einde Maart 2013 in aanvangs neem.
S/Notes:
Projected/Actual ETD Jul12 Aug12 Sep12 Oct12 Nov12 Dec12 Jan13 Feb13 Mar13 Apr13 May13 Jun13Bdgt Type YTDDec Budget YTD Var Var % Year Bal Bal %
CapitalProjected Cash Flow 500 000 500 000 100.0%0%
16 January 2013 2012/3 - [SDBIP] PROJECT SCHEDULES 49

Housing
pj-10-0013 - Housing Klippiesdal Riebeek-WesProject: Location:
Vote Nos: 40 10 042 0088 0
Grp No Activity Jul12 Aug12 Sep12 Oct12 Nov12 Dec12 Jan13 Feb13 Mar13 Apr13 May13 Jun13 Notes (Activity)Activity Type
1 1 Planning of project and applic N/A
1 2 Provision of containers and sl N/A
1 3 Demolition of houses N/A
1 4 Fencing of constuction site N/A
1 5 Civil services and water meter N/A
1 6 Construction of new houses N/A
1 7 Sundry activities N/A
Aug 12: Project approved by DHS. Busy with preparation of cash flow and project projections. Project will start in September. Activities will then be rescheduled.Sep 12: Mense gaan geakkommodeer word in slaap-vraghouers wat op die rugbyveld geplaas gaan word met dienste-aansluitings.Okt: Program en begroting is ontvang. Fisiese bou van die huise sal in Jan 2013 'n aanvang neem en voltooi word einde Maart.
S/Notes:
Projected/Actual ETD Jul12 Aug12 Sep12 Oct12 Nov12 Dec12 Jan13 Feb13 Mar13 Apr13 May13 Jun13Bdgt Type YTDDec Budget YTD Var Var % Year Bal Bal %
134 000 434 950 681 490CapitalProjected Cash Flow 1 250 440 1 250 440 100.0%0%
pj-10-0014 - Housing Riverlands: Services RiverlandsProject: Location:
Vote Nos: 40 20 021 0087 0
Grp No Activity Jul12 Aug12 Sep12 Oct12 Nov12 Dec12 Jan13 Feb13 Mar13 Apr13 May13 Jun13 Notes (Activity)Activity Type
1 1 Application individual subsidie N/A
1 2 Approval of subsidies N/A
1 3 Tender process N/A
1 4 Installation of services N/A
1 5 Transfer of properties N/A
Installation of services dependend on approval of subsidiesAug 12: Still busy with subsidy formsSep 12: Two application forms still outstanding. Dept of Civil Eng Services to do costing for installation of civil services.
S/Notes:
Projected/Actual ETD Jul12 Aug12 Sep12 Oct12 Nov12 Dec12 Jan13 Feb13 Mar13 Apr13 May13 Jun13Bdgt Type YTDDec Budget YTD Var Var % Year Bal Bal %
150 000CapitalProjected Cash Flow 150 000 150 000 100.0%0%
16 January 2013 2012/3 - [SDBIP] PROJECT SCHEDULES 50

Valuations
pj-09-0094 - Valuation - Supplementary Municipal areaProject: Location:
Vote Nos: 17 32 520 0361 3
Grp No Activity Jul12 Aug12 Sep12 Oct12 Nov12 Dec12 Jan13 Feb13 Mar13 Apr13 May13 Jun13 Notes (Activity)Activity Type
1 First supplementary valuation
1 1 Supply valuer with information N/A
1 2 Feedback from valuer on valu N/A
1 3 Advertise valuation roll N/A
2 Second supplementary valuati
2 1 Supply valuer with information N/A
2 2 Feedback from valuer on valu N/A
2 3 Advertise valuation roll N/A
Okt 12: Befondsing is oorgeplaas vanaf hierdie pos na Alg Waardasie. Regstelling sal in Jan 2013 gedoen word by aansuiweringsbegroting. Rede hiervoor was die addisionele uitgawe van ±R950 000 vir addisionele wdeur SKW. Raad se prokureurs is besig met regsproses om dit te verhaal van M3 en Medewerkers.
S/Notes:
Projected/Actual ETD Jul12 Aug12 Sep12 Oct12 Nov12 Dec12 Jan13 Feb13 Mar13 Apr13 May13 Jun13Bdgt Type YTDDec Budget YTD Var Var % Year Bal Bal %
200 000200 000 120 000OperatingProjected Cash Flow 39 000 -142 134 -364.4%-18 866 -9.4%
181 13414 560 110 520 12 605 43 449OperatingExpenditure to date
pj-10-0008 - Valuation - General Municipal areaProject: Location:
Vote Nos: 17 32 520 0361 2
Grp No Activity Jul12 Aug12 Sep12 Oct12 Nov12 Dec12 Jan13 Feb13 Mar13 Apr13 May13 Jun13 Notes (Activity)Activity Type
1 1 Complete valuation AfgehandelN/A
Aug 12: Alg waardasie is geimplementeer. Wag nog vir elektroniese rekords. Koste ter afhandeling sal by aansuiweringsbegroting voorsiening voor gemaak word (R253 000)Okt 12: 98% van elektroniese rekords ontvang.Nov 12: Befondsing is oorgeplaas vanaf hierdie pos na Alg Waardasie. Regstelling sal in Jan 2013 gedoen word by aansuiweringsbegroting. Rede hiervoor was die addisionele uitgawe van ±R950 000 vir addisionele werk deur SKW. Raad se prokureurs is besig met regsproses om dit te verhaal van M3 en Medewerkers.
S/Notes:
Projected/Actual ETD Jul12 Aug12 Sep12 Oct12 Nov12 Dec12 Jan13 Feb13 Mar13 Apr13 May13 Jun13Bdgt Type YTDDec Budget YTD Var Var % Year Bal Bal %
OperatingProjected Cash Flow 280 668 33 875 12.1%246 793 ??%
246 793246 200 593OperatingExpenditure to date
16 January 2013 2012/3 - [SDBIP] PROJECT SCHEDULES 51

Electrical Engineering Services
Electrical Engineering Services General
pj-09-0195 - Vehicles Electricity: Replace CK17699 (Truck plus platform) Municipal areaProject: Location:
Vote Nos: 82 80 819 0090 0; 82 80 588 0089 0
Grp No Activity Jul12 Aug12 Sep12 Oct12 Nov12 Dec12 Jan13 Feb13 Mar13 Apr13 May13 Jun13 Notes (Activity)Activity Type
1 1 Procurement process CompletedN/A
1 2 Delivery/collection CompletedN/A
Jul 12: Tender awarded on 25 Jun 12. Aug 12: Construction in process, on schedule. Sep 12: Construction in process, on schedule. Oct 12: Construction in process, on schedule.Nov 12: Delivered, completed.
S/Notes:
Projected/Actual ETD Jul12 Aug12 Sep12 Oct12 Nov12 Dec12 Jan13 Feb13 Mar13 Apr13 May13 Jun13Bdgt Type YTDDec Budget YTD Var Var % Year Bal Bal %
750 000750 000CapitalProjected Cash Flow 750 000 0%0%
750 000750 000CapitalExpenditure to date
pj-11-0096 - Equipment Electricity Municipal areaProject: Location:
Vote Nos: 82 80 567 0106 0
Grp No Activity Jul12 Aug12 Sep12 Oct12 Nov12 Dec12 Jan13 Feb13 Mar13 Apr13 May13 Jun13 Notes (Activity)Activity Type
1 1 Equipment - purchasing On scheduleN/A
Aug 12: Equipment specifications and purchasing in process.Sept 12: Equipment specifications and purchasing in processOct 12: Equipment specifications and purchasing in process and on schedule.Nov 12: Equipment specifications and purchasing in process and on schedule.Dec 12: Equipment specifications and purchasing in process and on schedule.
S/Notes:
Projected/Actual ETD Jul12 Aug12 Sep12 Oct12 Nov12 Dec12 Jan13 Feb13 Mar13 Apr13 May13 Jun13Bdgt Type YTDDec Budget YTD Var Var % Year Bal Bal %
110 00020 000 70 000 20 000 70 000 70 000 70 000 70 000 70 000CapitalProjected Cash Flow 460 000 279 150 60.7%70 850 64.4%
180 85039 402 25 328 25 050 68 570 22 500CapitalExpenditure to date
16 January 2013 2012/3 - [SDBIP] PROJECT SCHEDULES 52

Electricity Operations, Maintenance and Construction
pj-10-0031 - Electricity: New Klipfontein Regional Substation (KRS) MalmesburyProject: Location:
Vote Nos: 82 20 147 0091 0
Grp No Activity Jul12 Aug12 Sep12 Oct12 Nov12 Dec12 Jan13 Feb13 Mar13 Apr13 May13 Jun13 Notes (Activity)Activity Type
1 1 Procurement process On scheduleN/A
1 2 Delivery and installation N/A
Jul 12: Tenders awarded for MV switchgear (03 Feb 12) for R2 292 086.02 (Unforeseen expenses, escalation and exchange rate variations R300 000) and substation building (04 May 12) for R294 500 (Unforeseen expenses R50 000)Aug 12: Procurement on schedule.Sept 12: Substation building completed, procurement of equipment on schedule.Oct 12: Procurement of equipment on schedule.Nov 12: Procurement of equipment on scheduleDec 12: Manufacturing of equipment completed, testing sheduled, delivery expected Feb 13.
S/Notes:
Projected/Actual ETD Jul12 Aug12 Sep12 Oct12 Nov12 Dec12 Jan13 Feb13 Mar13 Apr13 May13 Jun13Bdgt Type YTDDec Budget YTD Var Var % Year Bal Bal %
350 00050 000 100 000 100 000 100 000 2 000 000 500 000 150 000CapitalProjected Cash Flow 3 000 000 2 324 316 77.5%325 684 93.1%
675 684196 695 316 724 51 338 35 586 75 341CapitalExpenditure to date
pj-10-0033 - Electricity: Supply Klipfontein Eskom Sub/KRS Municipal areaProject: Location:
Vote Nos: 82 20 147 0092 0
Grp No Activity Jul12 Aug12 Sep12 Oct12 Nov12 Dec12 Jan13 Feb13 Mar13 Apr13 May13 Jun13 Notes (Activity)Activity Type
1 1 Procurement process On scheduleN/A
1 2 Delivery and installation On scheduleN/A
Jul 12: Cable route surveyed.Aug 12: Progress of the Klipfontein development and Eskom Klipfontein substation evaluated. Eskom schedule for Klipfontein substation completion is confirmed for Jan 14, Klipfontein developers advised that phase 1proceed during 2013 and that the power supply is required by Aug 2013. The Civil Engineer SKC Loubser advised that access road construction can commence Feb 13 with completion of the stream crossing adjacentthe Piketberg road by April 2013. This will allow cable installation in the current financial year. Based on the available information it is decided not to postpone the project to 2013/14 but to proceed and request the storeorder the required cable. Sep 12: Cable ordered, delivery on schedule.Budget exceeds estimated expenditure. Budget to be reduced by R400 000 in adjustment budget.Oct 12: Procurement on scheduleNov 12: An amount of R90 000 of the saving of R400 000 will be utilised to complete pj. 12-0019 to be able to install lighting, to connect services and to erect toilets at the facility.Dec 12: Cable delivered, Installation schelduled- Mar - Jun 13.
S/Notes:
Projected/Actual ETD Jul12 Aug12 Sep12 Oct12 Nov12 Dec12 Jan13 Feb13 Mar13 Apr13 May13 Jun13Bdgt Type YTDDec Budget YTD Var Var % Year Bal Bal %
500 000500 000 500 000 500 000 500 000 500 000CapitalProjected Cash Flow 2 500 000 1 796 201 71.8%203 799 40.8%
703 7999 300 687 651 6 848CapitalExpenditure to date
pj-10-0097 - Electricity: Micro Excavator Municipal areaProject: Location:
Vote Nos: 82 80 819 0093 0
Grp No Activity Jul12 Aug12 Sep12 Oct12 Nov12 Dec12 Jan13 Feb13 Mar13 Apr13 May13 Jun13 Notes (Activity)Activity Type
1 1 Procurement process N/A
1 2 Delivery/collection Completed in AugN/A
Jul 12: Tender awarded 9 July 12.Aug 12: Delivered. Utilisation of saving will be considered in adjustments budget. Sep 12: R36 475 allocated for shortfall w.r.t. insurance recovery for replacement of Tractor. Remainder of R22 166 saving to adjustmenbudget..
S/Notes:
Projected/Actual ETD Jul12 Aug12 Sep12 Oct12 Nov12 Dec12 Jan13 Feb13 Mar13 Apr13 May13 Jun13Bdgt Type YTDDec Budget YTD Var Var % Year Bal Bal %
350 000350 000CapitalProjected Cash Flow 350 000 66 363 19.0%-66 363 -19.0%
283 637271 331 12 306CapitalExpenditure to date
16 January 2013 2012/3 - [SDBIP] PROJECT SCHEDULES 53

pj-12-0002 - Electricity MV Network: Upgrade cable networks and regional substations - Wesbank WesbankProject: Location:
Vote Nos: 82 20 147 0094 0
Grp No Activity Jul12 Aug12 Sep12 Oct12 Nov12 Dec12 Jan13 Feb13 Mar13 Apr13 May13 Jun13 Notes (Activity)Activity Type
1 1 Procurement process On scheduleN/A
1 2 Delivery and installation Ahead of scheduleN/A
Jul 12: Departmental construction. MV cable installation Wesbank 20% completed.Aug 12: MV cable installation 30% completed. Sept 12: MV cable installation 50% completedOct 12: MV cable installation 90% completed, procurement of switchgear on schedule.Nov 12: MV cable installation completed, cable circuit energized, procurement of switchgear on schedule.Dec 12: Procurement of switchgear on schedule.
S/Notes:
Projected/Actual ETD Jul12 Aug12 Sep12 Oct12 Nov12 Dec12 Jan13 Feb13 Mar13 Apr13 May13 Jun13Bdgt Type YTDDec Budget YTD Var Var % Year Bal Bal %
1 500 000500 000 500 000 500 000 1 000 000 300 000 300 000 300 000CapitalProjected Cash Flow 3 400 000 1 782 760 52.4%117 240 7.8%
1 617 2402 176 230 579 871 422 447 612 65 293 158CapitalExpenditure to date
pj-12-0003 - Electricity LV lines/network: Replace obsolete low voltage lines - Bergzicht and Wesbank Various locationsProject: Location:
Vote Nos: 82 20 147 0095 0
Grp No Activity Jul12 Aug12 Sep12 Oct12 Nov12 Dec12 Jan13 Feb13 Mar13 Apr13 May13 Jun13 Notes (Activity)Activity Type
1 1 Procurement process On scheduleN/A
1 2 Construction Construction on scheduleN/A
Jul12: Departmental planning completed.Aug 12: On schedule. Sept 12: Procurement and construction on schedule,Oct 12: Procurement and construction on schedule,Nov 12: Procurement and construction on schedule,Dec 12: Procurement and construction on schedule,
S/Notes:
Projected/Actual ETD Jul12 Aug12 Sep12 Oct12 Nov12 Dec12 Jan13 Feb13 Mar13 Apr13 May13 Jun13Bdgt Type YTDDec Budget YTD Var Var % Year Bal Bal %
160 00040 000 40 000 40 000 40 000 40 000 40 000 40 000 40 000 40 000 40 000CapitalProjected Cash Flow 400 000 227 971 57.0%12 029 7.5%
172 02932 460 23 774 51 290 37 031 27 473CapitalExpenditure to date
pj-12-0004 - Electricity: Replace proprietary prepaid meters - Darling, Malmesbury and Moorreesburg Various locationsProject: Location:
Vote Nos: 82 20 147 0096 0
Grp No Activity Jul12 Aug12 Sep12 Oct12 Nov12 Dec12 Jan13 Feb13 Mar13 Apr13 May13 Jun13 Notes (Activity)Activity Type
1 1 Installation On scheduleN/A
Aug 12: Replacement meters to be ordered from capital budget. Sept 12: Meter replacement program on schedule.Oct 12: Meter replacement program on schedule.Nov 12: Meter replacement program on schedule.Dec 12: Meter replacement program on schedule.
S/Notes:
Projected/Actual ETD Jul12 Aug12 Sep12 Oct12 Nov12 Dec12 Jan13 Feb13 Mar13 Apr13 May13 Jun13Bdgt Type YTDDec Budget YTD Var Var % Year Bal Bal %
50 00010 000 10 000 10 000 10 000 10 000 10 000 10 000 10 000 10 000 10 000CapitalProjected Cash Flow 100 000 44 883 44.9%5 117 10.2%
55 1171 295 3 490 35 062 8 648 6 623CapitalExpenditure to date
16 January 2013 2012/3 - [SDBIP] PROJECT SCHEDULES 54

pj-12-0005 - Electricity: Upgrade supply line 1 - Renew supply line from Eskom MoorreesburgProject: Location:
Vote Nos: 82 20 147 0097 0
Grp No Activity Jul12 Aug12 Sep12 Oct12 Nov12 Dec12 Jan13 Feb13 Mar13 Apr13 May13 Jun13 Notes (Activity)Activity Type
1 1 Procurement process CompletedN/A
1 2 Delivery/collection On scheduleN/A
1 3 Construction N/A
Jul 12: Tender documents and design completed departmentally.Aug 12: Tenders being invited. Sept 12: Tenders adjudicated. Oct 12: Tender awarded.Nov 12: Material ordered.Dec 12: Material partially delevered, on schedule.
S/Notes:
Projected/Actual ETD Jul12 Aug12 Sep12 Oct12 Nov12 Dec12 Jan13 Feb13 Mar13 Apr13 May13 Jun13Bdgt Type YTDDec Budget YTD Var Var % Year Bal Bal %
500 000 300 000 200 000CapitalProjected Cash Flow 1 000 000 1 000 000 100.0%0%
pj-12-0006 - Electricity MV Network: Upgrade supply line to sewerage plant Moorreesburg MoorreesburgProject: Location:
Vote Nos: 82 20 147 0098 0
Grp No Activity Jul12 Aug12 Sep12 Oct12 Nov12 Dec12 Jan13 Feb13 Mar13 Apr13 May13 Jun13 Notes (Activity)Activity Type
1 1 Procurement process Switchgear exp. Feb 13.N/A
1 2 Delivery and installation On scheduleN/A
Jul 12: Departmental construction, planning completed.Aug 12: Procurement on schedule. Sep 12: Procurement on schedule.Oct 12: Procurement and construction on scheduleNov 12: Construction on schedule, Switchgear delivery expected Feb 13.Dec 12: Construction on schedule, Switchgear delivery expected Feb 13
S/Notes:
Projected/Actual ETD Jul12 Aug12 Sep12 Oct12 Nov12 Dec12 Jan13 Feb13 Mar13 Apr13 May13 Jun13Bdgt Type YTDDec Budget YTD Var Var % Year Bal Bal %
500 000200 000 300 000 200 000CapitalProjected Cash Flow 700 000 242 960 34.7%-42 960 -8.6%
457 040960 253 297 196 692 4 460 1 631CapitalExpenditure to date
pj-12-0007 - Electricity LV lines/network: Replace obsolete LV lines Moorreesburg MoorreesburgProject: Location:
Vote Nos: 82 20 147 0099 0
Grp No Activity Jul12 Aug12 Sep12 Oct12 Nov12 Dec12 Jan13 Feb13 Mar13 Apr13 May13 Jun13 Notes (Activity)Activity Type
1 1 Procurement process On scheduleN/A
1 2 Delivery and installation On scheduleN/A
Jul 12: Departmental construction, planning completed.Sept 12: Procurement and construction on schedule.Oct 12: Procurement and construction on schedule.Nov 12: Procurement and construction on schedule.Dec 12: Procurement and construction on schedule.
S/Notes:
Projected/Actual ETD Jul12 Aug12 Sep12 Oct12 Nov12 Dec12 Jan13 Feb13 Mar13 Apr13 May13 Jun13Bdgt Type YTDDec Budget YTD Var Var % Year Bal Bal %
100 00020 000 20 000 20 000 20 000 20 000 20 000 20 000 65 000 65 000 65 000 65 000CapitalProjected Cash Flow 400 000 172 382 43.1%127 618 127.6%
227 618112 305 59 811 55 502CapitalExpenditure to date
16 January 2013 2012/3 - [SDBIP] PROJECT SCHEDULES 55

pj-12-0008 - Electricity MV Network: Replace switchgear and substations - Darling North, East and industrial area DarlingProject: Location:
Vote Nos: 82 20 147 0101 0
Grp No Activity Jul12 Aug12 Sep12 Oct12 Nov12 Dec12 Jan13 Feb13 Mar13 Apr13 May13 Jun13 Notes (Activity)Activity Type
1 1 Procurement process On scheduleN/A
1 2 Delivery and installation N/A
Jul 12: Material and equipment ordered per annual tenders.Aug 12: Procurement on schedule. Sept 12: Procurement on schedule.Oct 12: Procurement on schedule.Nov 12: Procurement on schedule.Dec 12: Procurement on schedule.
S/Notes:
Projected/Actual ETD Jul12 Aug12 Sep12 Oct12 Nov12 Dec12 Jan13 Feb13 Mar13 Apr13 May13 Jun13Bdgt Type YTDDec Budget YTD Var Var % Year Bal Bal %
900 000900 000 200 000 100 000CapitalProjected Cash Flow 1 200 000 795 866 66.3%-495 866 -55.1%
404 134400 384 3 750CapitalExpenditure to date
pj-12-0009 - Electricity MV cables: Cable circuit Main sub to new Eskom substation DarlingProject: Location:
Vote Nos: 82 20 147 0102 0
Grp No Activity Jul12 Aug12 Sep12 Oct12 Nov12 Dec12 Jan13 Feb13 Mar13 Apr13 May13 Jun13 Notes (Activity)Activity Type
1 1 Procurement process On scheduleN/A
1 2 Delivery and installation N/A
Jul 12: Material ordered. Eskom substation completion scheduled after Feb 13.Aug 12: Procurement on schedule. Sept 12: Cable delivered, Awaiting completion of Eskom substation.Oct 12: Cable delivered, Awaiting completion of Eskom substation.Nov 12: Cable delivered, Awaiting completion of Eskom substation.Dec 12: Cable delivered, Awaiting completion of Eskom substation.
S/Notes:
Projected/Actual ETD Jul12 Aug12 Sep12 Oct12 Nov12 Dec12 Jan13 Feb13 Mar13 Apr13 May13 Jun13Bdgt Type YTDDec Budget YTD Var Var % Year Bal Bal %
300 000300 000 50 000CapitalProjected Cash Flow 350 000 168 670 48.2%-118 670 -39.6%
181 330308 323 -308 323 178 992 2 339CapitalExpenditure to date
pj-12-0010 - Electricity: Main substation switchgear - extension for upgrading of supply Yzerfontein YzerfonteinProject: Location:
Vote Nos: 82 20 147 0103 0
Grp No Activity Jul12 Aug12 Sep12 Oct12 Nov12 Dec12 Jan13 Feb13 Mar13 Apr13 May13 Jun13 Notes (Activity)Activity Type
1 1 Procurement process On scheduleN/A
1 2 Delivery and installation On scheduleN/A
Jul 12: Tender awarded (03 Feb 12) for R1 115 220.20 (unforeseen expenses, escalation and exchange rate variations R80 000), manufacturing on schedule.Aug 12: Procurement on schedule, delivery expected Oct 12. Sept 12: Procurement on schedule, delivery scheduled for October 12.. Oct 12: Equipment delivered.Nov 12: Installation and connection scheduled for Feb- Mar 13Dec 12: Installation and connection scheduled for Feb- Mar 13
S/Notes:
Projected/Actual ETD Jul12 Aug12 Sep12 Oct12 Nov12 Dec12 Jan13 Feb13 Mar13 Apr13 May13 Jun13Bdgt Type YTDDec Budget YTD Var Var % Year Bal Bal %
900 000 100 000 100 000 100 000CapitalProjected Cash Flow 1 200 000 216 978 18.1%983 022 ??%
983 022202 215 666 002 63 005 51 799CapitalExpenditure to date
16 January 2013 2012/3 - [SDBIP] PROJECT SCHEDULES 56

pj-12-0011 - Electricity: Replace mini substation C4 Yzerfontein YzerfonteinProject: Location:
Vote Nos: 82 20 147 0104 0
Grp No Activity Jul12 Aug12 Sep12 Oct12 Nov12 Dec12 Jan13 Feb13 Mar13 Apr13 May13 Jun13 Notes (Activity)Activity Type
1 1 Procurement process CompletedN/A
1 2 Delivery and installation CompletedN/A
Jul 12: Equipment ordered through annual tenders.Aug 12: Procurement on schedule. Sept 12: Procurement on schedule.Oct: 12: Procurement on scheduleNov 12: Equipment delivered.Dec 12: Equipment installed and energized..
S/Notes:
Projected/Actual ETD Jul12 Aug12 Sep12 Oct12 Nov12 Dec12 Jan13 Feb13 Mar13 Apr13 May13 Jun13Bdgt Type YTDDec Budget YTD Var Var % Year Bal Bal %
300 000300 000 50 000CapitalProjected Cash Flow 350 000 26 992 7.7%23 008 7.7%
323 00824 410 16 855 281 743CapitalExpenditure to date
pj-12-0012 - Electricity: SCADA System - Main substation Darling, Malmesbury and Moorreesburg Various locationsProject: Location:
Vote Nos: 82 20 147 0105 0
Grp No Activity Jul12 Aug12 Sep12 Oct12 Nov12 Dec12 Jan13 Feb13 Mar13 Apr13 May13 Jun13 Notes (Activity)Activity Type
1 1 Procurement process On scheduleN/A
1 2 Delivery and installation Ahead of scheduleN/A
Jul 12: Tenders being invited.Aug 12: Tender awarded 6 Aug 12. Sept 12: Manufacture on schedule. Oct 12: Delivery 50% completed. Installation in process.Nov 12: Delivery 60% completed. Installation in process.Dec 12: Delivery 60% completed. Installation in process.
S/Notes:
Projected/Actual ETD Jul12 Aug12 Sep12 Oct12 Nov12 Dec12 Jan13 Feb13 Mar13 Apr13 May13 Jun13Bdgt Type YTDDec Budget YTD Var Var % Year Bal Bal %
300 000 300 000 100 000 100 000 100 000CapitalProjected Cash Flow 900 000 352 625 39.2%547 375 ??%
547 375547 375CapitalExpenditure to date
Information Management
pj-11-0100 - IT - MS Software Municipal areaProject: Location:
Vote Nos: 16 80 651 0005 0
Grp No Activity Jul12 Aug12 Sep12 Oct12 Nov12 Dec12 Jan13 Feb13 Mar13 Apr13 May13 Jun13 Notes (Activity)Activity Type
1 1 Microsoft software - purchasin Completed in OctN/A
Jul 12: Planning in process for upgrading of office programsAug 12: Tender awarded to Project 802 (Pty) Limited.Sept 12: Got licensesOct 12: Completed
S/Notes:
Projected/Actual ETD Jul12 Aug12 Sep12 Oct12 Nov12 Dec12 Jan13 Feb13 Mar13 Apr13 May13 Jun13Bdgt Type YTDDec Budget YTD Var Var % Year Bal Bal %
230 000230 000CapitalProjected Cash Flow 230 000 21 652 9.4%-21 652 -9.4%
208 348153 180 55 168CapitalExpenditure to date
16 January 2013 2012/3 - [SDBIP] PROJECT SCHEDULES 57

pj-11-0103 - IT - Xen Municipal areaProject: Location:
Vote Nos: 16 80 651 0006 0
Grp No Activity Jul12 Aug12 Sep12 Oct12 Nov12 Dec12 Jan13 Feb13 Mar13 Apr13 May13 Jun13 Notes (Activity)Activity Type
1 1 Software - purchasing On scheduleN/A
Jul 12: Software for terminals when required.Aug 12: In planning phase.Sept 12: In planning phase.Oct 12: In planning phase.
S/Notes:
Projected/Actual ETD Jul12 Aug12 Sep12 Oct12 Nov12 Dec12 Jan13 Feb13 Mar13 Apr13 May13 Jun13Bdgt Type YTDDec Budget YTD Var Var % Year Bal Bal %
80 00080 000CapitalProjected Cash Flow 80 000 54 448 68.1%-54 448 -68.1%
25 55225 552CapitalExpenditure to date
pj-11-0104 - IT - Terminal replacements Municipal areaProject: Location:
Vote Nos: 16 806 510 008 0
Grp No Activity Jul12 Aug12 Sep12 Oct12 Nov12 Dec12 Jan13 Feb13 Mar13 Apr13 May13 Jun13 Notes (Activity)Activity Type
1 1 Equipment - purchasing On scheduleN/A
Jul 12: Hardware for terminal replacement when required.Aug 12: Drawing up specifications for informal tender.Sep 12: Drawing up specifications for informal tender still in progress.Oct 12: Out on Informal Tender
S/Notes:
Projected/Actual ETD Jul12 Aug12 Sep12 Oct12 Nov12 Dec12 Jan13 Feb13 Mar13 Apr13 May13 Jun13Bdgt Type YTDDec Budget YTD Var Var % Year Bal Bal %
70 00070 000CapitalProjected Cash Flow 70 000 70 000 100.0%-70 000 -100.0%
pj-11-0105 - IT - Scanner replacements Municipal areaProject: Location:
Vote Nos: 16 80 651 0010 0
Grp No Activity Jul12 Aug12 Sep12 Oct12 Nov12 Dec12 Jan13 Feb13 Mar13 Apr13 May13 Jun13 Notes (Activity)Activity Type
1 1 Equipment - purchasing Completed in OctN/A
Aug 12: Gathering and evaluating quotationsSep 12: Equipment has been receivedOct 12: Completed
S/Notes:
Projected/Actual ETD Jul12 Aug12 Sep12 Oct12 Nov12 Dec12 Jan13 Feb13 Mar13 Apr13 May13 Jun13Bdgt Type YTDDec Budget YTD Var Var % Year Bal Bal %
20 000CapitalProjected Cash Flow 20 000 12 223 61.1%7 777 ??%
7 7777 777CapitalExpenditure to date
pj-11-0106 - IT - General capital Municipal areaProject: Location:
Vote Nos: 16 80 651 0011 0
Grp No Activity Jul12 Aug12 Sep12 Oct12 Nov12 Dec12 Jan13 Feb13 Mar13 Apr13 May13 Jun13 Notes (Activity)Activity Type
1 1 Equipment - purchasing On scheduleN/A
Allocation for general replacement of hardware when required.S/Notes:
Projected/Actual ETD Jul12 Aug12 Sep12 Oct12 Nov12 Dec12 Jan13 Feb13 Mar13 Apr13 May13 Jun13Bdgt Type YTDDec Budget YTD Var Var % Year Bal Bal %
24 0004 000 4 000 4 000 4 000 4 000 4 000 4 000 4 000 4 000 4 000 4 000 11 000CapitalProjected Cash Flow 55 000 25 143 45.7%5 857 24.4%
29 85715 928 12 034 1 895CapitalExpenditure to date
16 January 2013 2012/3 - [SDBIP] PROJECT SCHEDULES 58

pj-11-0107 - IT - Wireless and fiber network Municipal areaProject: Location:
Vote Nos: 16 80 651 0004 0
Grp No Activity Jul12 Aug12 Sep12 Oct12 Nov12 Dec12 Jan13 Feb13 Mar13 Apr13 May13 Jun13 Notes (Activity)Activity Type
1 1 Equipment/appliance - purcha Delivered in OctN/A
Jul 12: Planning in processAug 12: Out on tender for network equipmentSept 12: Tender awarded to Khusela SolutionsOct 12: Equipment received
S/Notes:
Projected/Actual ETD Jul12 Aug12 Sep12 Oct12 Nov12 Dec12 Jan13 Feb13 Mar13 Apr13 May13 Jun13Bdgt Type YTDDec Budget YTD Var Var % Year Bal Bal %
50 00050 000 50 000 50 000CapitalProjected Cash Flow 150 000 49 365 32.9%50 635 101.3%
100 63526 131 50 964 6 250 17 290CapitalExpenditure to date
pj-12-0034 - IT - Backup sollution expansion Municipal areaProject: Location:
Vote Nos: 16 80 651 0007 0
Grp No Activity Jul12 Aug12 Sep12 Oct12 Nov12 Dec12 Jan13 Feb13 Mar13 Apr13 May13 Jun13 Notes (Activity)Activity Type
1 1 Equipment - purchasing On scheduleN/A
Jul 12: Planning in processSep 12: Draw up specifications and went out on informal tenderOct 12: Tender awarded to First Technologies and awaiting delivery
S/Notes:
Projected/Actual ETD Jul12 Aug12 Sep12 Oct12 Nov12 Dec12 Jan13 Feb13 Mar13 Apr13 May13 Jun13Bdgt Type YTDDec Budget YTD Var Var % Year Bal Bal %
85 000CapitalProjected Cash Flow 85 000 48 869 57.5%36 131 ??%
36 13136 131CapitalExpenditure to date
pj-12-0035 - IT - UPS equipment Municipal areaProject: Location:
Vote Nos: 16 80 651 0012 0
Grp No Activity Jul12 Aug12 Sep12 Oct12 Nov12 Dec12 Jan13 Feb13 Mar13 Apr13 May13 Jun13 Notes (Activity)Activity Type
1 1 Equipment - purchasing Received in OctN/A
Jul 12: Planning in processAug 12: Draw up specifications and went out on informal tenderSep 12: Tender was awarded and await delivery of equipmentOct 12: Equipment have been received
S/Notes:
Projected/Actual ETD Jul12 Aug12 Sep12 Oct12 Nov12 Dec12 Jan13 Feb13 Mar13 Apr13 May13 Jun13Bdgt Type YTDDec Budget YTD Var Var % Year Bal Bal %
100 000100 000CapitalProjected Cash Flow 100 000 32 885 32.9%-32 885 -32.9%
67 1152 565 64 550CapitalExpenditure to date
pj-12-0036 - IT - Monitor replacement Municipal areaProject: Location:
Vote Nos: 16 80 651 0009 0
Grp No Activity Jul12 Aug12 Sep12 Oct12 Nov12 Dec12 Jan13 Feb13 Mar13 Apr13 May13 Jun13 Notes (Activity)Activity Type
1 1 Equipment - purchasing Completed in July 2012N/A
Jul 12: Completed.S/Notes:
Projected/Actual ETD Jul12 Aug12 Sep12 Oct12 Nov12 Dec12 Jan13 Feb13 Mar13 Apr13 May13 Jun13Bdgt Type YTDDec Budget YTD Var Var % Year Bal Bal %
45 00045 000CapitalProjected Cash Flow 45 000 504 1.1%-504 -1.1%
44 49637 080 7 416CapitalExpenditure to date
16 January 2013 2012/3 - [SDBIP] PROJECT SCHEDULES 59

Financial Services
Financial Services General
pj-09-0021af - Equipment Financial Municipal areaProject: Location:
Vote Nos: 16 80 567 0108 0
Grp No Activity Jul12 Aug12 Sep12 Oct12 Nov12 Dec12 Jan13 Feb13 Mar13 Apr13 May13 Jun13 Notes (Activity)Activity Type
1 1 Equipment/appliance - purcha N/A
Projected/Actual ETD Jul12 Aug12 Sep12 Oct12 Nov12 Dec12 Jan13 Feb13 Mar13 Apr13 May13 Jun13Bdgt Type YTDDec Budget YTD Var Var % Year Bal Bal %
10 00010 000 10 000 10 000 15 980CapitalProjected Cash Flow 45 980 38 230 83.1%-2 250 -22.5%
7 750315 1 521 5 914CapitalExpenditure to date
pj-12-0038 - MSIG: Upgrading of electronic document management system: Collaborator Municipal areaProject: Location:
Vote Nos: 11 42 520 0358 7
Grp No Activity Jul12 Aug12 Sep12 Oct12 Nov12 Dec12 Jan13 Feb13 Mar13 Apr13 May13 Jun13 Notes (Activity)Activity Type
1 1 Implementation N/A
Projected/Actual ETD Jul12 Aug12 Sep12 Oct12 Nov12 Dec12 Jan13 Feb13 Mar13 Apr13 May13 Jun13Bdgt Type YTDDec Budget YTD Var Var % Year Bal Bal %
30 000 44 500OperatingProjected Cash Flow 74 500 74 500 100.0%0%
Asset and Vehicle Management
pj-10-0152 - MSIG: New Asset Management Register Municipal areaProject: Location:
Vote Nos: 11 42 520 0087 5
Grp No Activity Jul12 Aug12 Sep12 Oct12 Nov12 Dec12 Jan13 Feb13 Mar13 Apr13 May13 Jun13 Notes (Activity)Activity Type
1 1 Implementation N/A
Aug 12: Asset register of Daan Rossouw running parellel with Promun as from Oct 2012Okt 12: 7 Des review as on 30 Jun 2012Nov 12: Amount will be spent by 30 Jun 2013
S/Notes:
Projected/Actual ETD Jul12 Aug12 Sep12 Oct12 Nov12 Dec12 Jan13 Feb13 Mar13 Apr13 May13 Jun13Bdgt Type YTDDec Budget YTD Var Var % Year Bal Bal %
30 00030 000 33 000 33 000 33 000 33 000 33 000 33 000OperatingProjected Cash Flow 228 000 228 000 100.0%-30 000 -100.0%
Reporting and Policy
pj-11-0108 - MSIG: Completion of financial statements according to GRAP standards Municipal areaProject: Location:
Grp No Activity Jul12 Aug12 Sep12 Oct12 Nov12 Dec12 Jan13 Feb13 Mar13 Apr13 May13 Jun13 Notes (Activity)Activity Type
1 1 Implementation N/A
Projected/Actual ETD Jul12 Aug12 Sep12 Oct12 Nov12 Dec12 Jan13 Feb13 Mar13 Apr13 May13 Jun13Bdgt Type YTDDec Budget YTD Var Var % Year Bal Bal %
100 00050 000 50 000 50 000OperatingProjected Cash Flow 150 000 86 616 57.7%-36 616 -36.6%
63 38424 454 17 051 14 179 5 500 2 200OperatingExpenditure to date
16 January 2013 2012/3 - [SDBIP] PROJECT SCHEDULES 60

Protection Services
Operational Services
pj-10-0075 - Traffic Offices Malmesbury - Upgrade of inquiry point MalmesburyProject: Location:
Vote Nos: 46 10 042 0111 0
Grp No Activity Jul12 Aug12 Sep12 Oct12 Nov12 Dec12 Jan13 Feb13 Mar13 Apr13 May13 Jun13 Notes (Activity)Activity Type
1 1 Informal tender process Project stoppedN/A
1 2 Construction N/A
Sep 12: Informele tenders is aangevra.Okt: After discussions with municipal manager the project was stopped. Saving will be referred to adjustment budget.
S/Notes:
Projected/Actual ETD Jul12 Aug12 Sep12 Oct12 Nov12 Dec12 Jan13 Feb13 Mar13 Apr13 May13 Jun13Bdgt Type YTDDec Budget YTD Var Var % Year Bal Bal %
40 00040 000CapitalProjected Cash Flow 40 000 40 000 100.0%-40 000 -100.0%
pj-10-0106 - Equipment Protection: Replacements i.t.o. asset register - Video camera speed fine unit Municipal areaProject: Location:
Vote Nos: 46 80 567 0114 0
Grp No Activity Jul12 Aug12 Sep12 Oct12 Nov12 Dec12 Jan13 Feb13 Mar13 Apr13 May13 Jun13 Notes (Activity)Activity Type
1 1 Procurement process N/A
1 2 Equipment- purchasing N/A
Sep 12: Formele tenders word in Sept aangevra.Okt 12: Tenders is aangevra.
S/Notes:
Projected/Actual ETD Jul12 Aug12 Sep12 Oct12 Nov12 Dec12 Jan13 Feb13 Mar13 Apr13 May13 Jun13Bdgt Type YTDDec Budget YTD Var Var % Year Bal Bal %
127 000127 000CapitalProjected Cash Flow 127 000 127 000 100.0%-127 000 -100.0%
pj-10-0138 - Equipment Municipal Police Municipal areaProject: Location:
Vote Nos: 46 80 567 0112 0
Grp No Activity Jul12 Aug12 Sep12 Oct12 Nov12 Dec12 Jan13 Feb13 Mar13 Apr13 May13 Jun13 Notes (Activity)Activity Type
1 1 Equipment- purchasing N/A
Okt 12: R132 315.71 lê onder Commitments op PromunS/Notes:
Projected/Actual ETD Jul12 Aug12 Sep12 Oct12 Nov12 Dec12 Jan13 Feb13 Mar13 Apr13 May13 Jun13Bdgt Type YTDDec Budget YTD Var Var % Year Bal Bal %
125 00062 500 62 500 62 500 63 500CapitalProjected Cash Flow 251 000 165 944 66.1%-39 944 -32.0%
85 05613 334 3 377 18 151 50 193CapitalExpenditure to date
16 January 2013 2012/3 - [SDBIP] PROJECT SCHEDULES 61

pj-11-0082 - Vehicles Mun Police: Replace CK32761 (Bakkie) Municipal areaProject: Location:
Vote Nos: 46 80 588 0110 0
Grp No Activity Jul12 Aug12 Sep12 Oct12 Nov12 Dec12 Jan13 Feb13 Mar13 Apr13 May13 Jun13 Notes (Activity)Activity Type
1 1 Procurement process N/A
1 2 Delivery/collection N/A
1 3 Equipping of vehicle N/A
Okt 12: Dien voor BBK op 1 NovS/Notes:
Projected/Actual ETD Jul12 Aug12 Sep12 Oct12 Nov12 Dec12 Jan13 Feb13 Mar13 Apr13 May13 Jun13Bdgt Type YTDDec Budget YTD Var Var % Year Bal Bal %
220 000210 000 10 000CapitalProjected Cash Flow 220 000 49 658 22.6%-49 658 -22.6%
170 342170 342CapitalExpenditure to date
pj-11-0083 - Vehicles Mun Police: Replace CK10492 (Bakkie) Municipal areaProject: Location:
Vote Nos: 46 80 588 0109 0
Grp No Activity Jul12 Aug12 Sep12 Oct12 Nov12 Dec12 Jan13 Feb13 Mar13 Apr13 May13 Jun13 Notes (Activity)Activity Type
1 1 Procurement process N/A
1 2 Delivery/collection N/A
1 3 Equipping of vehicle N/A
Okt 12: Dien voor BBK op 1 NovS/Notes:
Projected/Actual ETD Jul12 Aug12 Sep12 Oct12 Nov12 Dec12 Jan13 Feb13 Mar13 Apr13 May13 Jun13Bdgt Type YTDDec Budget YTD Var Var % Year Bal Bal %
220 000210 000 10 000CapitalProjected Cash Flow 220 000 49 658 22.6%-49 658 -22.6%
170 342170 342CapitalExpenditure to date
pj-12-0039 - Municipal Police - IT equipment Municipal areaProject: Location:
Vote Nos: 46 80 651 0113 0
Grp No Activity Jul12 Aug12 Sep12 Oct12 Nov12 Dec12 Jan13 Feb13 Mar13 Apr13 May13 Jun13 Notes (Activity)Activity Type
1 1 Procurement process N/A
1 2 Delivery/collection N/A
Okt 12: R78427.84 lê onder Commitments op PromunS/Notes:
Projected/Actual ETD Jul12 Aug12 Sep12 Oct12 Nov12 Dec12 Jan13 Feb13 Mar13 Apr13 May13 Jun13Bdgt Type YTDDec Budget YTD Var Var % Year Bal Bal %
120 000120 000CapitalProjected Cash Flow 120 000 103 763 86.5%-103 763 -86.5%
16 2378 459 7 778CapitalExpenditure to date
16 January 2013 2012/3 - [SDBIP] PROJECT SCHEDULES 62

Fire and Emergency Services
pj-10-0139 - Equipment Fire and Emergency Services Municipal areaProject: Location:
Vote Nos: 46 80 567 0115 0
Grp No Activity Jul12 Aug12 Sep12 Oct12 Nov12 Dec12 Jan13 Feb13 Mar13 Apr13 May13 Jun13 Notes (Activity)Activity Type
1 1 Equipment- purchasing N/A
Okt 12: R35 441 is reeds gecommit op PromunS/Notes:
Projected/Actual ETD Jul12 Aug12 Sep12 Oct12 Nov12 Dec12 Jan13 Feb13 Mar13 Apr13 May13 Jun13Bdgt Type YTDDec Budget YTD Var Var % Year Bal Bal %
20 00020 000 15 000 45 000CapitalProjected Cash Flow 80 000 47 264 59.1%12 736 63.7%
32 73619 700 13 036CapitalExpenditure to date
16 January 2013 2012/3 - [SDBIP] PROJECT SCHEDULES 63


64 Mid-year budget and performance assessment i.r.o. the first half of the 2012/13 financial year
8 CAPITAL BUDGET EXPENDITURE
2011/12
Audited Outcome
Original Budget
Adjusted Budget
Monthly actual YearTD actual YearTD
budgetYTD
varianceYTD
variance
% spend of Original Budget
R thousands %Monthly expenditure performance trend
July 30 – 1 928 1 928 30 (1 898) -6327.9% 2%August 3 041 – 7 486 9 415 3 071 (6 344) -206.6% 11%September 10 119 – 4 175 13 589 13 190 (399) -3.0% 16%October 8 620 – 8 590 22 179 21 810 (370) -1.7% 26%November 5 215 – 8 534 30 714 27 025 (3 689) -13.6% 35%December 13 190 – 9 364 40 078 40 215 137 0.3% 46%January 4 262 – – 44 477 – February 3 649 – – 48 126 – March 5 831 – – 53 956 – April 5 920 – – 59 876 – May 3 171 – – 63 047 – June 23 801 – – 86 848 –
Total Capital expenditure – 86 848 – 40 078
Month
WC015 Swartland - Supporting Table SC12 Monthly Budget Statement - capital expenditure trend - Mid-Year AssessmentBudget Year 2012/13

Mid-year budget and performance assessment i.r.o. the first half of the 2012/13 financial year 65
2011/12 Budget Year 2012/13Audited
OutcomeOriginal Budget
Adjusted Budget
Monthly actual YearTD actual YearTD
budgetYTD
varianceYTD
varianceFull Year Forecast
R thousands 1 %Capital expenditure on renewal of existing assets by Asset Class/Sub-class
Infrastructure – 72 573 – 6 950 30 147 37 906 7 759 20.5% 72 573 Infrastructure - Road transport – 11 066 – 1 507 11 266 7 866 (3 400) -43.2% 11 066
Roads, Pavements & Bridges 1 10 166 – 944 10 401 7 666 (2 735) -35.7% 10 166 Storm water 2 900 – 563 865 200 (665) -332.5% 900
Infrastructure - Electricity – 15 850 – 509 6 631 5 010 (1 621) -32.4% 15 850 Generation 3 – – – – – – – Transmission & Reticulation 4 15 850 – 509 6 631 5 010 (1 621) -32.4% 15 850 Street Lighting 5 – – – – – – –
Infrastructure - Water – 7 850 – 1 206 1 990 2 000 10 0.5% 7 850 Dams & Reservoirs 6 1 900 – 382 504 700 196 28.0% 1 900 Water purification 7 – – – – – – – Reticulation 8 5 950 – 824 1 486 1 300 (186) -14.3% 5 950
Infrastructure - Sanitation – 37 607 – 3 728 10 260 23 000 12 740 55.4% 37 607 Reticulation 9 37 607 – 3 728 10 260 23 000 12 740 55.4% 37 607 Sewerage purification 10 – – – – – – –
Infrastructure - Other – 200 – – – 30 30 100.0% 200 Waste Management 11 200 – – – 30 30 100.0% 200 Transportation 12 – – – – – – – Gas 13 – – – – – – – Other 14 – – – – – – –
WC015 Swartland - Supporting Table SC13b Monthly Budget Statement - capital expenditure on renewal of existing assets by asset class - Mid-
Description Ref

66 Mid-year budget and performance assessment i.r.o. the first half of the 2012/13 financial year
2011/12 Budget Year 2012/13Audited
OutcomeOriginal Budget
Adjusted Budget
Monthly actual YearTD actual YearTD
budgetYTD
varianceYTD
varianceFull Year Forecast
R thousands 1 %Community – 2 109 – 371 411 670 259 38.7% 2 109
Parks & gardens 15 – – – – – – – Sportsfields & stadia 16 1 651 – 371 374 400 26 6.4% 1 651 Swimming pools 17 – – – – – – – Community halls 18 – – – – – – – Libraries 19 – – – – – – – Recreational facilities 20 – – – – – – – Fire, safety & emergency 21 – – – – – – – Security and policing 22 – – – – – – – Buses 23 – – – – – – – Clinics 24 – – – – – – – Museums & Art Galleries 25 – – – – – – – Cemeteries 26 459 – – 0 270 270 99.9% 459 Social rental housing 27 – – – – – – – Other 28 – – – 36 – (36) #DIV/0! –
Heritage assets – – – – – – – – Buildings 29 – – – – – – – Other 30 – – – – – – – –
Investment properties – – – – – – – – Housing development 31 – – – – – – – Other 32 – – – – – – –
Description Ref

Mid-year budget and performance assessment i.r.o. the first half of the 2012/13 financial year 67
2011/12 Budget Year 2012/13Audited
OutcomeOriginal Budget
Adjusted Budget
Monthly actual YearTD actual YearTD
budgetYTD
varianceYTD
varianceFull Year Forecast
R thousands 1 %Other assets – 12 166 – 2 043 9 520 4 998 (4 522) -90.5% 12 166
General vehicles 33 7 570 – 1 769 6 637 2 470 (4 167) -168.7% 7 570 Specialised vehicles – – – – – – – – Plant & equipment 34 – – – – – – – Computers - hardware/equipment 35 835 – 19 531 612 81 13.3% 835 Furniture and other office equipment 36 2 889 – 255 1 240 1 437 196 13.7% 2 889 Abattoirs 37 – – – – – – – Markets 38 – – – – – – – Civic Land and Buildings 39 – – – – – – – Other Buildings 40 757 – – – 480 480 100.0% 757 Other Land 41 116 – – 1 112 – (1 112) 116
Agricultural assets – – – – – – – – Biological assets – – – – – – – – Intangibles – – – – – – – –
Total Capital Expenditure on renewal of existing assets 1 – 86 848 – 9 364 40 078 43 574 3 496 8.0% 86 848
Specialised vehicles – – – – – – – – References1. Total Capital Expenditure on new assets (SC13a) plus Total Capital Expenditure on renewal of existing assets (SC13b) must reconcile to total capital expenditure in Table C5
Description Ref
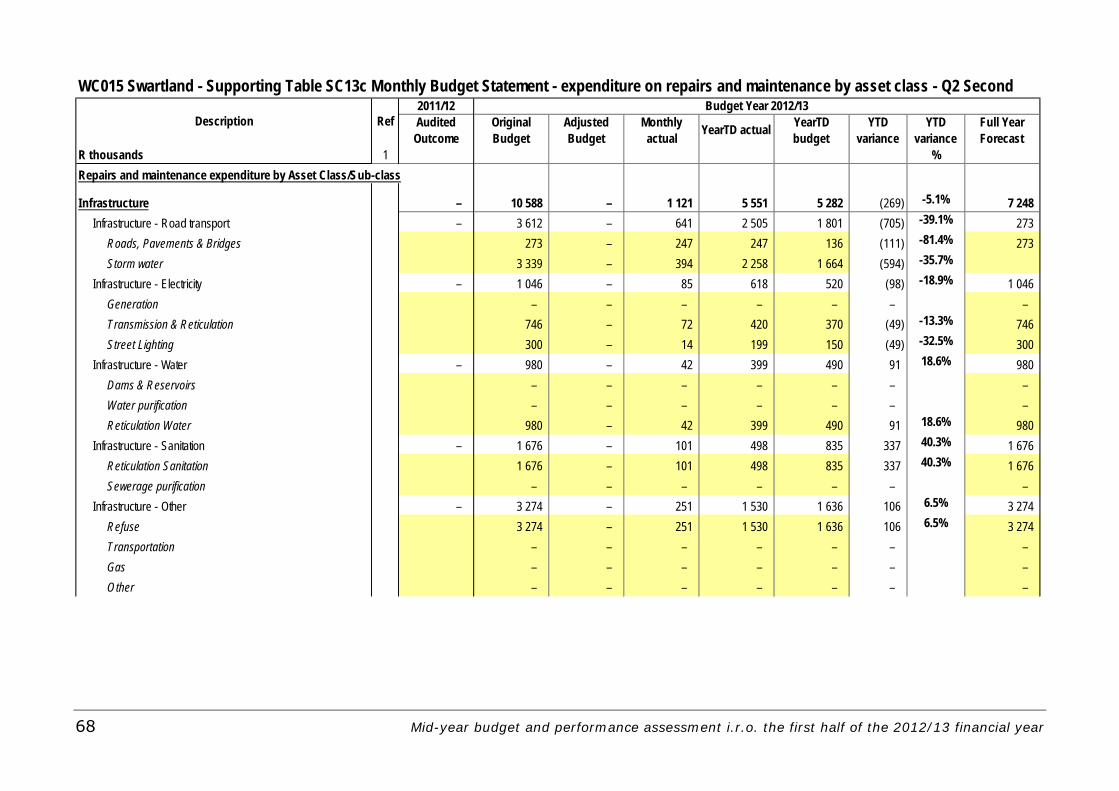
68 Mid-year budget and performance assessment i.r.o. the first half of the 2012/13 financial year
2011/12 Budget Year 2012/13Audited
OutcomeOriginal Budget
Adjusted Budget
Monthly actual YearTD actual YearTD
budgetYTD
varianceYTD
varianceFull Year Forecast
R thousands 1 %Repairs and maintenance expenditure by Asset Class/Sub-class
Infrastructure – 10 588 – 1 121 5 551 5 282 (269) -5.1% 7 248 Infrastructure - Road transport – 3 612 – 641 2 505 1 801 (705) -39.1% 273
Roads, Pavements & Bridges 273 – 247 247 136 (111) -81.4% 273 Storm water 3 339 – 394 2 258 1 664 (594) -35.7%
Infrastructure - Electricity – 1 046 – 85 618 520 (98) -18.9% 1 046 Generation – – – – – – – Transmission & Reticulation 746 – 72 420 370 (49) -13.3% 746 Street Lighting 300 – 14 199 150 (49) -32.5% 300
Infrastructure - Water – 980 – 42 399 490 91 18.6% 980 Dams & Reservoirs – – – – – – – Water purification – – – – – – – Reticulation Water 980 – 42 399 490 91 18.6% 980
Infrastructure - Sanitation – 1 676 – 101 498 835 337 40.3% 1 676 Reticulation Sanitation 1 676 – 101 498 835 337 40.3% 1 676 Sewerage purification – – – – – – –
Infrastructure - Other – 3 274 – 251 1 530 1 636 106 6.5% 3 274 Refuse 3 274 – 251 1 530 1 636 106 6.5% 3 274 Transportation – – – – – – – Gas – – – – – – – Other – – – – – – –
WC015 Swartland - Supporting Table SC13c Monthly Budget Statement - expenditure on repairs and maintenance by asset class - Q2 Second
Description Ref

Mid-year budget and performance assessment i.r.o. the first half of the 2012/13 financial year 69
2011/12 Budget Year 2012/13Audited
OutcomeOriginal Budget
Adjusted Budget
Monthly actual YearTD actual YearTD
budgetYTD
varianceYTD
varianceFull Year Forecast
R thousands 1 %Community – 808 – 28 238 406 169 41.5% 808
Parks & gardens – – – – – – – Sportsfields & stadia 359 – 5 72 179 108 60.1% 359 Swimming pools 85 – 3 77 45 (32) -71.7% 85 Community halls – – – – – – – Libraries 60 – – – 30 30 100.0% 60 Recreational facilities 199 – 11 69 100 30 30.3% 199 Fire, safety & emergency 18 – – – 9 9 100.0% 18 Security and policing 2 – – – 1 1 100.0% 2 Buses – – – – – – – Clinics – – – – – – – Museums & Art Galleries – – – – – – – Cemeteries 64 – – – 32 32 100.0% 64 Social rental housing 20 – 9 19 10 (9) -93.8% 20 Other – – – – – – –
Heritage assets – – – – – – – – Buildings – – – Other – – – –
Investment properties – – – – – – – – Housing development – – – Other – – –
Description Ref

70 Mid-year budget and performance assessment i.r.o. the first half of the 2012/13 financial year
Repairs and maintenance accurately budgeted for given the fact that the year-to-date variance is a mere 5%. It shows that the Swartland Municipality takes the safeguarding of its assets very seriously. We try our best to obtain the maximum benefit from each of our assets.
2011/12 Budget Year 2012/13Audited
OutcomeOriginal Budget
Adjusted Budget
Monthly actual YearTD actual YearTD
budgetYTD
varianceYTD
varianceFull Year Forecast
R thousands 1 %Other assets – 6 802 – 439 2 378 2 909 531 18.3% 6 802
General vehicles 2 916 – 140 839 1 466 627 42.8% 2 916 Specialised vehicles – – – – – – – – Plant & equipment 948 – 49 308 440 132 30.0% 948 Computers - hardware/equipment – – – – – – – Furniture and other office equipment 1 349 – 38 168 209 41 19.8% 1 349 Abattoirs – – – – – – – Markets – – – – – – – Civic Land and Buildings – – – – – – – Other Buildings 1 588 – 212 1 063 794 (269) -33.9% 1 588 Other Land – – – – – – – Surplus Assets - (Investment or Inventory) – – – – – – – Other – – – – – – –
Agricultural assets – – – – – – – – Biological assets – – – – – – – – Intangibles – – – – – – – – Total Repairs and Maintenance Expenditure – 18 197 – 1 588 8 167 8 598 431 5.0% 14 857
Specialised vehicles – – – – – – – –
Description Ref

QUALITY CERTIFICATION
If Joachim Jacobus Scholtz, Municipal Manager of Swartland Municipality (We01S), hereby certify that the mid-year budget and performance assessment has been in accordance with the Municipal Finance Management Act and regulations made under that Act.
Signature
Date
72 Mid-year budget and performance assessment i.r.o. the first half of the 2012/13 financial vear