Embed Size (px)
Citation preview
KEEI QUARTERLY ENERGY OUTLOOK
Korea Energy Economic Institute132 Naesonsunhwan-ro, Uiwang-si, Gyeonggi-doPhone: (031)420-2114Fax: (031)422-4958E-mail : [email protected] : http://www.keei.re.kr
KEEIMid-Term Korea
Energy Demand Outlook(2013~2018)
ISSN 2287-3007
May 2014
Volume 15
KEEI
Korea Energy Economic Institute
Mid-Term
Korea Energy Demand O
utlook(2013~2018)
May 2014
15호중기수요(영문)_무선표지 2014.9.23 3:5 PM 페이지1

ISSN 2287-3007
May 2014
Volume 15
KEEIMid-Term Korea Energy Demand Outlook(2013~2018)

·Director of research Lee, Seung-moon ([email protected])
·Primary energy-Oil Lee, Seung-moon ([email protected])
·Electricity Kim, Cheol-hyeon ([email protected])
·Town gas/Thermal energy Park, Myeong-deok ([email protected])
·Coal/Conversion Lee, Sang-youl ([email protected])
·Material·Research support Lim, Deok-oh ([email protected])
·Material·Research support Jang, Seon-hwa ([email protected])
·Statistical support Lee, Bo-hye ([email protected])
Phone: +82-31-420-2270, +82-31-420-2234
Fax: +82-31-420-2164
KEEI Mid-Term Korea Energy Demand Outlook (2013-2018)
The 「KEEI Mid-Term Korea Energy Demand Outlook (2013-2018)」analyzes energysupply and demand in Korea and makes mid-term forecasts on energy demand.
This report analyzes changes in energy supply and demand that have occurredsince 2000 and provides energy supply and demand forecast indexes for the nextfive years and information for government policy. It is intended to facilitategovernment efforts in setting and adjusting overall policy on energy supply anddemand.
This report was written and edited by the Energy Demand and Supply ForecastTeam under the Center for Energy Information and Statistics of KEEI.

Ⅰ. Energy Consumption in Korea ……………………………………………………… 9
Ⅱ. Mid-Term Energy Demand Outlook(2013~2018) …………………………… 23
1. Outlook methodology and premise ……………………………………………… 25
2. Primary energy demand outlook ………………………………………………… 31
Ⅲ. Energy Demand Outlook by Scenario ………………………………………… 41
1. Setting of economic growth scenarios ………………………………………… 43
2. Energy demand by scenario ……………………………………………………… 45
Ⅳ. Outlook Characteristics and Implications ……………………………………… 55
Reference Materials ……………………………………………………………………… 63
Contents
3http://www.keei.re.kr
Contents
Table of Contents for Titles

KEEI Korea Energy Demand Outlook
4 KOREA ENERGY ECONOMICS INSTITUTE
<TableⅠ-1> Change in major economic and energy consumption indicators …………14
<TableⅠ-2> Change in energy consumption of different manufacturing
industry types ……………………………………………………………………18
<TableⅠ-3> Change in primary energy consumption………………………………………21
<TableⅠ-4> Change in final energy consumption …………………………………………22
<TableⅡ-1> Premise on economic growth rate for mid-term outlook ……………………29
<TableⅡ-2> Temperature variable premise …………………………………………………30
<TableⅡ-3> Outlook on major economic and energy consumption indicators …………32
<TableⅡ-4> Primary energy demand outlook ………………………………………………38
<TableⅡ-5> Final energy demand outlook (2013~2018) …………………………………39
<TableⅢ-1> Economic growth scenarios ……………………………………………………44
<TableⅢ-2> Outlook on primary energy demand by scenario ……………………………45
<TableⅢ-3> Outlook on energy intensity by scenario ………………………………………46
<TableⅢ-4> Change in demand for major energy sources by scenario compared
to the baseline scenario …………………………………………………………48
<TableⅢ-5> Changes in demand in the final consumption sector by scenario
compared to the baseline scenario ……………………………………………51
Table of Contents for Tables

SummaryContents
5http://www.keei.re.kr
[FigureⅠ-1] Change in primary energy consumption ………………………………………12
[FigureⅠ-2] Change in major energy consumption indicators ……………………………14
[FigureⅠ-3] Change in primary energy consumption by energy source …………………16
[FigureⅠ-4] Change in consumption share by energy source ……………………………17
[FigureⅠ-5] Rate of change in consumption by final energy sector ………………………19
[FigureⅠ-6] Share of consumption of each final energy sector ……………………………20
[FigureⅡ-1] Outlook model structure …………………………………………………………25
[FigureⅡ-2] Outlook on primary energy demand ……………………………………………31
[FigureⅡ-3] Outlook on major energy consumption indicators ……………………………33
[FigureⅡ-4] Outlook on rate of increase in primary energy demand by energy source…35
[FigureⅡ-5] Outlook on consumption share of each energy source………………………36
[FigureⅡ-6] Outlook on rate of increase in demand by final energy sector ………………37
[FigureⅡ-7] Outlook on share of consumption of each final energy sector ………………37
[FigureⅢ-1] Outlook on GDP by scenario ……………………………………………………44
[FigureⅢ-2] Comparison of primary energy demand outlook among scenarios…………46
[FigureⅢ-3] Comparison of energy intensity outlook among scenarios …………………47
[FigureⅢ-4] Outlook on oil demand by scenario ……………………………………………48
[FigureⅢ-5] Outlook on LNG demand by scenario …………………………………………49
[FigureⅢ-6] Outlook on coal demand by scenario …………………………………………50
[FigureⅢ-7] Outlook on energy demand in the industrial sector by scenario ……………51
[FigureⅢ-8] Outlook on energy demand in the transport sector by scenario ……………52
Table of Contents for Figures

6 KOREA ENERGY ECONOMICS INSTITUTE
KEEI Korea Energy Demand Outlook
[FigureⅢ-9] Outlook on energy demand in the residential/commercial/public sector
by scenario …………………………………………………………………………53
[FigureⅣ-1] Changes in and outlook on share of consumption by the industrial
sector ………………………………………………………………………………59
[FigureⅣ-2] Changes in and outlook on share of primary energy taken up by major
energy sources for power generation …………………………………………60
[FigureⅣ-3] Changes in and outlook on oil dependence……………………………………61

Mid-Term Korea Energy Demand Outlook(2013~2018)

ChapterⅠ
Energy Consumption in Korea

Primary energy consumption rose at an annualized rate of 2.9% from 2000 through 2013.
Primary energy consumption rose at a modest rate, below the annualized economic
growth rate of 3.8% over the same period.
- In the 1990s, primary energy consumption rose at an annualized rate of 7.5%, which
was higher than the annualized economic growth rate of 6.5% in the same period. This
was attributable to sharp growth of energy-intensive industries, including the
petrochemical industry.
The lower rate of increase in primary energy consumption since 2000 is an outcome of
the slowdown in economic growth, the rise in international oil prices, and the shift
toward a low energy-consuming industrial structure.
- The spot price of Dubai crude oil persistently remained low in the 1990s, averaging
only USD 17.48 per barrel. It began to rise sharply in 2005 and reached USD 109.1 a
barrel in 2011.
- The fabricated metal industry expanded relatively sharply. It has a lower energy input
per unit of added value than the energy-intensive industries that led economic growth
in the 1990s, including the petrochemical and steel industries.
In the last five years (2008~2013), primary energy consumption rose at an annualized
rate of 3.1%, only slightly above the annualized economic growth rate of 3.0% during
the same period.
- In 2010 and 2011, the rate of increase in energy consumption rose significantly
compared to the economic growth rate due to a sharp increase in demand for raw
materials, an outcome of expansion of facilities in the steel and petrochemical
industries as well as increases in output in the same period.
- A rise in steel output after the establishment of new crude steel facilities in the steel
industry (Hyundai Steel’s Blast Furnace No. 1 and 2) triggered a surge in coking coal
consumption in 2010 and 2011.1)
ChapterⅠ Energy Consumption in Korea
11http://www.keei.re.kr
1) Annual increases in crude steel output from converters: 23.3% in 2010, 23.5% in 2011Annual increases inbituminous coal consumption for steel making: 31.2% in 2010, 16.7% in 2011

- The establishment of new facilities and a rise in output in the petrochemical industry
triggered greater demand for naphtha. Naphtha demand rose 7.0% in 2011 and 8.3% in
2012.2)
- Primary energy consumption rose less than 1% in 2012 and 2013 after having risen
sharply in 2011, partly because of a slowdown in energy consumption in the industrial
sector due to domestic economic recession.3)
Primary energy consumption excluding energy for raw material use
Excluding naphtha in the petrochemical industry and coking coal in the steel making
industry, which are energy sources used as industrial raw materials, primary energy
consumption rose at an annualized rate of only 2.5% from 2000 through 2013.
12 KOREA ENERGY ECONOMICS INSTITUTE
KEEI Korea Energy Demand Outlook
[FigureⅠ-1] Change in primary energy consumption
2) Percentage of primary energy consumption accounted for by naphtha in 2012: 16.9%3) Final energy consumption in the industrial sector rose 10.2% in 2010 and 8.5% in 2011. It rose only 1.1% in
2012 and 2.0% in 2013.

Consumption of petroleum products, excluding naphtha, fell at an annualized rate of
1.5% in the same period, owing to continued substitution of oil by other energy sources
such as town gas.
The share of primary energy accounted for by energy for raw material use (naphtha,
coking coal) remained at around 21% between 2000 and 2006, inclusive. It began to rise
in 2007 and reached 24.9% in 2013.
Key indicators related to energy consumption
Energy intensity (toe/KRW 1 million), which is a measure of national energy efficiency,
improved at an annualized rate of 0.9%, declining from 0.278 in 2000 to 0.247 in 2013.
- The annualized improvement rate from 2000 through 2008 reached 1.5%. However,
energy intensity deteriorated for three consecutive years afterwards, resulting in a
slower improvement in energy intensity for the entire period.
The deterioration in energy intensity from 2009 through 2011 was a result of a rise in
consumption of electricity and energy for raw material use (naphtha and coking coal), an
outcome of high production in energy-intensive industries.
- The sharp rise in electricity consumption for industrial use served to increase the
energy conversion loss, which further undermined energy intensity.
- The rise in production in energy-intensive industries after 2009 substantially buffered
the nation against the global financial crisis, but it negatively impacted the nation’s
overall energy efficiency.
The change in the energy conversion factor in 2012 translated into a slight improvement
in energy intensity.4) Improvements continued in 2013, resulting in a return to 2008~2009
levels of energy intensity.
Per-capita energy consumption rose from 4.10 toe in 2000 to 5.58 toe in 2013, indicating
annualized growth of 2.4%.
ChapterⅠ Energy Consumption in Korea
13http://www.keei.re.kr
4) When the energy conversion factor is standardized, energy intensity in 2012 should be about the same asthat in 2011.

Notes: p indicates that the figures are preliminary. The figures in parentheses are annual growth rates (%).
14 KOREA ENERGY ECONOMICS INSTITUTE
KEEI Korea Energy Demand Outlook
[FigureⅠ-2] Change in major energy consumption indicators
Category’09~’13’00~’13
2000 2009 2010 2011 2012 2013p
GDP 695 982 1,044 1,082 1,104 1,1353.8 3.0(KRW trillions) (8.8) (0.3) (6.3) (3.7) (2.0) (2.8)
Estimated population 47.0 49.2 49.4 49.8 50.0 50.2 0.5 0.5
(Million persons)
Primary energy192.9 243.3 263.8 276.6 278.7 280.4consumption 2.9 3.1
(Million toe) (6.4) (1.1) (8.4) (4.9) (0.7) (0.6)
Per-capitaconsumption 4.10 4.95 5.34 5.56 5.57 5.58 2.4 2.6
(toe)
GDP elasticity of energy 0.72 3.67 1.33 1.32 0.35 0.21 -9.0 -51.0
consumption
Energy intensity(toe/KRW 0.278 0.248 0.253 0.256 0.252 0.247 -0.9 0.11 million)
<TableⅠ-1> Change in major economic and energy consumption indicators
Annualized change (%)

Primary energy consumption by source
Oil consumption recorded relatively high annualized growth of 7.6% in the 1990s. It
rose at an annualized rate of only 0.8% between 2000 and 2013 as a result of the high oil
prices after 2000.
- Naphtha consumption for raw material use indicated sound annualized growth of 4.1%
during the same period.
- Excluding non-energy oil, oil consumption actually fell at an annualized rate of 1.5%
from 2000 through 2013, reflecting active substitution of oil by town gas, electricity,
and other sources of energy.
From 2000 through 2013, coal consumption rose at an annualized rate of 5.3%, which
was more rapid than in the 1990s, when it rose at an annualized rate of 4.4%.
- Anthracite consumption plummeted at an annualized rate of 11.7% in the 1990s.
It rebounded in the 2000s as a result of renewed demand for both residential and
commercial use, a response to the high oil prices, as well as increased demand for
industrial use. This is also attributable to bituminous coal consumption for power
generation increasing at a rapid annualized rate of 6.9%.
- Consumption of coking coal indicated annualized growth of 3.9% from 2000 through
2013 as a result of increases in steel output of 23.3% in 2010 and 23.5% in 2011 after
the establishment of new crude steel facilities in the steel industry.
LNG consumption rose at a very high annualized rate of 20.1% in the 1990s, and rose at
a high annualized rate of 8.1% from 2000 through 2013.
- The distribution of town gas is approaching a state of saturation, resulting in a slower
rise in LNG consumption for gas production. In contrast, LNG consumption for power
generation is rising rapidly.
- LNG consumption for power generation rose at an annualized rate of 11.5% in the
same period, greatly exceeding the annualized increase of 5.7% in consumption for
town gas production.
Consumption of nuclear energy indicated annualized growth of 7.5% in the 1990s, but
rose at an annualized rate of only 1.9% from 2000 through 2013.
- From 2000 through 2013, nuclear power generation capacity increased at an annualized
ChapterⅠ Energy Consumption in Korea
15http://www.keei.re.kr

rate of 3.2%, or by 7,000 MW in absolute terms by the end of the period. In the 1990s,
capacity rose at an annualized rate of 6.1% for a total expansion of 6,100 MW.
- As of the end of 2013, nuclear power generation capacity totaled 20,716 MW at 23
plants.
Electricity consumption went up at an annualized rate of 9.8% in the 1990s, and
continued to rise steadily at an annualized rate of 5.4% from 2000 through 2013.
- Electricity consumption also indicated relatively rapid growth after 2000, for several
reasons: low charges, diversification and increased use of electric-powered equipment,
high growth of the energy-intensive fabricated metal industry, and convenience in use.
- In the last five years, from 2008 through 2013, electricity consumption in the industrial
sector rose at an annualized rate of 5.7%, leading the rise in overall consumption,
whereas consumption in the residential/commercial/public sector rose at an annualized
rate of 2.8%.
Primary energy consumption structure
The consumption structure by energy source from 2000 through 2013 was largely
16 KOREA ENERGY ECONOMICS INSTITUTE
KEEI Korea Energy Demand Outlook
[FigureⅠ-3] Change in primary energy consumption by energy source

characterized by a drop in oil dependence and increasing dependence on LNG and coal.
The share accounted for by oil has continually fallen. It declined from 52.0% in 2000 to
37.8% in 2013.
The share taken up by coal is rising as a result of a rapid rise in consumption for power
generation and industrial use. It went up from 22.2% in 2000 to 29.2% in 2013.
The share accounted for by LNG was a mere 3.2% in 1990. It rose sharply to 9.8% in
2000 and to 18.4% in 2013 owing to increased supply of town gas and increased LNG
consumption for power generation.
The share accounted for by nuclear power has depended on when new nuclear power
plants have gone online. The share of primary energy accounted for by nuclear power
rose to approximately 16% through 2005, when new facilities were under construction.
- The share taken up by nuclear power declined steadily afterwards, reaching 10.4% in
2013, since no more than three new facilities5) were established after 2006.
ChapterⅠ Energy Consumption in Korea
17http://www.keei.re.kr
[FigureⅠ-4] Change in consumption share by energy source
5) Singori Nuclear Power Plant Unit 1 (March 2011, 1,000 MW), Singori Nuclear Power Plant Unit 2 (July 2012,1,000 MW), Sinwolseong Nuclear Power Plant Unit 1 (August 2012, 1,000 MW)

Final energy consumption by sector
Energy consumption in the industrial sector is rising slowly compared to the 1990s,
when it rose at an annualized rate of 8.8%. However, it still led the overall rise in final
energy consumption after 2000, recording annualized growth of 3.5%.
- Excluding energy for raw material use, energy consumption in the industrial sector
from 2000 through 2013 went up at an annualized rate of 2.8%.
- Energy consumption in the relatively low energy-consuming fabricated metal industry
rose an annualized 5.8% during the same period, indicating the most rapid growth in
the entire manufacturing sector.
- The petrochemical industry and primary metal industry (steel making), which are
energy-intensive, indicated relatively high annualized increase rates of 4.2% and 4.3%,
respectively, between 2000 and 2013 in energy consumption.
18 KOREA ENERGY ECONOMICS INSTITUTE
KEEI Korea Energy Demand Outlook
(Unit: Million toe)
Industry’08~’13’00~’13
2000 2009 2010 2011 2012 2013
Food and 1.6 1.6 1.7 1.7 1.7 1.7 0.4 1.5tobaccoTextiles and 3.5 2.0 2.1 2.1 1.9 1.6 -5.7 -4.7clothingLumber and 2.2 0.2 0.2 0.2 0.2 0.2 1.7 1.7printing
Oil and 35.9 50.9 52.9 57.4 58.4 60.5 4.2 4.2petrochemicalsBase metals and 5.4 5.0 5.2 5.5 5.0 4.9 -1.0 -2.4mineralsPrimary metals 17.4 19.0 24.7 28.2 27.8 28.4 4.3 6.1Fabricated 5.1 7.5 8.8 9.7 10.1 10.6 5.8 6.5metalsOthers 3.4 3.0 3.4 3.3 4.3 3.7 0.5 4.5
Total for manufac- 74.7 92.0 101.8 110.7 112.0 114.0 3.3 4.1turing sector
<TableⅠ-2> Change in energy consumption of different manufacturing industry types
Annualized change (%)
Notes: 1) Considering that the conversion factor was changed after 2007, data for before 2007 was converted based onthe new conversion factor for consistency in energy consumption by industry type.
2) For anthracite and new and renewable energy/other energy, only statistics for the overall manufacturing sectorare tallied. There are no statistics by industry type, so they are excluded from the target of analysis ofconsumption by industry type.

- In contrast, energy consumption in the basic metal and mineral industry, which was one
of the three major energy-intensive industries in the past, fell at an annualized rate of
1.0% between 2000 and 2013. Energy consumption in this industry fell below that of
the fabricated metal industry in 2014.
Energy consumption in the transport sector rose at an annualized rate of 7.9% in the
1990s. It went up at a substantially lower annualized rate of only 1.4% from 2000
through 2013.
- The slowdown in the increase in energy consumption in the transport sector is
attributable to the facts that the number of automobiles registered on the road
nationwide has nearly reached the point of saturation and that the use of automobiles
has been discouraged by the sharp rise in oil prices and the slowdown in economic
growth.
Energy consumption in the residential/commercial/public sector rose at an annualized
rate of 3.5% in the 1990s, but only at an annualized rate of 1.5% from 2000 through
2013.
- The rate of increase in energy consumption in this sector rises and falls with the
temperature, but is essentially on a downward trend owing to slower growth in income
levels and the population.
ChapterⅠ Energy Consumption in Korea
19http://www.keei.re.kr
[FigureⅠ-5] Rate of change in consumption by final energy sector

The share of energy consumption taken up by the industrial sector remained at around
55% and 56% through the mid-2000s. Its share steadily rose to above 60% after 2011.
- The share accounted for by the residential/commercial/public sector dropped after
about 2005 to stand at approximately 20.2% in 2013.
- The share of energy consumption accounted for by the transport sector remained at
around 20 to 21% from 2000 through 2007, but began a downward trend afterwards
and reached 17.6% in 2013.
20 KOREA ENERGY ECONOMICS INSTITUTE
KEEI Korea Energy Demand Outlook
[FigureⅠ-6] Share of consumption of each final energy sector

Note: p indicates that the figures are preliminary. The figures in parentheses are year-on-year changes (%).
ChapterⅠ Energy Consumption in Korea
21http://www.keei.re.kr
Category’08~’13’00~’13
2000 2009 2010 2011 2012 2013p
742.6 778.5 794.3 801.6 827.7 826.80.8 1.7(3.2) (2.4) (2.0) (0.9) (3.2) (-0.1)
494.5 427.5 433.2 413.5 412.2 405.8-1.5 -0.9(3.2) (0.9) (1.3) (-4.5) (-0.3) (-1.6)
66.5 108.4 121.0 130.9 128.1 129.65.3 4.5(12.5) (4.0) (11.7) (8.1) (-2.1) (1.1)
47.1 87.6 93.8 99.1 96.7 87.55.8 3.9(15.8) (8.7) (7.0) (5.6) (-2.5) (0.9)
14.6 26.1 33.1 35.6 38.5 40.38.1 8.0(12.3) (-4.9) (26.8) (7.6) (8.1) (4.7)
5.6 5.6 6.5 7.8 7.7 8.33.0 8.3(-7.5) (1.4) (14.7) (21.0) (-2.3) (8.2)
109.0 147.8 148.6 154.7 150.3 138.81.9 -1.7(5.7) (-2.1) (0.6) (4.1) (-2.3) (-7.7)
2.1 5.5 6.1 6.6 8.0 8.910.6 8.2(17.9) (5.4) (10.7) (9.1) (21.4) (10.6)
192.9 243.3 263.8 276.6 278.7 280.42.9 3.1(6.4) (1.1) (8.4) (4.9) (0.7) (0.6)
148.2 183.3 198.0 204.1 204.9 205.5
(6.8) (1.5) (8.0) (3.1) (0.4) (0.3)2.5 2.6
Oil(Million bbl)
-Excludingnon-energy oil
Coal(Million ton)
-Excluding coking coal
LNG(Million ton)
Hydro(TWh)
Nuclear power(TWh)
Other(Million toe)
Primary energy(Million toe)
Primary energy-Excluding coking coal
<TableⅠ-3> Change in primary energy consumption
Annualized change (%)

Note: p indicates that the figures are preliminary. The figures in parentheses are year-on-year changes (%).
22 KOREA ENERGY ECONOMICS INSTITUTE
KEEI Korea Energy Demand Outlook
Category’08~’13’00~’13
2000 2009 2010 2011 2012 2013p
83.9 106.1 116.9 126.9 128.3 130.93.5 4.2(5.1) (-0.3) (10.2) (8.5) (1.1) (2.0)
42.0 46.1 51.1 54.3 54.6 56.02.8 3.9(5.4) (-0.5) (10.8) (6.3) (0.4) (2.7)
30.9 35.9 36.9 36.9 37.1 37.11.4 0.7(8.1) (0.4) (2.8) (-0.2) (0.7) (0.0)
35.0 40.0 41.7 42.1 42.7 42.51.5 1.1
(1.2) (-0.8) (4.3) (0.9) (1.3) (-0.4)
149.9 182.1 195.6 205.9 208.1 210.62.7 2.9(4.7) (-0.3) (7.4) (5.2) (1.1) (1.2)
105.2 122.1 129.8 133.3 134.4 135.7
(4.7) (-0.3) (6.3) (2.7) (0.8) (1.0) 2.0 2.1
698.7 752.2 767.4 778.9 796.5 800.41.1 1.6(1.3) (1.5) (2.0) (1.5) (2.3) (0.5)
450.7 401.2 406.3 390.8 381.0 379.3-1.3 -1.2(-0.4) (-0.7) (1.3) (-3.8) (-2.5) (-0.4)
3.3 8.4 9.3 10.6 9.9 10.49.1 4.7(37.1) (2.0) (10.1) (14.8) (-7.1) (5.2)
27.0 27.5 34.3 39.3 38.5 39.12.9 4.6(4.6) (-11.8) (24.5) (14.7) (-1.9) (1.6)
7.6 6.8 7.0 7.5 7.0 7.1-0.5 -1.5(2.9) (-11.1) (3.9) (6.8) (-6.4) (0.6)
239.5 394.5 434.2 455.1 466.6 474.85.4 5.2(11.8) (7.0) (10.1) (4.8) (2.5) (1.8)
12.0 18.4 20.0 21.7 23.8 24.55.9 5.8(19.5) (2.7) (8.3) (8.5) (9.7) (3.0)
3,248 6,417 7,064 7,535 8,875 9,5328.6 8.8(15.8) (2.5) (10.1) (6.7) (17.8) (7.4)
Industry(Million toe)
-Excluding forraw materials
Transport(Million toe)
Residential/commercial/Public
(Million toe)
Total(Million toe)
Total-Excluding forraw materials
Oil(Million bbl)
-Excludingnon-energy oil
Anthracite(Million ton)
Bituminous coal(Million ton)
-Excludingcoking coal
Electricity(TWh)
Town gas(Billion m3)
Thermal and other(Thousand toe)
<TableⅠ-4> Change in final energy consumption
Annualized change (%)

ChapterⅡMid-Term Energy Demand Outlook
(2013~2018)
1. Outlook methodology and premise
2. Primary energy demand outlook

A. Model structure and methodology
Model structure for mid-term energy demand outlook
Primary energy demand consists of final energy demand and energy demand in the
transformation sector. Forecasts are made by first breaking down final energy demand by
different energy sources such as petroleum products, town gas, electricity, coal, and
thermal and other energy.
Each energy source is broken down by purpose of use or demand sector, such as
industry, transport, residential/commercial, and public/other. Consumption patterns and
characteristics per source/sector are reflected when forecasting demand.
Chapter Ⅱ Mid-Term Energy Demand Outlook (2013-2018)
25http://www.keei.re.kr
Outlook methodology and premise1
[FigureⅡ-1] Outlook model structure

Use of econometric model for demand outlook by final energy source
A model by energy source/sector (use) is estimated by quarterly time-series data, after
which input premise values (GDP, temperature variables, energy prices) are applied to
forecast demand.
- The forecast results are tallied by energy source and sector to determine the total final
energy forecast value.
Major explanatory variables that are used for mid-term metric model estimation and
outlook are data on GDP, index of industrial product by industry type, energy prices per
source/sector, and cooling degree days/heating degree days.
From among major explanatory variables, the premise values of the index of industrial
product by industry type are determined within the model based on GDP.
ARDL (Autoregressive Distributed Lag) is used as a basic model for demand outlook by
specific use.
The following method is adopted for forecasts in the transformation sector.
The fuel input amount is needed to produce secondary energy demand, such as
electricity, town gas, and thermal energy that is forecasted in the area of final energy.
This fuel input amount is determined for each of the power generation, town gas
production, and district heating thermal energy production sectors.
Forecasting the fuel input needed for electric power generation
- An outlook is made on the total electricity supply in consideration of total electricity
demand, self-consumption, and power transmission/power distribution loss rate.
- The LP (Linear Programming) model is used to forecast the power generation amount
by energy source required to satisfy total electricity supply.
- Generating efficiency forecasts are applied to the forecasted power generation amount
by source to determine the fuel input amount.
- The “6th Electricity Supply and Demand Plan” is used as a major premise for
forecasting energy demand in the power generation sector.
A similar method is employed to come up with forecasts on the fuel input amount in the
town gas and thermal energy production sector. The amount is determined based on
26 KOREA ENERGY ECONOMICS INSTITUTE
KEEI Korea Energy Demand Outlook

reverse order of the ‘energy conversion process’.
Oil demand outlook method
Final energy consumption is categorized into three areas - transport, industry, and
residential/commercial/public/other.
A forecast model is established for each major product in each sector.
- Five products (gasoline, diesel, heavy oil, jet fuel, LPG) in the transport sector
- Six products (kerosene, diesel, heavy oil, LPG, naphtha, asphalt) in the industrial sector
- Four products (kerosene, diesel, heavy oil, LPG) in the residential/commercial/public
and other sector
Major explanatory variables of each model include GDP (or index of industrial product),
product prices, heating degree days, seasonal variables, and a lagged variable of actual
consumption. Specific model settings are used for each product.
With regards to oil injected into the transformation sector (power generation, town gas
production, thermal energy production), demand forecasts are determined for secondary
energy sources (electricity, town gas, thermal energy), after which the input requirement
is determined based on the transformation sector module.
- At this point, relations with other energy sources that can substitute for oil are
simultaneously considered.
Electricity demand outlook method
Electricity demand is categorized into four sectors - for industrial use, for housing, for
commercial/public use, and for transport.
Demand patterns and characteristics by sector are considered for individual model
estimations, after which input premise values are used to forecast electricity demand for
the forecast period.
In each model’s estimations, major explanatory variables that are used are quarterly
GDP, index of industrial product, real power rates (unit cost of sales) by sector, and
quarterly temperature information (cooling degree days and heating degree days).
- The index of industrial product is used as an explanatory variable instead of GDP to
forecast electricity demand for industrial use.
Chapter Ⅱ Mid-Term Energy Demand Outlook (2013-2018)
27http://www.keei.re.kr

LNG demand outlook method
For LNG demand forecasts, LNG demand is categorized into demand for town gas
production and demand for power generation.
For forecasts on LNG demand for town gas production, town gas demand in the final
sector is forecasted first.
- Town gas demand is categorized into different uses, such as for residential, general, and
industrial use. An outlook is made for each use, using price, income, such temperature
variables as CDD and HDD, and number of customers as variables from the supply
perspective.
Next, an outlook is made on LNG demand for town gas production in consideration of
the input ratio between LNG and LPG, which are raw materials for town gas production,
as well as self-consumption and loss ratio.
LNG demand for power generation is determined through an LP model, which forecasts
the amount of power generation by source in the power generation sector and the energy
input amount by source.
- The amount of LNG that is directly imported by businesses is separately estimated and
added to the LNG demand that is assigned to the transformation sector to determine
total LNG demand.
Coal demand outlook method
For coal demand, a categorization is first made into anthracite and bituminous coal
demand in the final consumption sector. Forecasts are made on demand for each source
and use (industry, residential/commercial, and power generation), after which they are
summed up. For coal demand for power generation, the coal input amount for power
generation that is forecast in the transformation sector is used.
Anthracite demand is categorized into demand for residential/commercial use and for
industrial use. The major explanatory variables that are used are GDP, a lagged variable,
and seasonal variables.
Bituminous coal demand for forecasting is categorized into demand for steel making,
cement, and other industries. The major explanatory variables that are used for each
28 KOREA ENERGY ECONOMICS INSTITUTE
KEEI Korea Energy Demand Outlook

model include the pig iron production amount, cement production amount, and index of
industrial product.
The major explanatory variables that are used for thermal energy and other energy
demand outlook models include GDP, index of industrial product, temperature variables
(CDD, HDD), a lagged variable, and seasonal variables.
B. Outlook premise
Data on income, price, and temperature, which have the largest impact on energy demand,
is used as major input premises for the mid-term energy demand outlook. The GDP
growth rate was set for income forecasts, and international oil prices were adopted for
price forecasts.
It was assumed that the GDP growth rate would rise from around 2.8% in 2013 to
approximately 3.7% in 2014, which is about the potential growth rate. For economic
growth rates after 2014, the premise is that economic growth will gradually decelerate
from the potential growth rate.
Notes: p indicates that the figures are preliminary. The 2014 economic growth rate is from KDI (KDI EconomicOutlook, November 2013). The economic growth rates from 2015 through 2018 are the premise values in “2013Long-term Korea Energy Demand Outlook” of KEEI.
For temperature variables that were used for the outlook, including CDD and HDD, the
average temperature data for the last ten years was used.
It was assumed that average year temperatures would be maintained during the forecast period.
- Temperatures in January and February 2014, when there were abnormally high
temperatures, were excluded when determining average temperature premises.
Chapter Ⅱ Mid-Term Energy Demand Outlook (2013-2018)
29http://www.keei.re.kr
Category 2013p 2014 2015 2016 2017 2018 Annualized(%)
GDP growth rate (%) 2.8 3.7 3.7 3.7 3.6 3.5 3.6
<TableⅡ-1> Premise on economic growth rate for mid-term outlook

Notes: CDD (HDD) refers to the difference between the daily average temperature and baseline when the daily averagetemperature is higher (lower) than the baseline (18℃). Monthly CDD/HDD is the sum of the daily degree daysof the corresponding month.
To consider the influence that energy prices have on energy demand, international crude
oil prices were used as the outlook premise.
Base international oil prices are forecast at USD 102.96 per barrel for Dubai oil for 2014,
which is an approximately 2.2% drop from USD 105.25 per barrel in 2013.
For international oil prices for 2014, base oil prices that were forecast by KEEI (January
2014) were used. The forecast international oil prices were used to come up with
forecasts for domestic petroleum product and town gas prices.
The premise for domestic petroleum product and town gas prices for the forecast period
after 2014 is that the real price level at the time that the forecast is made in 2014 will be
maintained.
30 KOREA ENERGY ECONOMICS INSTITUTE
KEEI Korea Energy Demand Outlook
Average-2.5 1.0 5.3 11.9 18.1 22.9 24.7 26.1 21.7 15.5 7.7 -0.6temperature
CDD 0 0 0 3 37 147 212 257 102 9 0 0
HDD 632 498 393 187 31 1 0 0 8 88 312 57
CategoryJan Feb Mar Apr May Jun Jul Aug Sep Oct Nov Dec
2014 ~ 2018
<TableⅡ-2> Temperature variable premise

Primary energy demand is expected to rise at an annualized rate of 2.7% from 2013
through 2018 and reach 319.6 million toe in 2018.
Demand increased at only a modest rate in 2013 because of the economic downturn but
will probably begin to accelerate in 2014, when the economy is expected to enter a full
recovery.
This is somewhat lower than the annualized economic growth rate of 3.6% of the same
period.
* Economic growth rate (annualized, %): 3.0% in ’08 ~ ’13 → 3.6% in ’13 ~ ’18
* Primary energy increase rate (annualized, %): 3.1% in ’08 ~ ’13 → 2.7% in ’13 ~ ’18
Outlook on major energy indicators
Energy intensity is forecast to improve at an annualized rate of 0.9%, declining from
0.247 in 2013 to 0.236 in 2018.
Chapter Ⅱ Mid-Term Energy Demand Outlook (2013-2018)
31http://www.keei.re.kr
Primary energy demand outlook2
[FigureⅡ-2] Outlook on primary energy demand

* Energy intensity (toe/KRW 1 million): 0.247 in 2007, 0.247 in 2013, 0.236 in 2018
Per-capita energy demand is expected to rise at an annualized rate of 2.3% in tandem
with an increase in income levels. It will likely rise from 5.58 toe in 2013 to around 6.25
toe in 2017.
* Per-capita energy consumption (TOE): 4.87 in 2007, 5.58 in 2013, 6.25 in 2018
- Per-capita energy consumption should remain high compared to major OECD
countries.
* Comparison with other countries in per-capita energy consumption (Year 2011):
(OECD average) 4.29, (Japan) 3.61, (Germany) 3.76, (UK) 3.03, (US) 7.03
The GDP elasticity of primary energy demand from 2013 through 2018 should be
around 0.7.
* GDP elasticity of energy consumption: 1.0 in ’08 ~ ’13, 0.7 in ’13 ~ ’18
Notes: p indicates that the figures are preliminary. The figures in parentheses are annual growth rates (%).
32 KOREA ENERGY ECONOMICS INSTITUTE
KEEI Korea Energy Demand Outlook
CategoryAnnualizedchange (%)( ’13~’18)
2013p 2014 2015 2016 2017 2018
GDP 1,134 1,177 1,220 1,265 1,311 1,3573.6(KRW trillions) (2.8) (3.7) (3.7) (3.7) (3.6) (3.5)
Estimated population 50.2 50.4 50.6 50.8 51.0 51.1 0.4
(Million persons)
Primary energy280.4 287.6 295.3 303.6 312.3 319.6consumption 2.7
(Million toe) (0.6) (2.6) (2.7) (2.8) (2.8) (2.4)
Per-capitaconsumption 5.58 5.70 5.83 5.98 6.13 6.25 2.3
(toe)
GDP elasticityof energy 0.22 0.70 0.72 0.77 0.79 0.68 0.72*
consumption
Energy intensity(toe/KRW 0.247 0.244 0.242 0.240 0.238 0.236 -0.91 million)
<TableⅡ-3> Outlook on major economic and energy consumption indicators

Outlook by energy source
Oil demand is projected to rise at an annualized rate of 0.5% from 2013 through 2018.
- Oil demand for fuel will likely decline at an annualized rate of 1.1% during the forecast
period due to the high oil prices. However, naphtha demand for raw material use in the
petrochemical industry will go up at an annualized rate of 1.8% and lead the growth in
overall oil demand.
Coal demand is projected to rise at an annualized rate of 4.8% during the forecast period.
- Bituminous coal demand is forecast to indicate annualized growth of 4.9% during the
forecast period as it is expected that demand for power generation will rise significantly
at an annualized rate of 6.0%.
- Bituminous coal demand for power generation will likely remain stagnant through
2013 since there are no plans to build new power generation facilities. However, a
substantial rise in demand is expected as a result of major facility expansions6) from
2014 through 2017 according to the 6th Electricity Supply and Demand Plan.
Chapter Ⅱ Mid-Term Energy Demand Outlook (2013-2018)
33http://www.keei.re.kr
[FigureⅡ-3] Outlook on major energy consumption indicators
6) New power generation facilities with total capacity of 12,520 MW (15 facilities) are planned over four years.By the end of 2017, facility capacity will likely rise 53.5% from 2013’s capacity of 23,409 MW.

- Anthracite demand is forecast to indicate an annualized increase of only 3.3% during
the forecast period owing to a slowdown in demand for industrial use, which recorded
a double-digit annualized increase rate since 2000.
LNG demand is forecast to fall at an annualized rate of 0.2% during the forecast period,
which compares starkly with the annualized rate of increase of 8.3% during the period of
2008 to 2013.
- LNG demand for town gas production is projected to rise at an annualized rate of 2.7%
during the forecast period as a result of an increase in town gas consumption for
industrial use, which should rise at an annualized rate of 4.7%.
- LNG demand for power generation, which is used to handle peak load, will likely drop
between 2016 and 2018 as a result of establishment of numerous new nuclear power
and coal-fired power generation facilities.
Nuclear power generation is projected to rise at an annualized rate of 7.4% during the
forecast period. New power plants will be established from 2013 through 2018
according to the national power supply plan.
- New nuclear power plants with total capacity of 5,200 MW will be built during the
forecast period. Total facility capacity will rise from 20,716 MW in 2012 to 27,316
MW in 2018.
- Along with Singori Nuclear Power Plant Units 1 and 2, which are already in operation,
operation of Sinwolseong Nuclear Power Plant Unit 2 (1,000 MW) should be launched
at the end of 2014. Construction is expected to be completed for Singori Nuclear Power
Plant Unit 3 (1,400 MW) in 2015; Singori Nuclear Power Plant Unit 4 (1,400 MW) in
2016; Sinhanul Nuclear Power Plant Unit 1 (1,400 MW) in 2017; and Sinhanul
Nuclear Power Plant Unit 2 (1,400 MW) in 2018.
Consumption of new & renewable energy is expected to rise at a relatively high
annualized rate of around 7.8% during the forecast period.
Electricity demand will likely continue high growth of an annualized 3.5% during the
forecast period, led by demand for industrial use, which should rise at an annualized rate
of 4.7%.
34 KOREA ENERGY ECONOMICS INSTITUTE
KEEI Korea Energy Demand Outlook

- This is somewhat higher than the annualized economic growth rate of 3.6% during the
same period.
Outlook on energy mix
The share of primary energy demand accounted for by oil peaked at 63% in 1994 and
has been steadily declining ever since. It dropped to 37.8% in 2013, and it is projected to
continue to fall during the forecast period to around 33.8% by 2018.
The share accounted for by LNG went up to 18.7% in 2013, an outcome of a sharp rise
in consumption. The share is expected to decline to 16.2% in 2018 as a result of a fall in
LNG demand for power generation starting in 2014.
If new nuclear power plants become operational according to the 6th Electricity Supply
and Demand Plan, the total share of primary energy accounted for by nuclear power will
likely go up from 10.4% in 2013 to 13.1% in 2017.
The share taken up by coal rose steadily in the 2000s owing to a rapid increase in coal
consumption for power generation and industrial use. It is forecast to rise from 29.2% in
2013 to 32.3% in 2018 owing to the establishment of new bituminous coal-fired power
generation facilities between 2014 and 2018 and the resulting increase in demand.
Chapter Ⅱ Mid-Term Energy Demand Outlook (2013-2018)
35http://www.keei.re.kr
[FigureⅡ-4] Outlook on rate of increase in primary energy demand by energy source

Energy demand by sector
Final energy demand is forecast to rise at an annualized rate of 2.2% from 2013 through
2018 and reach 234.8 million toe by 2018.
Energy demand in the industrial sector is expected to rise at a robust annualized rate of
2.9% on the assumption that the actual economic growth rate will match the potential
annualized growth rate of 3.6% during the same period.
- Industrial production is expected to lead economic growth during the forecast period.
Energy demand in the industrial sector is forecast to increase relatively quickly.
- Oil accounted for 46% of energy consumption in the industrial sector in 2013. Oil
demand is expected to rise at an annualized rate of 1.3% owing to a steady rise in
demand for raw material use. Electricity and town gas will likely indicate relatively
high annualized increases of 4.7% and 4.7% respectively.
The rate of increase in energy demand in the transport sector is expected to fall to an
annualized 1.3% as the number of registered cars should nearly reach the saturation level
during the forecast period.
- Oil demand for transport will likely increase at an annualized rate of 1.3%, while town
gas is expected to record an annualized rise of 2.0% due to increased use of CNG
buses.
36 KOREA ENERGY ECONOMICS INSTITUTE
KEEI Korea Energy Demand Outlook
[FigureⅡ-5] Outlook on consumption share of each energy source

Energy demand in the residential/commercial/public sector is projected to rise at an
annualized rate of 0.8% during the forecast period.
- Demand for electricity and town gas is projected to rise at annualized rates of 2.1% and
0.8%, respectively. Oil demand is forecast to fall at an annualized rate of 4.3% as a
result of replacement of oil for fuel by other energy sources.
Demand in the industrial sector will increase relatively rapidly during the forecast period.
The share of consumption taken up by the industrial sector will likely go up by 2.1%p. In
contrast, the shares accounted for by the transport sector and residential/
commercial/public sector are expected to decline 0.7%p and 1.4%p, respectively.
Chapter Ⅱ Mid-Term Energy Demand Outlook (2013-2018)
37http://www.keei.re.kr
[FigureⅡ-6] Outlook on rate of increase in demand by final energy sector
[FigureⅡ-7] Outlook on share of consumption of each final energy sector
Notes: p indicates that the figures are preliminary.

Notes: 1) The new energy conversion factor (Article 1 of the Enforcement Regulations of the Basic Energy Act) wasapplied to the calculation of the forecast figures for 2012 and onwards. If the previous energy conversionfactor is applied, the increase in primary energy demand in 2012 is 2.6% (2.0% when excluding demand forraw material use). For 2013 and onwards, the increase rate is about the same between the previous and newenergy conversion factor.
2) p indicates that the figures are preliminary. The figures in parentheses are annual growth rates (%).
38 KOREA ENERGY ECONOMICS INSTITUTE
KEEI Korea Energy Demand Outlook
CategoryAnnualizedchange (%)( ’13~’18)
2013p 2014 2015 2016 2017 2018
826.8 832.0 829.5 834.8 840.3 847.1 0.5(-0.1) (0.6) (-0.3) (0.6) (0.7) (0.8)
405.8 400.1 388.5 385.2 383.3 383.2 -1.1(-1.6) (-1.4) (-2.9) (-0.8) (-0.5) (0.0)
129.6 130.9 136.9 143.6 157.7 163.5 4.8(1.1) (1.0) (4.6) (4.9) (9.8) (3.6)
97.5 97.9 103.0 108.8 122.1 127.1 5.4(0.9) (0.4) (5.2) (5.6) (12.2) (4.1)
40.3 41.1 42.1 41.9 40.7 39.8 -0.2(4.7) (2.0) (2.6) (-0.5) (-2.9) (-2.3)
8.3 8.2 8.2 8.2 8.2 8.2 -0.2(8.2) (-1.1) (0.0) (0.2) (-0.2) (0.0)
138.8 158.4 169.1 182.8 182.3 198.0 7.4(-7.7) (14.2) (6.7) (8.1) (-0.3) (8.6)
8.9 9.6 10.4 11.3 12.1 12.9 7.7(10.6) (7.6) (9.0) (8.5) (7.1) (6.2)
280.4 287.6 295.3 303.6 312.3 319.6 2.7(0.6) (2.6) (2.7) (2.8) (2.8) (2.4)
205.5 210.7 216.6 223.3 230.4 236.32.8
(0.3) (2.5) (2.8) (3.1) (3.2) (2.6)
<TableⅡ-4> Primary energy demand outlook
Oil(Million bbl)
-Excludingnon-energy oil
Coal(Million ton)
-Excluding coking coal
LNG(Million ton)
Hydro-electric(TWh)
Nuclear power(TWh)
Other(Million toe)
Total primary energy(Million toe)
Total primary energy-Excludingcoking coal

Notes: 1) If the previous energy conversion factor is applied, the increase in final energy demand in 2012 is around2.2%. For 2013 and onwards, the increase rate is roughly the same between the previous and new energyconversion factor.
2) p indicates that the figures are preliminary. The figures in parentheses are annual growth rates (%).
Chapter Ⅱ Mid-Term Energy Demand Outlook (2013-2018)
39http://www.keei.re.kr
CategoryAnnualizedchange (%)( ’13~’18)
2013p 2014 2015 2016 2017 2018
130.9 135.5 139.6 143.7 147.4 151.02.9(2.0) (3.5) (3.0) (2.9) (2.6) (2.4)
56.0 58.6 60.9 63.3 65.5 67.63.8(2.7) (4.5) (4.0) (4.0) (3.5) (3.2)
37.1 37.7 38.3 38.8 39.3 39.71.3(0.0) (1.6) (1.4) (1.3) (1.3) (1.2)
42.5 42.3 42.8 43.3 43.7 44.1 0.8(-0.4) (-0.4) (1.1) (1.1) (1.0) (0.9)
210.6 215.6 220.7 225.7 230.4 234.82.2(1.2) (2.4) (2.4) (2.3) (2.1) (1.9)
135.7 138.6 142.0 145.4 148.5 151.5
(1.0) (2.2) (2.4) (2.4) (2.2) (2.0)2.2
800.4 809.1 817.0 825.1 832.2 838.90.9(0.5) (1.1) (1.0) (1.0) (0.9) (0.8)
379.3 377.2 376.0 375.4 375.1 375.0-0.2(-0.4) (-0.6) (-0.3) (-0.1) (-0.1) (0.0)
10.4 11.0 11.4 11.8 12.0 12.23.3(5.2) (5.7) (3.8) (3.1) (2.2) (1.5)
39.1 40.3 41.3 42.2 43.1 44.02.4(1.6) (2.9) (2.6) (2.2) (2.1) (2.0)
7.1 7.3 7.4 7.5 7.5 7.61.4(0.6) (2.4) (1.7) (1.1) (0.9) (0.8)
474.8 487.8 506.4 525.4 544.9 564.53.5(1.8) (2.7) (3.8) (3.8) (3.7) (3.6)
25.1 25.9 26.5 27.1 27.5 28.42.5(2.5) (3.0) (2.6) (2.2) (1.6) (3.3)
9,532 10,298 11,089 11,874 12,565 13,192 6.7(7.4) (8.0) (7.7) (7.1) (5.8) (5.0)
<TableⅡ-5> Final energy demand outlook (2013~2018)
Industry(Million toe)
-Excluding forraw materials
Transport(Million toe)
Residential/commercial/Public
(Million toe)
Total(Million toe)
Total-Excluding forraw materials
Oil(Million bbl)
-Excluding non-energy oil
Anthracite(Million ton)
Bituminous coal(Million ton)
-Excludingcoking coal
Electricity(TWh)
Town gas(Billion m3)
Thermal and other(Thousand toe)

ChapterⅠEnergy Demand Outlook by
Scenario
1. Setting of economic growth scenarios
2. Energy demand by scenario
ChapterⅢ

Need for scenario-based outlook.
Energy consumption in Korea is sensitive to shocks of every kind to the global economy,
including the foreign exchange crisis in 1998, global financial crisis in 2009, and the
surge in international energy prices since the mid-2000s.
- The Korean economy is heavily dependent on other countries. It is more exposed to
exogenous factors, including business fluctuations in the US and China, the fiscal crisis
in the euro zone, and sanctions imposed by the international community on Iran.
- This, coupled with the uncertainties in future economic conditions, increases the need
to provide economic leaders a wider range of energy demand forecasts.
This report presents high and low economic growth scenarios, in addition to the baseline
growth scenario, and provides an energy demand outlook for each scenario in
consideration of uncertainties in the energy market, including changes in the global
economy and international oil prices.
Setting of economic (GDP) growth scenarios
For the baseline scenario, an outlook by KDI (November 2013) was used for the
economic growth rate (3.7%) of 2014. The premise values of the “2013 Long-Term
Korea Energy Demand Outlook” were used for the growth rates between 2014 and
2017.
The economic growth scenarios for 2014 and onwards were set by applying ±1.0%p to
the baseline scenario growth rate, considering that there is greater economic uncertainty.
The economy is expected to grow at an annualized rate of 3.6% from 2013 through 2018
according to the baseline scenario. The corresponding figure is an annualized rate of
4.6% in the high-growth scenario and an annualized rate of 2.6% in the low-growth
scenario.
Chapter Ⅲ Energy Demand Outlook by Scenario
43http://www.keei.re.kr
Setting of economic growth scenarios1

Notes: Figures in parentheses are annual changes (%).
44 KOREA ENERGY ECONOMICS INSTITUTE
KEEI Korea Energy Demand Outlook
(Unit: KRW trillions)
Category Baseline High-growth scenario Low-growth scenario
2014 1,177 (3.7) 1,188 (4.7) 1,165 (2.7)
2015 1,220 (3.7) 1,244 (4.7) 1,197 (2.7)
2016 1,265 (3.7) 1,302 (4.7) 1,229 (2.7)
2017 1,311 (3.6) 1,362 (4.6) 1,261 (2.6)
2018 1,357 (3.5) 1,424 (4.5) 1,293 (2.5)
Annualizedgrowth rate (%) 3.6 4.6 2.6
(’13~’18)
<TableⅢ-1> Economic growth scenarios
[FigureⅢ-1] Outlook on GDP by scenario

Chapter Ⅲ Energy Demand Outlook by Scenario
45http://www.keei.re.kr
Outlook on primary energy demand for each scenario
Primary energy demand is forecast to rise at an annualized rate of 2.7% during the
forecast period (Year 2013~2018) and reach 319.6 million toe in 2018. Primary energy
demand is expected to indicate an annualized rise of 3.2% in the high-growth scenario
and an annualized increase of 2.1% in the low-growth scenario.
- Compared to the baseline scenario, primary energy demand in 2018 is 2.7% higher in
the high-growth scenario and 2.7% lower in the low-growth scenario.
Notes: Figures in parentheses are annual changes (%).
(Unit: 1 million TOE)
Category Baseline High-growth scenario Low-growth scenario
2014 287.6 (2.6) 289.1 (3.1) 286.1 (2.0)
2015 295.3 (2.7) 298.0 (3.1) 292.2 (2.1)
2016 303.6 (2.8) 308.2 (3.4) 298.7 (2.2)
2017 312.3 (2.8) 318.7 (3.4) 305.5 (2.3)
2018 319.6 (2.4) 328.3 (3.0) 311.0 (1.8)
Annualizedgrowth rate (%) 2.7 3.2 2.1
(’13~’18)
<TableⅢ-2> Outlook on primary energy demand by scenario
Energy demand by scenario2

Outlook on energy intensity
In the case of the baseline scenario, energy intensity will likely indicate an annualized
improvement of 0.9% during the forecast period, thus improving from 0.247 (KRW 1
million/toe) in 2013 to 0.236 (KRW 1 million/toe) in 2018.
Energy intensity is forecast to improve at an annualized rate of 1.4% in the high-growth
scenario and an annualized rate of 0.5% in the low-growth scenario. Energy intensity is
expected to drop further as the economy grows quickly.
Notes: p indicates that the figures are preliminary.
46 KOREA ENERGY ECONOMICS INSTITUTE
KEEI Korea Energy Demand Outlook
[FigureⅢ-2] Comparison of primary energy demand outlook among scenarios
(Unit: toe/KRW 1 million)
Category Baseline High-growth scenario Low-growth scenario
2014 0.244 0.243 0.245
2015 0.242 0.240 0.244
2016 0.240 0.237 0.243
2017 0.238 0.234 0.242
2018 0.236 0.231 0.241
Annualizedimprovement rate (%) -0.9 -1.4 -0.5
(’13~’18)
<TableⅢ-3> Outlook on energy intensity by scenario

Energy intensity tends to improve relatively quickly in the high-growth scenario and
relatively slowly in the low-growth scenario.
- Energy-intensive industries in Korea, including the petrochemical, steel, and fabricated
metal industries, are continuing to grow at relatively steady rates. For this reason, the
rate of increase in energy demand for basic national economic activities does not drop
proportionately even when the economic growth rate is low.
- When the economic growth rate is high, there is a high possibility that low energy-
consuming industries will indicate relatively higher growth, such as the service
industry. The rate of increase in energy demand may not, therefore, rise proportionately
with the economic growth rate.
Outlook on demand by scenario of major energy sources
Compared to coal and nuclear energy, LNG and oil indicate significant differences in
demand forecasts across scenarios.
Chapter Ⅲ Energy Demand Outlook by Scenario
47http://www.keei.re.kr
[FigureⅢ-3] Comparison of energy intensity outlook among scenarios

The percentage of total oil demand taken up by oil consumption for raw material use
(naphtha, etc.), which is fixed, irreplaceable demand, is expected to rise steadily.
Notwithstanding, oil demand is relatively elastic to economic growth, international oil
prices, etc. compared to other energy sources.
- The annualized increase rate is forecast at 0.6% in the baseline scenario, 1.1% in the
high-growth scenario, and -0.2% in the low-growth scenario.
48 KOREA ENERGY ECONOMICS INSTITUTE
KEEI Korea Energy Demand Outlook
(Unit: %)Category
Coal Oil LNG Nuclear power
High growth Low growth High growth Low growth High growth Low growth High growth Low growth
2014 0.2 -0.2 0.8 -0.7 1.0 -0.9 0.0 0.0
2015 0.4 -0.4 0.9 -1.4 2.4 -2.2 0.0 0.0
2016 0.7 -0.6 1.6 -2.1 3.9 -3.6 0.0 0.0
2017 1.0 -0.8 2.2 -2.6 5.8 -5.3 0.0 0.0
2018 1.3 -1.0 3.0 -3.1 7.9 -7.0 0.0 0.0
<TableⅢ-4> Change in demand for major energy sources by scenario compared to the baseline scenario
[FigureⅢ-4] Outlook on oil demand by scenario

LNG demand for power generation, which is used to handle peak load, accounts for
approximately half of overall demand. This is why LNG demand is so elastic to changes
in economic growth.
- In other words, there are extremely large fluctuations in LNG power generation
according to electricity demand, which depends on the rate of economic growth.
- LNG demand is forecast to decline 0.2% in the baseline scenario, rise 1.3% in the high-
growth scenario, and decline 1.7% in the low-growth scenario.
Coal demand for bituminous coal-fired power generation, which is used to handle base
load, accounts for a high percentage of overall coal demand. For this reason, the demand
variation among the scenarios is not great.
- During the forecast period, coal demand is forecast to rise at an annualized rate of 4.8%
in the baseline scenario, 5.0% in the high-growth scenario, and 4.5% in the low-growth
scenario.
Chapter Ⅲ Energy Demand Outlook by Scenario
49http://www.keei.re.kr
[FigureⅢ-5] Outlook on LNG demand by scenario

Nuclear energy is also used to handle base load and is not significantly influenced by
changes in primary energy demand. There may be a small change in power generation as
an outcome of an adjustment in power generation facility output stemming from
electricity supply and demand conditions and adjustments in regular maintenance
schedules.
Outlook on demand by scenario in the final consumption sector
The industrial sector indicates the greatest variance among the demand forecasts for the
economic growth scenarios. The residential/commercial/public sector shows the least
variance.
- There is also a fixed base level of energy demand in the industrial sector, unless
economic conditions become extreme. However, industrial activity is naturally
sensitive to business fluctuations, with the result that energy demand by industry reacts
relatively elastically to changes in economic growth.
- As international oil prices stabilize, oil consumption in the transport sector is forecast to
respond less sensitively to economic growth.
- An essential energy requirement exists in the residential/commercial/public sector,
50 KOREA ENERGY ECONOMICS INSTITUTE
KEEI Korea Energy Demand Outlook
[FigureⅢ-6] Outlook on coal demand by scenario
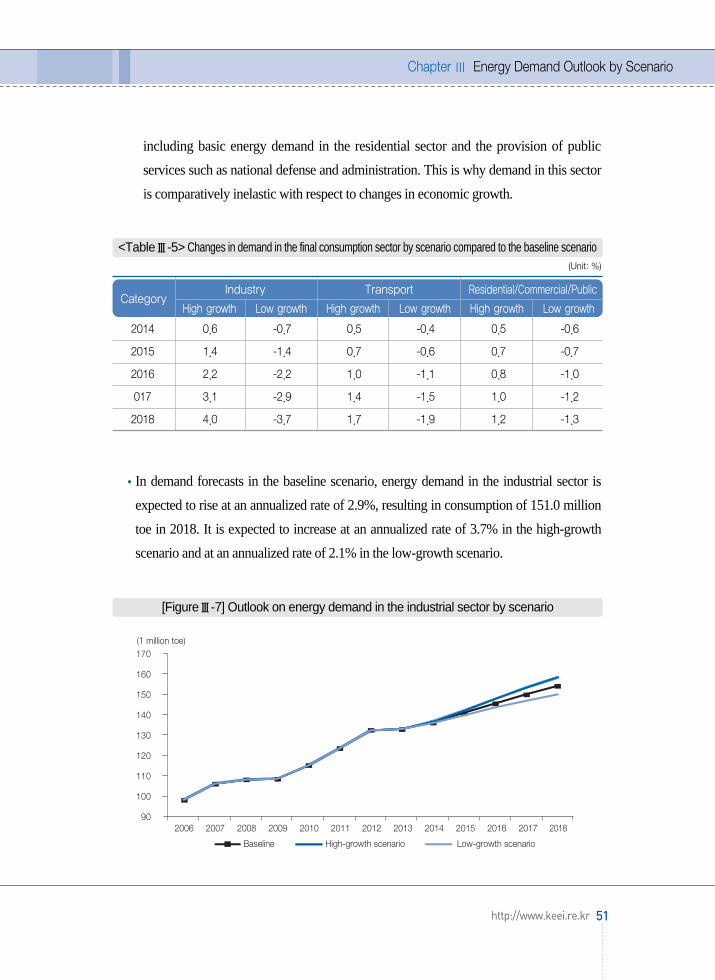
including basic energy demand in the residential sector and the provision of public
services such as national defense and administration. This is why demand in this sector
is comparatively inelastic with respect to changes in economic growth.
In demand forecasts in the baseline scenario, energy demand in the industrial sector is
expected to rise at an annualized rate of 2.9%, resulting in consumption of 151.0 million
toe in 2018. It is expected to increase at an annualized rate of 3.7% in the high-growth
scenario and at an annualized rate of 2.1% in the low-growth scenario.
Chapter Ⅲ Energy Demand Outlook by Scenario
51http://www.keei.re.kr
(Unit: %)
CategoryIndustry Transport Residential/Commercial/Public
High growth Low growth High growth Low growth High growth Low growth
2014 0.6 -0.7 0.5 -0.4 0.5 -0.6
2015 1.4 -1.4 0.7 -0.6 0.7 -0.7
2016 2.2 -2.2 1.0 -1.1 0.8 -1.0
017 3.1 -2.9 1.4 -1.5 1.0 -1.2
2018 4.0 -3.7 1.7 -1.9 1.2 -1.3
<TableⅢ-5> Changes in demand in the final consumption sector by scenario compared to the baseline scenario
[FigureⅢ-7] Outlook on energy demand in the industrial sector by scenario

Demand in the transport sector is forecast to rise at an annualized rate of 1.3% during the
forecast period in the baseline scenario, resulting in energy consumption of 39.7 million
toe in 2018. It is expected to indicate annualized growth of 1.7% in the high-growth
scenario and 1.0% in the low-growth scenario.
Final energy demand in the residential/commercial/public sector is expected to rise at an
annualized rate of 0.8% during the forecast period in the baseline scenario, reaching 44.1
million toe in 2018.
- Demand is forecast to rise at an annualized rate of 1.0% in the high-growth scenario
and 0.5% in the low-growth scenario.
52 KOREA ENERGY ECONOMICS INSTITUTE
KEEI Korea Energy Demand Outlook
[FigureⅢ-8] Outlook on energy demand in the transport sector by scenario

Chapter Ⅲ Energy Demand Outlook by Scenario
53http://www.keei.re.kr
46
45
44
43
42
41
40
39
38
37
[FigureⅢ-9] Outlook on energy demand in the residential/commercial/public sector by scenario

Outlook Characteristics andImplications
ChapterⅣ

Chapter Ⅳ Outlook Characteristics and Implications
57http://www.keei.re.kr
Primary energy demand is expected to gradually increase.
During the forecast period (2013-2018), primary energy demand is expected to steadily
rise at an annualized rate of 2.7%, though economic growth is forecast at a higher
annualized rate of 3.6%.
- Accordingly, energy intensity is expected to improve at an annualized rate of 0.9%,
declining from 0.247 in 2013 to 0.236 in 2018.
* Energy intensity (toe/KRW 1 million): 0.247 in 2007, 0.247 in 2013, 0.236 in 2018
However, per-capita energy consumption will likely reach 6.25 toe in 2018, ranking
Korea third among OECD countries in terms of per-capita energy consumption,
following Canada and the US.
* Comparison with other countries in per-capita energy consumption (toe/person, as of
2012): (OECD average) 4.20, (Canada) 7.26, (US) 6.77, (France) 3.86, (Germany)
3.77, (Japan) 3.55, (Italy) 2.62
The industrial sector leads energy demand by an overwhelming degree, with a
contribution of 83%. In terms of energy sources, electricity demand accounts for 32% of
the increase in primary energy.
Electricity demand for industrial use will likely lead the rise in overall electricity demand
and final energy demand.
Electricity demand for industrial use is expected to rise at an annualized rate of 4.7%, in
excess of the annualized economic growth rate of 3.6%.
- In contrast, overall electricity demand will likely rise at an annualized rate of 3.5%
during the forecast period, slightly below the economic growth rate.
Electricity demand for industrial use is expected to indicate the highest increase rate
among all major energy sources (excluding thermal, other energy), thereby leading a rise
in final energy demand (annualized rate of 2.2%).
- The basic metal industry and the fabricated metal industry (machinery and equipment,
electricity and electronics, semiconductors, automobiles, etc.), which consume great
amounts of electricity, grew rapidly and led the rise in electricity consumption.

Unlike other final energy sources, electricity involves energy conversion loss in the
production process, with the result that a rise in electricity demand causes an increase in
total energy demand equivalent to the loss in energy.
- There is a need to improve electricity demand management and raise efficiency in
electricity use.
The industrial sector is expected to lead the rise in final energy demand.
Energy demand in the industrial sector is expected to rise at an annualized rate of 2.9%
between 2013 and 2018 if the Korean economy approaches its potential growth rate,
which is an annualized rate of 3.6%.
The share of final energy demand accounted for by the industrial sector was steady at 55
to 56% until the mid-2000s. It rose steadily afterwards and reached 62.2% in 2013. It is
expected to reach 64.3% in 2018.
- There will likely be a steady increase in energy consumption in the industrial sector
owing to consistent growth of energy-intensive industries. In contrast, a slowdown in
demand growth is expected in the transport and residential/commercial sectors.
The rapid increase in energy consumption by the industrial sector is a result of economic
production, which renders it unavoidable.
However, there is a need to improve the energy efficiency of the industrial sector in order
to become a low-energy consuming society in the long term. This would entail
promoting low-energy consuming, high added-value industries and continually
developing energy efficiency technologies.
58 KOREA ENERGY ECONOMICS INSTITUTE
KEEI Korea Energy Demand Outlook

The share of primary energy taken up by bituminous coal for power generation and
nuclear power is projected to increase.
Assuming that power generation facilities will be expanded in accordance with the 6th
Electricity Supply and Demand Plan, demand for nuclear power and bituminous coal for
power generation should rise quickly.
- Demand for nuclear power and bituminous coal for power generation is projected to
rise at annualized rates of 7.4% and 4.9%, respectively, from 2013 to 2018.
The share of primary energy accounted for by nuclear power, which is a major base-load
power generation source, fell from 16.1% in 2005 to 10.4% in 2013, but is expected to
rise to around 13.1% in 2018, owing to large-scale power generation facility expansion
during the forecast period.
- During the forecast period, nuclear power generation capacity will be expanded by a
total of 6,600 MW. Total facility capacity will rise from 20,716 MW in 2013 to 27,316
MW in 2018.
Chapter Ⅳ Outlook Characteristics and Implications
59http://www.keei.re.kr
[FigureⅣ-1] Changes in and outlook on share of consumption by the industrial sector

The share of primary energy accounted for by bituminous coal is expected to rise from
27.1% in 2013 to 30.0% in 2018, assuming that there will be a major bituminous coal-
fired power generation facility expansion (11,464 MW) from 2014 through 2018
according to the 6th Electricity Supply and Demand Plan.
In contrast, dependence on LNG for power generation, which is used to handle peak
load, will likely rise until 2015 and then begin to fall in 2016 owing to the expansion of
bituminous coal-fired power plants.
- LNG demand for power generation will likely drop at an annualized rate of 3.3% from
20.2 million tons in 2013 to 17.1 million tons in 2018.
Oil dependence should continue to fall.
Oil dependence regarding primary energy peaked at 63% in 1994 and has since fallen
steadily. It stood at 37.8% in 2013 and is projected to fall to 33.8% in 2018.
- The share of primary energy accounted for by naphtha, a raw material in the
petrochemical industry, rose from 15.2% in 2005 to 16.9% in 2013. It is projected to
drop slightly to 16.2% in 2018.
- Excluding naphtha, oil dependence is projected to decline from 19.1% in 2013 to
15.7% in 2018.
60 KOREA ENERGY ECONOMICS INSTITUTE
KEEI Korea Energy Demand Outlook
[FigureⅣ-2] Changes in and outlook on share of primary energy taken up by major energysources for power generation

The decrease in oil dependence is seen as a result of the government’s diversification of
energy sources to increase national energy security.
- The government laid town gas pipes in metropolitan areas to reduce oil dependence
and tightened environmental regulation.
- This, and the international oil prices, which have remained stubbornly high since the
mid-2000s, further expedited the reduction in oil consumption and the substitution of
fuel by other energy sources.
Energy demand in the transport sector is expected to rise slightly.
Energy consumption in the transport sector rose less than 1% after the mid-2000s due to
the high oil prices. Energy demand in this sector is expected to record growth of 1.3%
during the forecast period as a result of stabilization of oil prices.
- Diesel demand will likely rise at an annualized rate of 1.6%, attributable to economic
recovery and increased use of diesel-powered vehicles.
- Gasoline demand is expected to increase at an annualized rate of 1.7% as a result of the
increasing consumer preference for larger automobiles and greater use of automobiles.
Chapter Ⅳ Outlook Characteristics and Implications
61http://www.keei.re.kr
[FigureⅣ-3] Changes in and outlook on oil dependence

The rate of increase in primary energy demand in consideration of the uncertainties in
economic growth is forecast at an annualized rate of 2.3 to 3.2%, a result of the economic
growth scenario-based outlook.
Primary energy demand is forecast to rise at an annualized rate of 2.1 to 3.2% in
consideration of uncertainties in the economic environment from 2013 through 2018
(annualized economic growth rate of 2.6% to 4.6%).
Energy intensity is forecast to improve at an annualized rate of 1.4% in the high-growth
scenario and 0.5% in the low-growth scenario. Energy intensity is forecast to improve at
a quicker pace if the economy grows faster.
- In general, energy intensity improves relatively quickly when economic growth is high.
Conversely, the improvement rate tends to go down when economic growth is low.
The variation in demand forecasts among scenarios is significant in the case of LNG in
comparison to other energy sources.
- LNG demand for power generation, which is used to handle peak load, accounts for
about half of overall LNG demand. For this reason, demand for it is very elastic to
fluctuations in electricity demand stemming from changes in economic growth.
- In contrast, demand for nuclear power and coal (bituminous coal), which are used to
handle base load, is relatively inelastic to changes in economic growth.
62 KOREA ENERGY ECONOMICS INSTITUTE
KEEI Korea Energy Demand Outlook

Reference Materials
63http://www.keei.re.kr
KEEI, 2013 Long-Term Korea Energy Demand Outlook, December 2013
Korea Institute for Industrial Economics & Trade, KIET Industry Trend Brief, Monthly
Issues
Ministry of Trade, Industry and Energy, 11th Long-Term Natural Gas Supply and Demand
Plan (Year 2013~2027), April 2013
Ministry of Knowledge Economy, 6th Electricity Supply and Demand Plan (Year
2013~2027), February 2013
Korea Development Institute, KDI Economic Outlook, November 2013
Korea City Gas Association, City Gas Business Manual, 2013
Korea Cement Association, 2012 Annual Report on Cement Statistics, 2013
KEPCO, Monthly issues of the Electricity Statistics Newsflash
http://www.kesis.net (KEEI, Korea Energy Statistics Information System)
http://www.kpx.or.kr (Korea Power Exchange)
http://www.petronet.co.kr (Korea National Oil Corporation, Oil information network)
http://www.cement.or.kr (Korea Cement Association)
http://steeldata.kosa.or.kr (Korea Iron & Steel Association, Steel Data)
http://kosis.kr (Statistics Korea, National statistics portal)
http://www.khnp.co.kr (Korea Hydro & Nuclear Power)
http://www.ecos.bok.or.kr (The Bank of Korea, Economic statistics system)
Reference Materials

KEEII Mid-Term Korea EnergyDemand Outlook(2013~2018)(Volume 15)
Printed in May 2014
Issued in May 2014
CEO of publisher: Sonn Yang-hoon
Registration: No. 8 on December 7, 1992
Printed by: Bumshinsa (02)503-8737
ⓒ Korea Energy Economic Institute 2014
132 Naesonsunhwan-ro, Uiwang-si, Gyeonggi-do
Phone: (031)420-2114, Fax: (031)422-4958
Publisher: Korea Energy Economics Institute

KEEI QUARTERLY ENERGY OUTLOOK
Korea Energy Economic Institute132 Naesonsunhwan-ro, Uiwang-si, Gyeonggi-doPhone: (031)420-2114Fax: (031)422-4958E-mail : [email protected] : http://www.keei.re.kr
KEEIMid-Term Korea
Energy Demand Outlook(2013~2018)
ISSN 2287-3007
May 2014
Volume 15
KEEI
Korea Energy Economic Institute
Mid-Term
Korea Energy Demand O
utlook(2013~2018)
May 2014
15호중기수요(영문)_무선표지 2014.9.23 3:5 PM 페이지1


