Embed Size (px)
Citation preview

Exhibit A

Error! Reference source not
Cumulative Land Cover Impactsof Proposed Transmission Pipelines in the Delaware RiverLars Hanson and Steven Habicht
May 2016
Cleared for Public Release

Acknowledgements: The authors of this report would like to recognize the study’sreviewers including Paul Faeth and Jonathon Mintz. Any errors that remain are our own responsibility. We would also like to recognize our editor, Peter Pavilionis.The Clean Air Council funded this research effort, and we would like to express ourthanks for their support.Authors: Lars Hanson and Steven Habicht, PhDDocument Number: IRM-2016-U-013158
This document represents the best opinion of CNA at the time of release. CNA operateson the principle of conducting honest, objective, accurate, usable research to inform the important work of public policy decision makers.Distribution:Unlimited distribution.
Image Credits: (clockwise) CNA, CNA, Wikimedia Commons
Approved by:
May 2016
David Kaufman, DirectorSafety and Security Institute for Public Research
Copyright © 2016 CNA

AbstractTransmission pipelines function to transport petroleum products over long distancesto connect locations where these products are produced or refined to demand centers. The development of Marcellus shale gas with hydraulic fracturing in Pennsylvania has been accompanied by several proposals for new transmission pipelines. At least eight of these proposed transmission pipeline projects will cross the Delaware River Basin (DRB) to bring natural gas produced from the Marcellus shale play to demand centers on the East Coast, or otherwise connect to the larger petroleum products pipeline network. Each proposed interstate pipeline must undergo a review by the Federal Energy Regulatory Commission (FERC), which includes an environmental impact analysis. The potential environmental impacts of pipeline construction include land cover change, deforestation, sedimentation and erosion, water quality degradation, stream degradation, wetland loss, and air emissions, among others. In this report, we investigate the cumulative land cover change impacts for eight proposed transmission pipelines within the DRB, which total 322 miles in length. Specifically, using geographic information systems (GIS) methods, we investigated total land cover change, loss of forest and wetland area, and stream crossings for the eight proposed projects. We found that during construction, the pipelines’ rights-of-way will impact 2,977 acres, including roughly 1,060 acres of forest, and 41 acres of wetlands. The pipelines’ permanent rights-of- way will impact 1,328 acres, including roughly 450 acres of forest, and 22 acres of wetlands. In addition, we identified 175 likely stream
i

This page intentionally left blank.
ii

Executive SummaryThe primary function of transmission pipelines for petroleum is to provide longdistance transport of liquid fuels to where there is demand for them. The planning and construction of pipelines can be a long and complicated process because pipelines and the land needed for their rights-of-way impact property owners, land resources, water resources, air quality, and wildlife along the proposed routes. TheseThe rapid expansion of natural gas production due to the development of theMarcellus shale with hydraulic fracturing has been accompanied by proposals for new transmission pipelines. Although there is a moratorium on natural gas development in the Delaware River Basin (DRB), at least eight proposed transmission pipeline projects will cross the DRB in order to bring natural gas produced in the Marcellus to demand centers on the East Coast, or otherwise connect to the larger petroleum products pipeline network. Each proposed interstate natural gas pipeline must undergo a review by the Federal Energy Regulatory Commission (FERC), which includes an environmental impact analysis. The potential environmental impacts of pipeline construction include land cover change, deforestation, sedimentation and erosion, water quality degradation, stream degradation, wetland loss, and air emissions, among others. The environmental analyses in the FERC approval process document many of these potential impacts, and the proposed measures to mitigate these impacts during construction and operation for each pipeline project. However, the environmental analyses for the individual pipeline projects do not consider the cumulative impact of multiple independent pipeline projects proposed In this report, we investigated the cumulative land cover change impacts forproposed transmission pipelines within the DRB. Specifically, using geographic information systems (GIS) methods, we investigated total land disturbance, loss of forest and wetland area, and stream crossings for eight proposed projects. This work was funded by the Clean Air Council, which requested that CNA provide an estimate of the land area affected by the eight proposed pipeline projects’ rights-of-way (ROW) in the DRB and, especially, an estimate of the total forest area that could be lost as aFigure ES-1 on the following page shows a map of the proposed pipeline routesoverlaid on forest and wetland area within the DRB.
iii

Our results present information that is typical in pipeline environmental analysis,but in new and useful ways. Notably, we present the land disturbance and forest loss broken down by watershed, with totals for the entire DRB. In addition, we compute the new cumulative disturbance area for eight proposed projects (with no double- counting of area where pipelines are adjacent). These cumulative results, presentedthe DRB than the individual,pipeline-specific
environmentalanalyses can offer on their
own.We found that the land disturbanceresults are very sensitive to the stage of the development process and proximity to other pipelines. For instance, the land disturbance is highest during construction, when a wider ROW is needed for moving equipment. After construction, a smaller permanent ROW is affected, and in some cases, a portion of the permanent ROW may be allowed to return to prior land uses, leaving a smaller permanently cleared area. In addition, pipelines that run adjacent to existing pipelines, and can share a portion of the existing ROW may cause less land disturbance per mile than new, or Figure ES-1. Proposed pipelines and
forest andwetland areas in the Delaware River Basin
Overall, for the Delaware River Basin, we calculated the following impacts for theeight proposed projects:
Total land disturbance during construction is 2,977 acres, of which roughly1,050 are forest, and 41 are wetlands.
Total land disturbance for the permanent right-of-way is 1,328 acres, ofwhich roughly 440 are forest, and 22 are wetlands.
The proposed pipeline routes will require at least 175 stream crossings, ofwhich 92 potentially could be shared with existing pipelines.
iv

The most significant impacts with respect to area of forest and wetland disturbance,as well as stream crossings, will happen in the central part of the DRB, in the Lehigh and Middle Delaware subbasins. This concentration of impacts is caused by the Diamond East, Leidy SE, and especially the PennEast pipeline project (which accounts for 40–50 percent of the total land disturbance area in the DRB) passing through a similar corridor, which is heavily forested. Analyzing multiple pipeline projects simultaneously allows easier detection of these types of concentrated impacts. The body of the report contains many more tables, figures, and maps that break downThese results offer a clear picture of the potential scale of pipeline developmentimpacts on land cover across the Delaware River Basin, offering stakeholders a significantly different view than they might receive when reviewing individual projects. In the future, similar methodology may be used to investigate impacts in other geographic areas of interest. Or, these results could be used to conduct follow- on analyses of secondary impacts of pipeline infrastructure development in the DRB
v
This page intentionally left blank.
vi

ContentsIntroduction .................................................................................................................................. 1
Methodology................................................................................................................................. 4
Pipelines and Data Sources ................................................................................................. 4Right-of-Way Assumptions.................................................................................................. 8
Construction and Permanent Rights-of-Way ............................................................ 8Greenfield Construction ............................................................................................... 9
Results..........................................................................................................................................16
Validation..............................................................................................................................16Land Cover Distribution near Pipelines..........................................................................18Land Cover Impact in the DRB .........................................................................................21Impact by Pipeline...............................................................................................................2
Discussion ...................................................................................................................................34
Appendix A: County and Watershed Results Tables.......................................................38
References...................................................................................................................................4
vii

List of FiguresFigure 1.Figure 2.
Map of proposed pipelines within the Delaware River Basin ................. 7Typical pipeline rights-of-way illustration ................................................. 8Generalized GIS process for identifying land use breakdown within proposed pipeline right-of-way................................................................... 12GIS methodology illustration for the three area impact calculation methods for both greenfield construction (top), and construction adjacent to existing ROWs (bottom). ......................................................... 14Land cover disturbance area for typical ROW widths for the 8 proposed pipeline projects.......................................................................... 19Disturbance area by land cover type versus theoretical ROW buffer width for the 8 pipelines examined in the DRB ...................................... 19As ROW width increases, forest area impacts increase in a linear fashion. ............................................................................................................ 20As ROW width increases, the increase in wetland impact area isnearly linear .................................................................................................... 21Total disturbance areas in the DRB for the permanent and construction ROWs for the proposed pipeline as generated by the three GIS methods (A,B, &C) used in this study ...................................... 22Land area impacts of proposed pipeline construction within the
Figure 4.
Figure 5.Figure 6.Figure 7.Figure 8.Figure 9.
Figure 10.Figure 11.
Figure 12.
Figure 13.
viii

List of TablesTable 1.Table
Proposed pipeline projects included in this study ................................... 5Land cover groupings by 2011 National Land Cover Dataset classifications ................................................................................................... 6Assumptions for right-of-way widths........................................................ 10Average width of pipeline ROWs based on reported disturbancearea and pipeline length............................................................................... 11Methods for estimating land use area impacts of proposedpipelines .......................................................................................................... 14Validation of new forest disturbance [ac] from pipeline documentation (“Document”) versus GIS estimates for thepermanent and construction ROWs........................................................... 17Validation of total new disturbance area [ac] from pipeline documentation (“Document”) versus GIS estimates for thepermanent and construction ROWs........................................................... 17Estimated disturbance area [ac] within the DRB by pipeline andland cover type for the new permanent ROW.......................................... 23Estimated disturbance area [ac] within the DRB by pipeline andland cover type for the new construction ROW. ..................................... 24
Table 3.Table Table 5.Table 6.
Table 7.
Table 8.Table 9.Table 10.Table 11.Table 12.Table 13.
ix

GlossaryDRBEIS GIS FERC HDD NHD NLCD ROWUSGS
Delaware River BasinEnvironmental Impact Statement geographic information systems Federal Energy Regulatory Commission horizontal directional drillingNational Hydrography DatasetNational Land Cover Dataset Right-of-wayUnited States Geological Survey
acft mi
acresfeet miles
easement
Legal term to describe the holding of land area to ensure accessto pipelines (see “right-of-way”).Small diameter pipelines used to transport from wells to the larger gas pipeline network.Term to describe construction in a new right-of-wayType of pipeline project in which a new pipeline is added parallel to an existing pipeline, and connected at both ends to form a ‘loop’ allowing for greater capacity and control of flow.A geologic formation containing petroleum (natural gas) resources with potential for development.The land area around a pipeline needed for access to construct the pipeline and protect, and maintain it over time. Typically wider during construction.Term to describe the side of the pipeline ROW where the excavated soil (“spoils”) will be stored during construction.The location from which gas wells are drilled from the surface into the shale. Typically, flat, covered with gravel, and two–five acres in size to accommodate equipment needed for well drilling.
gathering pipelinegreenfieldlooping
play
right-of-way
spoil side
well pad
working side
x

This page intentionally left blank.
xi

This page intentionally left blank.
xii

IntroductionOver the past decade, the rapid expansion of unconventional natural gasdevelopment with hydraulic fracturing in the Marcellus Shale has been accompanied by an increase in pipeline construction proposals in Pennsylvania, New Jersey and New York. The process of shale gas development requires many miles of small gathering pipelines to connect well pads where gas is extracted to transmission pipelines that allow the gas to reach customers. In recent years, the operators of these transmission pipelines have proposed both upgrades and extensions to existing pipeline networks and entirely new pipelines. Many of these proposed pipelines cross the Delaware River Basin by virtue of its location between the Marcellus Shale and densely populated areas with demand for natural gas on the EastInterstate natural gas transmission pipelines (those that involve buildinginfrastructure in more than one state) must be authorized by the Federal Energy Regulatory Commission (FERC).1 The typical process is for the pipeline proponent to notify FERC of intention to build an interstate transmission pipeline, followed by the pipeline proponent marketing the pipeline to determine if enough contracts can be sold to build it, followed by a much more detailed route and design process. Then the pipeline proponent works in tandem with FERC staff to perform necessary environmental reviews before finalizing the pipeline route, acquiring necessary permits from relevant federal and state agencies, negotiating with land owners, developing construction plans, and building the pipeline [1]. The scope of the FERC environmental review process is broad, covering land use change impacts, water use, stream crossings and wetland impacts, potential impacts to species (fish, wildlife, and vegetation), soils, and air emissions, among others (including socioeconomic andPipelines, as linear features, bring a different set of challenges than most landdevelopment activities. While the pipeline itself requires a trench no more than a
1 This study also investigates a few transmission pipelines transporting other liquid fuels, andintrastate gas pipelines (those that do not cross state lines), which do not require FERC approval, but have very similar construction methods and impacts on land and water resources.
1

feet wide, the construction process requires a much wider right-of-way (ROW) area. Inaddition, the linearity of pipeline projects means that they cross numerous property boundaries, municipalities, and watersheds. The impact on any one of these geographic entities is typically limited, but over the entire length of the pipeline, the total land disturbance area can be significant. Furthermore, several pipelines built inPipeline construction can result in a wide range of environmental impacts, some ofthem interacting and layered. Experts studying the risks of shale gas development term the chain of potential impacts a “Risk Pathway,” which describes how an activity (pipeline construction) leads to burdens (land cover change) that create intermediate impacts (e.g., forest fragmentation), leading to final impacts or outcomes (e.g., ecosystem change) [3-4]. In the case of pipeline construction, among the most well- known burdens and intermediate impacts are stream and wetland crossing impacts, land cover change, forest fragmentation, and habitat loss [5-9]. These impacts can lead to other impacts and outcomes, including ecosystem changes (relative changes in species abundance, impacts on specialist or threatened and endangered species), and hydrologic and water quality impacts resulting from the land disturbance (erosion and sedimentation, flow changes, and stream buffer impacts) [5, 10-12]. The hydrologic and water quality changes may in turn impact aquatic ecosystems inThe FERC environmental review process does investigate many of these impacts in aseries of resource reports and environmental assessments, often in detail, but there are some shortcomings for the projects examined in this report. Notably, the land cover change estimates are often broken down by political boundaries, but not always relevant natural boundaries, especially watersheds. Most importantly, the resource reports rarely investigate the cumulative land cover change impacts of multiple concurrent pipeline proposals on watersheds or sensitive land resources. We note that the environmental analyses prepared for many of these analyses werecumulative impacts.2
In this analysis, we investigate the combined land cover changeof eight proposed pipelines within the boundaries of the Delaware River Basin
(DRB).The Delaware River drains an area of 13,000 square miles, and its watershed (i.e., theDRB) spans portions of Pennsylvania, New Jersey, and Delaware. The river itself, 2 Guidance for the FERC environmental review process was updated in December 2015, afterthe majority of the analysis for this report was completed. The guidance clarifies cumulative impact as the “the impact on the environment which results from the incremental impact of the action [being studied] when added to other past, present, and reasonably foreseeable future actions…”, and further notes that the geographic area to be examined should be specific and relevant to each resource category examined (e.g. land
2

miles long, forms the border between Pennsylvania and New Jersey, and empties intothe Delaware Bay, which separates Delaware and New Jersey. The DRB is the source of drinking water for roughly eight million people living within the basin, and roughly an equal number outside who receive water transferred from the basin [13]. Much of the basin has exceptional water quality in part due to the over five million acres (7,800 square miles) of forest and wetlands. The forests have been estimated to provide roughly $2,000 per acre per year (in 2010 dollars) in ecosystem service benefits such as water treatment, air pollution removal, and carbon sequestration, and the wetlands as much as $13,000 per acre. Another 4,500 square miles is used for agriculture, which is responsible for roughly $3.5 billion per year in revenue from farm products [14]. Land cover changes have the potential to degrade some of these benefits either directly (conversion to other land uses) or indirectly (e.g., pollutantThis study does not examine loss of these benefits in detail or the ultimateenvironmental outcomes from pipeline development, but these consequences establish the rationale for investigating the land cover changes. This study aims to provide credible estimates of the area of land cover changes associated with the eight transmission pipeline proposals.
3

MethodologyIn this study, we use Geographic Information Systems (GIS) methods to generateestimates of land cover change using spatially referenced pipeline route information (existing and proposed) and baseline land cover data. The goal of this methodology is to develop cumulative projections of land cover disturbance impacts for eight proposed pipeline projects that are currently anticipated to cross through the DRB. The primary metric of interest is the affected land area that is newly “disturbed” (i.e. converted from an existing non-pipeline related land use) within the pipeline projects’ construction or permanent ROW, exclusive of area already within existing
Pipelines and Data SourcesTable 1 lists the eight pipeline projects included in this study. The most importantdata source for this analysis is pipeline route information. The primary source of pipeline route information was commercially available U.S. oil and gas pipeline facilities data purchased from IHS [15], which includes GIS data for both active and proposed pipelines. The IHS data includes route information for all of the pipeline projects except the Southern Reliability Link, and Penn East Pipeline project. The quality of the IHS data for the majority of pipeline routes is rated as “Excellent” (accurate within 50 feet), with the remainder rated as “Very Good” (50–300 feet), or “Good” (301–500 feet). The pipeline route information as purchased was currentWe verified route information for all pipelines using other data sources. Thesesources include a GIS geodatabase provided by the Clean Air Council [16], which included preliminary route information for the Southern Reliability Link and Penn East Pipeline project (quality estimated as “Very Good”). In addition, we used maps available in FERC documents and from project proponent reports and websites. We projected digital versions of these maps into ArcGIS 10.2 in order to compare them with the geo-referenced pipeline route features. We also used these maps to update the route information when the route had changed during the course of the project planning. Table 1 includes references to the documents and maps from which we
4

Table 1.
Proposed pipeline projects included in this study
Pipeline Project
Proponent
Details/Segment
Length inDRB
Sources*
2 Diamond East Project
Williams
56.8
[15]
Mariner East 1,Mariner East
49.94
4 Mariner Easta
Sunoco Logistics
[22-23]
PennEast PipelineCo.
6 PennEast Pipeline
100.9
[26-29]
ProjectEast Side ExpansionProject
Columbia PipelineGroup
NJ Loop 10345,PA Loop 1278
7.48
8 [31-37]
Total
322.2* Sources common to several pipelines: [15-16]; a – transports other petroleum
products;b – Not an interstate pipeline.For the PennEast project, we used detailed project maps [29] (last updated July 22, 2015) as the primary data source and digitized the pipeline features over the We note that pipeline routes can and do change during project planning, and evenconstruction. We have attempted to include the most recent preferred project routing available from the listed data sources as of September 30, 2015.In addition to the pipeline route information, we also acquired land cover data. Forthis study, we used the National Land Cover Dataset (NLCD), 2011 version [38], for the states of New York, New Jersey, and the Commonwealth of Pennsylvania. This data is available as a raster data type, with a spatial resolution of 30 meters. Land cover types are distinguished by numeric codes. For this analysis, we combined some of the land cover types into larger groupings for simplicity. Table 2 shows these groupings. For example, three different forest types are combined into the “Forest”
5
7 TEAM 2014 Expansion Spectra Energy Bernville Loop 5.6 [30]
5 Southern Reliability Linkb
NJ Natural Gas 18.2 [24-25]
3 Leidy SE Project Williams Franklin Loop 11.2 [20-21]
1 Constitution Pipeline Williams 13.5 [17-19]

Table 2.
Land cover groupings by 2011 National Land Cover Dataset classifications
Grouping
NLCD Classifications Included
Wetland
90 – Woody Wetlands; 95 – Emergent Herbaceous Wetlands
PastureAg - Cultivated
82 – Cultivated Crops Grassland/Shrub 71 – Grassland Herbaceous; 52- Shrub/Scrub
Open Space
21 – Developed Open Space; 31 – Barren Land24 – Developed High IntensityWate
r11 – Open WaterSource:
[39]
Figure 1 shows an overview map of the study area with the route information for theproposed pipelines overlaid on the NLCD 2011 land cover raster. In addition, the DRB boundary, county boundaries, and existing pipeline routes are shown for
6
Developed 22 – Developed Low Intensity; 23- Developed
Medium Intensity;
Agriculture (Ag) –81 – Pasture/Hay
Forest 41 – Deciduous Forest; 42 – Evergreen Forest; 43 – Mixed Forest

Figure 1.
Map of proposed pipelines within the Delaware River Basin
Source: CNA; [15-17, 19, 24-26, 29, 31-32]
7

Right-of-Way AssumptionsConstruction and Permanent Rights-of-WayThis analysis focuses primarily on the land disturbance required for pipelinedevelopment, which includes both permanent land use change impacts and additional disturbance during construction. For the purpose of this analysis, we define the permanent land cover change area as the new permanent right-of-way of the pipeline exclusive of existing permanent right-of-way shared by adjacent pipelines. The land cover change area during construction includes the new permanent right-of-way and additional temporary work space associated with construction, but excludes existing permanent right-of-way shared by adjacent pipelines. The FERC filings and other documents released by the project proponents differ in their presentation and description of these areas. In this study, “New Permanent ROW” is new area cleared for the permanent right-of-way, and “Construction ROW” is total area cleared during construction, inclusive of the New Permanent ROW. The temporary workspace may be inferred by subtraction. SeeThis analysis is limited to the direct pipeline ROWs and construction areas, and doesnot include additional land area needed for pipeline facilities (e.g. launchers, pump stations, etc.), access roads, or temporary equipment storage areas.
Figure 2.
Typical pipeline rights-of-way illustration
Trench
Pipeline
Source: CNA; Clip art: clker.com, openclipart.org, office.com
8

Greenfield ConstructionGreenfield construction refers to pipeline construction through areas where noexisting pipelines or rights-of-way are present. The entire operation requires new clearing for construction and operation.When new pipelines are constructed outside of existing ROWs, a new permanenteasement is created, and additional land is usually needed for construction. In general, construction ROWs are divided into a spoil side (area for storing soil and materials excavated from, or used for, backfilling the trench) and a larger working side for moving equipment, and aligning and connecting the pipeline itself beforeThe size of the construction area can vary depending on the type of terrain crossed.In wetlands or core forest areas, the construction ROW can be reduced to limit impacts. In urban or suburban areas, construction ROW may need to be reduced to avoid existing buildings, property lines, or utility infrastructure. In agricultural areas, sometimes a larger right-of-way is needed so that agricultural land can be quickly returned to productive use after construction. The additional area is needed to store the agricultural top soil that is removed during construction so that it can be
Adjacent to Existing Rights-of-WayPipelines are often routed adjacent to existing pipelines to minimize new clearingand costs of purchasing new easements. Looping projects are nearly always adjacent to the existing pipeline, but new pipelines may also run adjacent to existing pipelines, where possible, to reduce land disturbance impacts and costs. While some additional right-of-way is typically needed, the pipeline itself can often be laid within or very close to the existing permanent easement of another pipeline. That is, the spacing between pipelines can be reduced so that each pipeline does not need its own (typically 50-foot) full permanent right-of-way. When the existing and new pipelines have different owners, a new permanent ROW is generally required evenIn general, it appears that the existing ROW of the adjacent existing pipeline is usedas the spoil side of the construction right-of-way for the new pipeline. The wider working side of the construction ROW generally requires new clearing, so as to limit potential damage to existing pipelines due to the movement of heavy
9

Typical Right-of-Way WidthsOur default assumption for the typical ROW width is 50 feet for the permanenteasement and 100 feet for the total construction ROW. In this analysis, we analyze both a simplistic symmetric case with equal width on either side of the pipeline, and a more realistic case where the construction ROW is split asymmetrically across the pipeline. The rest of the section documents the assumption when an asymmetricIn greenfield construction, we assume the typical construction ROW is split into a 25-foot spoil side, and a 75-foot working side, with the outer 50 feet being temporary workspace, and 25 feet on either side of the pipeline as permanent easement (see Figure 2). For looping projects or pipelines adjacent to existing pipelines, we assume up to 25 feet of shared right-of-way on the spoil side. Thus, in the case that shared right-of-way is 25 feet, the new disturbance ROW width (all on the working side) is 25 feet for permanent right-of-way and 75 feet for construction ROW. Based on the location of the adjacent pipelines, we varied the amount of shared ROW between 10 and 25 feet. Accordingly, we reduced the spoil side width for construction between 0 and 15 feet, meaning that the new permanent ROW is between 25 and 40 feet in width (instead of 500 feet for greenfield projects). In situations when the proposed project pipeline route diverged from the path of the existing pipelines, we treated it as greenfield construction. Table 3 displays the default ROW widths we used in this study. Several of the pipelines have specific ROW widths specified by land cover typeTable 3. Assumptions for right-of-way widths
Construction ROW [ft] Pipeline/Construction method
PermanentROW [ft]
Spoilside
Working-General
Working-
Ag
Working-Wetland
Working-Forest
Default 50
25
75
100
50
Constitution
50
30
80
95
45
70
Defau l t 25-40 0 - 15 75 100 50
We used best professional judgment to determine on which side the spoil side andworking side will fall, based on the route and location of other pipelines and infrastructure.
10
Looping:
PennEast 50 35 65 90 40
Greenfield:
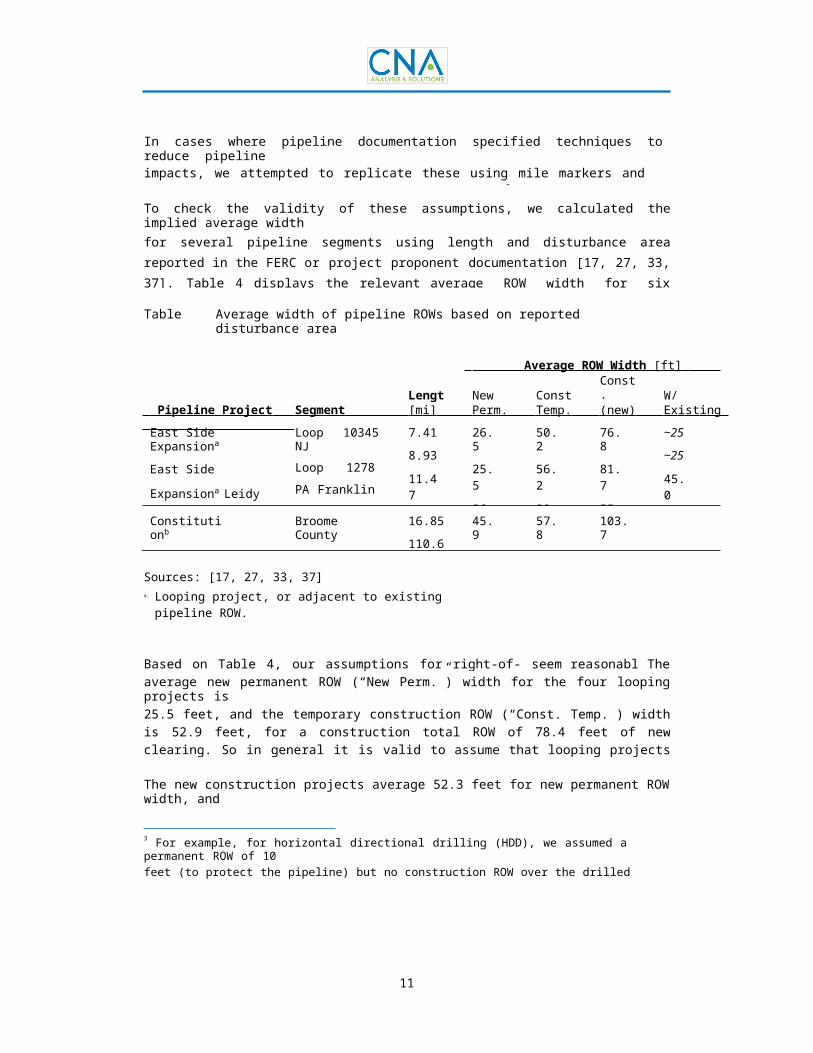
In cases where pipeline documentation specified techniques to reduce pipelineimpacts, we attempted to replicate these using mile markers and other notes on construction methods as a guide.3
To check the validity of these assumptions, we calculated the implied average widthfor several pipeline segments using length and disturbance area reported in the FERC or project proponent documentation [17, 27, 33, 37]. Table 4 displays the relevant average ROW width for six pipeline segments, which was computed simply byTable 4.
Average width of pipeline ROWs based on reported disturbance areaand pipeline length
Average ROW Width [ft] Const.TotalLengt
hNew Const. W/in
Pipeline Project Segment [m i ] Per m . Te mp. ( n e w ) Ex i st i ng East Side Expansiona
East Side Expansiona Leidy SEa
Loop 10345 NJLoop 1278 PA Franklin Loop
7.418.9311.475.60
26.525.52
50.256.23
76.881.75
~25~25
4Constitutionb
PennEastb
Broome CountyEntire
16.85110.60
45.95
57.87
103.71
Sources: [17, 27, 33, 37]a. Looping project, or adjacent to existing pipeline
ROW.b. New “greenfield” construction project.
Based on Table 4, our assumptions for right-of-way width
seem
reasonable.
Theaverage new permanent ROW (“New Perm.”) width for the four looping projects is25.5 feet, and the temporary construction ROW (“Const. Temp.”) width is 52.9 feet, for a construction total ROW of 78.4 feet of new clearing. So in general it is valid to assume that looping projects save roughly 25 feet of clearing width by using existing ROW on the spoil side during construction and sharing permanent The new construction projects average 52.3 feet for new permanent ROW width, andan additional 64.6 feet for temporary construction ROW. Although the 3 For example, for horizontal directional drilling (HDD), we assumed a permanent ROW of 10feet (to protect the pipeline) but no construction ROW over the drilled segment. We assumed a 250-by-200-foot drilling pad at the start and end of the HDD sections during
11

appears to run adjacent to several existing pipelines for portions of its length, thereported areas in the PennEast project documentation [27] (and the calculated average widths) seem to suggest that a full-width permanent easement will be needed along its entire length. This may reflect the fact that PennEast will have a different
GIS MethodsThe land cover analysis for pipelines involves two major steps: (1) convertingpipeline route information (in line format) to right-of-way area (in polygon format), and (2) extracting land use types that fall within the right-of-way polygon. In Figure 3, we illustrate the general GIS methodology used for this analysis, including the inputs, processes, and outputs. The major inputs are the pipeline routes, DRB boundary, the NLCD 2011 raster, and the desired ROW width. GIS data types are shown in brackets. We performed additional post-processing as necessary to analyze the results at the
Figure 3.
Generalized GIS process for identifying land use breakdown withinproposed pipeline right-of-way
Source: CNA, created with ESRI ArcGIS 10.2 ModelBuilder.The actual process is slightly more complicated, and requires more steps to extractvalues from the NLCD raster over the correct domain and convert to a polygon data type. The process as shown can be used only for a symmetrical buffer about the pipeline, which is suitable for analyzing the permanent right-of-way, but not ideal for
12
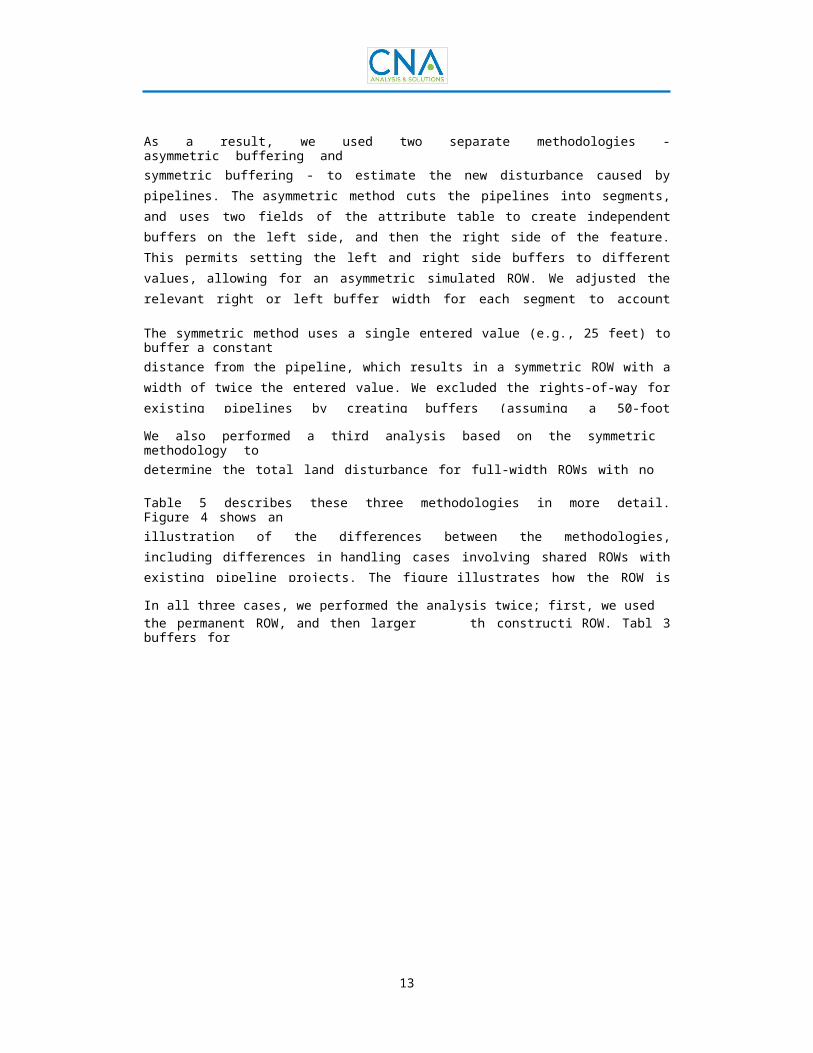
As a result, we used two separate methodologies - asymmetric buffering andsymmetric buffering - to estimate the new disturbance caused by pipelines. The asymmetric method cuts the pipelines into segments, and uses two fields of the attribute table to create independent buffers on the left side, and then the right side of the feature. This permits setting the left and right side buffers to different values, allowing for an asymmetric simulated ROW. We adjusted the relevant right or left buffer width for each segment to account for shared rights-of-way with existing pipelines. For example, for an existing pipeline located 25 feet to the topographic left of the proposed pipeline, we would set the left buffer distance to zero instead of theThe symmetric method uses a single entered value (e.g., 25 feet) to buffer a constantdistance from the pipeline, which results in a symmetric ROW with a width of twice the entered value. We excluded the rights-of-way for existing pipelines by creating buffers (assuming a 50-foot permanent ROW) around the existing pipelines, andWe also performed a third analysis based on the symmetric methodology todetermine the total land disturbance for full-width ROWs with no exclusions for existing pipelines. We did not erase the existing pipeline ROWs in this case.Table 5 describes these three methodologies in more detail. Figure 4 shows anillustration of the differences between the methodologies, including differences in handling cases involving shared ROWs with existing pipeline projects. The figure illustrates how the ROW is computed for both greenfield construction (top), andIn all three cases, we performed the analysis twice; first, we used smaller buffers forthe permanent ROW, and then larger buffers fordisplays the assumed widths for these ROW
the construction ROW.
Table
3
13

Table 5.
Methods for estimating land use area impacts of proposed pipelines
Method Name Description A Asymmetric
BufferDivide all pipelines into segments, and enter abuffer distance for the topographic left and right side of the feature. Adjust buffer width to account for different land use types and existing ROWs. In addition, account for special cases such as HDD and encroachments.
B Equal Buffer with Erase
Buffer the proposed pipeline by a constant width(equating to either permanent or construction ROW), symmetric about the pipeline. In GIS, also buffer all existing pipeline features to account for a 50-ft permanent right-of-way. Use the Erase tool in GIS to remove the existing ROW area from the proposed ROW area.
C Full-width buffer
Buffer the proposed pipeline by a constant width(equating to either permanent or construction R O W ) , sy mme tr i c about t he p i pel i ne.
Figure 4.
GIS methodology illustration for the three area impact calculationmethods for both greenfield construction (top), and construction adjacent to existing ROWs (bottom).
14

Estimation of Total Forest Area ImpactWhile this study investigates land cover disturbance for the entire range of landcover types in the NLCD, a particular metric of interest is the total direct forest area impact for the entire Delaware River Basin. (This study does not examine indirect effects such as loss of core forest area due to new forest edges.) We first calculate the forest area impact based on the GIS methodology described, but we recognize some limitations posed by using the NLCD raster. Namely, the coarseness of the NLCD and issues with assignment of land cover types could lead to errors for an individual land use type such as forests. Specifically, we have observed that existing pipeline rights-of-way are often classified as forest (instead of grassland or developed/open space), which may slightly over-estimate forest area. To a lesser extent, low-density residential (or agricultural) land with some tree canopy may also be classified as forest. The 30-meter resolution (cell size) of the NLCD may also come into play, as each cell is slightly wider than the typical construction ROW, and theIn order to correct potential errors in forest area, we validate our GIS results againstforest area impacts reported in the FERC or pipeline proponent documentation, which should be more accurate due to greater precision of right-of-way limits and possibly more precise land cover data. Through comparison of these two forest area estimates, we generate adjustment factors that can be used to compute a refined estimate of forest area impacts for the whole basin based on the GIS results. The next section, particularly Table 6, explains the validation process for the forest areas, and presents the adjustment factors we use to compute the best estimate of total
15
ResultsThis section presents results of the land cover disturbance analysis. We first presenta validation of the methodology. Then we present the total land disturbance area within the DRB for both permanent ROWs and construction ROWs, followed by more granular results by pipeline, by county, and by watershed. Finally, we present our
ValidationWe validated our GIS methodology by comparing estimates of new pipeline impact byland use to similar estimates in the FERC documentation. All of the GIS estimates used for validation were generated using the “A – Asymmetric Buffer” methodology (see Table 5). We focused on pipelines with disturbance area broken out by land cover type in the documentation, and with pipeline segments within the DRB. Three pipeline projects had segments entirely within the DRB with detailed land cover impact estimates: the Leidy SE Franklin Loop, the TEAM 2014 Bernville Loop, and the two loops in the East Side expansion project. While these projects all fit these criteria, they are also primarily looping projects. Thus we also included the Broome County section of the Constitution pipeline, which is mostly within the DRB, in orderFor validation, we elected to compare the new area impacted for forest, and for allland cover types. Table 6 displays the validation results for forest area impact, and Table 7 for total area impact (all land cover types). The definitions of land cover class groupings for computation of area impact varied by pipeline project. In some cases, the existing right-of-way area was not separated from the total impact area. Generally, the “Open Space” land cover type included the existing pipeline ROW areas. In these cases, we left out the “Open Space” land cover type (where existing ROW area was included in the documentation) from the total. We have denoted the projects to which this assumption was applied with an asterisk. We analyzed theGenerally, our GIS estimates of forest disturbance are about 25 percent high forpermanent ROW, and 13 percent high for construction ROW as compared to the pipeline documentation. By contrast, GIS estimates of total disturbance are
16

percent high for permanent ROW and 3 percent low for construction ROW, whichamounts to an overall average error of 1.5 percent high.
Table 6.
Validation of new forest disturbance [ac] from pipeline documentation(“Document”) versus GIS estimates for the permanent and construction ROWs
Table 7.
Validation of total new disturbance area [ac] from pipelinedocumentation (“Document”) versus GIS estimates for the permanent and construction ROWs
* Open Space excluded from calculations because pipeline documentation does not distinguish open space in existing ROWs from new open space impacts.
17
Pipeline Project
New Permanent ROW Document GIS Error
[ac] [ac] [%]
Construction ROW Document GIS Error
[ac] [ac] [%]Leidy SE - Franklin 36.1 33.9 -6.0% 77.7 75.6 -2.7%TEAM 2014 - Bernville *
16.4 18.4 12.0% 69.7 61.5 -11.7%East Side - NJ * 65.5 65.2 -0.3%East Side - PA * 89.7 82.7 -19.4%Constitution (Broome County)
93.4 100.9 8.0% 211.1 211.7 0.3%
Median 8.0% -2.7%Weighted Average 145.9 153.2 5.0% 513.6 496.8 -3.3%
Pipeline Project
New Permanent ROW Document GIS Error
[ac] [ac] [%]
Construction ROW Document GIS Error
[ac] [ac] [%}Leidy SE - Franklin 14.9 21.9 47.5% 42.6 51.8 21.5%TEAM 2014- Bernville
5.9 6.7 13.6% 22.6 26.3 16.6%East Side - NJ 10.3 3.0 -70.8%East Side - PA 21.4 25.0 16.9%Constitution (Broome County)
47.5 56.6 19.1% 98.5 114.3 16.0%
Median 19.1% 16.6%Weighted Average
68.3 85.2 24.8%
195.5 220.5 12.8%

Land Cover Distribution near PipelinesLand cover disturbance area estimates could theoretically be sensitive to small errorsor potential changes in pipeline route information. It is common that pipelines may have small shifts in routing all the way through construction. For instance, the PennEast pipeline has a 400-foot right-of-way “study area” to account for some of these potential shifts in the final route [26]. In addition, the GIS pipeline route data on which we based this analysis was of varying spatial accuracy (generally within 50Before investigating the new disturbance areas within the pipeline ROWs only, weinvestigated the sensitivity of the land cover impact area to uncertainty in pipeline route. To do so, we computed the land cover characteristics of the larger areas in successively wider ‘corridors’ around proposed pipeline routes. Here we assume a symmetric buffer and we don’t exclude existing ROW, so the calculation method isWe examined the land cover distribution as a function of distance from the proposedroute by progressively increasing the buffer width from the pipeline. If the distribution does not change as the buffer distance increases, we can be reasonably confident that the errors associated with route uncertainty are relatively small. If the relative proportions of a given land use change as the buffer distance (i.e. ROW width) increases, then pipeline siting may be effectively avoiding (or targeting) certain types of land uses. Plotting the areas of disturbance versus pipeline ROW width also gives an idea of the general makeup of the land cover in the neighborhoodWe first investigated the area very close to the pipeline at several ROW widths,including 10 feet (minimum in areas such as wetlands), 30 feet (typical cleared ROW width in the permanent easement), 50 feet (typical permanent easement), and 100 feet (typical construction easement).Figure 5 displays these results, which do not exclude existing ROW, and so is notsolely new disturbance area. Figure 6 displays the results for larger buffer distances (up to a width of 400 feet) on a continuous stacked area plot. For each land cover type, the increase is nearly linear.
18

Figure 5.
Land cover disturbance area for typical ROW widths for the 8 proposedpipeline projects
3500 Land Co v er 3000 Water
Grassland/ Shrub Wetland DevelopedAg-Cultivated Ag-Pasture Open SpaceForest
2500200015001000500
010
30
50
100ROW width
[ft]
Figure 6.
Disturbance area by land cover type versus theoretical ROW buffer widthfor the 8 pipelines examined in the DRB
14000 Land Co v er
Water Grassland/ Shrub Wetland DevelopedAg-Cultivated Ag-Pasture Open SpaceForest
12000100008000600040002000
050
100 150 200 250 300350
ROW width [ft]
400
19
Dis
trur
banc
e Ar
ea
[ac]
Dis
turb
ance
Are
a [a
c]
1351
702441
154

We can check these results to see whether the increase in area versus increase inROW width for particular land use types is truly linear. First we analyze forest impacts. Figure 7 shows the amount of forest area affected versus pipeline ROW width. In this case, the forest area is normalized to the pipeline length, so the vertical axis shows impacted acreage per mile of pipeline. The figure demonstrates that the trend is very much linear. By fitting a trendline to the data, we generate a useful equation that gives the expected forest area impacted per mile for each additional foot of pipeline ROW width. In this case, the slope of the trendline indicates that, on average, each mile of new pipeline in the DRB will affect 0.04 acres of forest for each
Figure 7.
As ROW width increases, forest area impacts increase in a linear fashion.
Many of the other land cover types show a similar pattern. For wetlands, the trend isnearly linear (see Figure 8). Based on this analysis, the slope of the trendline indicates that, on average, each mile of new pipeline in the DRB will affect 0.002 acres of wetland for each foot of ROW width. So, a 50-foot ROW will affect roughly 0.1 acresThe equations presented here can provide a useful means for generating an initialestimate of the potential impact from pipeline development in the DRB if no information is known about the specific route. Though we add the caveat that the relationships are based on the eight pipeline projects we examined. A more localized analysis would then be needed to generate more refined estimates of the impacts for
20

Figure 8.
As ROW width increases, the increase in wetland impact area is nearlylinear
Land Cover Impact in the DRBFigure 9 displays the total new disturbance area in the DRB associated with ROWconstruction for the eight proposed pipelines projects. The results for the new permanent ROW are shown on the left, and the construction ROW on the right, each computed via three separate methodologies (refer to Table 5). Labels on the graphMethod A is the best estimate using asymmetric buffers, and excluding existing ROW.Method B is the symmetric buffer method excluding existing ROW. Method C is the symmetric buffer method with no exclusions. The forest impact area and total area in acres are labeled on the chart. We note that the computations for Methods A and B are very similar for the permanent ROW, but are different for the construction ROW. This is likely due to the fact that the asymmetric buffer used for Method A would create less overlap with existing ROW than the symmetric buffer method used in Method B. Method C does not exclude any existing ROW, and is unsurprisingly the
21
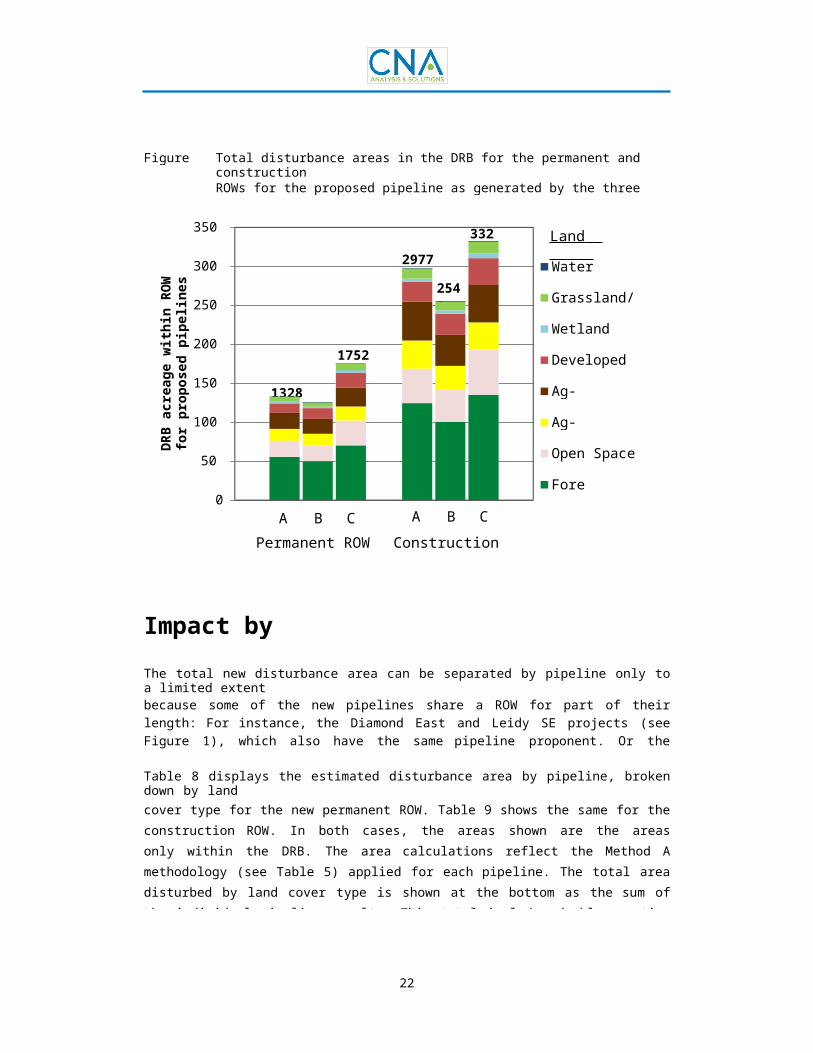
Figure 9.
Total disturbance areas in the DRB for the permanent and constructionROWs for the proposed pipeline as generated by the three GIS methods (A,B, &C) used in this study
3500 Land Co v er 3000
Water
Grassland/Shrub2
500 Wetland2000 Developed1500 Ag-Cultivated
1000
Ag-PastureOpen Space5
00 Forest0
A B CA B CPermanent ROW
Construction ROW
Impact by PipelineThe total new disturbance area can be separated by pipeline only to a limited extentbecause some of the new pipelines share a ROW for part of their length: For instance, the Diamond East and Leidy SE projects (see Figure 1), which also have the same pipeline proponent. Or the Mariner East and East Side Expansion projects, which intersect each other.Table 8 displays the estimated disturbance area by pipeline, broken down by landcover type for the new permanent ROW. Table 9 shows the same for the construction ROW. In both cases, the areas shown are the areas only within the DRB. The area calculations reflect the Method A methodology (see Table 5) applied for each pipeline. The total area disturbed by land cover type is shown at the bottom as the sum of the individual pipeline results. This total includes double-counting of some area where the proposed pipeline ROWs cross or are parallel. Hence, we also present
22
DRB
acr
eage
wit
hin
ROW
for
prop
osed
pip
elin
es
3322977
2548
1752
1328 1257
1351
1245 100
5702555 499
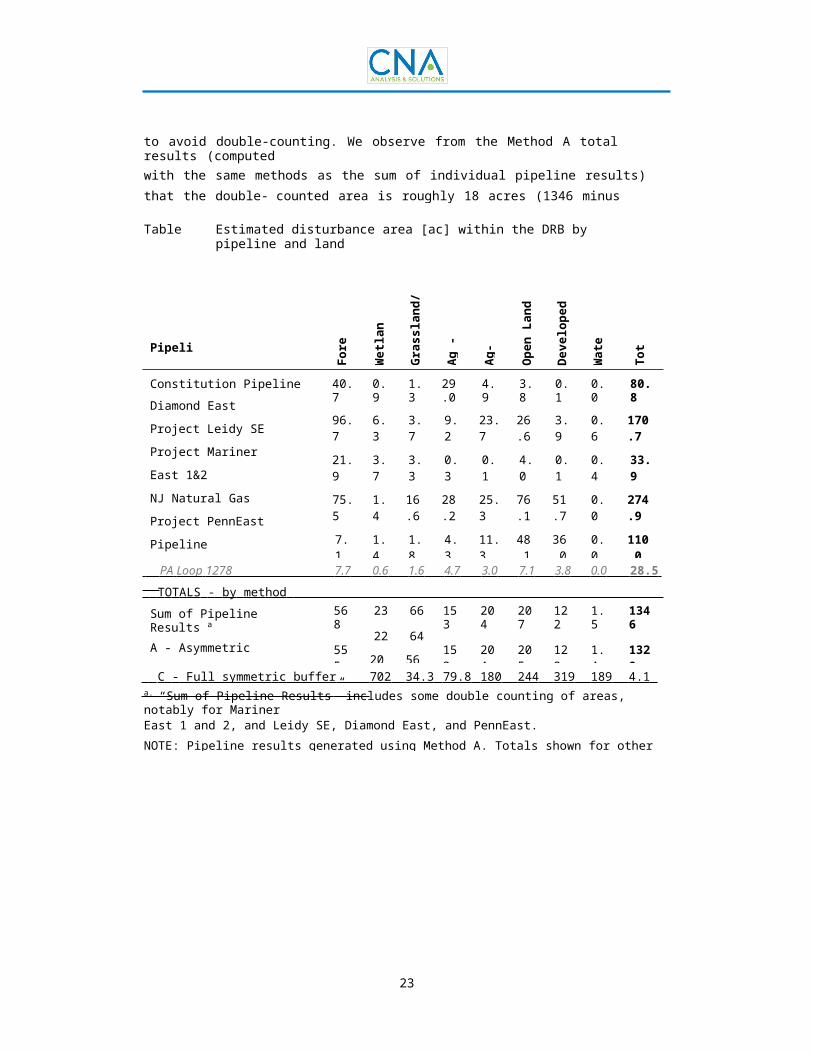
to avoid double-counting. We observe from the Method A total results (computedwith the same methods as the sum of individual pipeline results) that the double- counted area is roughly 18 acres (1346 minus 1328). Results for Methods B and CTable 8.
Estimated disturbance area [ac] within the DRB by pipeline and landcover type for the new permanent ROW
PipelineConstitution PipelineDiamond East Project Leidy SE Project Mariner East 1&2NJ Natural Gas Project PennEast PipelineTEAM 2014 Expansion Proj. East Side Expansion
40.7
96.7
21.9
75.5
7.1
311.2
6.7
8.6
0.9
0.9
6.3
3.7
1.4
1.4
6.6
0.1
2.5
1.9
1.3
3.7
3.3
16.6
1.8
36.7
0.4
2.0
0.4
29.0
9.2
0.3
28.2
4.3
72.8
2.5
6.8
2.1
4.9
23.7
0.1
25.3
11.3
132.3
2.5
4.2
1.2
3.8
26.6
4.0
76.1
48.1
33.8
2.7
12.0
4.9
0.1
3.9
0.1
51.7
36.0
14.1
3.3
12.9
9.0
0.0
0.6
0.4
0.0
0.0
0.4
0.1
0.0
0.0
80.8
170.7
33.9
274.9
110.0607.9
18.4
49.020.6
PA Loop 1278 7.7 0.6 1.6 4.7 3.0 7.1 3.8 0.0 28.5
T O T A LS - by me t hod 568
555
499
23
22
20.2
66
64
56.4
153
153
149
204
204
192
207
205
200
122
122
137
1.5
1.4
3.2
1346
1328
1257
Sum of Pipeline Results aA - Asymmetric buffer B - Symmetric C - F u ll symmetr i c buffer 702 34.3 79.8 180 244 319 189 4.1 17 52
a. “Sum of Pipeline Results” includes some double counting of areas, notably for MarinerEast 1 and 2, and Leidy SE, Diamond East, and PennEast.NOTE: Pipeline results generated using Method A. Totals shown for other methodologies by comparison. Totals may not sum exactly due to rounding.
23
Fore
st Wet
lan
d Gra
ssla
nd/
Shru
bAg
- Pa
stur
eAg
- Cu
ltiv
ated
Ope
n La
ndD
evel
ope
d Wat
er To
tal

Table 9.
Estimated disturbance area [ac] within the DRB by pipeline and landcover type for the new construction ROW.
PipelineConstitution PipelineDiamond East Project Leidy SE Project Mariner East 1&2 Southern Reliability Link PennEast PipelineTEAM 2014 Expansion Project East Side Expansion Project
80.8
295.7
51.8
172.0
16.2
633.3
19.7
24.8
2.5
1.5
15.1
6.1
3.9
2.7
11.1
0.3
4.3
3.1
2.4
8.0
5.4
39.6
3.5
71.3
0.8
5.2
1.3
65.0
28.8
0.9
64.7
11.4
164.3
6.4
20.1
6.8
11.1
71.5
0.3
64.2
29.8
305.8
7.3
11.5
3.8
8.1
74.4
10.0
160.2
83.2
70.7
6.9
34.2
13.8
0.4
11.7
0.3
100.9
68.0
27.9
7.4
36.5
24.8
0.0
2.2
0.8
0.1
0.0
0.7
0.1
0.0
0.0
169.3
507.4
75.6
605.7
214.71285.1
48.9
136.656.2
PA Loop 1278 22.3 1.2 3.8 13.3 7.7 20.4 11.8 0.0 80.5
T O T A LS - by me t hod 1294
1245
1005
45
41
42
136
133
112
362
361
299
501
501
398
448
440
414
253
253
272
3.9
3.3
6.6
3043
2977
2548
Sum of Pipeline Resultsa
A - Asymmetric buffer B - Symmetric C - F u ll w i dt h symmetr i c buffer 13 51 65 149 344 479 582 344 8.1 33 24
a. “Sum of Pipeline Results” includes some double counting of areas, notably for MarinerEast 1 and 2, and Leidy SE, Diamond East, and Penn East.NOTE: Pipeline results generated using Method A. Totals shown for other methodologies by comparison. Totals may not sum exactly due to rounding.
Impact by CountyWe computed the total area impact by county by intersecting the Method A totalimpact area in the DRB with county boundaries. Figure 10 maps the construction ROW impact by county. Shading shows the total area impacted by construction ROW within the DRB portion of each county. Stacked bars on the map show the breakdown of the impacted area by land cover type. See Appendix A for the results by county in tabular format. (Table 11 displays the county-level area impact for the new
24
Fore
st Wet
lan
d Gra
ssla
nd/
Shru
b
Ag -
Past
ure
Ag-
Cult
ivat
ed
Ope
n La
nd
Dev
elop
ed W
ate
r Tot
al
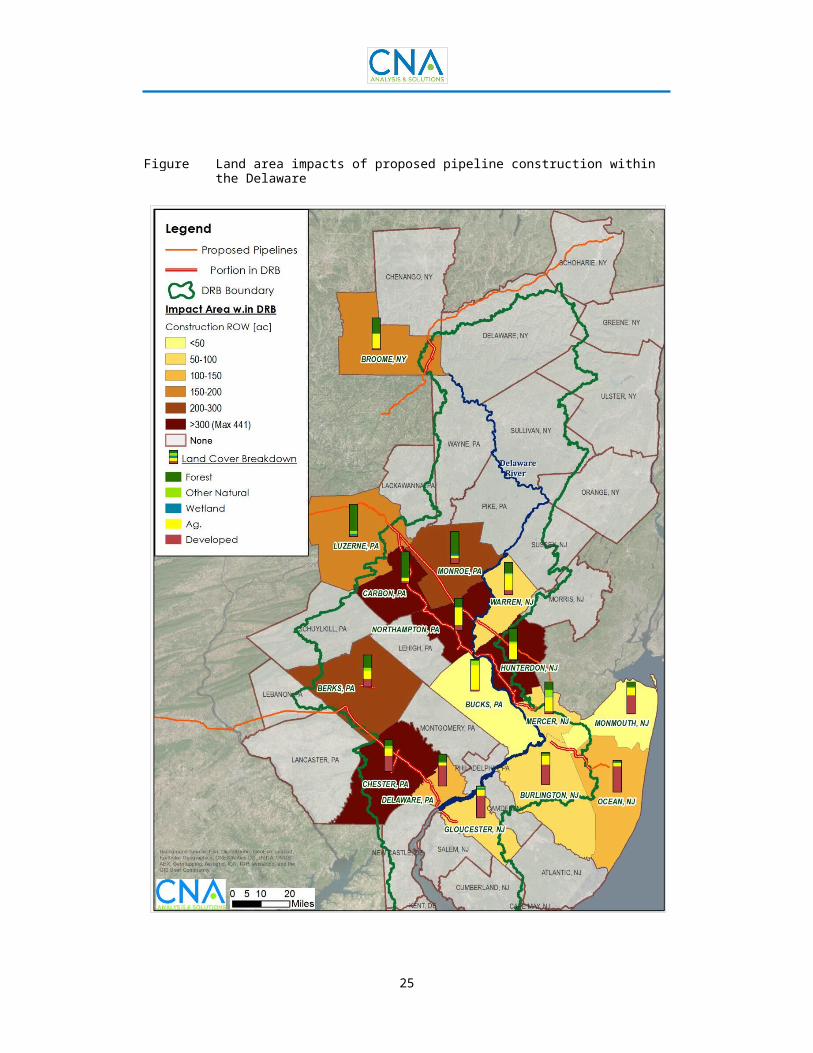
Figure 10.
Land area impacts of proposed pipeline construction within the DelawareRiver Basin (DRB), by county
25

In Figure 9, it appears the impacts will be most concentrated in the central portion ofthe DRB. Carbon, Monroe, and Hunterdon counties all have in excess of 200 acres of land disturbance, while Northampton has the highest of any county, with 441. These counties also have the largest percentage of the impact affecting forests. For instance, over 75 percent of the total impact area in Luzerne and Carbon countiesThe lower portion of the watershed also has a concentration of impacts. Chester andBerks Counties each have over 200 acres affected during construction. The land cover types impacted are distributed more across agriculture, developed land, and forests than in the middle portion of the basin.Broome is the only county with impacts in the upper basin. The area of impact isroughly evenly divided between forest and agriculture.Overall, the breakdown of land cover types affected by pipeline development followthe general land cover patterns of the DRB as a whole: predominantly forest in the Upper and Western portions of the basin, more agriculture in the middle and Eastern portions, and finally, much more developed land in the lower portion of
Impact by WatershedIn addition to analyzing the results by county, we also investigated the results byusing hydrographic boundaries. We totaled the results by Hydrologic Unit Code–10 digit (HUC10) watershed using data from the USGS Watershed Boundary Dataset [40]. In Figure 11, we display the results for new permanent ROW area by HUC10 watershed as a stacked bar chart. Figure 12 shows similar results for the new construction ROW. On the left, the HUC10s are grouped by the larger HUC8 watershed subdivision, with the HUC8 names labeled. (Figure 13 shows the spatial location of both the HUC10 and HUC8 boundaries.) The bold number labels on the graph indicate total area impacted in acres. The breakdown of the area by land coverFigure 13 shows the total new construction ROW area impact on a map instead.(Shading denotes total new construction ROW area [ac] by HUC10 for the proposed pipeline projects.) It is clear from the map that the most area will be affected through the middle portion of the DRB, especially in the Lehigh and Middle Delaware HUC8 watersheds, and to a lesser extent the Schuylkill, Brandywine-Christina, and Lower Delaware watersheds. These areas, especially the Lehigh subbasin, also have
26

are awel De
Middl
h gLehi
Crosswicks- Neshaminy
Lower Delaware
Upper Delaware
Brandywine-Christina
l kill
Schuy
Figure 11. New permanent ROW land cover breakdown by watershed (HUC10),with grouping by HUC8 watershed name (labels show total impact area)
WatershedH U C8 Name HUC1
0 Labels: Total area [ac]
204010103
204010408
204010503
204010504
204010505
204010506
204010509
204010601
204010602
204010603
204010604
204010605
204010608
204020101
204020104
204020201
204020206
204020303
204020304
204020306
204020307
204020310
204020501
6.8
27.7
11.7
10.3
55.0
40.5
75.9
62.7
53.9
76.1
26.9
7.0
8.6
40.5
61.9
12.3
1.9
0.0
100.0
200.0
300.0New Permanent ROW area
[ac]
27
Schu
ylki
llLe
hig
hM
iddl
e De
lawa
re
Brandywine-Christina
Lower Delaware
Crosswicks- Neshaminy
80.7
102.7
134.1
213.2
Forest
104.2 Wetland Open SpaceAg - Cultivated Ag - Pasture Developed Grassland/Shrub
113.0 Water
Upper Delaware
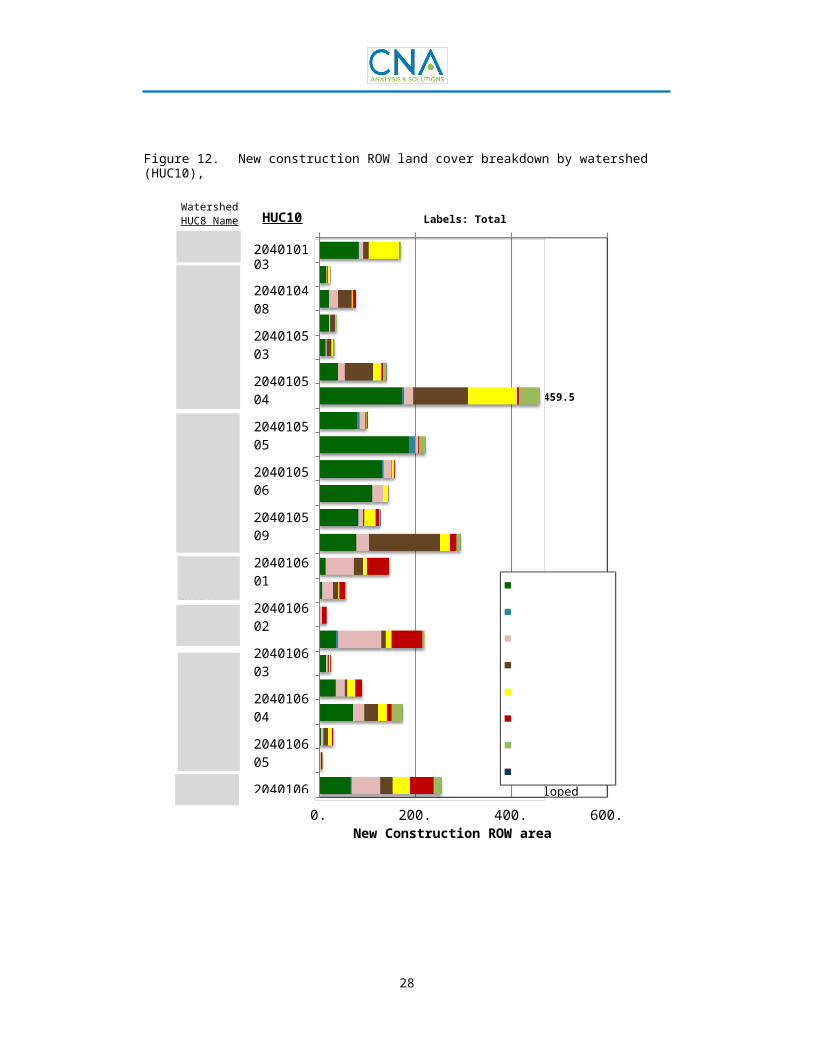
Figure 12. New construction ROW land cover breakdown by watershed (HUC10),with grouping by HUC8 watershed name (labels show total impact area)
WatershedH U C8 Name HUC1
0Labels: Total area [ac]
204010103
204010408
204010503
204010504
204010505
204010506
204010509
204010601
204010602
204010603
204010604
204010605
204010608
204020101
204020104
204020201
204020206
204020303
204020304
204020306
204020307
204020310
204020501
22.0
75.3
34.830.4
139.8
99.6
155.8
143.7
126.9
145.6
55.0
14.1
23.2
88.9
28.2 rub
5.9
0.0
200.0
400.0
600.0New Construction ROW area
[ac]
28
Lehi
ghMi
ddle
Del
awar
eSc
huyl
kill
Brandywine-Christina
Lower Delaware
Crosswicks- N
169.2
220.8
293.8
459.5
Forest Wetland
218.1 Open Space
Ag - Cultivated Ag - Pasture
172.5 Developed
Grassland/
Sh Water
Upper Delaware
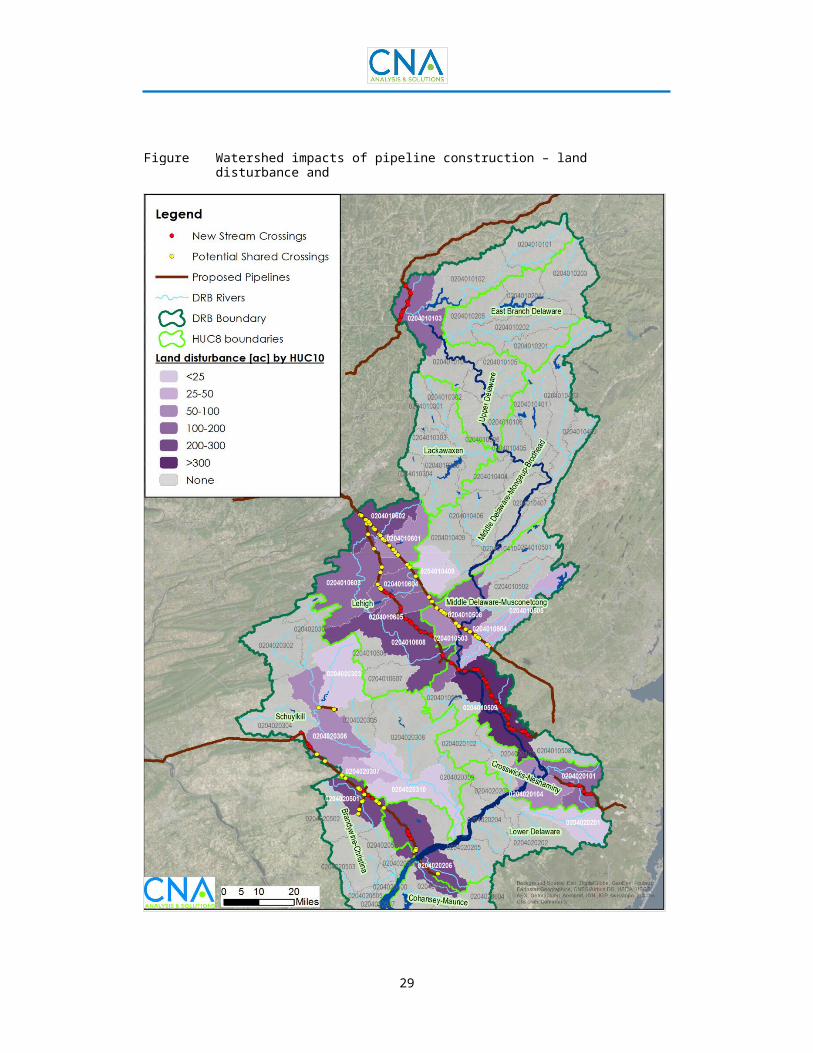
Figure 13.
Watershed impacts of pipeline construction – land disturbance andstream crossings (labels show HUC10 numbers)
29

Potential Stream CrossingsStream crossings are a particular area of concern for pipeline development, as landin close proximity to waterways is at high risk for erosion, nutrient export, and potential pollutant export. In addition, any sediment or pollutants that enter theWhile the final EIS documents approved by FERC for pipeline projects contain listingsof the proposed stream crossings, it is difficult to determine the total number of stream crossings for all eight projects for several reasons. Not all of the pipelines have final EIS documents, and the location of stream crossings is not in a consistent format across the different documents. In some cases, it is difficult to assess whether certain streams are within the Delaware River Basin. For these reasons, we assessed stream crossings using a consistent methodology for all of the proposedWe computed the number of stream intersections4 in GIS using the pipeline routeinformation and the National Hydrography Dataset Plus Version 2 (NHDPlus v2) stream flowlines. The NHDPlus v2 dataset is fairly high resolution (stream segments drain less than one square mile on average in the Delaware River basin), but does notWe also accounted for the possibility that existing stream crossings could be usedwhere proposed pipelines are parallel to existing pipelines. We assumed that when an existing pipeline intersected the stream within 250 feet5 of the proposed pipeline’s crossing, a shared crossing would be used.Figure 13 shows these intersection points that indicate stream crossings. The yellowpoints indicate crossings that have some potential to share an existing crossing. The red points indicate “new” crossings that are not adjacent to existing pipelineIn total, we found 175 potential new crossings, of which 92 have the potential to be“shared” crossings with existing pipelines.
4 We used the ArcGIS Intersect tool with the pipeline routes and NHDPlus flowlines as inputs(both are polyline datatype), which results in a point file with a point marking each location a stream and a proposed pipeline intersect.5 We generated a second set of intersection points using existing pipeline routes and NHDPlus flowlines. Then we computed the number of proposed intersection points falling within 250 feet of these intersections. We chose 250 feet as a generous buffer that can identify potential shared crossings even when the stream line is nearly parallel to the
30
This total counts only intersections with streams in the NHDPlus database, and likelydramatically undercounts the total number of stream crossings due to many intermittent and ephemeral streams not included in the database. We note that the environmental assessment documents issued by FERC and the pipeline proponents usually provide a more complete accounting of potential stream crossings, most likely gathered from local field and site analysis. As an example, a permit application to Delaware River Basin Commission for the Mariner East project found over 180 potential stream crossings, the great majority of which are intermittent or ephemeral [23]. Without the ability to do field investigation, or access to much more complete stream data for the entire basin, we were limited to identifying crossings of the
Best Estimate of ImpactsForest Area ImpactsThe metrics presented in this report present an estimate of the land cover impacts ofpipeline construction. The estimates for individual land cover type impacts depend heavily on the accuracy of the pipeline routes, and the accuracy of the NLCD data used. As mentioned previously, we observed that existing pipeline rights-of-way were often classified as forest in the NLCD, which may slightly overestimate forest impact area. To a lesser extent, pipeline routes running through or adjacent to low-density residential (or agricultural) land with some tree canopy may also be classified asIn order to partially account for these potential discrepancies, we used our validationdata (refer to Table 6) to develop adjustment factors for forest area impact. We report three key metrics in Table 10, computed in three ways: First, the GIS results for both the construction and permanent ROW areas, computed via the asymmetric method (A). The third metric is the permanently cleared forest area that would be within the permanent ROW, commonly estimated to be 30 feet wide (see, for example, [19]). This metric identifies the forest impact over the longer term, assuming some of the permanent ROW (outside 30 feet) is allowed to regrow, while still leaving the center of the ROW cleared.6 Since our results show forest area impact
6 This metric is almost certainly a low estimate of potential impact since many pipelineoperators may elect to keep the entire permanent ROW clear. This also does not take
intoaccount looping projects where one side of the permanent ROW may be shared with an existing pipeline, and therefore would not be suitable for allowing forest regrowth.
31
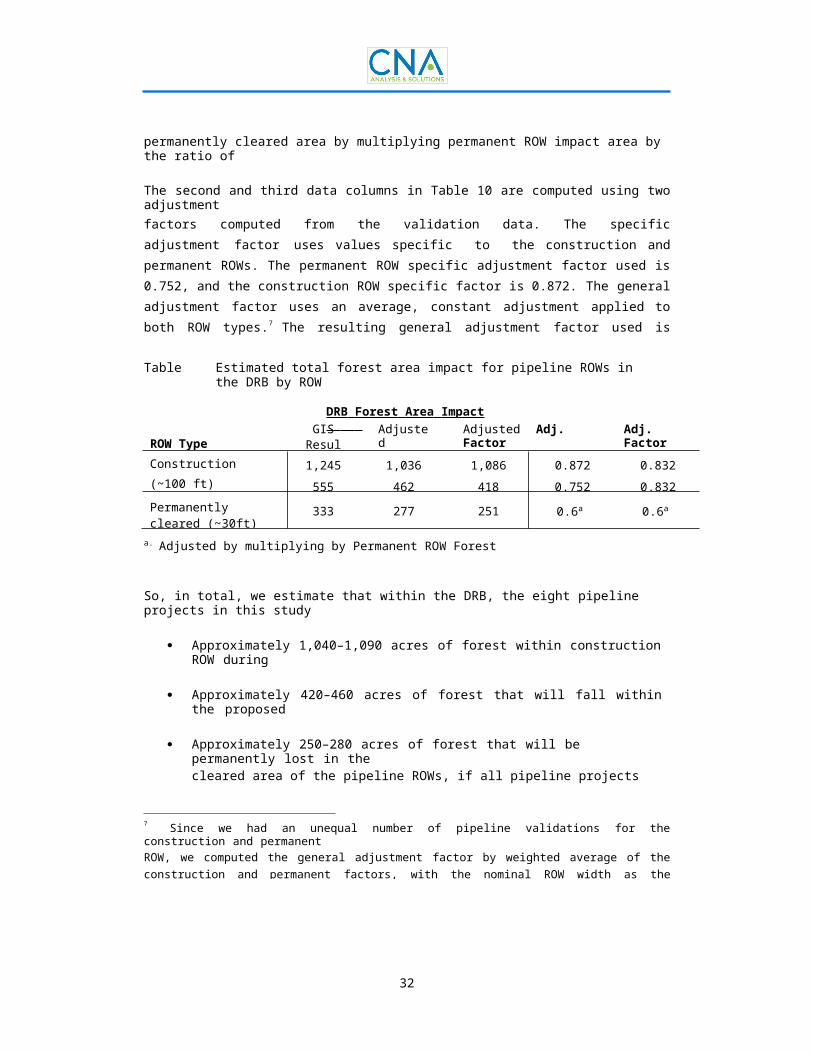
permanently cleared area by multiplying permanent ROW impact area by the ratio ofwidths (30/50), or 0.6.The second and third data columns in Table 10 are computed using two adjustmentfactors computed from the validation data. The specific adjustment factor uses values specific to the construction and permanent ROWs. The permanent ROW specific adjustment factor used is 0.752, and the construction ROW specific factor is 0.872. The general adjustment factor uses an average, constant adjustment applied to both ROW types.7 The resulting general adjustment factor used is 0.832, or a 16.8 percent reduction in forest area from GIS results. In all cases, the permanently cleared area estimate is computed by multiplying the permanent ROW estimate byTable 10.
Estimated total forest area impact for pipeline ROWs in the DRB by ROWtype for the eight proposed pipelines in this study
DRB Forest Area Impact [ a c] GIS
Results
Adjusted(Specific)
Adjusted Adj. Factor(General) (Specific)
Adj. Factor(General)
ROW Type (width)
a. Adjusted by multiplying by Permanent ROW Forest Impact Area
So, in total, we estimate that within the DRB, the eight pipeline projects in this studywill impact:
Approximately 1,040–1,090 acres of forest within construction ROW duringconstruction
Approximately 420–460 acres of forest that will fall within the proposedpipelines’ new permanent ROWsApproximately 250–280 acres of forest that will be permanently lost in thecleared area of the pipeline ROWs, if all pipeline projects keep only 30 feet of width in the permanent ROW cleared.
7 Since we had an unequal number of pipeline validations for the construction and permanentROW, we computed the general adjustment factor by weighted average of the construction and permanent factors, with the nominal ROW width as the weight. That is, the construction ROW factor had twice the weight as the permanent factor.
32
Construction (~100 ft) Permanent (~50 ft)
1,245555
1,036462
1,086418
0.8720.752
0.8320.832
Permanently cleared (~30ft) 333 277 251 0.6a 0.6a

We note that these estimates do not include all potential forest impacts for thepipelines’ construction. Typically, pipeline construction requires additional area for pipeline facilities (compressors, pumps, valves, terminals), temporary workspace for equipment storage and staging, as well as access roads to bring equipment and materials to the working ROW. A spatial analysis of the location of these facilities and their associated impacts was beyond the scope of this study. However, based on pipeline documentation, the potential additional area associated with these facilities ranges from about 17 percent of total area impact for greenfield projects (e.g., Constitution [19]) to over 30 percent for looping projects (Leidy SE Franklin Loop [20], East Side Expansion [37]). Relative to the pipeline ROW area only (not the total impact area), these percentages are 20 percent for greenfield projects, and 45
Wetland Area ImpactsFor wetland impacts, developing reasonable adjustment factors is impracticalbecause of the small areas involved for any individual pipeline. We report the results for our GIS analysis (Method A), which did take into account narrower ROWs when passing through wetland areas. In total, we estimate that within the DRB, the eight
41 acres of wetlands within the construction ROW
22 acres of wetlands within the new permanent ROW.
33

DiscussionThis analysis computed the cumulative impacts of eight proposed natural gastransmission pipelines on existing land cover in the Delaware River Basin (DRB). The length of the new pipelines will total 322 miles within the DRB, a length roughly equivalent to the Delaware River itself. We found that the total area of new land disturbance is 2,977 acres (4.7 square miles) during construction and 1,328 acres (2.1 square miles) in the permanent right-of-way (ROW). These impacts only account for the ROWs directly, and not total impacts for associated activities such as road buildings, or equipment storage. Forests account for over one-third of the land area impacted (roughly 40 percent before adjustment). The basin-wide totals don’t present the whole story, however. Our analysis showed that results vary significantlyWe found that the cumulative area of impact was far greater than for any individualpipeline project, but several of the projects do have disproportionate impacts compared to the others. In part, this depends on the pipeline route and construction methods. Unsurprisingly, our results indicate that greenfield pipeline projects result in more land disturbance and forest loss per mile than looping projects or those that parallel an existing ROW. Combined, the PennEast, Constitution, and NJ Natural Gas Southern Reliability Link projects, which are all predominantly greenfield projects, account for well over half of the total potential disturbance area. The PennEast pipeline project has the largest potential impact within the DRB. The Mariner East 1 and 2, and Diamond East projects would affect a large amount of acreage due to their length, but less than they otherwise would, as the majority of their length is adjacent to existing pipeline ROWs. This reduction in affected acreage is more evident in the permanent ROW results than the construction ROW results, possibly because the wider working side of the pipeline usually can’t be shared with existingThe pipeline results also indicate a few key portions of the watershed withdisproportionate impacts. The PennEast, Diamond East, and Leidy SE projects cross through the middle portion of the basin, especially the Lehigh, and Middle Delaware subbasins in Carbon, Northampton, Hunterdon, Luzerne, Monroe, Mercer, and Warren counties. These projects in particular pass through heavily forested areas, and account for the largest impacts on forests in the basin. The Mariner East, East Side Expansion, and Southern Reliability Link projects substantially affect the
34
lower portion of the watershed, where the land cover tends to be more agricultural ordeveloped. Finally, the Constitution Pipeline is the only pipeline of the eight affecting the Upper portion of the watershed as it passes through Broome County, NY. The land cover along its route is split between agriculture and forest. Of course,This analysis also demonstrated how geospatial analysis can be used to determine arough estimate of land disturbance area based only on pipeline route information. There is often a considerable delay between the initial route proposal for a pipeline and the environmental analysis or environmental impact statement that includes a full accounting of the land cover impacts using detailed ROW information. The pipeline proponent and FERC will have access to the most authoritative information on the project, and are in the best position to assess potential impacts with a high degree of certainty. The higher-resolution data for both the pipeline ROW and potentially, existing land cover (plus, likely field surveying) allow a higher degree of certainty than we could achieve in this analysis. Nonetheless, our methodology in this report demonstrates that a fairly accurate initial estimate of impacts can be generated using only proposed and existing pipeline route information and the National Land Cover Dataset (NLCD). We validated our results, and found that the error in total disturbance area was less than 5 percent compared to the FERC environmental analysis documents. The specification of forest area impacted requires an adjustment factor to account for uncertainty and coarse resolution in We also determined that small errors in the pipeline route are not likely to beextremely consequential with respect to land cover breakdown. Changes in overall length due to altered routes will of course affect acreage of impact, but small perturbations or uncertainty in the proposed route may not greatly affect results. The overall breakdown of land cover disturbance is nearly constant as theoretical ROW width expands, even far beyond the construction ROW. This leads to some potentially useful rules of thumb for pipeline construction. For instance, a 50-foot ROW will affect, on average, four acres of forest per mile in the DRB (based on theThere are several ways this analysis could be expanded in the future. First, theanalysis method could be applied to other geographic areas such as the Susquehanna River Basin or the entire State of Pennsylvania. At present, this analysis considers only land cover changes due to development of the pipeline ROWs, and potential stream crossings, but no secondary impacts on land or water resources. The results from this study could feed into secondary impact analyses. For instance, the permanent pipeline ROWs could be used with existing land cover data to estimate secondary forest impacts such as fragmentation and loss of core forest as a result of
35

cover distribution could be used as inputs in a water quality model to estimatepotential changes in sediment loading to streams.It is worth noting that in Pennsylvania, pipelines are a special topic of concernbecause of the rapid increase in shale gas development since 2007. Some estimate that 30,000 miles of additional pipelines may be constructed in Pennsylvania in the next 30 years [41]. The majority of those will likely be the smaller gathering lines to move gas from production wells to the existing distribution network, but new transmission lines will also be needed to handle the increased production. In 2015, Pennsylvania Governor Tom Wolf appointed a pipeline task force, managed by the PA Department of Environment Protection, to study pipeline impacts in Pennsylvania and come up with a list of recommendations [42]. Similar to the motivations of this study, the task force found that the pipeline approval and permitting review process may not always account for long term, cumulative impacts: “Chosen routes do not necessarily avoid sensitive lands, habitats, and natural features. . . . Impacts to natural and cultural resources, landowners, and communities along them not always avoided, minimized or mitigated. . . . Individual decisions can accumulate into a much broader and longer impact on the citizens and the lands of a The Pipeline Task Force’s report included 12 top recommendations, and 184 overallrecommendations for improving the pipeline infrastructure development process in Pennsylvania [43]. These recommendations may affect the permit and approval process in the future, and thus, pipeline routing and construction methods. (Note that no policy changes have been adopted, and these state level recommendations likely will not directly affect the FERC process.) Accordingly, the methodology used in this study would have to be adapted to account for potential changes where possible. Some of the most relevant recommendations relate to better information sharing about pipeline routes, planning routes to avoid or mitigate environmental impacts, and construction methods and offsets to reduce net environmental impacts. The recommendation for earlier information sharing about proposed pipeline routes (including GIS data) would make assessing impacts with a methodology like the one used in this study easier. Other recommendations might affect ROW routes or widths. For instance, the recommendation to “Reduce Forest Fragmentation in Pipeline Development” could discourage routes from going through core forest areas. The recommendation to “Minimize Impacts to Riparian Areas at Stream Crossings” could result in changing assumptions about ROW width near stream crossings. Finally, several recommendations include policies for either mitigation watersheds, riparian buffers [43].
These types of policies would require moreclarification in order to be modeled, and the methodology would have to account
forthe policies’ impact through adjustment factors or additional assumptions (e.g., assume forest area loss is replaced within the same watershed).
36

In summary, the next several years and decades will witness much more pipelinedevelopment in Pennsylvania and the Delaware River Basin. The pipeline projects will result in some impacts to land resources, water resources, cultural resources, ecosystems, and air quality, among others, even after accounting for project-specific mitigation measures. Analyzing several projects at once can give a clearer picture of potential cumulative impacts, but it requires timely and accurate geospatial information on proposed pipeline routes. It appears likely that Pennsylvania will consider recommendations to change the pipeline infrastructure development process to further mitigate or avoid impacts, especially for particularly sensitive resources. These changes may complicate future analyses such as this one, but mayAnalyzing the cumulative impacts of concurrent pipeline projects is likely to be anongoing need in Pennsylvania, for FERC interstate transmission pipeline proposals, and wherever pipeline infrastructure is being expanded. Pipelines are necessary to move liquid fuels across the country; they are an efficient means of transport, but their development does have short-term and long-term impacts on the landscape over which they are built. Policymakers at various levels may find analyses such as that presented in this study useful for comprehending how new pipeline proposals add to the cumulative impacts in geographic areas of interest. They may then determine whether mitigation measures may be appropriate, based on cumulative
37

Appendix A: County and WatershedResults TablesTable 11 displays the county-level area impact for the new permanent ROW, andTable 12 does so for the construction ROW.Table 13 shows the impact area for the permanent ROW, broken down by land covertype and HUC10 watershed. Table 14 shows the impact area for the construction ROW, broken down by land cover type and HUC10 watershed.Table 15 shows the number of stream crossings in each HUC10 watershed. Thesecrossings reflect points of intersection between proposed pipeline routes and NHDPlus v2 stream flowlines within the DRB. We used existing pipeline routes to identify where existing crossings are located. In situations where a proposed pipeline’s crossing is within 250 feet of an existing crossing, there may be the potential for a shared crossing, which could reduce the impact of the stream crossing. It is certainly possible these potential shared crossings may require a new crossing. Nonetheless, we have identified the total number of crossings, potential “shared” crossings, and the remaining crossings—which, by default, will be “new”construction,projects.
and the potential
shared crossing
locations are
typical
for looping
38

Table 11.
Total land disturbance by county for new permanent ROWsa
County Burlington, NJGloucester, NJ Hunterdon, NJ Mercer, NJ Monmouth, NJOcean, NJ
2.8
0.9
76.0
10.5
2.0
2.4
0.6
1.9
1.2
1.4
0.1
0.8
0.8
0.4
10.8
11.6
0.4
0.5
2.4
2.1
39.2
8.4
1.6
0.4
6.3
1.2
40.5
9.9
2.4
2.6
18.6
4.9
7.5
2.5
7.6
21.9
10.4
9.0
0.7
1.2
1.9
23.6
0.0
0.0
0.0
0.0
0.0
0.0
41.9
20.6
175.9
45.5
15.952.2
W a r r en, NJ 9.3 0.4 0.5 1.1 14.0 3.8 0.5 0.1 29.6 Broome, NY 40.7 0.9 1.3 29.0 4.9 3.8 0.1 0.0 80.8 Berks, PABucks, PA Carbon, PA Chester, PA Delaware, PA Luzerne, PAMonroe, PA
43.9
0.6
137.7
27.7
18.4
65.8
63.5
0.3
0.0
1.7
1.4
0.4
4.9
5.3
8.4
1.5
2.0
8.7
1.4
9.7
0.2
14.6
0.9
13.0
18.6
2.2
0.0
4.2
14.3
6.5
1.2
14.0
2.5
0.0
1.4
18.1
0.4
9.8
41.5
26.5
2.2
14.1
11.3
0.3
3.6
35.5
12.0
0.5
0.6
0.1
0.0
0.4
0.0
0.0
0.0
0.8
111.0
10.3
169.5147.5
63.4
83.1
90.1
Northamp t on, PA 53.4 0.5 5.8 15.3 82.6 22.1 10.5 0.0 190 .3 T O T A LS - by S t a te Subtotal - NJSubtotal - NY
10441
60.9
251.3
5529
775
674
470
00.0
38281
Sub t o t a l - PA 411 15 38 69 123 135 74 1 865
T O T A L - D R B 555 22 64 153 204 205 122 1 13 28
a. Land disturbance estimate computed by Method A (see table 5). Totals may not sumexactly due to rounding.
39
Fore
st Wet
lan
dG
rass
land
/Sh
rub
Ag -
Past
ure
Ag-
Cult
ivat
edO
pen
Land
Dev
elop
ed
Wat
er To
tal

Table 12.
Total land disturbance by county for construction ROWsa
County Burlington, NJGloucester, NJ Hunterdon, NJ Mercer, NJ Monmouth, NJOcean, NJ
5.4
2.5
157.9
24.2
4.7
6.1
1.2
2.9
2.2
2.4
0.3
1.2
1.6
1.3
24.1
20.5
0.7
1.2
6.9
6.8
88.9
19.2
3.3
1.2
16.3
3.8
92.0
24.0
4.1
9.4
31.2
13.8
15.3
4.8
14.2
37.8
19.4
24.8
1.6
2.9
3.7
44.9
0.0
0.0
0.0
0.0
0.0
0.0
81.9
55.9
382.197.9
30.9
101.9
W a r r en, NJ 29.1 1.0 1.7 2.9 41.6 10.8 1.8 0.3 89.2 Broome, NY 80.8 1.0 2.4 65.0 11.1 8.1 0.4 0.0 168 .8 Berks, PABucks, PA Carbon, PA Chester, PA Delaware, PA Luzerne, PAMonroe, PA
115.6
1.2
276.5
67.2
31.3
150.4
170.9
0.9
0.0
2.5
3.4
1.1
9.8
9.1
22.6
3.2
4.0
19.0
2.7
14.3
0.5
35.3
2.2
31.6
44.2
4.9
0.0
13.3
38.1
15.4
2.9
35.3
5.8
0.0
4.0
45.2
0.7
20.3
86.1
56.0
5.1
40.6
26.8
0.4
7.5
67.4
25.8
1.1
1.9
0.1
0.0
0.5
0.1
0.0
0.0
2.1
284.6
23.0345.7
322.6
127.7
180.7242.5
Northamp t on, PA 121 .5 1.9 12.7 35.3 197 .4 49.9 22.1 0.2 441 .0 T O T A LS - by S t a te Subtotal - NJSubtotal - NY
23081
111.0
512.4
12965
19111
1288
990.4
00.0
840169
Sub t o t a l - PA 935 29 79 167 299 304 153 3.0 19 68
TOTAL - DRB 12 45 41 133 361 501 440 253 3 29 77
a. Land disturbance estimate computed by Method A (see table 5). Totals may not sumexactly due to rounding.
40
Fore
st Wet
lan
dG
rass
land
/Sh
rub
Ag -
Past
ure
Ag-
Cult
ivat
edO
pen
Land
Dev
elop
ed
Wat
er To
tal

Table 13.
Pipeline land area impact [acres] by watershed, Permanent ROW
Watershed (HUC) U p per De l a ware 40.7 0.9 3.8 4.9 29.0 0.1 1.3 0.0 80.7
204010103 40.7 0.9 3.8 4.9 29.0 0.1 1.3 80.7 M i dd l e D e l a w are
204010408204010503204010504
117.44.25.16.03.8
15.9
3.5 24.90.47.61.20.85.6
90.00.511.53.23.421.6
56.31.30.40.51.57.2
6.40.42.60.20.31.2
26.0 0.10.0
324.66.827.711.710.355.0
0.40.30.30.2
0.10.30.23.3 0.1
204010509 82.4 2.4 9.3 49.9 45.4 1.9 22.0 213 .2 Leh i gh
204010601204010602204010603
299.430.982.963.950.634.0
12.12.87.01.8
37.65.02.47.37.13.9
66.00.7
25.80.5
11.5 16.2 1.10.50.1
469.740.5102.775.962.753.9
0.50.30.33.3
9.70.20.01.1
2.43.89.2
0.61.6
0.30.20.4
204010608 36.9 0.1 11.9 63.9 9.8 7.1 4.2 134 .1 Cros s w i cks- N esham i n y 204020101
7.1
4.6
1.4
0.9
45.5
33.3
11.3
6.9
4.3
3.6
31.7
26.0
1.7
0.9
0.0 103.0
76.1
204020104 2.4 0.5 12.2 4.4 0.8 5.7 0.8 26.9 L o w er De l a ware
204020201
19.5
0.1
2.3 45.8
2.6
3.7 4.5 33.4
4.3
2.0
0.0
0.0 111.2
7.0
204020206 19.4 2.3 43.2 3.7 4.5 29.1 1.9 104 .2 Schuy l k i ll
20402030320402030420402030
44.94.515.769.20.9
0.5 13.71.5
19.41.27.1
16.74.5
17.20.62.530.12.9
20.40.88.724.71.3
9.10.06.55.20.3
0.1 125.28.640.5172.512.3
0.90.2
25.62.2
0.1
204020310 0.1 0.6 0.3 0.6 0.4 1.9 Brand y w i ne - Chr i s t i n a
26.5 1.2 26.9 9.3 15.6 25.6 7.9 0.0 113.0
204020501 26.5 1.2 26.9 9.3 15.6 25.6 7.9 0.0 113 .0 T O T A L - D R B 555 22 198 205 153 129 64 1 13 27
41
Fore
st Wet
lan
dG
rass
land
/Sh
rub
Ag -
Past
ure
Ag-
Cult
ivat
edO
pen
Land
Dev
elop
ed
Wat
er
Gra
nd
Tota
l

Table 14.
Pipeline land area impact [acres] by watershed, Construction ROW.
Watershed (HUC) U p per De l a ware 80.7 1.5 8.1 11.1 65.0 0.4 2.4 0.0 169.2
204010103 80.7 1.5 8.1 11.1 65.0 0.4 2.4 169 .2 M i dd l e D e l a w are
204010408204010503204010504
271.613.318.818.711.537.3
7.0 56.41.117.22.92.314.1
223.91.529.59.79.758.8
133.05.31.51.34.6
18.4
16.10.96.50.70.92.6
53.60.00.41.00.78.2
0.30.0
761.822.075.334.830.4139.8
1.30.60.80.2
0.0
0.3 204010509 172 .0 4.1 18.8 114 .7 101 .9 4.5 43.4 459 .5 Leh i gh
204010601204010602204010603
660.077.8186.6130.1109.979.7
22.35.013.22.8
91.312.45.5
16.021.49.7
153.41.8
60.11.3
23.3 27.40.014.30.01.33.2
2.81.30.1
1040.699.6
220.8155.8143.7126.9
1.11.00.67.0
0.40.22.9
5.610.022.7
0.30.90.7
204010608 76.0 0.6 26.3 148 . 1 20.5 13.6 8.6 0.2 293 .8 Cros s w i cks- N esham i n y 204020101
15.7
11.1
2.7
1.5
79.6
57.9
29.8
18.7
11.4
8.9
58.4
45.8
3.1
1.6
0.0 200.6
145.6
204020104 4.5 1.2 21.6 11.1 2.5 12.6 1.6 55.0 L o w er De l a ware
204020201
34.9
0.5
4.2 93.1
3.6
9.7 11.8 73.7
9.6
4.8
0.4
0.0 232.2
14.1
204020206 34.3 4.2 89.4 9.7 11.8 64.1 4.5 218 .1 Schuy l k i ll
20402030320402030420402030
118.413.333.169.22.4
1.6 35.53.20.025.64.6
46.43.615.916.79.7
44.61.45.630.17.4
50.41.619.224.73.0
21.60.015.15.20.4
0.1 318.623.288.9172.528.2
0.90.7
0.1
204020310 0.4 2.1 0.6 1.9 1.0 5.9 Brand y w i ne - Chr i s t i n a
63.9 2.7 59.8 25.0 36.7 49.0 17.2 0.1 254.4
204020501 63.9 2.7 59.8 25.0 36.7 49.0 17.2 0.1 254 .4 T O T A L - D R B 12 45 41 424 499 363 271 130 3 29 77
42
Fore
st Wet
lan
dG
rass
land
/Sh
rub
Ag -
Past
ure
Ag-
Cult
ivat
edO
pen
Land
Dev
elop
ed
Wat
er
Gra
nd
Tota
l

Table 15.
Stream crossings by HUC-10 watershed: total, shared (potentially, withexisting crossings), and new (=total – shared)
Watershed (HUC10 #) Total Shared New U p per De l a ware 11 0 11
204010103 11 11 M i dd l e D e l a w are
204010408a
204010503204010504
39 15 2400003
6336
6333
204010509 21 0 21 Leh i gh
581320494
421319442
1601052
204010601204010602204010603
204010608 8 8 Cros s w i cks- N esham i n y 204020101
85
0 85
204020104 3 3 150
7 80
L o w er De l a ware 204020201 204020206 15 7 8
Schuy l k i ll 20402030320402030420402030
1822122
8 102260
62
204020310 0 26 20 6Brand y w i ne -
Chr i s t i n a 204020501 26 20 6 T O T A L - D R B 175 92 83
a. HUC10 numerical codes shown grouped by HUC8 name. This HUC10 is in the MiddleDelaware-Mongaup-Brodhead HUC8. The remaining HUC10s in this grouping are in the Middle Delaware-Musconetcong HUC8.
43

References
[1]
Federal Energy Regulatory Commission. July 2003. Processes for theEnvironmental and Historic Preservation Review of Proposed Interstate NaturalGas
Facilities.
Subject:
Regulatory
History.h t t p ://www . fe r c .gov/i n d u str i es/gas/e n v i r o /gas p rocess . p d f .FERC. 2015. Guidance Manual For Environmental Report Preparation For Applications Filed Under the Natural Gas Act: Volume I. Federal Energy Regulatory
[2]
Commission. Draft. December
2015h t t p ://w ww . f e rc .g o v/ ind u str i e s /g as /e n v iro /g u i d e lin e s / r e p o r t - p r e pa r a t i on- vo l u m e - 1 . p d f .Krupnick, Alan, and Sheila Olmstead. 2013. “Cumulative Risks of Shale Gas Development.” Resources For the Future, Washington, DC, May 31, 2013. h t t p :/ / s i te s .nationa l acad e m i e s .o r g/c s/ g r o u p s/d b ass e s i te/docu m e nts/ web p a ge/d b a ss e _0 8 34 3 5 . p d f .Krupnick, A. J. 2013. Managing the Risks of Shale Gas: Key Findings and Further Research. Resources for the Future.Brittingham, Margaret C., Kelly O. Maloney, Aïda M. Farag, David D. Harper, and Zachary H. Bowen. 2014. “Ecological Risks of Shale Oil and Gas Development to Wildlife, Aquatic Resources and their Habitats.” Environmental Science &
[3]
[4][5]
Technology.
Accessed
2014/09/15. doi: 10.1021/es5020482.ht t p :/ / p u bs . a cs. o r g/d o i /ab s/10.10 2 1/ es 5020 4 8 2 .
Slonecker, E.T., L.E. Milheim, C.M. Roig-Silva, A.R. Malizia, D.A. Marr, and G.B. Fisher. 2012. Landscape consequences of natural gas extraction in Bradford and Washington Counties, Pennsylvania, 2004–2010. USGS Open-File Report 2012- 1154.ht t p :/ / pubs.us g s.gov/ o f / 2 0 12/11 5 4 / .National Energy Technology Laboratory. 2013. Modern Shale Gas Development in the United States: An Update. National Energy Technology Laboratory, US Department of Energy. September 2013.Jackson, Robert B., Avner Vengosh, J. William Carey, Richard J. Davies, Thomas H. Darrah, Francis O'Sullivan, and Gabrielle Pétron. 2013. “The Environmental Costsand Benefits of Fracking.” Annual Review of Environment and Resources 39 (1):140822120156004. doi: 10.1146/annurev-environ-031113-144051.Vengosh, Avner, Nathaniel Warner, Rob Jackson, and Tom Darrah. 2013. “The Effects of Shale Gas Exploration and Hydraulic Fracturing on the Quality of Water Resources in the United States.” Procedia Earth and Planetary Science 7: 863-866. doi: 10.1016/j.proeps.2013.03.213.Entrekin, S., M. Evans-White, B. Johnson, and E. Hagenbuch. 2011. “Rapid
[6]
[7]
[8]
[9]
[10]
44
[11]
McBroom, M., T. Thomas, and Y. Zhang. 2012. “Soil Erosion and Surface WaterQuality Impacts of Natural Gas Development in East Texas, USA.” Water 4 (4): 944- 958. doi: 10.3390/w4040944.Kiviat, E. 2013. “Risks to biodiversity from hydraulic fracturing for natural gas in the Marcellus and Utica shales.” Ann. N.Y. Acad. Sci. 1286: 1-14.Delaware River Basin Commission. 2013. “Basin Information.” Delaware River Basin Commission. Feb 27, 2013. ht t p :/ / www . nj.gov/drbc / b a sin / .Kauffman, Gerald. 2011. Socioeconomic Value of the Delaware River Basin inDelaware, New Jersey, New York, and Pennsylvania University of Delaware. ht t p :// w ww . nj.gov/drbc / libr ar y/ d oc u m e n t s /S o c i o eco n om i c V a l ue D RB - U D EL- Fina l R p t . p d f .IHS. Dec 31 2014. Geographic Information Systems Geodatabase. "US Oil and Gas Pipeline and Facilities Data.".Clean Air Council. May 19 2015. ArcGIS 10.2 Shapefile. Final Combined Pipelines in Watershed. Clean Air Council,.Constitution Pipeline Company, LLC. 2013. Constitution Pipeline Draft Environmental Report - Resource Report No. 1 - General Project Description. Constitution Pipeline Company LLC,. Feb 2013.FERC e-Library.Constitution Pipeline Company, LLC. 2013. Constitution Pipeline Draft Environmental Report - Resource Report No. 9 - Air and Noise Quality. Constitution Pipeline Company LLC,. FERC e-Library.FERC. 2014. Final Environmental Impact Statement - Vol 1. Constitution and Wright Interconnect Projects. Federal Energy Regulatory Commission. FERC EIS No. 0249F. Docket Nos. CP13-499-000; CP13-502-000; PF12-9-000; Oct 2014.Transcontinental Gas Pipe Line Company, LLC. 2013. Leidy Southeast Expansion Project: Resource Report No. 1 - General Project Description. Transcontinental Gas Pipe Line Company, LLC. September 2013. .FERC e-Library.
[12][13][14]
[15][16][17]
[18]
[19]
[20]
[21]
Portable
document
format.h t t p s : / / l e i d y s ou t h e as t . fil e s . w o r d p r es s.c o m /20 1 3/01/ c oun t y-m a p-f r an k l i n - l oo p- r e v - a . p d f .Tetratech, and Inc. Rooney Engineering. Mar 16 2015. Map. Pennsylvania Pipeline Project, State: Pennsylvania, County: Chester. Portable document format. Sunoco Pipeline L.P.ht t p ://www . l a nds ca p e s2. o r g/ p i p e lin e / p d f / M E1 - M E2Route M a p . p df . Sunoco Pipeline, L.P. 2015. Delaware River Basin Commission Application for the Pennsylvania Pipeline Project Berks, Chester and Delaware Counties, Pennsylvania. Sunoco Pipeline, L.P. STV Project No.: 38-17335. Aug 2015.AECOM. 2015. Southern Reliability Link Project Alternatives Analysis Burlington, Monmouth, and Ocean Counties, New Jersey. New Jersey Natural Gas Company.5176843.1. Apr 2015.NJNG. ht t p s://www . njng.c o m / r e g u l at or y / p d f/NJN G - S R L - P e t i t i on -N . J.A.C . - 14. 7 -1.4. 4-2 - 2 015 . p df .
[22]
[23]
[24]
[25] N
JNG>SouthernReliability Link. ht t p s://www.n j ng.c o m /about/southe r n-
r e l i abi l i t y- l i n k / r oute.as p .PennEast Pipeline Company, LLC. 2015. “Proposed Route.” The PennEast Pipeline Project. h tt p :// p en n ea s t p i p e l i n e.c o m / p r o p o s e d r o ute / .PennEast Pipeline Company, LLC. 2015. PennEast Pipeline Project: Resource Report 1 - General Project Description. PennEast Pipeline Company, LLC. FERC Docket No. PF15-1-000. April 2015.FERC e-Library.PennEast Pipeline Company, LLC. 2015. PennEast Pipeline Project: Resource Report2 - Water Use and Quality. PennEast Pipeline Company, LLC. FERC Docket
[26][27]
[28]
45
[29]
PennEast Pipeline Company, LLC. Jul 22 2015. Map Sheets. PennEast PipelineProject Proposed Route. Sheets 1 - 30. Portable document format. PennEast Pipeline Company, LLC.FERC. 2013. Texas Eastern Appalachia to Market 2014 Project: Environmental Assessment. Federal Energy Regulatory Commission, US Army Corps of Engineers. Docket No. CP13-84-000. Sep 2013.FERC eLibrary.East Side Expansion Project - 26" Loop 1278. FERC Supplemental Filing. 2015. East Side Expansion Project PA Loop 1278 route. Columbia Gas Transmission. Map, portable document format. ht t p s://www. c p g.c o m / do c s /d e f a u l t -so u rc e/ d e f a u l t - doc u m e n t - libr a ry / p e nnsylvani a - m a p 3 f 2 dab5b99 e 1 6 bf28 9 1 6 ff 0 70 0 4d0 e 3c . p df .East Side Expansion Project - 20" Loop 10345. FERC Supplemental Filing. 2015.East Side Expansion NJ Loop 10345 route. Columbia Gas Transmission. Map, portable document format. ht t p s://www. c p g.c o m / do c s /d e f a u l t - so u rc e/ d e f a u l t - doc u m e n t - li b r ar y / n ew - j e r se y- ma p . p d f .Columbia Gas Transmission LLC. 2013. East Side Expansion Project: Resource Report 1 - General Project Description. Columbia Gas Transmission, LLC. FERC Docket No. PF13-7-000. March 2013.FERC e-Library.Columbia Gas Transmission LLC. 2013. East Side Expansion Project: Resource Report 3 - Fish, Wildlife, and Vegetation. Columbia Gas Transmission, LLC. FERC Docket No. PF13-7-000. June 2013.FERC e-Library.Columbia Gas Transmission LLC. 2013. East Side Expansion Project: Resource Report 2 - Water Use and Quality. Columbia Gas Transmission, LLC. FERC Docket No. PF13-7-000. June 2013.FERC e-Library.Columbia Gas Transmission LLC. 2013. East Side Expansion Project: Resource Report 8 - Land Use, Recreation, and Aesthetics. Columbia Gas Transmission, LLC. FERC Docket No. PF13-7-000. June 2013.FERC e-Library.FERC. 2014. East Side Expansion Project: Environmental Assessment. FederalEnergy Regulatory Commission. Docket No. CP14-17-000.Homer, C.G., J.A. Dewitz, L. Yang, S. Jin, P. Danielson, G. Xian, J. Coulston, N.D. Herold, J.D. Wickham, and K. Megown. 2015. “Completion of the 2011
[30]
[31]
[32]
[33]
[34]
[35]
[36]
[37][38]
[39] National Land Cover Database 2011. Nov 04 2015
.h t t p :// www . mr l c .gov/n l cd11_ l eg . p h p .USDA-NRCS, USGS, and EPA. 2015. ArcGIS 10.2 File Geodatabase. Watershed Boundary Dataset. Delaware River Basin (0204). United States Department of Agriculture-Natural Resources Conservation Service, United States Geological Survey, Environmental Protection Agency,.h t t p ://datagatewa y .nrc s . u s da.gov . Klemow, Kenneth, and Dave Messermsith. 2016. “Pipeline Infrastructure Taskforce Report: Review and Next Steps.” PennState Extension – Monthly shale webinar, Webinar, March 4, 2016.Quigley, John. 2016. “Pipeline Infrastructure Task Force Final Report Presentation ” PA Department of Environmental Protection, Webinar., February 18, 2016 h t t p :/ / f i l e s .d e p . s tate . p a.us/P r o g r a m I n teg r a t i o n /PITF / PITF %20R e p o r t%20Webinar_ JQ. p d f .Pipeline Infrastructure Task Force. 2016. Governor's Pipeline Infrastructure Task Force Report. Pennsylvania Department of Environmental Protection.
[40]
[41]
[42]
[43]
46

CNA
This report was written by CNA’s Energy, Water, and Climate (EWC) groupwithin the Safety and Security (SAS) division of the Institute for Public Research (IPR).EWC provides integrated analysis of energy, water, and climate to gain abetter understanding of the implications of their interrelationships and to help develop sound policies and programs to improve energy security,foster efficiency, and increase the likelihood of a secure, climate-CNA's Institute for Public Research provides research and analysis to adiverse array of federal, state, and local government agencies, and non- governmental organizations. At CNA, we take a systematic, evidence-based approach to problem solving. We define the problem, collect data through observation and experiment, and formulate and test hypotheses, to deliver impartial answers grounded in a thorough understanding of theh ttps : //w w w. cna . org/research/

IRM-2016-U-013158
CNA is a not-for-profit research organizationthat serves the public interest by
providing in-depth analysis and result-oriented solutions
to help government leaders choose the best course of action
Nobody gets closer—to the people, to the data, to the
problem.
w w w. c n a .or g ● 703-824-2000
3003 Washington Boulevard, Arlington, VA 22201