Embed Size (px)
Citation preview

Supervisor: Alexander Paulsson
Examiner: Anna Thomasson
Micromanaging Behaviour and Engineering Management
A quantitative study of micromanaging behaviour of
engineering managers
by
Jie Li & Umer Khalid
June 2015
Master’s Programme in Management

i
Abstract
Researchers argue that micromanaging behaviour has now become a common trait of
management and been perceived as negative. Furthermore, there is little research on the technical
perspective of micromanagement and why and how it occurs in an engineering environment.
While each research covers only a few segments of the origin, symptoms and reasons of
micromanagement, our thesis tries to consolidate all these segments to present the whole picture.
Our research seeks to reveal and analyse the symptoms of micromanagement in an engineering
environment. Additionally, quantitative and statistical analysis is performed to determine which
factors of micromanagement are influential when managing a group of technical personnel.
Through our analysis, we establish that the attitude of managers and subordinates towards the
symptoms of micromanagement is rather different. The agreement of managers on the five
symptoms were found to be greatly consistent while subordinates present an inconsistency in
their opinions. From the examination of consistency of responses across the two groups, we
determine that both groups are of the same opinion on the three out of five symptoms. However,
the rank of each symptom in the two groups is slightly different. Through this study, we
contribute towards academic learning of general micromanagement while strengthening the
research of micromanagement in the field of engineering management. Moreover, this will also
assist technical managers to identify the existence of micromanagement in their managerial role.
Keywords: Micromanagement, Bad Management, Engineering Management, Managerial Role,
Engineering Manager.

ii
Acknowledgements
First of all, we would like to thank our supervisor, Alexander Paulsson, for the beneficial support,
guidance and feedback throughout our research process. We also express our gratitude towards
Håkan Pihl, the program director of Master in Management program, who provided us with the
opportunity to be a part of this knowledge-rich program.
We would also show great appreciation to all the research participants who agreed to be part of
this study and shared their thoughts on the subject. Also, we would like to thank Farrukh Javed
and Usman Khalid, faculty members at LUSEM, who gave us insights into the statistical methods
and helped us develop the methodology for our research.
Finally, we would like to thank our families who have been encouraging and supporting us
during this intense study period. We thank you for your patience and understanding when we
were under pressure.
Our thesis would not have been the same without all of your help. We thank you all.
Lund, May 28, 2015
Jie Li and Umer Khalid

iii
Table of Contents
1 Introduction ....................................................................................................................... 1
1.1 Background .................................................................................................................. 1
1.2 Aims and Objectives..................................................................................................... 3
1.3 Research Purpose ......................................................................................................... 3
1.4 Research Limitations .................................................................................................... 3
1.5 Outline of the Thesis .................................................................................................... 4
2 Literature Review .............................................................................................................. 6
2.1 Requirement for Management Skills ............................................................................. 6
2.2 Learning the Hard Way ................................................................................................ 7
2.3 What is Micromanagement? ......................................................................................... 8
2.4 What Causes Micromanagement ................................................................................... 9
2.5 Symptoms of Micromanagement ................................................................................ 10
3 Methodology .................................................................................................................... 16
3.1 Research Approach..................................................................................................... 16
3.2 Research Design ......................................................................................................... 17
3.3 Data Collection Method .............................................................................................. 18
3.4 Data Analysis ............................................................................................................. 22
3.5 Reliability, Validity and Reflexivity ........................................................................... 25
4 Findings and Analysis ..................................................................................................... 27
4.1 Overall Implications from the Survey ......................................................................... 27
4.2 Consistency within groups .......................................................................................... 30
4.3 Consistency across groups .......................................................................................... 33
4.4 Paired Comparison within Group ................................................................................ 35
4.5 Discussion .................................................................................................................. 39
5 Conclusions ...................................................................................................................... 42
5.1 Major Contributions ................................................................................................... 42
5.2 Practical Implications ................................................................................................. 44
5.3 Future Research .......................................................................................................... 45
References ............................................................................................................................... 46
Appendix A ............................................................................................................................. 52

iv
Appendix B ............................................................................................................................. 55
Appendix C ............................................................................................................................. 56
Appendix D ............................................................................................................................. 58

v
List of Tables
Table 4.1: Perspective on five symptoms in G1 ......................................................................... 28
Table 4.2: Perspective on five symptoms in G2 ......................................................................... 30
Table 4.3: Mean ranks of five symptoms in G1 .......................................................................... 31
Table 4.4: Friedman test statistics in G1 ................................................................................... 32
Table 4.5: Mean ranks of five symptoms in G2 .......................................................................... 32
Table 4.6: Friedman test statistics in G2 ................................................................................... 33
Table 4.7: Sum of ranks across the groups .............................................................................. 33
Table 4.8: Mann-Whitney test statistics across the groups ....................................................... 34
Table 4.9: Wilcoxon Rank Sign test within G1 ........................................................................... 36
Table 4.10: Wilcoxon Rank Sign test within G2 ......................................................................... 38
1
1 Introduction
The following chapter describes the evolving situation of lack of management skills in engineers
that leads to micromanagement in engineering firms. In the current era, the need for managerial
skills for engineers has become inevitable. As Evans and Bredin (1987) states that managerial
skills are required not only for one’s career growth but also for the well-being of fellow
employees and the organization.
It is pertinent to mention here that the target of this research is not limited to managers' position
in an organization. This study is subjected to all the technical personnel in a managerial role i.e.
managing any number of persons. Thus, the term 'engineering managers' is used to represent
those personnel. Our research is based on manufacturing firms, and we will use the term
'engineering firms' to represent these firms. The thesis focuses on such organizations because of
their high requirement for teamwork, supervision and effective leadership.
In an engineering firm, there are some non-engineering departments such as HR, admin and
procurement. These departments provide support to engineering departments and are usually
small in size. To exclude this non-engineering part of an engineering firm, the term engineering
environment is used which represents the major departments that involve engineering for instance
maintenance, production operations, inspection, etc.
1.1 Background
Engineering is a field of science that has no boundaries. Thus, it has been divided into several
different disciplines, and still each of them covers a very large sector of research and learning.
Every engineering university offers multiple engineering programs that are loaded with technical
courses. Furthermore, according to Kumar and Hsiao (2007), engineering students are so
overburdened with technical courses that they do not have any intent to take any non-engineering
courses. Consequently, engineering graduates are equipped with technical skills but lack the set
of skills that are essential to properly manage and interact with people.
When an engineer enters a technical firm, he is assigned tasks that match his technical skills.
While performing the task, his focus remains on completing and achieving excellence in the
segment of his responsibility. While doing what he or she is told to do by the manager, he or she
remains indifferent towards the bigger picture because that is not what he or she is praised or

2
rewarded for. Consequently, as argued by Khatri (2009), lack of employee participation in
decision-making further discourages the learning of managerial skills.
As the engineer moves up the ladder of hierarchy, due to excellent technical skills, several
employees are assigned to him or her. This puts the engineer in a managerial role, as argued by
Hernson and Krauss (1987), for which he or she has no proper training or education. Hence, to
fill this gap he or she tends to adopt the standard practices being followed in his organization and
the managerial traits of his or her manager. However, according to Maloney and Federle (1991),
the managers who establish the organizational culture might also lack the managerial skills. Thus,
the incompetent and ineffective management traits remain embedded in the organization.
The dilemma of lacking managerial skills gives way to inappropriate management styles.
According to Bacon (2006), the high power distance, high centralization, focus on details at the
expense of bigger picture, and lack of employee participation result in micromanaging behaviour
of management i.e. bad management. Consequently, micromanagement is contemplated by
organizations as a serious problem.
Abundant research in the area of engineering management studies and analyses the traits and
attributes of mismanagement and bad management. However, there is a lack of research in the
field of engineering management discussing the problem of micromanagement. We intend to fill
this gap by relating characteristics of micromanagement to the existing literature.
Generally, the traits of bad management are categorized into micromanagement (Alvesson &
Sveningsson, 2003). Micromanagement can be simply defined as a management style
characterized by excessive control (Alvesson & Sveningsson, 2003; Sowers, 2011) and close
supervision (Porterfield, 2003; Wright, 2000). The effects of micromanaging behaviour are not
limited to the micromanager and the subordinates (Badger et. al., 2009; Hernson & Krauss, 1987),
but also extend to the whole organization (Sahay et al. 2000; Hansson et al. 2003). The major
causes of micromanaging behaviour include corporate culture (Badger et al., 2009; White, 2010),
manager’s personality (Badger et. al., 2009; Livingston, 2003; Maloney & Federle, 1991), and
attributes of subordinates (Rosen & Jerdee, 1977).
The first step towards the resolution of the problem is the identification and recognition of the
problem. Thus, analysis of the symptoms is a viable approach. On the basis of Chambers (2009),
we categorized five major symptoms of micromanagement as: excessive control over
methodology (Khatri, 2009; Wright, 1999), excessive reporting and updates (White, 2010; Hirsch
et al., 1958), control and manipulation of time (Pixton et al. 2014; DeMaio, 2009), failure to
subordinate self (Bacon, 2006) and excessive approval requirement (Bacon, 2006; Hernson &
Krauss, 1987).

3
1.2 Aim and Objectives
As discussed previously, the lack of managerial skills in engineers is a serious and growing
concern for engineering firms. This thesis intends to study the phenomenon of micromanagement
in engineering organizations. In order to do so, we will (i) review the symptoms and possible
causes of micromanaging behaviour of engineering managers, (ii) examine the symptoms through
quantitative survey and statistical analysis (iii) examine whether there is a difference of opinion
between managers and subordinates on the subject and (iv) identify which of the symptoms are
significant. Hence, this study contributes to the literature of micromanagement in engineering
management.
1.3 Research Purpose
The purpose of the thesis is to relate micromanaging behaviour to the existing theoretical
knowledge base in the field of engineering management. It will contribute towards better
understanding of managerial requirements in an engineering environment. The motive of the
research is to study and analyse all the characteristics of micromanagement in an engineering
environment. Moreover, it will examine and determine the significance of different factors of
micromanaging behaviour in an engineering environment.
The empirical question of this research is the efficacy of the various symptoms of
micromanagement that contribute towards the micromanaging behaviour of engineering
managers. We aim to answer this empirical question through quantitative survey and its statistical
analysis. For this purpose we intend to record responses of managers and subordinates regarding
the five symptoms of micromanagement. The consistency of responses for the five symptoms
within each group, and across the two groups will be analysed. Additionally, the paired
comparison within each group will be conducted to determine whether there is significant
difference between distributions of the agreement.
1.4 Research Limitations
The first limitation of this thesis is that we were restricted to reach diverse respondents in
different countries. Since we are targeting the engineering environment, our survey respondents
should work in such an environment. Thus, it is not feasible to distribute questionnaire through
social media, which could give access to many people, because most of these respondents do not
4
meet the criteria of the target sample. This restriction caused difficulty in obtaining a large
sample size. Additionally, due to the limited research time, we were unable to contact a large
number of companies for their cooperation. Although, we still managed to contact more than 25
companies based in three countries. However, we only receive positive feedback from five
companies mainly located in Pakistan and China. From this, we acquired 77 effective responses
in total resulting in a large enough sample to be statistically large.
Another limitation is the reluctance of companies to participate in this study. Since, this thesis
deals with the management issues, companies are concerned with the potential negative effect of
employees’ participation in this study. This limits the number of firms that assured us of their
participation in the survey. Furthermore, employees might give up completing the survey if they
are sceptical about the purpose of the research.
1.5 Outline of the Thesis
We begin with the chapter of Literature Review, which outlines the relevant literature on the
subject in question. It gives a review of micromanagement and all its aspects from the perspective
of previous research. It provides a comprehensive synopsis of the subject to the reader. The
chapter starts with the initial idea of the significance of management skills for engineers.
Subsequently, the process through which engineers acquire these skills during their working
experience is discussed. Furthermore, the phenomenon of micromanagement and its causes are
presented. The chapter ends with an examination of symptoms of micromanagement presented in
the previous research.
In the next chapter of Methodology, we introduce and discuss the methods used in the thesis. We
choose quantitative approach because it is persuasive to determine which factor of
micromanagement is influential on the basis of statistical analysis. To collect respondents’
attitudes, we designed the questionnaire with multiple choices on the Likert scale. Then, we adopt
probability samples and distribute the questionnaire through emails to our contacts within
companies. We then conduct three statistical tests to analyse the data we collected. Friedman Test
is used to determine the difference of agreement. Mann-Whitney Test is adopted to determine the
consistency across two groups. Lastly, Wilcoxon Signed Rank Test is used to identify the
consistency in the level of agreement between the five symptoms.
Then, in the Analysis and Discussion chapter, we interpret the data using the arithmetic mean,
mode and percent of agreement or disagreement. Based on this we acquire the overall attitudes of
managers and subordinates regarding the micromanagement. We then examine the consistency of
responses for the five symptoms within each group, and across the two groups. Subsequently, we

5
conduct the paired comparison within the group to determine the significance of the difference
between distributions of the agreement.
In the last chapter, Conclusion, we provide a summary of our most important findings. We
outline our findings and discuss our contribution to theory. Furthermore, we reflect on our
research process, present limitations and give suggestions for further research.

6
2 Literature Review
This chapter reviews theory and literature relevant to our research problem. We start with the
significance of acquiring management skills, especially for engineers. We then present the
method through which engineers learn these management skills during their working experience,
which is quite different from non-engineering managers. Furthermore, we explain the
phenomenon of micromanagement and its causes. In the end, we examine the symptoms of
micromanagement presented in the previous literature.
2.1 Requirement for Management Skills
Abundant research has been conducted in the area of engineering management regarding the need
of managerial skills for engineering managers. To effectively manage a team of engineers, one
needs to develop knowledge of how and why people behave in a certain way and operate in an
organization (Kenny & Downey, 1987). This set of knowledge is also known as the soft skills or
the human skills, which according to El-Sabaa (2001), are required by the manager to work with
people and to build a cooperative effort within the team he or she leads.
Traditionally, organizational performance and value have been evaluated through financial
measures or hard numbers (Luthans & Peterson, 2002). Such simple and objective outcome-
based financial indicators also dominate in most organizational strategy research, for example,
putting the balanced scorecard to work by Kaplan & Norton (1998). In contrast with this
financial approach, Pfeffer (1998) argues that the so-called human-oriented measures such as
employee satisfaction, perception and traits are now being recognized as key predictors of
employee behaviour, performance and productivity. According to Luthans and Peterson (2002),
multiple researchers found that following factors are significantly related: employee cognitive
attitudes and performance (Petty et al., 1984; Ostroff, 1992); personality traits and job
performance (Barrick & Mount, 1991; Tett et al., 1991); emotions and favourable job outcomes
(Staw et al., 1994). Thus, to boost these human-oriented measures the managers need to learn soft
skills to bring out the best of their employees.
As noted by Hernson and Krauss (1987), in engineering firms it is important that managers are
cultivated from within the ranks. However, technical specialists are generally not ideal to perform
managerial roles; a managerial training can be an asset. This is due to the reason that technical
skills are not the only requirement for a managerial position and it is also essential that the

7
manager possesses management skills that are consistent with the organizational culture
(Maloney & Federle, 1991) to ensure effective operation of the engineering firms (Evans &
Bredin, 1987). Furthermore, Summers et al. (2004) state that employees having MBAs or JDs are
more suitable for senior management positions because of sufficient training in communication,
leadership and management skills.
According to Kosiba (1987), engineers frequently play the role of a manager because they are in
charge of a group of technical personnel who possess special skills that require special
management attention. In a survey conducted by IEEE, approximately 70 percent of engineers
indicated that they had some supervisory responsibilities (Aucoin, 2002). As an engineer climbs
the ladder of organizational hierarchy earning promotions due to excellence in technical
performance, the size of the team he or she leads increases. Moreover, to reap the maximum
reward out of this team-work he or she must broaden his or her horizons and continue to develop
new job skills that go along with his increasing managerial role (Thilmany, 2004).
Murphy (1989) argues that management education does not only support the strategy, it is the
strategy. Thus, the effect of an engineering manager's management skills goes far beyond his or
her team. It influences overall organizational performance that are measured by productivity,
quality and financial metrics (Paton & Wagner, 2014). The significance of the soft skills are very
precisely described by Hernson and Krauss (1987, p.166) as, “ideal engineering manager
possesses a combination of technical and managerial skills – the latter being most important”.
The literature of Leadership and Management in Engineering identifies five drivers of
performance; rules, emotions, initiative, immediate action and integrity (Sabourin, 2012). These
drivers were examined to explore the obstacles that can pose a challenge to an engineering
manager. Sabourin (2012) concludes that most of the identified obstacles were related to
management and needed a set of management and behavioural skills for resolution. Moreover,
Evans & Bredin (1987) concurs as they define a good engineering manager as the one
simultaneously using his ability to apply engineering principles and skills in organizing and
directing resources, people and ultimately, their projects.
2.2 Learning the Hard Way
Although the need for engineers to acquire management skills are significantly increasing, they
learn them while at work – learning the hard way (Kumar & Hsiao, 2007). This is due to the
reason that most engineering curriculums fail to incorporate relevant management courses and
engineering students lack the time or inclination to pursue management courses on their own
because of highly burdensome technical courses (Ibid.). As a result, most engineers learn the

8
management skills with their experience and interaction with organizational culture on their job
(Ibid.).
Evans and Bredin (1987) claim that the nature of engineering work impedes the acquisition of
management skill by engineers because most of their time is taken up by staying technically up-
to-date. This situation is quite similar to what engineers experience in universities, where they are
fully occupied by engineering courses. Moreover, Souder (1983) argues that engineering work
involves close contact with the details while management requires managers to distance
themselves from the work. The different demands of each role, especially which of an
engineering manager, are significantly challenging. Specifically, some project-oriented engineers
lack the motivation to learn management skills. This is evidenced by a survey conducted by Allen
and Katz (1995) among some 2500 engineers from 10 organizations. The result shows that only
32 percent of engineers prefer a management career. While 20 percent of engineers preferred a
technical ladder career and the rest 48 percent opted for a number of challenging projects.
Subsequent researches also support this discrimination among design engineers. On the basis of a
survey, including 442 respondents, Petroni (2000) concludes that a substantial number of design
engineers choose interesting projects over the other two career paths.
Engineers also lack proper channels to learn effective soft skills. A notable amount of engineers
learn management skills from their former managers, because within organizations, employees
would experience and mimic their manager’s behaviour (Treviño & Brown, 2005). Their former
managers, however, might also lack adequate training of management skills. Hence, engineers
would learn some sound management skills if any, and some inappropriate ones as well
depending on their role leaders. Furthermore, this problem contributes to the difficulty that these
engineers face when they take up managerial roles.
2.3 What is Micromanagement?
As discussed previously, plenty of engineering literature concludes that engineering managers’
lack of management skills is due to lack of formal management courses in technical education or
on-job learning and training (Kumar & Hsiao, 2007). While according to Livingston (2003), to
fill this void, engineers tend to acquire traits of management engraved in their organizational
culture and practices followed by their managers. Likewise, only few research studies the nature
and hazards of soft skills acquired without proper training or education.
Micromanagement is a widely used word nowadays because any practices of bad management
are perceived as micromanagement. Generally it is regarded as a negative management style, and
it occurs when a manager gets involved with every detail in the workflow process (Porterfield,
2003). According to the definition presented by Wright (2000), micromanagement means to
9
manage things closely and to evaluate process or work under scrutiny. As argued by Khatri
(2009), in a high power distance organization, micromanagers emphasize on routine, operational
aspects of management instead of broader, strategic management issues. Based on qualitative
research, Alvesson & Sveningsson (2003, p.973) deduce that micromanagement is regarded as
bad management, which 'takes away decisions and interfering in details supposedly best
understood by subordinates down the line'. Defining in an objective way, Sowers (2011, p.20)
states that: micromanagement is ‘where superiors control in detail the actions of their immediate
subordinates’.
2.4 What Causes Micromanagement
Many authors have explained the causes of micromanagement, according to their perception. We
consolidated the perspectives of different researchers (Badger et al., 2009; Porterfield, 2003;
Rosen & Jerdee, 1977; White, 2010; Wright, 2000) to classify the causes into three main aspects:
corporate culture, manager’s personality and attributes of subordinates.
2.4.1 Corporate Culture
There is a connection between organizational culture and the micromanaging behaviour of an
engineering manager. Organizational culture is created through "norm formation around critical
incidents... [and] identification with dominant leaders or founders" (Schein, 1990, p.115).
Additionally, to get rewarded in an organization employees have to follow the rules as well as the
norms of the corporate culture. There could be a wrong belief established in the corporate culture
that micromanagement is the proper way to manage people effectively (Badger et al., 2009).
However, it will still be followed by employees because only followers will get rewarded and
recognized in this culture (Ibid.).
Furthermore, as Hoelscher (1987) states, any organization operates with a structure, levels of
responsibility and authority, which have their constraints as well as degrees of freedom. However,
White (2010) claims that the structure of an organization can lead to micromanagement.
Moreover, the degree of micromanagement reflects the characteristics of the organization
(Wright, 2000). This is also supported by Khatri (2009) with his argument that, an organizational
structure of high power distance gives senior managers extensive power and control over their
subordinates. All these elements contribute to the fact that micromanagers have a quick tendency
to blame the organization for their failure and weaknesses, as stated by Gupta and Braunstein
(2001).

10
2.4.2 Personality of Manager
The way a person behaves in a certain manner depends on his or her personality (Kichuk &
Wiesner, 1997). Additionally, the individual managerial skills are deemed influential over group-
interdepartmental decision making (Kenny & Wilson, 1984). Hence, according to Badger et al.
(2009) and Porterfield (2003), the unwillingness to trust in subordinates’ capability to perform
well on their own is another reason for the micromanaging behaviour, Similarly, micromanagers’
insecurity about their position or abilities may also cause them to keep a close eye on every detail
(Porterfield, 2003).
Some micromanagers justify their hands-on management style with the excuse that their goal is
to ensure everything is done with excellence (Porterfield, 2003). Moreover, from subordinate's
perspective, through a survey of 1734 engineers, Giegold (1981) concludes that management
skills and traits plays a vital role in effective engineering management. Furthermore,
organizational culture and individual personalities could jointly lead to micromanagement. As
argued by Maloney and Federle (1991), leader emphasizing hierarchy culture tends to employ a
conservative and cautious management style that is consistent with the organizational values.
2.4.3 Attributes of Subordinate
The characteristics of subordinates are another factor influencing engineering managers’
managerial behaviour. Rosen and Jerdee (1977) argue that lower level employees are regarded as
less competent to exercise good judgment, and they have a small part in the process of decision
making. Hence, managers tend to dominate the decision-making process. And their subordinates'
opinions are frequently ignored. Crouch and Yetton, (1988) also presents a strong connection
between the level of subordinate performance and manager’s friendly or less friendly behaviour.
Moreover, a group of engineers is characterised by a professional culture, which is required to be
recognized and handled by their managers (Hernson & Krauss, 1987). Hence, a manager’s failure
to understand and deal with such professional culture would demotivate these engineers.
2.5 Symptoms of Micromanagement
Multiple authors mention the behaviour of micromanagement in their research. However, most of
these research only touch upon one or few aspects of micromanagement. On the basis of
Chambers (2009), we categorized five major symptoms of micromanagement as: excessive
control over methodology (Khatri, 2009; Wright, 1999), excessive reporting and updates (White,
2010; Hirsch et al., 1958), control and manipulation of time (Pixton et al. 2014; DeMaio, 2009),
11
failure to subordinate self (Bacon, 2006) and excessive approval requirement (Bacon, 2006;
Hernson & Krauss, 1987).
2.5.1 Excessive Control over Methodology
An important symptom that indicate the existence of micromanaging behaviour is the need of
absolute control over the process, i.e. telling people exactly what to do and how to do it (White,
2010). As explained by Aronberg (1985), this managerial behaviour of extreme supervision can
be a result of the manager's previous working experience, which he or she regards as valuable
and insightful asset for his subordinate. However, according to Porterfield (2003), this could
suppress employees' participation and devalue their skills and contributions. As a result, it will
deteriorate employees' performance and drive away their enthusiasm for work even if the job is
perfectly completed.
Naturally, the job of a manager is to employ his or her expertise to utilize the human resources
and competencies to contribute towards organizational benefits (Evans & Bredin, 1987). A
manager needs to act as an integrator that carves out the best combination of all strengths to
retrieve optimum results. Khatri (2009) states that a manager only needs to describe the mission,
vision and rules of the task and delegate the subordinate to decide how to achieve those goals.
Whereas a micromanager would involve himself in the decision-making process to an extent that
the subordinate, the original bearer of decision-making power, will be totally deprived of the
decision-making (Alvesson & Sveningsson, 2003). The subordinates, who shall be an active part
of the team, then incline towards submissive behaviour due to the lack of empowerment. This
greatly immobilizes the subordinates until the manager makes the decision, which leads to
significant productivity loss (Porterfield, 2003).
Sterrett (2000) argues that lack of management skills in an engineering manager can mislead him
with a delusion that he or she has all the right answers. This also creates a sense of superiority in
themselves and is reflected in their behaviour. Consequently, by dictating all the decisions and
prescribing every step of the process, the micromanager would generate a negative impact on
working environment (Badger et al., 2009). Additionally, according to Wright (1999), it is a
misconception on the manager that he or she authenticates his answers, without employee’s
consultation, to be good all the time.
Apart from the downside, the engineering manager’s control over methodology showcases his or
her valuable knowledge and experience in the engineering environment. Moreover, engineers
would respect and trust competent engineering professionals if they realize that working under
these professionals will enhance their own skills (Aronberg, 1985). This positive relationship
between managers and subordinates, resulting from mutual trust and benefits, provides a solid
ground for further cooperation.
12
It is common for junior employees, especially in an engineering environment, that their
supervisor or manager inspects their performance for potential flaws, which otherwise might be
overlooked by these junior employee (Aronberg, 1985). Supervision and proper guidance are
beneficial for training new engineers and equipping them with confidence about their
performance and decisions. It, however, can enlist the manager in the category of micromanagers
if he or she inspects subordinates to ensure their compliance with the methods they were
instructed to follow (Maloney & Federle, 1991).
2.5.2 Excessive Reporting and Updates
Reports and updates are a part of one's routine work. These are required by the managers to get
information on the performance of the subordinates so that the manager could use his or her
expertise to verify their performance (Maloney & Federle, 1991). However, this approach to
control subordinate's performance can turn the beneficial factor into a trait of micromanagement.
White (2010) argues that to satisfy the need for methodology control, the micromanager demands
overly frequent and unnecessary status reports. Furthermore, due to the micromanager’s
exploitative motive, most of the reports and details bear no value (Alvesson & Sveningsson,
2003). And no employee is willing to waste his or her efforts in meaningless work. Besides, if
this behaviour is stretched too far, the employee would even put less effort in essential reports.
This causes deterioration of employees’ attitudes and generates a negative impact on their work
(Badger et. al., 2009).
Hirsch et al. (1958) found that major contributor towards productivity loss was the requirement
of activities that did not take advantage of the unique knowledge and skills of the employee.
Other sources of potential output loss include working on an assignment that has no value (Liker
& Hancock, 1986). This underutilization of talent frustrates and demotivates the employees
(Hernson & Krauss, 1987) and decreases productivity and professional initiatives (Presutti, 2006).
Hence, maintaining an appropriate balance of feedbacks and reports is deemed as an important
trait of management.
Feedback is critical in formulating efficacy perceptions that interact with goal setting to enhance
performance motivation (Bandura & Cervone, 1983). As Ivancevich and McMahon (1982) noted
that continual performance reporting has a positive effect on the performance of engineers. A
feedback loop is usually used to analyse the need of iteration of the solution. However, Hernson
and Krauss (1987) argues that micromanagers use this method to control the outcome and thus
have a high urge for feedbacks. This criterion of constant supervision are demeaning to the
subordinates and an obstacle to their successful performance and creates a feeling of
untrustworthiness towards them (Porterfield, 2003).

13
As Maloney and Federle (1991) explain, one of the major characteristics of a leader is to monitor
his team and ensure that his or her subordinates achieve the required objectives while optimally
utilizing their competencies. However, taking monitoring to an extreme level can result in
employees' lack of ownership of work and little loyalty to the manager (Porterfield, 2003).
Consequently, it creates a negative image of the management, in other words, depicts
micromanagement.
2.5.3 Control and Manipulation of Time
According to Khatri (2009), discipline and control are essential elements of an organization.
Moreover, Bacon (2006) states that a successful organization is supported by good managers who
establish sound management controls, while trusting their subordinates and providing them with
appropriate latitude to act on independently. On the contrary, managers who are afraid to trust
their subordinates’ performance impose excessive control and under-delegate (Bacon, 2006;
White, 2010) and then hover over them to ensure that the schedule is followed (Pixton et al.
2014).
As discussed previously, micromanagers tend to control not only the outcome but also the
process and methodology (Hernson & Krauss, 1987). Thus, to avoid any pitfall in their planned
proceedings they try to keep control over the subordinates. As DeMaio (2009) argues, the
micromanager tends to zero in on every detail disrupting the work schedule of the employee and
turning their working hours into a private drudgery.
The scheduling of tasks and providing updates manipulate the limited working hours of the
employee. This demotivates them such that the quality of work suffers, and performance remains
at the minimum acceptable level (Porterfield, 2003). To cater for their risk aversive nature,
micromanager takes away employee participation, the possibility of empowerment, and the
opportunity to encourage employees to take responsibility for their decision (Khatri, 2009).
2.5.4 Failure to Subordinate Self
Self-subordination means to put aside personal stance and self-interest for the greater good of
others. In the context of management, it means to prioritize the interest of the organization and
the team rather than personal interest i.e. focusing on the bigger picture. According to Bacon
(2006), when a manager fails at self-subordination, he or she loses the sight of the bigger picture
and the greater good while thinking of himself or herself as a pragmatic and a perfectionist.
Livingston (2003) advocates that what managers believe about themselves is subtly reflected in
their expectations of their subordinates and how they treat them. The expectations and treatment
in turn directly affect subordinates’ performance, since subordinates adjust their behaviour to

14
meet these criteria, no matter what effect they would have on the whole organization. Thus, the
self-construct of a manager has a vital role in his managerial behaviour. This is supported by
Bacon (2006), enlisting twelve ‘self-constructs’ for good leadership, including autonomy,
detail/big picture focus and need for power. It explains the importance of these factors in
managerial behaviour.
Self-efficacy is believed to be an important factor in predicting work-related effectiveness
(Luthans and Peterson, 2002). Self-efficacy can be greatly useful for managers because it
empowers them to take more initiatives and sustain effort towards task accomplishment (Bandura,
1986; Stajkovic & Luthans, 1998). While promotion in the managerial ladder is typically
accompanied by an increase in responsibility as well as authority, it may strengthen self-efficacy
to a dangerous level where the manager becomes self-centred. If the sense of responsibilities is
not catered properly, the manager could become excessively risk aversive, and create an
imbalance in detail/big picture (Bacon, 2006).
2.5.5 Excessive Approval Requirement
It is an obligation of the manager that objectives and results, established in his or her mind, are
also clearly communicated to the employee (Goleman, 2000). If the employee does not have a
clear idea of objectives, he or she will report to the manager and seek approval at each step. This
happens because everyone wants to execute but does not want to take the responsibility (Khatri,
2009).
According to Hernson and Krauss (1987), in engineering firms the manager is an experienced
technical specialist, and involves himself or herself and controls minute details of the process.
This puts pressure on his or her subordinates to consult him or her at every phase of the task. The
manager is also burdened with unnecessary stress and exhaustion (Porterfield, 2003). In addition,
it also makes the micromanager overloaded with routine decisions, some of which border on
triviality (Khatri, 2009). Moreover, it distracts the manager from other more important tasks he or
she should focus on. Bacon (2006) argues that micromanager nit-picking the details to the extent
that those below him or her have little latitude to act on and cannot perform their jobs without
manager’s interference.
The driver of initiative, constituting of responsibility, delegation and decentralization,
materializes the objectives of the manager (Sabourin, 2012). However, micromanagers lack
delegation and decentralization so as to effect the overall team performance. This situation of
narrowly selective, task-oriented rigidity will preclude the employee from initiating important
tasks well within the scope of their job description (Presutti, 2006). Furthermore, it takes away
the sense of shared responsibility. According to Porterfield (2003), for most businesses, the

15
employees' skills are a valuable asset, while micromanaged organizations do not have such
competitive edge.

16
3 Methodology
In this chapter, we review our approach towards the research and discuss the method used in the
thesis. We adopted quantitative approach because it is persuasive to determine which factor of
micromanagement is more influential on the basis of statistical analysis. We designed the
questionnaire with responses on a Likert scale to register respondents’ attitudes. Three statistical
tests were applied to the data to achieve the intended objectives.
3.1 Research Approach
One of the main purposes of this thesis is to examine the existence of micromanaging symptoms
within engineering firms. To verify that micromanagement is prevalent in an engineering
environment, we need to measure a broad cross-section of people’s attitude. It is, however,
difficult to achieve this goal with qualitative approach within a short period of time. One type of
qualitative approach, for example, is the interview. The biggest challenge in conducting interview
would be scheduling the interview. Since, we are targeting current employees in engineering
firms, arranging interviews with them takes a notable amount of time. Then it would be
extremely difficult to obtain a large sample size within given time. Moreover, in-depth and open-
ended interview is recommended when researchers want detailed information from small number
of respondents (Boyce & Neale, 2006). On the contrary, a self-completion survey suppresses any
interviewer effect and is very convenient for the respondent to complete (Bryman & Bell, 2011).
We intend to differentiate several symptoms of micromanagement in terms of influence.
Consequently, it is difficult to determine which factor is influential than the others based on the
interviewees’ descriptions. While, according to Bryman & Bell (2011), the study of attitudes
through survey is an appropriate method. Thus, we choose the quantitative approach as our
methodology for research. Furthermore, this thesis deals with the management styles within the
firms, which covers the relationship between managers and subordinate. As a consequence, some
employees would be reluctant to discuss these issues in person, even though the entire process of
an interview would be guaranteed to be confidential and anonymous. There is a possibility that
the interviewee would neutralize their attitude during the live interview, hiding their true feelings.
While, in case of an anonymous survey the respondent could be more comfortable and confident
with answering questions related to his or her manager.

17
We designed a questionnaire to collect information from a wide range of engineers working
mainly in China, Pakistan and Sweden. This quantitative approach offers us the possibility to
collect a large pool of data from respondents with diverse background within engineering firms
(Malhotra, 2010). Besides, a questionnaire would be a good approach, because large amount of
data can be collected in an efficient and standardized way (Dorneyi, 2003). Web survey is a quick,
low cost and convenient method of collecting data (Malhotra, 2010). And it is easy to design,
monitor and customize the survey (Easterby-Smith et al. 2012). Moreover, multiple choices in the
questionnaire are in interval form. We can then translate respondents' attitudes into numeric
values. Subsequently, through appropriate statistical data analysis, it is easier to interpret their
attitudes towards different statements regarding micromanagement. Additionally, by comparing
interval data, the degree to which people perceive micromanagement at work could be more
clearly identified. There is, however, criticism over the quantitative method stating that it gives a
false sense of precision when applying it in social sciences since it is not always as exact as
numbers (Bryman & Bell, 2011). More importantly, respondents are fully aware that the data we
collected is ensure to remain confidential and anonymous. Since there is the anticipation that
specific data cannot be associated with any individual, we expect that their responses will
represent their experience and true attitude.
3.2 Research Design
For a conclusive research following elements are required: large sample size, clearly stated
information, structured process and quantitative analysis (Malhotra, 2010). As evident from
Literature Review, previous theories and arguments were well-structured and presented in a
detailed and vivid manner. An overview of the subject problem of micromanagement in
engineering management was presented in the light of previous research. We used quantitative
research method consisting of short, clear and direct questions. The sample size is statistically
large, and we performed multiple statistical analysis on the data. Thus, the structure of our study
adheres to the characteristics of a conclusive research design.
The empirical question of this study is to determine the efficacy of different symptoms of
micromanagement. Since, we aim at answering this empirical question in our thesis, the nature of
the research design is descriptive. Furthermore, we collect our data through survey and analyse it
with statistical methods, which characterizes a descriptive research design (Malhotra, 2010).
Moreover, our descriptive research aims at describing the efficacy of the symptoms of
micromanagement in an engineering environment.
In our research, a web survey was distributed among engineers from different engineering firms.
Additionally, all the data was collected during at a specific point in time that indicates that our
research is of cross-sectional design (Bryman & Bell, 2011). Furthermore, Bryman and Bell

18
(2011), argue that web survey is the most commonly used method associated with cross-sectional
design. The cross-sectional design provides us the flexibility of examining patterns and
associations between different variables defined in the thesis. We enlist our research as an
exploratory research, because lack of previous literature in engineering management regarding
micromanagement obstructs us from hypothesizing potential relations of variables and their
strength.
3.3 Data Collection Method
We obtained our data through a devised questionnaire distributed among managers and
subordinates in several engineering firms. Overall, the survey comprises of three parts: the first
part concerns with respondents' personal background and occupational details; the second part
focuses on manager's perspective and the third part is related to subordinate’s perspective. All the
data we collected, including gender, age, working experience, etc., remains entirely confidential.
To encourage the respondents to answer questions with comfort and freedom, we clearly stated in
the survey that all the collected data is for research purpose only and will remain entirely
anonymous.
It is possible that a manager might not be aware of his or her micromanaging behaviour,
responses from subordinate’s perspective aim to identify such behavioural traits in the managers.
At the same time, managers among the respondents are also subordinates of their respective
managers or bosses. So, we are obliged to register the subordinate's perspectives of the managers.
Therefore, we designed the survey in such a way that managers will complete all three parts,
while the respondents who do not have any employee working under them, only answer the first
and the third part.
3.3.1 Likert Scale
We adopted the Likert scale as response choices, which are “commonly used to measure attitude
providing a range of responses to a given question or statement” (Jamieson, 2004:1217). Likert
scale is used in fixed-choice response format to measure attitudes or opinions (Bowling, 1997).
We intend to analyse the degree to which respondents agree or disagree with the presented
statements of micromanaging symptoms, effects and reasons. In this case, open questions would
be difficult for respondents to express such attitudes or emotions. Hence, the Likert scale is the
proper method for measuring such perspectives and opinions. Moreover, Likert scale translates
intangible attitudes into visible figures, which are helpful for us to draw conclusions related to
management behaviours.

19
3.3.2 Design of the Survey
As we intend to conduct the survey in companies located in more than one country, considering
the diverse cultural backgrounds, we design all questions as simple and declarative statements to
lower the degree of confusion (Malhotra, 2010). Apart from an English version of questionnaire,
a translated version in Chinese is provided to help Chinese respondents better understand and
answer the questions.
There are odd and even numbered Likert scales. Due to the lack of mid-point, the latter one
forces the respondent to choose a side between agreement and disagreement. In our case,
however, respondents might hold a neutral attitude towards some statements. Hence, without the
option of mid-point, respondents will have to make a choice that may conflict with their
experience. Moreover, the respondents might become frustrated and arbitrary after being forced
to make choices against their will several times (Bryman & Bell, 2011). A result could be that
these incidents would disturb the analysis of the survey. Contrarily, odd numbered Likert scale
offers the mid-point, which stands for a neutral attitude. The mid-point, however, could be a
problem as well. Each respondent might interpret such mid-point having different meanings; for
example unsure, not applicable or unwilling to answer. To lower the negative effect of
ambiguous interpretation, we label the mid-point as neither agrees nor disagree, which is
supposed to be clear in the context. Furthermore, to collect as accurate data as possible, we
determine not to confuse respondents with overwhelming options. Hence, we provide fewer
choices, a five-point scale, instead of seven-point. And five-point scale already sufficiently
represents respondent's potential attitude towards the statement in the survey.
We have clearly stated instructions regarding how to complete the survey on each page which is
deemed significant according to Bryman & Bell (2011). Generally, it is easier for respondents to
understand the differences in a five rating scale and then make a choice based on their experience.
Respondents are requested to show their degree of endorsement to the statements designed to
analyse different perspectives. The values assigned to the five Likert items are: 1 = strongly
agree, 2 = agree, 3 = neither agree nor disagree, 4 = disagree, and 5 = strongly disagree. The
number of positive and negative options are balanced, and a mid-point is provided.
3.3.3 Question design
Our respondents are divided into two groups; group one (G1) represents the managers and group
two (G2) represents the subordinates. The second part of the questionnaire accounts for the
perspective of G1 while the third part accounts for the perspective of G2. It is pertinent to mention
that managers are also included in G2 because they act as subordinates to their managers or bosses.
For clear identification of statements used in the survey, we have labelled each statement with
abbreviation (in the form of GiQj). The whole questionnaire, including the abbreviations, is

20
presented in Appendix A. The first part of our questionnaire consists of six questions related to
personal and occupational information. The second part consists of seven questions in total, of
which five questions are related to symptoms of micromanagement, and two are related to
reasons for micromanagement from manager's perspective. The third part consists of seven
questions in total, of which five questions are related to symptoms of micromanagement, and last
two questions are related to effects of micromanagement from subordinate's perspective. The
significance of each symptom of micromanagement is observed through first five questions in
part two (G1Q1 to G1Q5) and part three (G2Q1 to G2Q5). Although the statements are different in
terms of the perspective, each paired question relates to the same symptom. For example, G1Q1
and G2Q1 are related to S1; G1Q2 and G2Q2 are related to S2 and so on.
3.3.4 Pilot Test
We conducted pilot test, before sending out the questionnaire, to examine the quality and to find
out any potential shortcomings. We sent out, both the research purpose of the thesis and the
questionnaire to our supervisor for suggestions. Additionally, we sent the survey to a post-
doctoral student of statistics, and a doctoral student of economics at LUSEM for consultation. We
also briefed the research purpose and methodology to these two people prior to their review of
the questionnaire. We incorporated minor changes regarding language and computer interface as
per their suggestions.
3.3.5 Reaching out to Respondents
Survey samples are broadly divided into two types: probability samples and non-probability
samples. This thesis uses probability sampling, which is a standard procedure in academic survey
research (Bryman & Bell, 2011). Probability sample means each member of the target population
has a known and non-zero probability of inclusion in the sample (Kish, 1965). In the context of
this thesis, our target population is the employees in engineering firms. First, we verify that
whether a company satisfies the criteria of an engineering firm. Then, we contact concerned
employees in the firm through email, describing the purpose of our thesis and asking for their
assistance. With their approval, the link to the survey is sent to them for distribution within their
company. They can then share the same email, containing the link to the survey, with fellow
employees and managers. However, there is criticism over e-mail distribution of surveys that it
often takes a longer time to get the replies and potential occurrence of non-response (Bryman &
Bell, 2011). In our case, since most respondents receive survey request from their colleagues, the
response rate is expected to be high. After distributing the survey, we send a friendly reminder of
the closing time to the contact person to improve response rate.

21
There might be some undesirable but unavoidable bias in this probability samples, including non-
response bias, coverage bias, and selection bias. First of all, since we used the web-based survey
form, we cannot acquire the exact non-response rate. Some respondents might never open the
link to the survey. Additionally, some respondents might give up completing the questionnaire in
between the survey. The number of these respondents is not recorded by the survey service or our
contacts in the companies. Secondly, we intended to include diverse employees and firms into the
sample. Some companies we contacted, could reject or simply do not reply to our survey request,
which leads to the coverage bias. Thirdly, because the survey is mostly distributed by our
contacts in the firms, employees who are close to these contact people are more likely to receive
the survey request. A result of this selection bias would be that the respondents are not diverse
enough, and some employees with different opinions might be excluded from the sample.
3.3.6 Sample
Our sample constitutes of 77 respondents and their demographic and occupational distribution is
presented in tabular form in Appendix B. Out of these 77 respondents, 22 respondents are
working in China, 31 in Pakistan, 12 in Sweden, 3 in the United States of American, 1 in the UK,
and 8 in the Middle-East. Moreover, only 9 respondents are female while the rest 68 are male.
This is due to the reason that engineering career is not preferred by females especially in Pakistan
and China.
Regarding the age of the respondents, 47 respondents are aged less than 30 years old. The second
largest age group, consisting of 20 respondents, are aged between 40 and 50 years, followed by
the age group of more than 50 years old with 6 respondents. The smallest age group was of 30 to
40 years old consisting of only 4 respondents.
When reviewing the respondents' work experience, 41 respondents have an experience of less
than five years. The number respondents with a working experience from five to ten years is only
17, while only 19 respondents have a working experience of more than ten years. Besides, a
majority of the respondents, 38, were currently involved in a managerial role, i.e.
managing/leading/supervising people.
With respect to working departments, the biggest group is of 23 respondents working in
Operations department, which is followed by Maintenance Department with 14 respondents.
Other sizeable groups were from Design and R&D department with 12 and 10 respondents
respectively. And there are 18 respondents in total working in the department of Inspection, IT /
CS, Management, Telecom and Others. The high rate of response from the departments of
Operations and Maintenance can be attributed to the fact that authors have previously worked in
these departments, and their colleagues were invited to participate in the survey.

22
3.4 Data Analysis
For quantitative analysis of the data, we used the computer software 'IBM SPSS Statistics'. The
data included the responses from 77 engineers working mainly in China, Pakistan and Sweden.
The responses were given on a five-point Likert scale. As argued by Allen and Seaman (2007),
responses from Likert scales can be analysed as interval data. Moreover, this ideology is
supported by multiple researchers including Blankenship (2009), Boone & Boone (2012), Brown
(2011) and Leach (2004). The effective analysis of Likert scales by treating it as interval data is
evidenced from multiple studies (see for instance, Baggaley & Hull, 1983; Maurer & Pierce,
1998; and Vickers, 1999).
We used arithmetic mean, mode and percent distributions in the general overview of the data. For
the in-depth analysis, we tried to contain our analysis within non-parametric statistical tests
because of the non-conformity of normal distribution and equal variances. Since, we are trying to
compare the efficacy of different symptoms, we assume that these symptoms induce different
influence. Thus, the normal distribution for the responses could not be assumed. Hence, the
parametric tests, for instance Student T test or ANOVA, could not be applied on our data.
Therefore, we used the non-parametric counterpart of such parametric tests including Friedman
test, Mann-Whitney test and Wilcoxon Signed Ranks test.
In the group of subordinates, we also register the subordinate's perspective of managers and
supervisors. This is important because the research aims at the managerial role rather than the
managerial position. Hence, we are obliged to take into account the subordinate's perspective of
managers and supervisors. Though, it might impact the independence of the two groups to the
extent that the sample distribution of G2 is influenced by inclusion of managers and supervisors.
For example, managers might be influenced by the questions in the second part of the survey
when they continue to answer questions in the third part. However, the presence or absence of
such effect cannot be justified. The results of Friedman test and Wilcoxon Signed Rank test
remain unaffected because they are applicable to dependant samples.
Whereas, the results of Mann-Whitney U test may be effected by this aberration. However, in our
survey, we stated in each part that respondents are requested to answer according to their
experience. Thus, we expect these experienced professionals to answer the survey based on their
personal experience and free of biasness. This helps us strengthen the claim of independence of
the two groups. According to Stevens (2012), if the researcher suspects that the nature of the
study will lead to correlated observations, a more stringent level of significance may be used to
supress its effect. Hence, we will use a lower level of significance for the Mann-Whitney U test.
At the beginning of Analysis and Discussion, we summarized all the responses of second and
third part of the survey. For this purpose, the arithmetic mean of responses for each questionnaire

23
item was calculated along with the mode and percent of agreement, disagreement and neutrality.
This helped us in preparing an overview of the whole data. This analysis is separately presented
for managers' and subordinates' perspective in Analysis and Discussion chapter.
3.4.1 Friedman Test
We intended to determine if the difference in agreement, on the five symptoms of
micromanagement, in a group is significant or not. For this purpose, Friedman test was
performed on each group. The Friedman test is a non-parametric statistical test used in testing
significant difference in case of three or more dependent variables. It helps us to determine
statistically if one of the variables outperform the other variables. Being a non-parametric test, it
gives us the provision that no assumption regarding the normal distribution of the input data is
required. In our thesis, we have five symptoms as variables in input data, and no assumptions can
be made on the normal distribution of these variables, thus Friedman test is suitable.
The null hypothesis of the test is that there are no differences between the variables (the
agreement rate of symptoms are the same). If the calculated probability value of the Friedman
test is less than the standard significance level of 0.05, the null hypothesis can be rejected,
meaning that at least one model is different from others. The computer software IBM SPSS
Statistics was used to perform the Friedman test.
The input data of Friedman test is first arranged in the form of a matrix with 'i' rows and 'j'
columns: {𝑥𝑖𝑗}𝑛×𝑘 , where 'n' is the sample size and 'k' is the number of variables. Ranks for each
observation within the row is calculated and the input matrix in transformed into a new
matrix{𝑟𝑖𝑗}𝑛×𝑘 , where 'rij' is the rank associated with 'xij'. Then the sums of the ranks, denoted by
'R', for each variable is calculated. Subsequently, the Friedman statistics 'Q' is calculated using
the sums of the ranks of the five variables.
Q =12
𝑛𝑘(𝑘+1)∑ 𝑅𝑗
2𝑘𝑗=1 − 3𝑛(𝑘 + 1) Equation 3.1
If either n or k satisfies the condition (i.e. n > 15 or k > 4), the probability distribution 'Q' would
approximate to a Chi-Squared distribution. Since, both n and k are large for both groups; the p-
value is given by P(𝑥𝑘−12
~ Q). And we adopt significance level α as 0.05. With p-value and α, we
were then able to generalize the level of agreement within each group over five symptoms as
statistically significant or insignificant.

24
3.4.2 Mann-Whitney Test
To analyse the consistency of responses on each symptom across the two groups we used Mann-
Whitney test. The test was performed in five pairs, one for each symptom across the two groups
to check if the difference of agreement on each symptom was significant or not. We were then
able to identify the symptoms that had a similar level of agreement in both groups.
Mann-Whitney U test is an alternative form of independent T-test for non-parametric testing, and
it has more efficiency than the t-test on non-normal distributions. We used this test to examine
the consistency of agreement between the two groups on the five symptoms. Mechanism of
Mann-Whitney test is based upon the differences in the ranked positions of scores in two groups.
The U-value of the two groups is calculated with the following formula, Equation 3.2 and
Equation 3.3, where: n1 and n2 are the sample size of the two data sets, and R stands for the sums
of the ranks of each variable.
𝑈1 = 𝑛1𝑛2 +𝑛1(𝑛1+1)
2− 𝑅1 Equation 3.2
𝑈2 = 𝑛1𝑛2 +𝑛2(𝑛2+1)
2− 𝑅2 Equation 3.3
The smaller one of the two U-values is used when consulting significance table. SPSS software
transforms the U-value to the standardized value for statistically large samples. Subsequently, a
significance value is generated against the Z-score. According to Stevens (2012), if the researcher
suspects that the nature of their study will lead to correlated observations, a more stringent level
of significance may be used to supress its effect. Since, the two samples are not entirely
independent, we will use a lower level of significance for the Mann-Whitney U test. We can then
use this p-value and significance level α = 0.01 to establish the level of consistency. If the
probability value calculated by the Mann-Whitney test is less than the significance level, the null
hypothesis can be rejected. This means that the agreement across the groups is significantly
different.
3.4.3 Wilcoxon Signed Rank Test
We also intend to determine the significance of the difference between distributions of the
agreement within each group. For this purpose, Wilcoxon Signed Ranks test was performed
between all the possible pairs of symptoms in each group. In each group, there were ten possible
pairs on which the test was performed. The p-value was used to determine if the difference in
each pair is statistically significant or not.
Wilcoxon Sign Rank Test is the non-parametric analogue of paired T-test and is used to compare
two sets of scores observed from the same subjects. It provides more accurate differentiation of

25
median of two variables. The test is based on viewing paired observations to examine the null
hypothesis i.e. if the sampled variables follow the same distribution or not.
We start with a set of paired values of Xa and Xb, where ‘a’ and ‘b’ are the two variables. The
absolute difference between each pair (Xa - Xb) is calculated. The entries with zero absolute
difference will be omitted or marked as 'Ties' in SPSS. The remaining absolute differences are
ranked from smallest to largest employing tied ranks where applicable. And these ranks are
denoted by R. Subsequently, the rank is assigned a positive sign if Xa > Xb or a negative sign if
Xa < Xb. Thus, a positive and a negative ranking is obtained according to the sign of the ranks and
we acquire a signed rank (using sign function) denoted by (Sgn) Ri. Wilcoxon statistics 'W' is
calculated by summing all the positive and negative signed ranks separately. Thus, we obtain two
values of W+ and W- based on the sign of the ranking. Rankings are presented in tabular form in
Appendix C and D for test within G1 and G2 respectively. For a statistically large sample, we can
use the following formula to compute the corresponding Z-score while using the lower of the two
calculated values of W.
z =𝑊−0.5
𝜎𝑊 Equation 3.4
𝜎𝑊 = √𝑁𝑟(𝑁𝑟+1)(2𝑁𝑟+1)
6 Equation 3.5
Our sample is statistically large, and the Wilcoxon Signed Rank test was performed with SPSS
software. SPSS transformed the observed results into Z-scores and p-values. With p-value and α
= 0.05, we were then able to determine the significance of the difference between the paired
symptoms within each group.
The Wilcoxon Signed Rank test not only shows the relative magnitude of the ranked differences
between the two scores but also indicates the positive or negative direction of the differences
(Kraska-Miller, 2013). Analysing if the results are based on negative or positive ranking (see
Appendix C and D) we can identify the direction of difference and form an inequality relation
between the variables (Field, 2000). Thus, we also obtained information about the inequality
relation from each pair. Ten such inequality pairs were formed in each group which helped us in
developing an overall inequality relation between the five symptoms in each group.
3.5 Reliability, Validity and Reflexivity
According to Bryman and Bell (2011) the study is perceived as reliable if the results are
repeatable, It means that if the same study is performed at a different point in time then it will
yield the same results (Easterby-Smith et al. 2012). Especially, in case of quantitative research

26
the factor of reliability must be taken into account (Bryman & Bell, 2011). In our survey, we tried
to provide respondents a confidential and reliable mode to express and share their true attitudes
with confidence. Moreover, we believe that we were able to gather data that truly reflects their
perspective. Hence, we are confident about the reliability of our research.
Validity is generally categorized into two parts, internal validity and external validity. According
to Malhotra (2010), internal validity focuses on the cause and effect relationship between
dependent and independent variable whereas, external validity refers to the extent to which the
findings of the research can be applied to the population from which the sample was drawn or
other population and research settings. The effect of the five symptoms on micromanagement is
established in the previous literature and also evidenced in our research. Thus, we can claim that
our research is internally valid. Additionally, we perceive that our findings can be applied to the
engineering environment in three countries (China, Pakistan and Sweden), to which most of our
respondents belong. However, it cannot be generalized to any other population. Thus, we think
that the external validity of our research is limited.
To make our research reflective, we need to pay attention to self-reflection and careful
interpretation (Alvesson & Sköldberg, 2009). Since both of the authors have technical
background and experience of the engineering environment, we regularly contemplate our
research and raise critical questions for ourselves. Moreover, to interpret data with diligence, it is
important to take a subjective position. This means that we need to be aware of our effect on the
research and distance ourselves when analysing data. It is, however, unavoidable that we interpret
the literature on the basis of our experience. Hence, we tend to take a critical attitude towards
scholars' arguments and respondents' statements.

27
4 Findings and Analysis
We have grouped our data according to two perspectives, managers (G1) and subordinates (G2).
And each respondent submitted their level of agreement on statements related to five symptoms.
We used the following abbreviations to represent these five symptoms in our analysis: symptom
1 (S1) is excessive control over methodology; symptom 2 (S2) is excessive reporting and updates;
symptom 3 (S3) is control and manipulation of time; symptom 4 (S4) is failure to subordinate self;
and symptom 5 (S5) is excessive approval requirement.
4.1 Overall Implications from the Survey
Measures of central tendency can be used as a representative of a set of distributive values
(Bryman & Bell, 2011). For a quantitative data analysis, different measures can identify the
central tendency of a distribution, for instance; arithmetic mean, median and mode (Malhotra,
2010). Because our data is spread on an interval scale, the most suitable measure of central
tendency, according to Bryman & Bell (2011), is the arithmetic mean. It is, however, argued that
the arithmetic mean is sensitive to extreme values and having outliers can decrease the power of
this measurement (Malhotra, 2010). Additionally, we have also used the mode to present the
overview of the data to support our argument.
A general analysis of 77 responses regarding the different elements of micromanagement is
presented in this section. The questionnaire was designed to gather data from two perspectives.
The first subsection deals with the Manager's perspective and the second one deals with the
subordinate's perspective.
4.1.1 Group one – Managers
Overall, there are 38 managers or supervisors among all 77 respondents. The arithmetic means of
all the responses, as shown in Table 4.1, are equal to or greater than 3.6. Moreover, percent of
agreement and strong agreement are over sixty for all questionnaire items. This means most
managers indicate agreement or strong agreement on all the five symptoms. There are notably
only 2.6 percent claiming their disagreement on questionnaire item G1Q3.

28
In terms of the most important factor that influenced manager’s style of managing and leading
people, we observed similar agreement towards all the three factors provided in the survey.
Almost 39 percent ranked corporate culture as the most important factor. Followed by the factor
of their personality with 34.2 percent and 32.1 percent agreed upon employees’ behaviour. Three
managers stated other factors of their own in the survey, including ‘discuss with employees about
personal problems and professional issues’, ‘motivation of employees’ and ‘build or rebuild
resonant relationships’.
Table 4.1: Perspective on five symptoms in G1
Symptom Arithmetic
Mean Mode
Percent of
agreement &
strong
agreement
Percent
of
neutrality
Percent of
disagreement
& strongly
disagreement
S1: Control over
methodology 3.7 5 63.2 13.2 23.7
S2: Excessive
reporting and
updates
3.9 4 71.1 18.4 10.5
S3: Control and
manipulation of time 4.1 4 78.9 18.4 2.6
S4: Failure to
subordinate self 3.6 4 65.8 10.5 23.7
S5: Excessive
approval requirement 3.6 4 63.2 10.5 26.3
The first questionnaire item (G1Q1) targets S1. As illustrated in Table 4.1, the arithmetic mean,
3.7, is high, showing that there is a strong agreement on this symptom in manager’s perspective.
Moreover, nearly 63.2 percent of managers claim agreement or strong agreement on this
symptom. Notably, there is also 23.7 percent who show disagreement while only 13.2 percent
remain neutral.
The second questionnaire item (G1Q2) targeting S2 is observed to have similar characteristics with
G1Q3. The arithmetic mean 3.9 is also high. Moreover, nearly 71.1 percent state agreement while
18.4 percent show neutrality. In contrast, a higher percent demonstrates disagreement on G1Q2
than G1Q3.
Regarding the third questionnaire item (G1Q3) targeting S3, it has the highest arithmetic mean of
4.1 in this group. Approximately 78.9 percent of managers agreed with this micromanagement
29
behaviour, and only 2.6 percent disagree on this item. This shows that according to the managers,
this symptom is the most prevalent in an engineering environment.
Similarly, the fourth (G1Q4) and fifth (G1Q5) questionnaire items, targeting S4 and S5 respectively,
are rated with the same arithmetic mean of 3.6. Whereas, 65.8 percent and 63.2 percent of
managers respectively show agreement on these two symptoms. In contrast, 23.7 and 26.3
percent claim disagreement, which is also close to the result of G1Q1.
4.1.2 Group two – Subordinates
As shown in Table 4.2, the first questionnaire item in this part (G2Q1) targeted S1. This item has
shown the lowest agreement rate within this group, and overall S1 is not agreed upon in the
subordinates’ group. It has an arithmetic mean of 2.95 which is quite neutral in nature. Besides,
the distribution is also predominantly even. However, almost 36 percent of the subordinates
perceive that their manager has aggressive control over methodology.
Regarding the second questionnaire item (G2Q2), it shows a strong tendency of agreement on S2.
With an agreement rate of more than 68 percent, subordinates state that engineering managers
require frequent reports and updates. The arithmetic mean of this item is 3.78, which is relatively
high. Additionally, the distribution is highly skewed towards agreement, and only 12 percent of
subordinates disagree on the subject.
The third questionnaire item (G2Q3) concerns S3. The mean of this data set is 3.3, which shows an
inclination towards agreement on this symptom. While only 28 percent of the respondents
disagree with this factor. This is relatively lower than the agreement rate of 49 percent. This data
implies that, according to subordinates, their engineering managers tend to control and
manipulate their time.
S4 is related to questionnaire item number four (G2Q4). The average of this data set is 3.51 which
is relatively high. Most of the subordinates, almost 58.4 percent agree with the statement while
fewer than those, nearly 27 percent, are in disagreement with the statement. Thus, high tendency
for the requirement of an experienced engineering manager may lead to higher failure to the
subordination of the managers.
Questionnaire item number five (G2Q5) aims at S5. We determined that engineering managers
tend to demand excessive approvals. The arithmetic mean for this data set is 3.26 and mode is
four, which shows a low tendency of agreement with the statement. We observe an agreement
with 47 percent of the subordinates realizing the high requirement of approval from managers.
Regarding the importance of the technical experience of an engineering manager, the sixth
questionnaire item (G2Q6) tries to justify this subject. With an average of 3.3, the statement can

30
be seen as neutral, but surprisingly the mode for this data set is four, with 29 percent of
subordinates strongly agreeing that manager's experience is important for the team. An agreement
rate of 52 percent suggests that good performance of team is somewhat linked with technical
experience of the engineering manager,
The last item of the questionnaire (G2Q7) relates the subordinate's performance with excessive
reports and approval requirement. The average and mode of the data set are 3.5 and four
respectively. Majority of the subordinate, 57.2 percent, agree with the statement while only 20.8
percent hold the opposite opinion. Thus, we observe a relatively high tendency of agreement on
the adverse effects of excessive reports and approvals on subordinate's performance.
In summary, empowering an experienced engineering manager can lead to his or her failure to
self-subordination. With respect to subordinates' perspective, we can state that S2 and S5 are more
prominent compared to that of managers’. While they also have a negative impact on their
performance. Moreover, the technical experience of the engineering manager is perceived as an
important factor that influences team performance.
Table 4.2: Perspective on five symptoms in G2
Symptoms Arithmetic
Mean Mode
Percent of
agreement &
strong
agreement
Percent
of
neutrality
Percent of
disagreement
& strongly
disagreement
S1: Control over
methodology 2.95 2 36.4 22 41.6
S2: Excessive
reporting and
updates
3.78 4 68.8 19.5 11.7
S3: Control and
manipulation of time 3.30 4 49.4 22.1 28.5
S4: Failure to
subordinate self 3.51 5 58.4 14.3 27.3
S5: Excessive
approval requirement 3.26 4 46.7 24.7 28.6
4.2 Consistency within groups
Firstly, we intend to determine the significance of the difference of agreement on the five
statements within each group. This can be achieved with Friedman test, which is a non-

31
parametric test that compares the distribution of 'k' variables and their means for the significance
of difference. In this section, we performed Friedman test on both groups separately.
4.2.1 Group One – Managers
In G1 the Friedman test calculated the mean ranks for the five statements in managers’
perspectives. The mean ranks are presented in Table 4.3, and the test statistics are shown in Table
4.4. There is a relatively high level of consistency in this group towards the five symptoms of
micromanagement. The p-value for this test does not reject the null hypothesis of insignificant
difference, which indicates that the difference in the responses of the five statements is
statistically insignificant. In other words, from managers' perspective, all the five symptoms are
similar in terms of influence. This is also evident from the arithmetic means of the five data sets.
Table 4.3: Mean ranks of five symptoms in G1
Statement N Mean Standard
Deviation
Mean
Rank
G1Q1: Do you frequently direct your
subordinates how to accomplish a task? 38 3.68 1.210 2.93
G1Q2: Do you frequently ask your
subordinates for reports and updates? 38 3.95 0.985 3.17
G1Q3: Do you schedule different tasks for
your subordinates? 38 4.08 0.882 3.32
G1Q4: Do you perceive yourself as the most
important part of the team because of your
managerial position?
38 3.58 1.368 2.75
G1Q5: Do you feel that you need to approve
everything at every phase of the tasks? 38 3.55 1.350 2.83
The calculated mean ranks are also very close. It is very difficult to form distinct classes within
these ranks. However, we can still create two classes according to level of agreement using mean
and rank mean simultaneously. We can see that G1Q2 and G1Q3 have high mean values and mean
ranks while G1Q1, G1Q4 and G1Q5 have moderately high mean values and mean ranks.

32
Table 4.4: Friedman test statistics in G1
Test Statistics Value
N 38
df 4
Significance value. .281
4.2.2 Group Two – Subordinates
In G2 the Friedman test calculated the mean ranks for the five statements in subordinates’
perspectives. The results are presented in Table 4.5, and the test statistics are shown in Table 4.6.
The low p-value, of zero, for this test, means the rejection of the null hypothesis of insignificant
difference, suggesting that the difference in the responses of the five statements is statistically
significant. In other words, from subordinates' perspective, we observe a variation in influence
between the five symptoms. This is also evident from the athematic means of the five data sets.
Table 4.5: Mean ranks of five symptoms in G2
Statement N Mean Standard
Deviation
Mean
Rank
G2Q1: Does your manager/boss
frequently tell you how to do a job? 77 2.95 1.191 2.46
G2Q2: Do you think your manager/boss
frequently requires reports or updates? 77 3.78 1.034 3.57
G2Q3: Has your manager/boss frequently
assigned you tasks that interfere with
your routine schedule?
77 3.30 1.204 2.85
G2Q4: Does your manager/boss thinks
he/she is always right because of his/her
managerial position?
77 3.51 1.354 3.27
G2Q5: Do you need extra approvals from
your manager/boss? 77 3.26 1.117 2.85

33
By analysing the results of Friedman test, we can conclude that G2Q2 has a high mean and mean
rank while G2Q1 has a low mean and mean rank. Besides, the other three statements G2Q3, G2Q4
and G2Q5 lie in the moderately high category.
Table 4.6: Friedman test statistics in G2
Test Statistics Value
N 77
df 4
Significance value .000*
*Statistically significant difference exists
4.3 Consistency across groups
To analyse each symptom from two perspectives we examine the consistency of the response in
two groups related to the five symptoms. The sample across the groups is different and
independent. Thus, we have used Mann-Whitney test, which is a non-parametric test involving
the sum of ranks. It is used to test the equivalence between two population means.
The test was performed in five pairs, and each pair involves related statements across the two
groups, targeting the same symptom to examine the significance of the difference of agreement
on each symptom. We were then able to identify the symptoms that had a similar level of
agreement or disagreement in both groups. The sum of ranks and test statistics are presented
respectively in Table 4.7 and Table 4.8.
Table 4.7: Sum of ranks across the groups
Symptom Functional
Group N Mean Rank Sum of Ranks
S1: Control
over
methodology
Manager 38 70.83 2691.50
Subordinate 77 51.67 3978.50
Total 115
S2: Excessive
reporting and
updates
Manager 38 61.37 2332.00
Subordinate 77 56.34 4338.00
Total 115
S3: Control and
manipulation of
time
Manager 38 72.36 2749.50
Subordinate 77 50.92 3920.50
Total 115
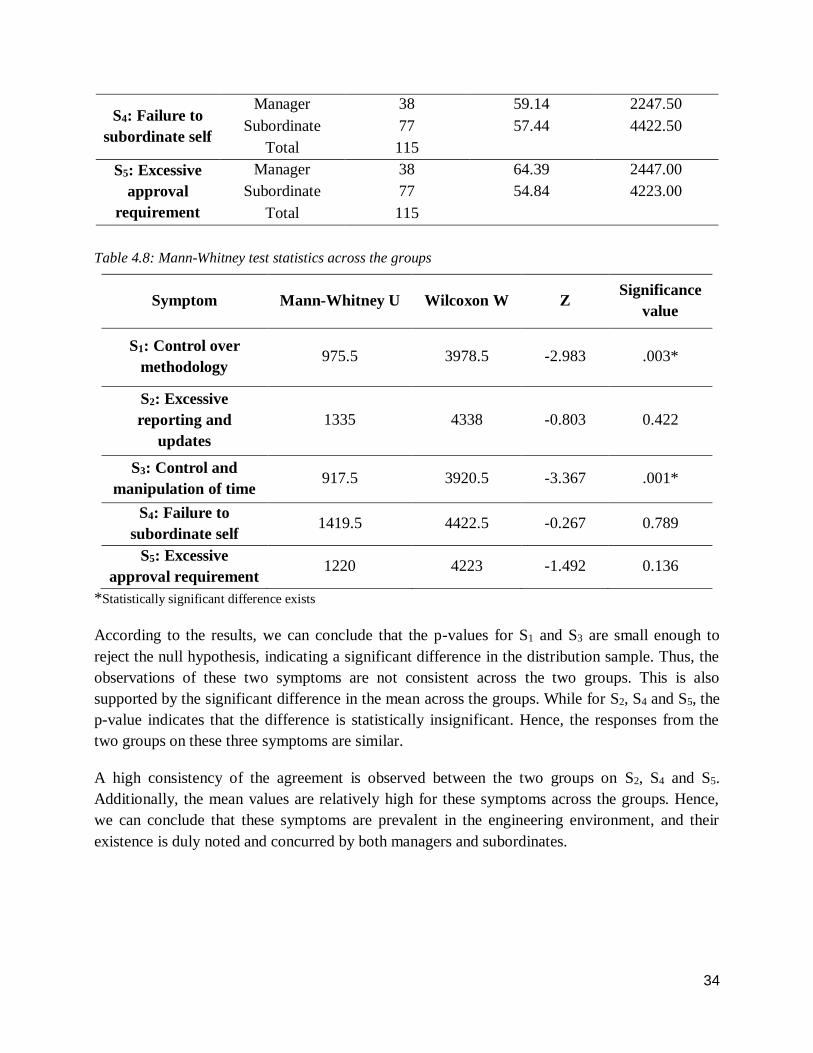
34
S4: Failure to
subordinate self
Manager 38 59.14 2247.50
Subordinate 77 57.44 4422.50
Total 115
S5: Excessive
approval
requirement
Manager 38 64.39 2447.00
Subordinate 77 54.84 4223.00
Total 115
Table 4.8: Mann-Whitney test statistics across the groups
Symptom Mann-Whitney U Wilcoxon W Z Significance
value
S1: Control over
methodology 975.5 3978.5 -2.983 .003*
S2: Excessive
reporting and
updates
1335 4338 -0.803 0.422
S3: Control and
manipulation of time 917.5 3920.5 -3.367 .001*
S4: Failure to
subordinate self 1419.5 4422.5 -0.267 0.789
S5: Excessive
approval requirement 1220 4223 -1.492 0.136
*Statistically significant difference exists
According to the results, we can conclude that the p-values for S1 and S3 are small enough to
reject the null hypothesis, indicating a significant difference in the distribution sample. Thus, the
observations of these two symptoms are not consistent across the two groups. This is also
supported by the significant difference in the mean across the groups. While for S2, S4 and S5, the
p-value indicates that the difference is statistically insignificant. Hence, the responses from the
two groups on these three symptoms are similar.
A high consistency of the agreement is observed between the two groups on S2, S4 and S5.
Additionally, the mean values are relatively high for these symptoms across the groups. Hence,
we can conclude that these symptoms are prevalent in the engineering environment, and their
existence is duly noted and concurred by both managers and subordinates.

35
4.4 Paired Comparison within Group
In the last part of the analysis, we intend to determine the significance of the difference between
distributions of agreement among different possible pairs of symptoms within a group. We adopt
Wilcoxon Rank Sign test, which is a statistical comparison of averages of two dependent samples
in terms of the significance of difference. Moreover, the Z-value will help us establish an
inequality relation between the two samples of each test. For instance, if the Z-value is based on
negative ranking then the second data set in the pair is greater than the first one and vice versa.
Thus, we will deduce an inequality relation between the two samples for each test using the basis
for the Z-value.
Within each group, there are ten combinations of symptoms in total that will be tested with the
method mentioned above. Additionally, each test will give us an inequality relation between
symptoms. Thus, with ten such inequalities we will be able to form an overall inequality relation
involving all the five symptoms.
4.4.1 Group One - Managers
The results of Wilcoxon Rank Sign test on the ten combinations within the G1 is represented in
Table 4.9. The ranking distribution of each symptom is tabulated in Appendix C. A division is
observed according to the p-values of the ten pairs. Three pairs (pair # 2, 8 and 9) have
significant differences (i.e. p < 0.05), three pairs (pair # 1, 6 and 7) have moderately insignificant
differences (i.e. 0.05 < p < 0.12) and four pairs (pair # 3, 4, 5 and 10) have highly insignificant
differences (i.e. p > 0.5). This classification is only provided to simplify our analysis into groups.
Out of ten pairs, statistically significant difference was found in three pairs (pair # 2, 8 and 9)
only. Surprisingly, all three pairs involved S3 and the test indicates a significant difference
between S3 and S1, S3 and S4, and S3 and S5. Also, the inequality relation within these three pairs
indicates that S3 has a better agreement rate. Thus, we can conclude that S3 is relatively more
agreed upon within the G1.
Secondly, three pairs (pair # 1, 6 and 7) have the moderately insignificant difference, in which the
p-value is greater than 0.05 and less than 0.12. Moreover, all three pairs involved S2 and the test
indicates a moderately insignificant difference between S2 and S1, S2 and S4, and S2 and S5. The
inequality relation within these pairs reveals that S2 has a better agreement rate. Moreover, if we
include the results of pair 5, which indicates that there is an insignificant difference between S2
and S3 while the latter is the leading one. Thus, we can conclude from these seven tests that S3 is
the most agreed upon in managers' group, followed by S2.
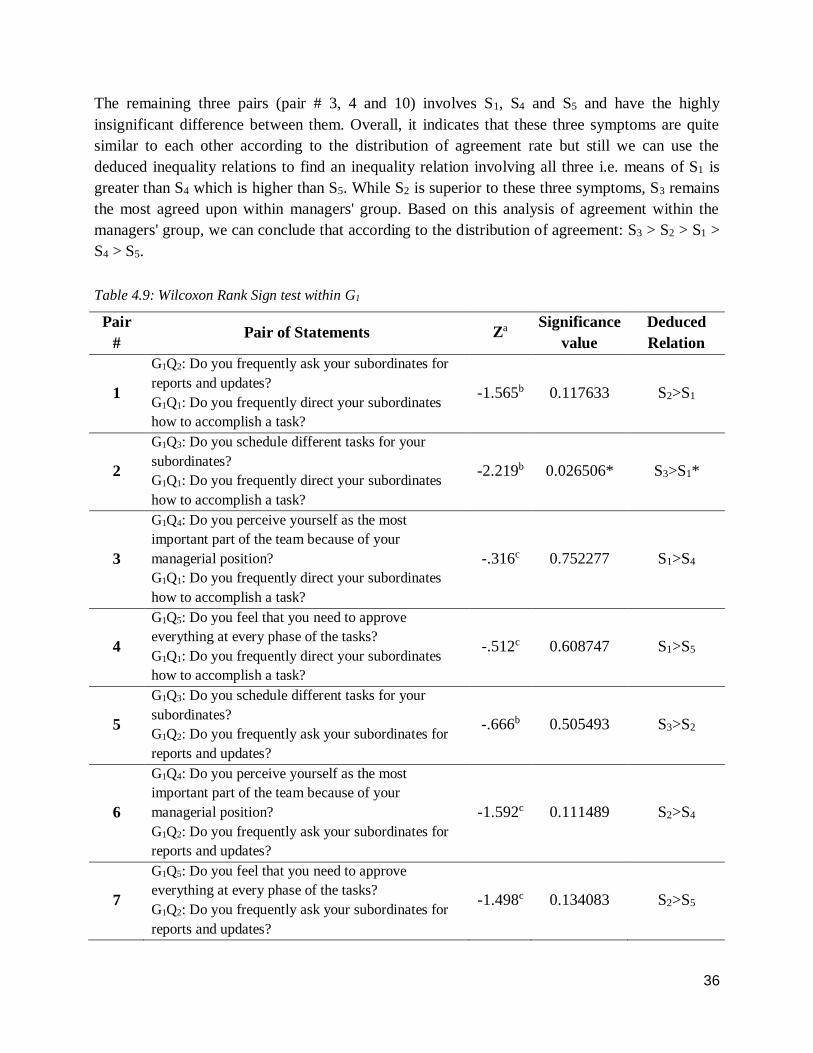
36
The remaining three pairs (pair # 3, 4 and 10) involves S1, S4 and S5 and have the highly
insignificant difference between them. Overall, it indicates that these three symptoms are quite
similar to each other according to the distribution of agreement rate but still we can use the
deduced inequality relations to find an inequality relation involving all three i.e. means of S1 is
greater than S4 which is higher than S5. While S2 is superior to these three symptoms, S3 remains
the most agreed upon within managers' group. Based on this analysis of agreement within the
managers' group, we can conclude that according to the distribution of agreement: S3 > S2 > S1 >
S4 > S5.
Table 4.9: Wilcoxon Rank Sign test within G1
Pair
# Pair of Statements Za
Significance
value
Deduced
Relation
1
G1Q2: Do you frequently ask your subordinates for
reports and updates?
G1Q1: Do you frequently direct your subordinates
how to accomplish a task?
-1.565b 0.117633 S2>S1
2
G1Q3: Do you schedule different tasks for your
subordinates?
G1Q1: Do you frequently direct your subordinates
how to accomplish a task?
-2.219b 0.026506* S3>S1*
3
G1Q4: Do you perceive yourself as the most
important part of the team because of your
managerial position?
G1Q1: Do you frequently direct your subordinates
how to accomplish a task?
-.316c 0.752277 S1>S4
4
G1Q5: Do you feel that you need to approve
everything at every phase of the tasks?
G1Q1: Do you frequently direct your subordinates
how to accomplish a task?
-.512c 0.608747 S1>S5
5
G1Q3: Do you schedule different tasks for your
subordinates?
G1Q2: Do you frequently ask your subordinates for
reports and updates?
-.666b 0.505493 S3>S2
6
G1Q4: Do you perceive yourself as the most
important part of the team because of your
managerial position?
G1Q2: Do you frequently ask your subordinates for
reports and updates?
-1.592c 0.111489 S2>S4
7
G1Q5: Do you feel that you need to approve
everything at every phase of the tasks?
G1Q2: Do you frequently ask your subordinates for
reports and updates?
-1.498c 0.134083 S2>S5

37
8
G1Q4: Do you perceive yourself as the most
important part of the team because of your
managerial position?
G1Q3: Do you schedule different tasks for your
subordinates?
-2.144c 0.032034* S3>S4*
9
G1Q5: Do you feel that you need to approve
everything at every phase of the tasks?
G1Q3: Do you schedule different tasks for your
subordinates?
-2.159c 0.030828* S3>S5*
10
G1Q5: Do you feel that you need to approve
everything at every phase of the tasks?
G1Q4: Do you perceive yourself as the most
important part of the team because of your
managerial position?
-.102c 0.918543 S4>S5
a. Wilcoxon Signed Ranks Test
b. Based on negative ranks.
c. Based on positive ranks.
*Statistically significant difference exists for directional test
4.4.2 Group Two - Subordinates
The results of Wilcoxon Rank Sign test on the ten possible combinations within the group of
subordinates is represented in Table 4.10. The ranking distribution of each symptom is tabulated
in Appendix D. We can see from the p-values of the ten pairs that there is a sort of division,
according to the p-value. Six pairs (pair # 1, 2, 3, 4, 5 and 7) have significant differences (i.e. p <
0.05), two pairs (pair # 6 and 10) have moderately insignificant differences (i.e. 0.05 < p < 0.10)
and two pairs (pair # 8 and 9) have insignificant differences (i.e. p > 0.3). This classification is
only provided to simplify our analysis into groups.
Out of ten pairs, statistically significant difference was only found in six pairs (pair # 1, 2, 3, 4, 5
and 7). Surprisingly, all the six pairs involved S1 and S2. First four tests indicate a significant
difference between S1 and all the other four symptoms while S1 is lesser than each of the four
other symptoms. Hence, we can say that S1 has the lowest distribution of agreement rate in
subordinates' group. The other two tests indicate a significant difference between S2 and S3; S2
and S5. Moreover, inequality relation points out that S2 is greater than S3 and S5. Moreover, if we
include the results of pair 6, which indicates that there is a moderately insignificant difference
between S2 and S4 while the former is the leading one. This indicates that S2 leads with the
highest agreement rate. Thus, we can conclude from these seven tests that S2 is the most agreed
upon and S1 is the least agreed upon in subordinates' group.
Secondly, two pairs (pair # 6 and 10) have moderately insignificant difference having p-value of
0.093 and 0.153 respectively. Results of pair 6 have been discussed in the above paragraph.

38
While pair 10 involves S4 and S5, the test indicates a moderately insignificant difference between
S4 and S5, and the inequality relation within this pair reveals that S4 has a better agreement rate.
The remaining two pairs (pair # 8 and 9) involve S5, S4 and S5 and have the highly insignificant
difference between them. Overall these tests indicate that these three symptoms are quite similar
to each other according to the distribution of agreement rate but still we can use the deduced
inequality relations to figure out an inequality relation involving all three i.e. mean of S4 is
greater than S3 which is higher than S5. While S2 is the most agreed upon and S1 is the least
agreed upon in subordinates' group. Based on this analysis of agreement within the managers'
group, we can conclude that according to the distribution of agreement: S2 > S4 > S3 > S5 > S1.
Table 4.10: Wilcoxon Rank Sign test within G2
Pair
# Pair of Statements Za Significance
value
Deduced
Relation
1
G2Q2: Do you think your manager/boss frequently
requires reports or updates?
G2Q1: Does your manager/boss frequently tell you
how to do a job?
-4.949b 0.000* S2>S1*
2
G2Q3: Has your manager/boss frequently assigned
you tasks that interfere with your routine schedule?
G2Q1: Does your manager/boss frequently tell you
how to do a job?
-2.108b 0.035* S3>S1*
3
G2Q4: Does your manager/boss thinks he/she is
always right because of his/her managerial position?
G2Q1: Does your manager/boss frequently tell you
how to do a job?
-3.166b 0.002* S4>S1*
4
G2Q5: Do you need extra approvals from your
manager/boss?
G2Q1: Does your manager/boss frequently tell you
how to do a job?
-2.392b 0.017* S5>S1*
5
G2Q3: Has your manager/boss frequently assigned
you tasks that interfere with your routine schedule?
G2Q2: Do you think your manager/boss frequently
requires reports or updates?
-3.188c 0.001* S2>S3*
6
G2Q4: Does your manager/boss thinks he/she is
always right because of his/her managerial position?
G2Q2: Do you think your manager/boss frequently
requires reports or updates?
-1.679c 0.093 S2>S4
7
G2Q5: Do you need extra approvals from your
manager/boss?
G2Q2: Do you think your manager/boss frequently
requires reports or updates?
-3.881c 0.000* S2>S5*

39
8
G2Q4: Does your manager/boss thinks he/she is
always right because of his/her managerial position?
G2Q3: Has your manager/boss frequently assigned
you tasks that interfere with your routine schedule?
-.852b 0.394 S4>S3
9
G2Q5: Do you need extra approvals from your
manager/boss?
G2Q3: Has your manager/boss frequently assigned
you tasks that interfere with your routine schedule?
-.212c 0.832 S3>S5
10
G2Q5: Do you need extra approvals from your
manager/boss?
G2Q4: Does your manager/boss thinks he/she is
always right because of his/her managerial position?
-1.429c 0.153 S4>S5
a. Wilcoxon Signed Ranks Test
b. Based on negative ranks.
c. Based on positive ranks.
*Statistically significant difference
4.5 Discussion
Our research is based upon the review of the previous literature. This study helped us identify the
symptoms and reasons of micromanagement. Furthermore, our quantitative survey and statistical
analysis endorses the concept presented in the Literature Review. Through statistical tests, we
were able to check the consistency within and across the group of managers and the group of
subordinates. Moreover, we identified the efficacy of the five symptoms of micromanagement in
an engineering environment.
Any discussion with an employee regarding management can be characterized as a sensitive issue,
and employees have a tendency to be reluctant towards such topics. Most of the gathered data
was made possible through personal contacts with friends and previous colleagues. Since, the
respondents were personally contacted; they were obliged to complete the survey, but still these
respondents were reluctant towards sharing the survey with their colleagues and managers. The
same reluctance towards the subject in question was noted when we contacted HR managers and
department managers of several engineering firms. Subsequently, our responses are limited to
mainly three countries of China, Pakistan and Sweden.
Our analysis has identified both consistencies and discrepancies between managers' and
subordinates' perspective on each symptom of micromanagement. Furthermore, this study also
reveals that within both groups, the symptoms are rated quite differently. Overall, we observe that
there is a general agreement on S2 and S3 i.e. excessive reporting & updates and control &

40
manipulation of time. While S5, excessive approval requirement, is not much supported in both
groups.
From the overview of the collected data, we can say that all of the five symptoms were deemed
important by managers. Additionally, the agreement rate for the five symptoms were not much
different. However, S2 and S3 can be considered as the leading symptoms in this group. While, in
the group of subordinates, only S2 can be categorized as the leading symptom and S3 was deemed
relatively important but not as strong as in managers' group. This suggests that engineering
managers require excessive reports and updates from their subordinates. Additionally, managers
perceive themselves as scheduling different tasks for their subordinates.
In the two groups, S1 has the most contrasting approaches, it is deemed important by managers
while subordinates disagree with it. Thus, it seems that engineering managers see themselves as
excessively controlling the methodology while subordinates think that they have liberty over
choosing how to perform their jobs, and do not see it as a problem. Although, failure to
subordinate self is not in strong agreement, but it is observed to be equally important for both
groups while again confirming the arguments presented by Bacon (2006) that failure of managers
at self-subordination is a major factor of micromanagement.
The results of Friedman test indicates that managers' group was quite consistent with respect to
their agreement on the five symptoms. This high level of consistency is considered as an anomaly
because in an ideal condition we expected to see a variation in both groups. Although, there was
no significant difference found between the five symptoms, still we could conclude, through
calculated mean ranks, that S2 and S3 were relatively in the leading position. Hence, S2 and S3 can
be categorized as relatively influential symptoms. Therefore, excessive reporting & updates and
control & manipulation of time can be classified as relatively important symptoms. This may be
due to the reason that in an engineering environment, tasks are usually scheduled in advance and
have to be performed in a timely manner to ensure smooth operation.
In the group of subordinates, we found a significant difference between the approaches towards
the five symptoms. This helped us in creating a clearer picture of the efficacy of the five
symptoms. Also, we observed comprehensive differentiation between the opinions through the
mean ranks. S2 and S1 were observed to be on high and low extremes of agreement within the
group respectively. While the remaining three symptoms were in between these extremities.
From this result, we can conclude that engineering managers are more likely to follow-up their
subordinates through reports and updates rather than prescribing methodology at the beginning of
the task. However, this may be a discreet method used by engineering managers to observe how
the job is being performed.
Through Mann-Whitney U test, we found some disparity between the two groups. In an ideal
condition, all the opinions across the groups should have been consistent. The inconsistency for
S1 and S3 across the two groups can be counted as a discrepancy. This could be due to the reason

41
that the responses of the two groups are not uniformly distributed across different cultures. The
inconsistency in S1 and S3 is also evident from the distribution of means as discussed earlier. On
the other hand, consistency in three out of five symptoms suggests that the two groups mainly
agree with each other. Additionally, for S2, S4 and S5 the observation of consistency, on relatively
high agreement, shows that the existence of these symptoms is acknowledged by both groups.
When we compared ten different pairs of symptoms within each group using the Wilcoxon
Signed Rank test, the results support the outcome of the Friedman test. In the group of managers,
only three out of the ten pairs exhibited significant differences. As the majority of the pairs had
insignificant differences, we can say that the consistency within the managers' group is high. This
was also observed in the results of the Friedman test. On the other hand, in the group of
subordinates, six out of the ten pairs had significant differences. Thus, the majority of the pairs
had significant differences that also substantiate the results of Friedman test. Additionally, using
these tests we formed inequality relations for each group. This helps us understand the efficacy of
the five symptoms in both groups.
As evident from the results of the applied tests, we observe a pattern of differences in the two
groups on the five symptoms. For each symptom, the group of managers has more agreement rate
relative to the subordinates' group. Since, the micromanaging behaviour is a trait of managers,
and they are in a better position to assess the underlying problem. Thus, giving them an edge of
better understanding of the problem. Additionally, managers play dual roles of manager and
subordinate, which enables them to analyse the other side of the story too. It is also possible that
after entering into a managerial role they realize the actual intensity of the problem because of the
increased responsibilities.

42
5 Conclusions
In this last chapter, we provide a summary of our most important findings and contributions. We
will outline our findings and discuss our contribution to theoretical knowledge and practical
application. Furthermore, we reflect on our research process, discuss limitations and present
suggestions for further research.
5.1 Major Contributions
We defined four major objectives in Aims and Objectives, which also comprise our major
contributions to the field of engineering management. Firstly, we reviewed the symptoms and
causes of micromanagement in previous literature. We then examined these symptoms based on
the responses of 77 respondents working in the engineering environment through a carefully
designed quantitative survey. Subsequently, we conducted statistical analysis to identify the
important symptoms of micromanagement in an engineering environment, and determine the
efficacy of the five symptoms in an engineering environment. Through our exploratory research,
we consolidated previous research by providing a better understanding of micromanagement.
5.1.1 Review of Symptoms and Causes of Micromanagement
The previous literature identified the need of managerial skills for employees in a managerial role
and the reason why it is so important to acquire proper managerial skills for managing people.
Particularly, we tried to highlight the reason why engineers lack these soft skills and how they
acquire the practice of the managerial traits. This whole background forms the basis of our
research. For the identification of the micromanagement, we presented five symptoms of
micromanagement as highlighted by Chambers (2009). The five symptoms include: excessive
control over methodology, excessive reporting and checks, control and manipulation of time,
failure to subordinate self and excessive approval requirement.
43
5.1.2 Examine the Symptoms of Micromanagement
We designed and conducted a quantitative survey to study the attitude of managers and
subordinates towards micromanaging behaviour in the engineering environment. We described
our principles and process of the survey design and data collection. We then performed statistical
analysis, including Friedman test, Mann-Whitney test and Wilcoxon Signed Ranks test, to
interpret the data we collected. We presented the reasons why we choose these three tests and
explained the mechanism of each test. All the test results are showcased in tables with thorough
analysis and interpretation of results.
5.1.3 Identify Difference of Opinions
In the light of the results of statistical tests, we found that the opinion of managers and
subordinates regarding micromanagement is marginally different. Although, both groups agree
with three out five micromanagement symptoms, they rank these symptoms differently.
The consistency of responses within each group was verified through Friedman test. In the group
of managers, the responses were found to be greatly consistent with respect to their agreement
with the five symptoms. Thus, we were unable to identify any significant difference between
them. However, by examining the mean ranks of each symptom, we observed that S2 and S3 were
deemed relatively influential. As a result, we can conclude that the existence of excessive
reporting and updates, and control and manipulation of time is maintained by managers. On the
contrary, in the group of subordinates, we found variations in the opinions towards the five
symptoms. This was also reinforced by the differences between the associated mean ranks of the
five symptoms. The significance of S2 and S1 were observed to be on upper and lower end within
the group respectively, with S3, S4 and S5 in between the extremities. Consequently, from
subordinates' perspective, engineering managers are more insistent on regular reports and updates
to stay abreast of the happenings while avoiding to pass on directions at the initial phase of the
task.
We also examined the consistency across the two groups for the five symptoms in our statistical
analysis. Agreement on three out of five symptoms indicates their shared understanding of the
micromanagement. However some irregularities were also observed. There is inconsistency for
the two symptoms, S1 and S3, across the two groups. This inconsistency was also observed in the
distribution of means.

44
5.1.4 Comparison between Five Symptoms
An inequality relation between the five symptoms was formed based on agreement rate for both
groups separately. We observed that the symptom, excessive reporting and updates, is more
influential in an engineering environment. Both groups agree that they experienced a high
requirement of reports and updates. Especially, more managers agree with the statement that they
require excessive reports and updates from their subordinates. This is in line with the arguments
presented by White (2010) and Hirsch et al. (1958). The second most influential symptom is the
manager's failure to subordinate self. While the managers mainly regard themselves as the most
important part of the team, their subordinates also concur with it. This provides the manager with
unusual authority and power over all the affairs of the team and reinforce manager's failure to
self-subordination (Bacon, 2006).
Moreover, we found that control and manipulation of time is the third most influential symptom.
Although, the agreement with this statement was not consistent across the two groups, still there
is a relatively high agreement in both groups. Especially, managers mostly perceive themselves
as scheduling tasks for their subordinates. On the fourth place is the symptom, the excessive need
for approvals, which is deemed as slightly important by both groups. The agreement between the
groups is greatly consistent. This means that this factor might not be a major contributor of
micromanaging behaviour. Lastly, the symptom, excessive control over methodology, was
observed to be rejected by the group of subordinates. On the other hand, managers' group is in
relatively high agreement with this symptom. In the light of this dissimilar opinion, we infer that
it is the least important of the five symptoms.
5.2 Practical Implications
Through this study, valuable insight into the phenomenon of the micromanaging behaviour of
engineering managers can been gained. This study not only benefits the research in the area of
engineering management but also provides the practical application for engineering firms.
However, for a more generalized application further research in collaboration with multinational
companies is suggested.
Since micromanagement behaviours are prevalent in the engineering environment, it is essential
to inform managers as well as subordinates, who might experience micromanagement, of this
issue. With the awareness of micromanagement, every employee in the organization can
participate in the process of dealing with micromanagement. Additionally, engineering firms
could devise and conduct similar survey inside the firms. This will help them depict a broader
picture of the existence of micromanagement. With feedbacks from both managers and
subordinates, firms can apply specific measures in line with their own situation.

45
Engineering managers could identify the micromanaging behaviours in themselves according to
the analysis of symptoms we present in this thesis. With the awareness of the pros and cons of
micromanagement, engineering managers could be motivated to make a change and perform
better in their managerial role. As a good role-model, engineering managers can nurture their
subordinates for a managerial role in the future. Besides, subordinates can also benefit from this
study. They are provided with a new managerial perspective on routine tasks. This helps them
better understand and learn the management skills and then perform better as member of their
team.
5.3 Future Research
To generalize our research finding, we include diverse engineering companies into the sample.
However, we do not take into account the potential effect of company's other characteristics, for
example, company size or managers' management style. Future research could include more
engineering companies into the study and classify them into more detailed categories. By
comparing data from companies with the same or different characteristics, researchers might
identify the effects of various characteristics of companies on the management style.
In this thesis, the respondents were mainly based in three countries, China, Pakistan and Sweden,
and thus, we can generalize the findings to these cultures and regions only. It is, however,
possible that different national cultures have a significant influence on management styles. Future
researchers could expand the sample size to include companies from more countries so that the
effect of national culture could be thoroughly examined at a larger scale. One feasible way is to
collaborate with multinational companies, which operate in many countries and might experience
concerned challenges in managing relationship between headquarter and branches. With the
assistance from these firms, it is easier to distribute the survey on a large scale and can guarantee
cooperation from employees also.

46
References
Allen, E., & Seaman, C. A. (2007). Likert Scales and Data Analyses. Quality Progress, vol. 40,
pp. 64-65.
Allen, T. J., & Katz, R. (1995). The project‐ oriented engineer: a dilemma for human resource
management. R&D Management, vol. 25, no. 2, pp. 129-140.
Alvesson, M., & Sköldberg, K. (2009). Reflexive methodology: New vistas for qualitative
research, 2nd edn. London: Sage.
Alvesson, M. & Sveningsson, S. (2003). Good visions, bad micro-management and ugly
ambiguity: contradictions of (non-) leadership in a knowledge-intensive organization.
Organization Studies, vol. 24, no.6, pp. 961-988.
Aronberg, R. (1985). Motivating and managing engineers. Journal of Professional Issues in
Engineering, vol. 111, no. 1, pp. 33-38.
Aucoin, B. M. (2002). From engineer to manager: Mastering the transition, Norwood, MA:
Artech House.
Bacon, T. R. (2006). The Balanced Leader. Leadership Excellence, vol. 23, no. 4, pp. 17-18.
Badger, W., Sullivan, K., Wiezel, A., & Bopp, P. (2009). Profiling the leadership of project
managers, International Journal of Construction Education and Research, vol. 5, no. 2, pp.
121-146,
Baggaley, A., & Hull, A. (1983). The effect of nonlinear transformations on a Likert scale.
Evaluation & the Health Professions, vol. 6, pp. 483-491.
Bandura, A. (1986). Social foundations of thought and action: a social cognitive theory,
Englewood Cliffs, N.J. : Prentice-Hall, cop.
Bandura, A., & Cervone, D. (1983). Self-evaluative and self-efficacy mechanisms governing the
motivational effects of goal systems. Journal of personality and social psychology, vol. 45,
no. 5, pp. 1017.
Barrick, M. R., & Mount, M. K. (1991). The big five personality dimensions and job
performance: a meta-analysis. Personnel psychology, vol. 44, no.1, pp. 1-26.
Blankenship, D. (2009). Applied research and evaluation methods in recreation. U.S.A. : Human
Kinetics.

47
Boone, H. N., & Boone, D. A. (2012). Analyzing likert data. Journal of Extension, vol. 50, no. 2,
pp. 1-5.
Boyce, C., & Neale, P. (2006). Conducting in-depth interviews: A guide for designing and
conducting in-depth interviews for evaluation input. Watertown, MA: Pathfinder International.
Brown, J. D. (2011). Likert items and scales of measurement. Shiken: JALT Testing & Evaluation
SIG Newsletter, vol. 15, no. 1, pp. 10-14.
Bryman, A., & Bell, E. (2011). Business research methods, 3rd edn. Oxford: Oxford University
Press.
Chambers, H. E. (2004). My Way or the Highway: The Micromanagement Survival Guide. San
Francisco: Berrett-Koehler.
Crouch, A. & Yetton, P. (1988). Manager-subordinate dyads: Relationships among task and
social contact, manager friendliness and subordinate performance in management groups.
Organizational Behavior and Human Decision Processes, vol. 41, no. 1, pp. 65-82.
Dorneyi, Z. (2003). Questionnaires in second language research, Mahwah, New Jersey, USA:
Lawrence Erlbaum Associates, Inc.
DeMaio, S. (2009). Are you micromanaging yourself. Available online at:
https://hbr.org/2009/04/are-you-micromanaging-yourself. [Accessed on 29 April 2015].
Easterby-Smith, M., Thorpe, R. & Jackson, P. (2012). Management Research, Thousand Oaks,
Calif.: SAGE Publications.
El-Sabaa, S. (2001). The skills and career path of an effective project manager. International
journal of project management, vol. 19, no. 1, pp. 1-7.
Evans, W. J., & Bredin, C. W. (1987). Transition from engineering to management. Journal of
Management in Engineering, vol. 3, no. 3, pp. 220-231.
Field, A. (2000). Discovering statistics using SPSS for Windows: Advanced techniques for
beginners, London : SAGE.
Gaito, J. (1980). Measurement scales and statistics: Resurgence of an old misconception.
Psychological Bulletin, vol. 87, no. 3, pp. 564-567
Giegold, W. C. (1981). Leadership — The essential of engineering management. Engineering
Management International, vol. 1, no. 1, pp. 49-56.
48
Goleman, D. (2000). Leadership that gets results. Harvard business review, vol. 78, no. 2, pp. 78-
93.
Gupta, U. G., & Braunstein, D. (2001). Technical wizards, lousy managers: avoiding disasters in
promoting and hiring IT management. Information Strategy: The Executive's Journal, vol. 17,
no. 2, pp. 16-21.
Hansson, J., Backlund, F., & Lycke, L. (2003). Managing commitment: increasing the odds for
successful implementation of TQM, TPM or RCM. International Journal of Quality &
Reliability Management, vol. 20, no. 9, pp. 993-1008
Hernson, D., & Krauss, T. (1987). Perspectives on Managing Engineers. Journal of Management
in Engineering, vol. 2, pp. 163-170.
Hoelscher, H. E. (1987). Managing in an unmanageable world. Engineering Management
International, vol. 4, no. 2, pp. 151-154.
Hirsch, I., Milwitt, W., & Oakes, W. J. (1958). Increasing the productivity of scientists. Harvard
Business Review, vol. 36, no. 2, pp. 66-76.
Ivancevich, J. M., & McMahon, J. T. (1982). The effects of goal setting, external feedback, and
self-generated feedback on outcome variables: A field experiment. Academy of Management
Journal, vol. 25, no. 2, pp. 359-372.
Jamieson, S. (2004). Likert scales: how to (ab) use them. Medical education, vol. 38, no. 12, pp.
1217-1218.
Kaplan, R. S., & Norton, D. P. (1998). Putting the balanced scorecard to work. The Economic
Impact of Knowledge, pp. 315-324.
Kenny, G. K., & Downey, L. A. (1987). Power, politics, and process of decision making. Journal
of Management in Engineering, vol. 3, no. 4, pp. 297-302.
Kenny, G. K., & Wilson, D. C. (1984). The interdepartmental influence of managers: individual
and sub-unit perspectives. Journal of Management Studies, vol. 21, no. 4, pp. 409-425.
Khatri, N. (2009). Consequences of power distance orientation in organisations. Vision: The
Journal of Business Perspective, vol. 13, no. 1, pp. 1-9.
Kichuk, S. L., & Wiesner, W. H. (1997). The big five personality factors and team performance:
implications for selecting successful product design teams. Journal of Engineering and
Technology Management, vol. 14, no. 3, pp. 195-221.
Kish, L. (1965). Survey sampling. New York: John Wiley and Sons, Inc.

49
Kosiba, R. J. (1987). Syntonic Management Approaches in Large Engineering Operations.
Journal of Management in Engineering, vol. 3, no. 2, pp. 138-149.
Kraska-Miller, M. (2013). Nonparametric Statistics for Social and Behavioural Sciences. U.S.A.:
CRC Press.
Kumar, S., & Hsiao, J. K. (2007). Engineers learn “soft skills the hard way”: Planting a seed of
leadership in engineering classes. Leadership and Management in Engineering, vol. 7, no. 1,
pp. 18-23.
Leach, R. A. (2004). The chiropractic theories: a textbook of scientific research. Philadelphia, PA:
Lippincott, Williams.
Livingston, J. S. (2003). Pygmalion in management. Harvard business review, vol. 81, no.1, pp.
97-106.
Liker, J. K., & Hancock, W. M. (1986). Organizational systems barriers to engineering
effectiveness. IEEE Transactions on Engineering Management, vol. EM-33, no. 2, pp. 82-91.
Luthans, F., & Peterson, S. J. (2002). Employee engagement and manager self-efficacy. Journal
of management development, vol. 21, no. 5, pp. 376-387.
Malhotra, N.K. (2010). Marketing Research: an applied orientation, 6th edn, Upper Saddle River,
N.J.; London: Pearson Education
Maloney, W. F., & Federle, M. O. (1991). Organizational culture and management. Journal of
Management in Engineering, vol. 7, no. 1, pp. 43-58.
Maurer, J., & Pierce, H. R. (1998). A comparison of Likert scale and traditional measures of self-
efficacy. Journal of Applied Psychology, vol. 83, pp. 324-329.
Murphy, J. R. (1989). Management Education as a Strategic Weapon. Training, vol. 26, no.2, pp.
47-54.
Nanna, M. J., & Sawilowsky, S. S. (1998). Analysis of Likert scale data in disability and medical
rehabilitation research. Psychological Methods, vol. 3, no. 1, pp. 55
Ostroff, C. (1992). The relationship between satisfaction, attitudes, and performance: An
organizational level analysis. Journal of applied psychology, vol. 77, no. 6, pp. 963.
Paton, R. A., & Wagner, R. (2014). Management education makes a difference: enhancing
German engineering performance. Long Range Planning, vol. 47, no. 5, pp. 277-298.

50
Petroni, A. (2000). Career route preferences of design engineers: an empirical research. Career
Development International, vol. 5, no. 6, pp. 288-294
Petty, M. M., McGee, G. W., & Cavender, J. W. (1984). A meta-analysis of the relationships
between individual job satisfaction and individual performance. Academy of management
Review, vol. 9, no. 4, pp. 712-721.
Pfeffer, J. (1998). The human equation: Building profits by putting people first. Boston: Harvard
Business Press.
Pixton, P., Gibson, P., & Nickolaisen, N. (2014). The Agile Culture: Leading Through Trust and
Ownership. Addison-Wesley Professional.
Porterfield, R. L. (2003). The perils of micromanagement. Contract Management, February, pp.
20-23. Available Online: https://www.ncmahq.org/files/Articles/5531D_micromanage.pdf
[Accessed 24 May 2015]
Presutti, M. (2006). Is micromanagement killing your staff? The administrator who "has to do it
all" can end up undoing everything. Nursing Homes: Long Term Care Management, vol. 55,
no. 2, pp. 34.
Rosen, B, & Jerdee, T, (1977). Influence of Subordinate Characteristics on Trust and Use of
Participative Decision Strategies in a Management Simulation. Journal of Applied
Psychology, vol. 62, no. 5, pp. 628-631
Sahay, B. S., Saxena, K. B. C., & Kumar, A. (2000). World-class Manufacturing: A Strategic
Perspective. India: Macmillan
Schein, E. H. (1990). Organizational culture. American Psychologist, vol. 45, no. 2, pp. 109-119.
Sowers, T. S. (2011). Superior Control and Subordinate Autonomy in Conflict: Mid-level officers
of the US and British armies in Iraq (2003-2008). PhD thesis, The London School of
Economics and Political Science (LSE), Available Online: http://etheses.lse.ac.uk/155/
[Accessed 24 May 2015]
Souder, W. E. (1983). Planning a career path from engineering to management. Engineering
Management International, vol. 1, no. 4, pp. 249-258.
Sabourin, V. (2012). Through the Lenses of Strategy Execution: Obstacles in Engineering
Management. Leadership and Management in Engineering, vol. 12, no. 2, pp. 53-59.
Staw, B. M., Sutton, R. I., & Pelled, L. H. (1994). Employee positive emotion and favourable
outcomes at the workplace. Organization Science, vol. 5, no. 1, pp. 51-71.

51
Stajkovic, A. D., & Luthans, F. (1998). Self-efficacy and work-related performance: A meta-
analysis. Psychological bulletin, vol. 124, no. 2, pp. 240.
Sterrett, E. A. (2000). The manager's pocket guide to emotional intelligence: From management
to leadership. Amherst, MA: HRD Press.
Stevens, J. P. (2012). Applied multivariate statistics for the social sciences, 5th edn. London:
Routledge.
Summers, M., Davis, B., & Tomovic, C. (2004). When engineering and technology skills are not
enough: Engineering leaders out of their element, the CIEC Conference Proceedings.
Available Online:
http://www.researchgate.net/profile/Michele_Summers/publication/237291540_WHEN_ENG
INEERING_AND_TECHNOLOGY_SKILLS_ARE_NOT_ENOUGH_ENGINEERING_LE
ADERS_OUT_OF_THEIR_ELEMENT/links/00b4952d5e511ec0ca000000.pdf [Accessed 24
May 2015]
Tett, R. P., Jackson, D. N., & Rothstein, M. (1991). Personality measures as predictors of job
performance: a meta-analytic review. Personnel psychology, vol. 44, no.4, pp. 703-742.
Thilmany, J. (2004). A certifiable manager. Mechanical Engineering, vol. 126, no. 3, pp. 12-13.
Treviño, L. K., & Brown, M. E. (2005). The role of leaders in influencing unethical behaviour in
the workplace. Managing organizational deviance, pp. 69-87.
Vickers, A., (1999). Comparison of an ordinal and a continuous outcome measure of muscle
soreness. International Journal of Technology Assessment in Health Care, vol. 15, pp. 709-
716.
White, Richard D. (2010). The micromanagement disease: Symptoms, diagnosis, and cure.
Public Personnel Management, vol. 39, no. 1, pp. 71-76.
Wright, R. R. (1999). Effect of Micro Management on Job Satisfaction & Productivity: A Case
Study. Vision: The Journal of Business Perspective, vol. 3, no. 1, pp. 51-61.
Wright, R. F. (2000). Strategies for avoiding the micro management trap. Management Decision,
vol. 38, no. 5, pp. 362-364.

52
Appendix A
Survey Questionnaire

53

54
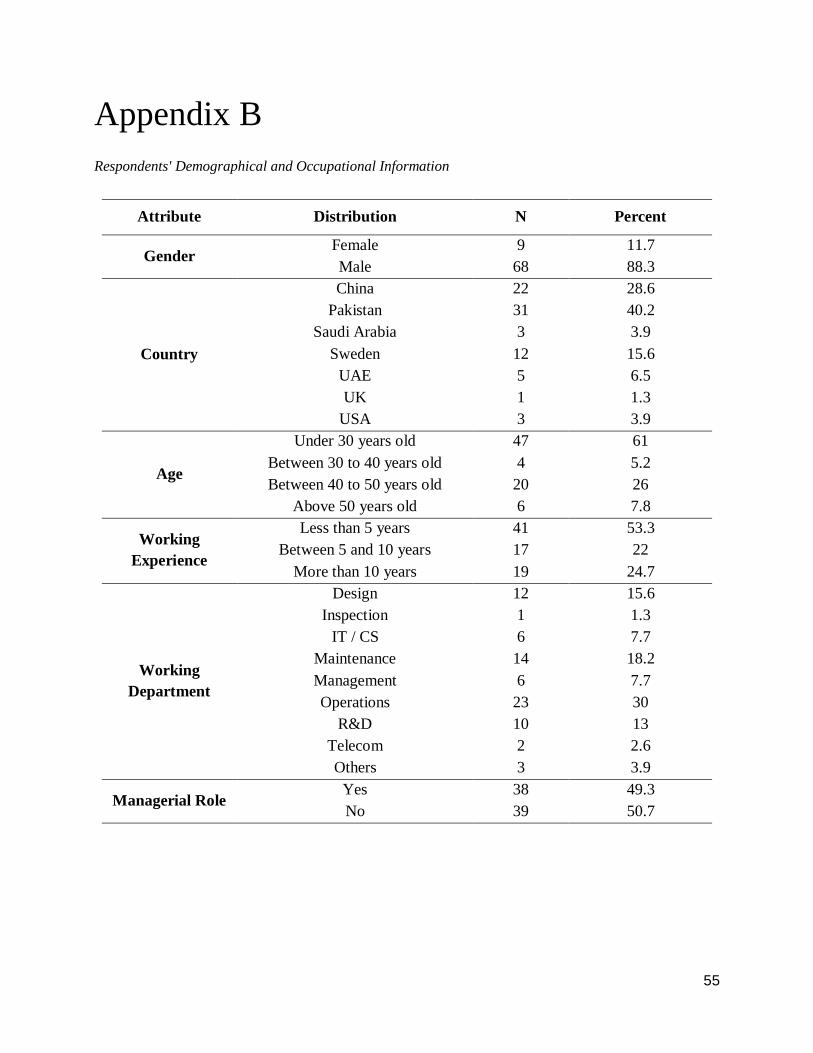
55
Appendix B
Respondents' Demographical and Occupational Information
Attribute Distribution N Percent
Gender Female 9 11.7
Male 68 88.3
Country
China 22 28.6
Pakistan 31 40.2
Saudi Arabia 3 3.9
Sweden 12 15.6
UAE 5 6.5
UK 1 1.3
USA 3 3.9
Age
Under 30 years old 47 61
Between 30 to 40 years old 4 5.2
Between 40 to 50 years old 20 26
Above 50 years old 6 7.8
Working
Experience
Less than 5 years 41 53.3
Between 5 and 10 years 17 22
More than 10 years 19 24.7
Working
Department
Design 12 15.6
Inspection 1 1.3
IT / CS 6 7.7
Maintenance 14 18.2
Management 6 7.7
Operations 23 30
R&D 10 13
Telecom 2 2.6
Others 3 3.9
Managerial Role Yes 38 49.3
No 39 50.7
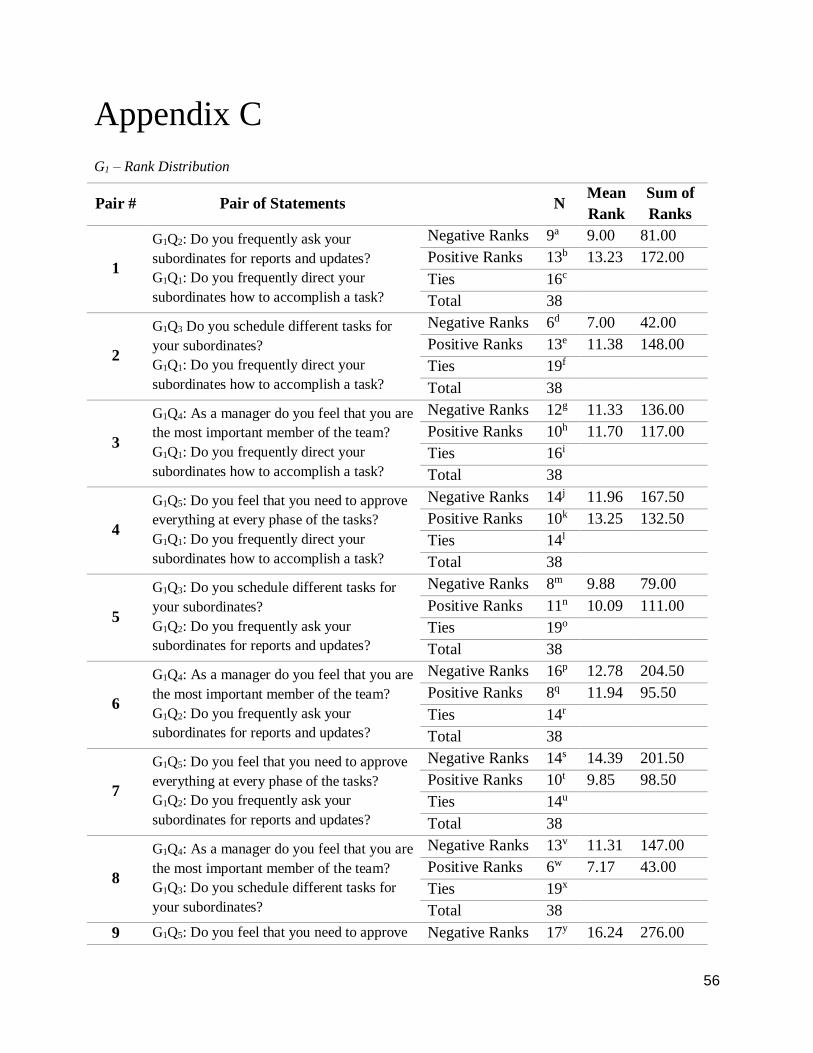
56
Appendix C
G1 – Rank Distribution
Pair # Pair of Statements N Mean
Rank
Sum of
Ranks
1
G1Q2: Do you frequently ask your
subordinates for reports and updates?
G1Q1: Do you frequently direct your
subordinates how to accomplish a task?
Negative Ranks 9a 9.00 81.00
Positive Ranks 13b 13.23 172.00
Ties 16c
Total 38
2
G1Q3 Do you schedule different tasks for
your subordinates?
G1Q1: Do you frequently direct your
subordinates how to accomplish a task?
Negative Ranks 6d 7.00 42.00
Positive Ranks 13e 11.38 148.00
Ties 19f
Total 38
3
G1Q4: As a manager do you feel that you are
the most important member of the team?
G1Q1: Do you frequently direct your
subordinates how to accomplish a task?
Negative Ranks 12g 11.33 136.00
Positive Ranks 10h 11.70 117.00
Ties 16i
Total 38
4
G1Q5: Do you feel that you need to approve
everything at every phase of the tasks?
G1Q1: Do you frequently direct your
subordinates how to accomplish a task?
Negative Ranks 14j 11.96 167.50
Positive Ranks 10k 13.25 132.50
Ties 14l
Total 38
5
G1Q3: Do you schedule different tasks for
your subordinates?
G1Q2: Do you frequently ask your
subordinates for reports and updates?
Negative Ranks 8m 9.88 79.00
Positive Ranks 11n 10.09 111.00
Ties 19o
Total 38
6
G1Q4: As a manager do you feel that you are
the most important member of the team?
G1Q2: Do you frequently ask your
subordinates for reports and updates?
Negative Ranks 16p 12.78 204.50
Positive Ranks 8q 11.94 95.50
Ties 14r
Total 38
7
G1Q5: Do you feel that you need to approve
everything at every phase of the tasks?
G1Q2: Do you frequently ask your
subordinates for reports and updates?
Negative Ranks 14s 14.39 201.50
Positive Ranks 10t 9.85 98.50
Ties 14u
Total 38
8
G1Q4: As a manager do you feel that you are
the most important member of the team?
G1Q3: Do you schedule different tasks for
your subordinates?
Negative Ranks 13v 11.31 147.00
Positive Ranks 6w 7.17 43.00
Ties 19x
Total 38
9 G1Q5: Do you feel that you need to approve Negative Ranks 17y 16.24 276.00

57
everything at every phase of the tasks?
G1Q3: Do you schedule different tasks for
your subordinates?
Positive Ranks 10z 10.20 102.00
Ties 11aa
Total 38
10
G1Q5: Do you feel that you need to approve
everything at every phase of the tasks?
G1Q4: As a manager do you feel that you are
the most important member of the team?
Negative Ranks 11ab 13.95 153.50
Positive Ranks 13ac 11.27 146.50
Ties 14ad
Total 38
a. G1Q2 < G1Q1 b. G1Q2 > G1Q1 c. G1Q2 = G1Q1
d. G1Q3 < G1Q1 e. G1Q3 > G1Q1 f. G1Q3 = G1Q1
g. G1Q4 < G1Q1 h. G1Q4 > G1Q1 i. G1Q4 = G1Q1
j. G1Q5 < G1Q1 k. G1Q5 > G1Q1 l. G1Q5 = G1Q1
m. G1Q3 < G1Q2 n. G1Q3 > G1Q2 o. G1Q3 = G1Q2
p. G1Q4 < G1Q2 q. G1Q4 > G1Q2 r. G1Q4 = G1Q2
s. G1Q5 < G1Q2 t. G1Q5 > G1Q2 u. G1Q5 = G1Q2
v. G1Q4 < G1Q3 w. G1Q4 > G1Q3 x. G1Q4 = G1Q3
y. G1Q5 < G1Q3 z. G1Q5 > G1Q3 aa. G1Q5 = G1Q3
ab. G1Q5 < G1Q4 ac. G1Q5 > G1Q4 ad. G1Q5 = G1Q4
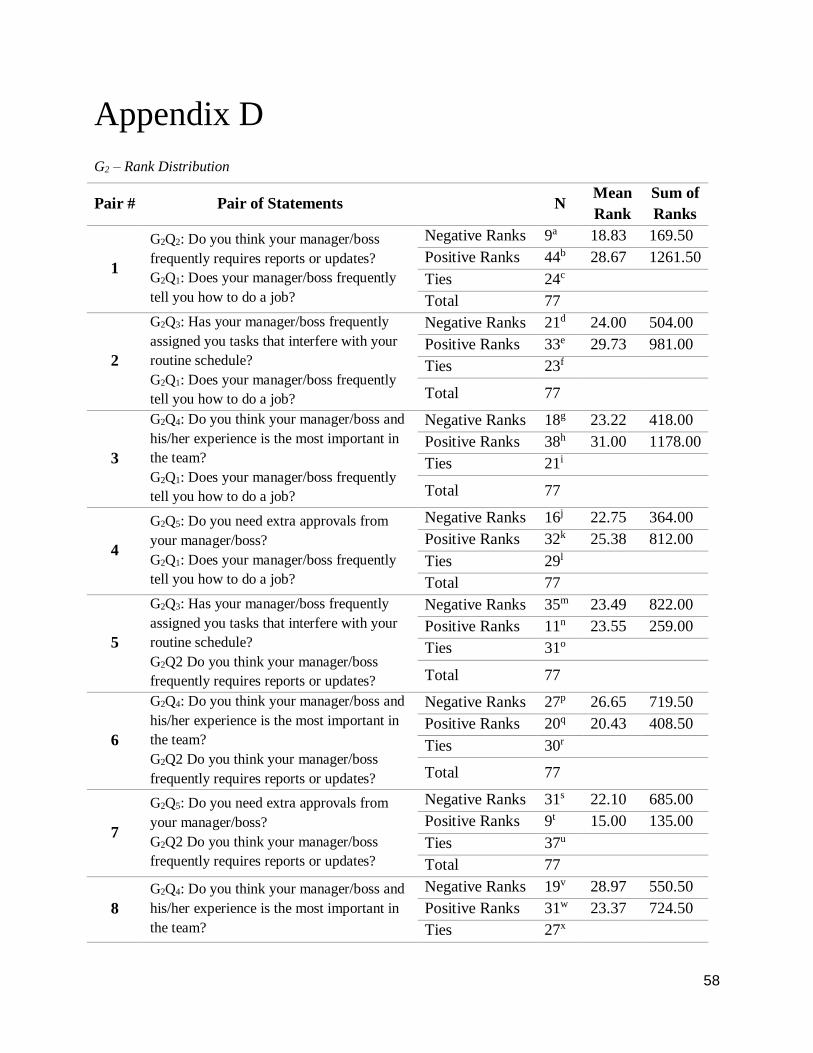
58
Appendix D
G2 – Rank Distribution
Pair # Pair of Statements N Mean
Rank
Sum of
Ranks
1
G2Q2: Do you think your manager/boss
frequently requires reports or updates?
G2Q1: Does your manager/boss frequently
tell you how to do a job?
Negative Ranks 9a 18.83 169.50
Positive Ranks 44b 28.67 1261.50
Ties 24c
Total 77
2
G2Q3: Has your manager/boss frequently
assigned you tasks that interfere with your
routine schedule?
G2Q1: Does your manager/boss frequently
tell you how to do a job?
Negative Ranks 21d 24.00 504.00
Positive Ranks 33e 29.73 981.00
Ties 23f
Total 77
3
G2Q4: Do you think your manager/boss and
his/her experience is the most important in
the team?
G2Q1: Does your manager/boss frequently
tell you how to do a job?
Negative Ranks 18g 23.22 418.00
Positive Ranks 38h 31.00 1178.00
Ties 21i
Total 77
4
G2Q5: Do you need extra approvals from
your manager/boss?
G2Q1: Does your manager/boss frequently
tell you how to do a job?
Negative Ranks 16j 22.75 364.00
Positive Ranks 32k 25.38 812.00
Ties 29l
Total 77
5
G2Q3: Has your manager/boss frequently
assigned you tasks that interfere with your
routine schedule?
G2Q2 Do you think your manager/boss
frequently requires reports or updates?
Negative Ranks 35m 23.49 822.00
Positive Ranks 11n 23.55 259.00
Ties 31o
Total 77
6
G2Q4: Do you think your manager/boss and
his/her experience is the most important in
the team?
G2Q2 Do you think your manager/boss
frequently requires reports or updates?
Negative Ranks 27p 26.65 719.50
Positive Ranks 20q 20.43 408.50
Ties 30r
Total 77
7
G2Q5: Do you need extra approvals from
your manager/boss?
G2Q2 Do you think your manager/boss
frequently requires reports or updates?
Negative Ranks 31s 22.10 685.00
Positive Ranks 9t 15.00 135.00
Ties 37u
Total 77
8
G2Q4: Do you think your manager/boss and
his/her experience is the most important in
the team?
Negative Ranks 19v 28.97 550.50
Positive Ranks 31w 23.37 724.50
Ties 27x

59
G2Q3: Has your manager/boss frequently
assigned you tasks that interfere with your
routine schedule?
Total 77
9
G2Q5: Do you need extra approvals from
your manager/boss?
G2Q3: Has your manager/boss frequently
assigned you tasks that interfere with your
routine schedule?
Negative Ranks 21y 21.26 446.50
Positive Ranks 20z 20.73 414.50
Ties 36aa
Total 77
10
G2Q5: Do you need extra approvals from
your manager/boss?
G2Q4: Do you think your manager/boss and
his/her experience is the most important in
the team?
Negative Ranks 36ab 26.90 968.50
Positive Ranks 20ac 31.38 627.50
Ties 21ad
Total 77
a. G2Q2 < G2Q1 b. G2Q2 > G2Q1 c. G2Q2 = G2Q1
d. G2Q3 < G2Q1 e. G2Q3 > G2Q1 f. G2Q3 = G2Q1
g. G2Q4 < G2Q1 h. G2Q4 > G2Q1 i. G2Q4 = G2Q1 j. G2Q5 < G2Q1 k. G2Q5 > G2Q1 l. G2Q5 = G2Q1
m.G2Q3 < G2Q2 n. G2Q3 > G2Q2 o. G2Q3 = G2Q2
p. G2Q4 < G2Q2 q. G2Q4 > G2Q2 r. G2Q4 = G2Q2
s. G2Q5 < G2Q2 t. G2Q5 > G2Q2 u. G2Q5 = G2Q2
v. G2Q4 < G2Q3 w. G2Q4 > G2Q3 x. G2Q4 = G2Q3
y. G2Q5 < G2Q3 z. G2Q5 > G2Q3 aa. G2Q5 = G2Q3
ab. G2Q5 < G2Q4 ac.G2Q5 > G2Q4 ad. G2Q5 = G2Q4