Embed Size (px)
Citation preview

MICROGRID PROTECTION
STUDENT LABORATORY Human-Machine Interface and SCADA Database
Nathan Martinez
Senior Project California Polytechnic State University: San Luis Obispo
Electrical Engineering June 13, 2018
Faculty Advisor: Dr. Taufik

i | P a g e
Abstract The electric utility system, a ubiquitous and fundamental component of modern life, has changed more in the
last 20 years than the last 100. With more homes and businesses installing distributed energy resources
(DERs) such as solar panels, battery storage, and other intermittent sources, massive changes need to take
place in the electric transmission and distribution systems. Engineers must develop a new skill set for a
modern utility industry. This project summarizes a component for a new laboratory class aimed at power
engineering students at Cal Poly which supports the laboratory through the creation of a human-machine
interface (HMI) and SCADA data concentrator. This HMI streamlines data-collection for laboratory
experiments, giving instructors more flexibility when designing labs as data collection procedures are
simplified, while the SCADA system serves as a platform to automate system processes in the microgrid,
enabling the continuation of this project, developing methodology to automate and control the microgrid
laboratory and create subsequent lab experiments on the control of the system.

ii | P a g e
Acknowledgements This project continues the work of the previous team: Kenan W Pretzer, M.S., Ian Hellman-Wylie, B.S., and
Joey Navarro, B.S. who produced the fundamental microgrid system design and protection schemes for fault
detection. Without their work, this project could not exist.
Cal Poly Professor Dr. Taufik advised this project and I’m very grateful for his encouragement and support,
both on this project, and for my development academically and professionally.
Eric Osborn, Matthew Guevara, Do Vo, Ramon Crespo, and Nicole Rexwinkel whose support and expertise
greatly assisted in the development of this project.
Schweitzer Engineering Laboratories who generously donated the relays required for this project, and for all
other projects, on the microgrid laboratory, and for their ongoing support for the Cal Poly EE department.

iii | P a g e
Table of Contents Abstract ....................................................................................................................................................... i
Acknowledgements ................................................................................................................................. ii
Chapter 1 : Introduction ......................................................................................................................... 1
Chapter 2 : Background ......................................................................................................................... 3
Chapter 3 : Design Requirements........................................................................................................ 5
Customer Needs Assessment .......................................................................................................... 5
Requirements and Specifications .................................................................................................... 5
Chapter 4 : Design ................................................................................................................................. 11
AcSELerator RTAC ............................................................................................................................ 11
AcSELerator Diagram Builder 64 ................................................................................................... 12
Flowchart .............................................................................................................................................. 13
Chapter 5 : Test Results ....................................................................................................................... 14
SCADA .................................................................................................................................................. 14
DNP SCADA Server ........................................................................................................................ 15
DNP Server Shared Map ................................................................................................................ 17
Tag Processor .................................................................................................................................. 18
HMI Diagram ........................................................................................................................................ 21
HMI ..................................................................................................................................................... 21
Breakers ............................................................................................................................................ 22
Annunciator Tiles .............................................................................................................................. 23
Image Control ................................................................................................................................... 24
Tags ................................................................................................................................................... 24
HMI Web Interface .............................................................................................................................. 25
Chapter 6 . Conclusion ......................................................................................................................... 26
References ............................................................................................................................................... 28
Appendex A: ABET Senior Project Analysis ............................................................................ 30
1. Summary of Functional Requirements ...................................................................................... 30
2. Primary Constraints ..................................................................................................................... 30
3. Economic ....................................................................................................................................... 31
4. If Manufactured on a Commercial Basis ................................................................................... 31
5. Environmental ............................................................................................................................... 32

iv | P a g e
6. Manufacturability .......................................................................................................................... 33
7. Sustainability ................................................................................................................................. 33
8. Ethical............................................................................................................................................. 34
9. Health and Safety ......................................................................................................................... 35
10. Social and Political ................................................................................................................... 35
11. Development ............................................................................................................................. 36
Appendex B: Timeline of Tasks and Milestones ..................................................................... 37
Appendex C: Bill of Materials ....................................................................................................... 38
Appendex D: SCADA Tag Map ..................................................................................................... 38
Appendex E: Microgrid Diagrams ............................................................................................... 45

v | P a g e
Table of Figures Figure 1-1: Bidirectional Network Single Line Diagram created by Kenan Pretzer and Team ......................... 2
Figure 3-1: Level 0 Block Diagram for Microgrid Human Machine Interface ................................................. 8
Figure 3-2. Level 1 Block Diagram for Microgrid Human Machine Interface ............................................... 10
Figure 4-1: Information flowchart for the Microgrid HMI ...................................................................................... 13
Figure 5-1: Selection of appropriate analog and binary data tags in IED meter tab ..................................................... 15
Figure 5-2: Selection of a DNP3 protocol device to act as the SCADA master .......................................................... 16
Figure 5-3: Configuration of the DNP SCADA device as a server using serial communication ..................................... 16
Figure 5-4: Selecting a DNP Server Shared Map to map IED data with SCADA database ...................................... 17
Figure 5-5: Linking DNP SCADA device to the server share map ........................................................................ 18
Figure 5-6: Tag Processor showing reverse placement of Binary Output tags for control commands from the HMI ............... 19
Figure 5-7: Relay Settings for the SEL-421 to signal Circuit Breaker Trips ............................................................. 20
Figure 5-8: Assigning Global Variable to the Tag Name for the SEL-421 Breaker Control ....................................... 22
Figure 5-9: Assigning Breaker Bits to the Control Outputs for the HMI representation of the Circuit Breaker ................. 23
Figure 5-10: Assigning Diagrams to the Annunciator Tiles ................................................................................... 24
Figure B-1: Gnat Chart for the development of the HMI and SCADA System ......................................................... 37
Figure E-1: Microgrid System Overview Page ....................................................................................................... 45
Figure E-2: SEL-710 Relay Page ..................................................................................................................... 46
Figure E-3: SEL-587 Relay Page ..................................................................................................................... 46
Figure E-4: SEL-700G Relay Page .................................................................................................................. 47
Figure E-5: SEL-421 Relay Page ..................................................................................................................... 47
Figure E-6: SEL-387E Relay Page .................................................................................................................. 48
Figure E-7: SEL-311L Relay Page .................................................................................................................. 49
Table of Tables Table 3-1: Microgrid HMI Specifications ....................................................................................................... 6
Table 3-2: Human-Machine Interface Functional Requirements ..................................................................... 8
Table D-1: SCADA tag processor mapping .................................................................................................. 38

1 | P a g e
Chapter 1 : Introduction
The electric grid revolutionized the world in a way few engineering feats can compare. The National
Academy of Engineers considers the grid the greatest engineering achievement of the 20th century [1]. The
basic technology used for power transmission and distribution has largely remains unchanged since the days
of Tesla, but improvements in power electronics, such as solid-state relays and grid-tied inverters, during the
last several decades have triggered a paradigm shift in power distribution modeling. Improving technology
allows small businesses and households to install low-power distributed energy resources (DER),
transforming the electrical grid from a radially distributed system into a bidirectional system. A radial
distribution scheme has centralized plants that generate all power in the system, and that power flows
outwardly from generator to consumers in one direction [2], while the bidirectional distribution scheme has
more localized generation, which has the potential to alter the power flow direction frequently and
unpredictably. The rise of DERs shows no signs of slowing, and the radial power system designed and built
over the last century cannot effectively handle the increasing occurrences of bidirectional power flow.
Power utility companies face a unique disadvantage with regards to innovation. As a natural
monopoly, many of the financial decisions the utility makes must obtain approval from either a governing
body, for publicly owned utilities such as the Los Angeles Department of Water and Power, or through a
Public Utilities Commission, for investor-owned utilities like Pacific Gas and Electric. The bureaucracy can
make innovation difficult, and often universities must pick up the slack in developing innovative technologies.
Many universities have a long history of designing their own microgrid on campus, such as the UC San Diego
and UC Berkeley [3].
To address issues with radially designed systems, improve the education of power engineering
students, remain competitive amongst prestigious universities, and continue driving innovation in power
systems, the Electrical Engineering Department at Cal Poly San Luis Obispo commissioned the construction

2 | P a g e
of a new laboratory scale microgrid. This project converts an existing machines laboratory into a lab which
compliments the EE 518 Power System Protection seminar and improves the lab curriculum for EE 444
Power Systems Laboratory [4]. Construction of the lab began in the 2016-2017 academic year with the work
of Kenan Pretzer and his team, Joey Navarro and Ian Hellman-Wylie. The previous microgrid team
established the foundational equipment for the laboratory, developed the bi-directional circuits seen in Error! R
eference source not found., and established the initial protection schemes for that system [5].
FIGURE 1-1: BIDIRECTIONAL NETWORK SINGLE LINE DIAGRAM CREATED BY KENAN PRETZER AND TEAM
The inspiration for this project came from future work suggestions written in Kenan Pretzer’s
Master’s thesis. This project focuses on the creation of a Human-Machine Interface (HMI) which improves
the laboratory experience for students by streamlining data collection process and data-flow, and also
providing students with a simple method to export data from fault studies. The HMI gives professors more
flexibility when designing experiments, and gives students an opportunity to perform more complete analysis
in the three-hour time constraints due to simplified data acquisition which reduces collection time. This
project also takes advantage of the Real-Time Automated Controller (RTAC) made by Schweitzer
Engineering Laboratories, Inc. (SEL). The RTAC can also act as a logic engine, which lays the foundation for
the follow up task to this project: the automation of system functions within the microgrid, including real-
time power factor correction.

3 | P a g e
Chapter 2 : Background
This project is a supplemental project to the Protective Relaying Student Laboratory thesis written
and constructed by Kenan Pretzer [6] as well as the Microgrid Protection Student Laboratory senior project
by Ian Hellman-Wylie and Joey Navarro [7]. In those projects, the microgrid team developed and constructed
the initial power system to simulate a microgrid power system on a laboratory scale, referred to as the
Microgrid Protective Student Laboratory (MPSL). The MPSL employs modern microprocessor based relays
donated by Schweitzer Engineering Laboratories, Inc. (SEL) to protect the microgrid system, coordinating
different protection scheme methods, such as differential protection provided by the SEL-387E relays,
induction motor protection using the SEL-710, overcurrent protection with the SEL-587 and Mho Distance
protection using the SEL-311L. In the current version of the MPSL, all of the relays can be accessed by the
engineer as the relays all route through an SEL-2032 Communications Processer, and different relay settings
can be changed and sent to the individual relays through a terminal connected to the SEL-2032. This
arrangement is functional; however, there are many improvements that can be made with the introduction of
the SEL-3530 Real Time Automation Controller (RTAC), which was introduced into the final stages of
Kenan’s thesis.
This project will address improvements that can be made to the MPSL though the use of the RTAC.
The RTAC has all of the functionalities of the SEL-2032 plus more functionalities, which can be
implemented to evaluate logical conditions to automate functions on the MPSL, and also provide a platform
for students to investigate and understand the system more intuitively. This project has two major aims, the
first is to develop a supervisory control and data acquisition (SCADA) system. A SCADA networking system
acts both as a network server and as a client, accepting system performance data from each of the relays. The
SCADA system then can take that information, process it, and serve the data to different clients, such as the
engineering terminal letting operators see real time system conditions. The SCADA also sends out control
signals to improve performance on the grid without the need of operator intervention.

4 | P a g e
The second aim is the development of a human-machine interface (HMI). The HMI will use
information received from SCADA to give the system operator insight into the system, allow the operator to
remotely control different relays, open and close breakers, and provide the operator with system conditions,
such as voltages and currents, at each of the busses on the MPSL from the engineering terminal. The HMI
will improve student understanding of the system and let students quickly see how a change in one part of the
system can lead to massive changes throughout the system. This will also improve student safety as it will
minimize the amount of time students need to be exposed to distribution level voltages as they won’t need to
operate the relays through the front panel.
The overall goal of this senior project is to improve students’ experience when interacting with the
MPSL, and give students a higher-level understanding of how different actions affect the system as a whole.
Addition, the development of the SCADA system will also be conducted to allow future projects to
implement automatic actions to improve system performance, such as automatically closing in capacitor
banks at the induction load during low voltage conditions or to close in a generator when islanding the
microgrid due to problems on utility side of the microgrid.

5 | P a g e
Chapter 3 : Design Requirements
Customer Needs Assessment
This project aims to improve the power engineering curriculum at Cal Poly’s electrical engineering
department by utilizing donated equipment from SEL. The HMI (Human Machine Interface) project focuses
on improving data collection procedures, simplifying the creation of novel laboratory experiments as well as
easing the execution of lab experiments conducted by senior level and graduate level electrical engineering
students. This project fulfills the need for timely and thorough laboratory work. This is crucial since all
laboratory experiment must finish within a three-hour time constraint, and the HMI reduces the time needed
to collect data. Less time collecting data gives students time to prioritize the experiment over tedious and
repetitive data collection procedures.
Requirements and Specifications
This senior project and accompanying future master’s thesis provides a line-of-sight user interface
encompassing the entire microgrid system. The HMI facilitates a simplified data collection process, and
provides the platform to automate system processes in future work. The HMI provides coordination between
the user and the existing hardware developed by previous thesis and senior project work. This HMI must
allow students to complete their experiments in a reasonable amount of time, as laboratory time cannot
exceed 3 hours including demonstrations and instructor introductions. Data collection and organization often
accounts for the most time-consuming portion of an experiment, so to hasten the process, the HMI must
have an easily navigable interface and the HMI must display relevant data automatically. The HMI must
conform to IEEE Standard 1159 [6] for power quality and for power electronics. Table 3-1 describes the
detailed engineering and marketing requirements for the HMI project.

6 | P a g e
TABLE 3-I: MICROGRID HMI SPECIFICATIONS
Marketing
Requirements
Engineering
Specifications Justification
1,2
Positive, Negative, and Zero Sequence
voltages, Line-to-Line voltages,
apparent power, power factor and
Fault current readings report in tabular
form, within ±3%
Each relay reports a large amount of
data during fault conditions. Collecting
this data individually would consume a
large amount of lab time, automating
data collection allows students more
time for experiment and analysis.
3,4 The system interfaces the relays via
automated controller.
The interface prevents users from
exposure to distribution level voltages,
and the RTAC provides the platform to
automate the system.
2,3,4
The HMI has functionality which
allows remote resetting of the relays
connected to the automation controller
though the user terminal.
After fault conditions, each relay
affected must manually reset using the
front panel buttons, creating a relay
reset directly on the UI allows a more
streamlined experiment.
4
The HMI automates power factor
correction procedures at the interface
between the microgrid and the utility.
Because experiments and simulated
faults often cause poor power quality at
the utility interface, the system needs to
detect and correct the power factor and
quality to the utility.

7 | P a g e
5
The HMI must operate on a
computing system with a minimum
processor speed of 800 MHz
The HMI must process automation
logic and implement control signals
before fault current can cause damage
to the microgrid equipment
6 The system must be compatible with
microprocessor-based relays
Modern power systems almost
exclusively implement microgrid bases
relays
Marketing Requirements
1. Accurately collect and reports fault analysis data from microprocessor relays for use in laboratory
experiments
2. Easy to navigate for students using equipment
3. Is safe for students for distribution voltages up to 240 volts
4. The HMI automates routine system processes
5. The HMI must operate quickly
6. The system must use modern protection equipment
The following level 0 and level 1 block diagrams show the main functions and sub functions of the
human-machine interface system. Figure 3-1 identifies the most basic input-output characteristics of
information between the microgrid system and the HMI. The HMI takes information served from the SEL
protection relays via the SEL protocol, and stores the data collected into a SCADA database via the RTAC
client by polling each relay every 1000 ms. The RTAC then sends the system data to the HMI web interface
client through a DNP3 protocol which maps the data via the AcSELerator Diagram Builder software into an
intuitive web-based diagram of the whole microgrid system. From the HMI, the engineer can not only
monitor real time analog measurements in the microgrid substation, but can also individually access each of

8 | P a g e
the relays in the microgrid and send new relay settings via a transparent connection in the SEL protocol.
Table 3-2 provides the descriptions of each of the inputs and outputs for the HMI in the level 0 functional
decomposition, and a description of the functionality for each process.
FIGURE 3-1: LEVEL 0 BLOCK DIAGRAM FOR MICROGRID HUMAN MACHINE INTERFACE
TABLE 3-II: HUMAN-MACHINE INTERFACE FUNCTIONAL REQUIREMENTS
Module Human-Machine Interface
Inputs
Operation Line-to-Line Voltage at the respective bus, polled from the secondary side of
each of the SEL-Relay’s potential transformer using SEL protocol on a serial connection
Operation Line Current at the respective bus, polled from the secondary side of each of the
SEL Relay’s current transformer using SEL protocol on a serial connection
Apparent power at the respective bus, polled from each SEL relay using SEL protocol on a
serial connection
System frequency at the respective bus, polled from each SEL relay using SEL protocol on
a serial connection

9 | P a g e
Breaker status at each bus polled from each SEL relay using SEL protocol on a serial
connection
AC Input power, 120VRMS, 30W, 40VA, 60 Hz
Relay settings from student engineer
Outputs
Web-interface model of microgrid system
Transparent connection access point to each relay
Breaker control mounted in system display allowing remote opening and closing
Functionality
Monitor and report fault conditions with time-stamp, voltage levels, and current flows into
relays
Exports fault data for use in a potential EE 518 lab and for experiments designed for EE
411 labs

10 | P a g e
FIGURE 3-2. LEVEL 1 BLOCK DIAGRAM FOR MICROGRID HUMAN MACHINE INTERFACE

11 | P a g e
Chapter 4 : Design
The design of the HMI utilizes two software packages offered by SEL: the SEL-5033 AcSELerator
RTAC software and the SEL-5035 AcSELerator Diagram Builder 64 software. These two software packages
provide the means to construct the HMI environment through the use of a computer-aided design program,
launch the HMI in the web-based interface. These software also link the data collected by the RTAC and
stored in the SCADA database to the HMI environment using system “Tags”, which the RTAC polls from
the relays in the microgrid system. These tags communicate analog system data including but not limited to
voltages, currents, power, and frequency, then transmit that information to the RTAC, which stores the
information in the SCADA database. The SCADA database and HMI can also communicate binary system
data such as circuit breaker status and outputs. This system uses the existing microgrid system which has been
developed and improved by several senior projects and master’s thesis, and simply communicates the
information from the relays that already exist in the system to the HMI.
The HMI uses the present microgrid system as it exists and takes advantage of the infrastructure
designed and built by the previous senior projects and masters theses. The existing infrastructure provides the
actual hardware component of this project, while the HMI interfaces all the equipment in a centralized
location using the SCADA system, which improves the data-collection process, and creates a line-of-sight
into the microgrid.
AcSELerator RTAC
The first phase of this project was to create the SCADA database which serves as the repository for all system
data. The SCADA system was created using the AcSELerator RTAC software, where the analog and binary
data that are collected by each of the individual relays are stored under a system tag name. Those data are
transmitted to the RTAC using the SEL protocol, which takes data collected by the relay, and transmits only

12 | P a g e
data which has changed, and transmits that tag data to the RTAC. In the RTAC, the tag data are mapped to a
DNP shared server map which stores the data into the SCADA system. The SEL protocol is not the only
method of transmitting tag data to the RTAC. For example the DNP3 protocol could also be used; however,
the SEL protocol was selected for this project for a few reasons. First, the SEL protocol allows for automatic
configuration when connected to SEL intelligent electronic devices (IEDs), including all of the relays used in
this project. Additionally the SEL protocol saves bandwidth in the transmission of data as only system data
that has changed from the previous poll is transmitted which reduces transmission time and improves
network performance.
AcSELerator Diagram Builder 64
The AcSELerator Diagram Builder software is a computer-aided design tool, which allows the user to draft
the HMI. The diagram builder software allows for the design not only of the look of the HMI, but it also can
import the tags set up in the AcSELerator RTAC software and map them to specific functions in the HMI.
The first function that this project uses is mapping measured value (MV) and complex measured value
(CMV) tags. These types of tags in the relays measure analog system data such as voltage conditions, current,
power, reactive power, among others. These data make up the analytic sections of the relay sub-menus. These
relay data are served from the SCADA system to the HMI client, which updates system information once
every second. The AcSELerator Diagram Builder software only allows the design of the HMI, but it doesn’t
operate the HMI itself, the actual operation of the HMI is controlled through a web-interface which connects
the RTAC with the computer terminal. The Diagram Builder software uploads the CAD diagrams and
mapped tags to the RTAC web-interface, and from there the RTAC uses the system tags and SCADA
database to control the data-flow in the HMI.

13 | P a g e
Flowchart
The flowchart in Figure 4-1 shows the flow of information from the collection at the microgrid to the display
on the HMI web-interface. The main polling loop is seen at the top of the flowchart, and each of the relays in
the microgrid is polled once every second.
FIGURE 4-1: INFORMATION FLOWCHART FOR THE MICROGRID HMI

14 | P a g e
Chapter 5 : Test Results
The SCADA system and HMI is constructed using the SEL proprietary software of AcSELerator
RTAC and Diagram Builder 64. To begin this project, the former version of the AcSELerator RTAC
software used in previous projects was read off of the RTAC by connecting to a computer to the RTAC port
F, and connecting to the RTAC using AcSELerator RTAC software.
SCADA For the creation of the SCADA system, the RTAC operates as a server device which concentrates
data and serves the data to the HMI. To create the server SCADA system, a new server device is added to the
list of devices that has already been created in previous projects using AcSELerator RTAC software. Each of
the individual IED’s from the previous projects is connected to the RTAC using an SEL protocol
communications channel. SEL protocol devices contain a list of every data item collected by the IED (tags),
but all tags are deselected by default. To collect the binary and analog data needed for the creation of the
HMI, the tags must be toggled from “false” to “true” in the “Meter” tab when the device is selected, as seen
in Figure 5-1.
A full list of all metered data can be found in Appendix A. Once all the data tags have been selected,
the RTAC will poll each of the IEDs in the system and those IEDs will transmit system data to the RTAC
every 1000 ms. To save on memory, the SEL protocol devices remember what system data was collected in
the previous poll and will only transmit data to the RTAC that has changed since the previous polling period.
The RTAC then saves the polled data as global variables in the RTAC’s memory.

15 | P a g e
FIGURE 5-1: SELECTION OF APPROPRIATE ANALOG AND BINARY DATA TAGS IN IED METER TAB
DNP SCADA Server
Once the tags that will report to the SCADA system have been created, the SCADA device is
created. To collect data, the SCADA system uses a DNP3 network protocol, which is industry standard for
data concentration and SCADA systems. To create the SCADA device, in the AcSELerator RTAC, under the
“Insert” ribbon, the “Other” dropdown menu is selected, and DNP protocol is selected as seen in Figure 5-2.
When the DNP Protocol device has been selected, it must be configured as a server, as it will act as the server
to the client database device, in this case the computer connected to the serial port from the RTAC. The
device name was selected to be SCADA and the in the connection type dropdown menu, “Server-Serial” was
selected so the device used serial communications and was configured to act as a server, as seen in Figure 5-3.

16 | P a g e
FIGURE 5-2: SELECTION OF A DNP3 PROTOCOL DEVICE TO ACT AS THE SCADA MASTER
FIGURE 5-3: Configuration of the DNP SCADA device as a server using serial communication
In the settings submenu for the SCADA device, the Serial Communications Port was selected to use
Com_11, and a serial-USB cable was ran from port 11 on the back of the RTAC to the Database computer to
17 | P a g e
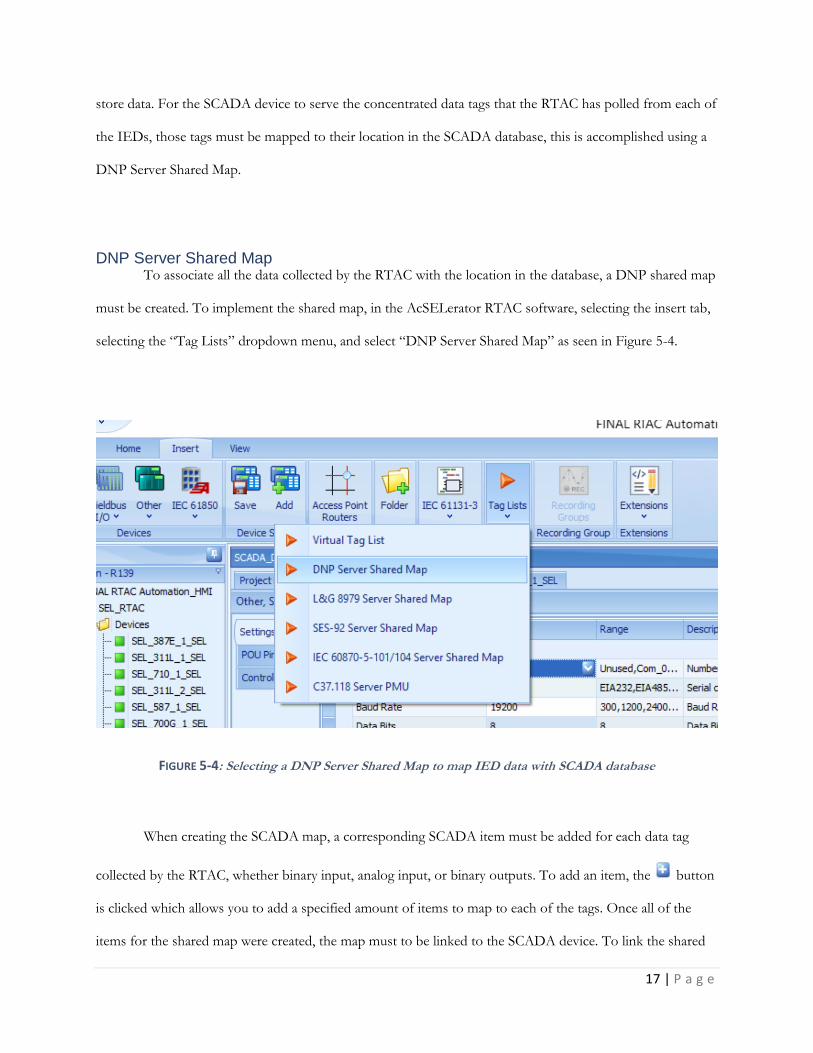
store data. For the SCADA device to serve the concentrated data tags that the RTAC has polled from each of
the IEDs, those tags must be mapped to their location in the SCADA database, this is accomplished using a
DNP Server Shared Map.
DNP Server Shared Map To associate all the data collected by the RTAC with the location in the database, a DNP shared map
must be created. To implement the shared map, in the AcSELerator RTAC software, selecting the insert tab,
selecting the “Tag Lists” dropdown menu, and select “DNP Server Shared Map” as seen in Figure 5-4.
FIGURE 5-4: Selecting a DNP Server Shared Map to map IED data with SCADA database
When creating the SCADA map, a corresponding SCADA item must be added for each data tag
collected by the RTAC, whether binary input, analog input, or binary outputs. To add an item, the button
is clicked which allows you to add a specified amount of items to map to each of the tags. Once all of the
items for the shared map were created, the map must to be linked to the SCADA device. To link the shared

18 | P a g e
server map to the SCADA device, select the SCADA device in the project tree, and under settings in the
DNP section, select the Map Name to the SCADA shared map that was just constructed in order to assign
that map to the DNP server constructed previously, as seen in Figure 5-5.
FIGURE 5-5: Linking DNP SCADA device to the server share map
The next step in the creation of the SCADA system is the mapping of the SCADA items to the IED tags
which makes use of the AcSELerator RTAC tag processor.
Tag Processor To finish up the SCADA system development, each of the tags served by the IEDs and collected by
the RTAC client device must be associated with the SCADA shared map items created previously. To match
each item with a tag, select tag processor from the project tree. In the tag processor, there are two columns
which need to be populated, Source Expression and Destination Tag Name. The Source Expression column
is populated by the tags collected by the RTAC client, and the Destination Tag Name column is populated
with the location in the SCADA database. The exception to this is the binary control outputs, such as the
circuit breaker commands for each of the relays. As the command is originating in the HMI, the SCADA tag

19 | P a g e
is placed in the Source Expression column, while the IED tag is placed in the Destination Tag Name column
as seen in Figure 5-6. When placing the binary output tags in the source expression, be sure to set the
controls to the operation control (such as .operTrip or .operClose) instead of the status control (.status).
FIGURE 5-6: Tag Processor showing reverse placement of Binary Output tags for control commands from the HMI
Once the breaker commands have been set, each of the individual relays has to have the logic
settings changes such that a breaker command sent from the HMI will send a signal to the physical circuit
breaker wired to the output screws of the relay. All of the relays have logic associated with when the output
screws pulse a signal, which must be modified so that the command from the HMI triggers the output pulse.
For example in the SEL-421, when the breaker bits control is sent from the HMI, the relay word bit of

20 | P a g e
“CC1” for a Close command and “OC1” for an Open command is triggered. The SEL-421 in this project is
wired from the OUT101 screw to the close coil on the circuit breaker, and OUT102 is connected to the trip
coil. So to properly set the outputs, the relay settings are changed using AcSELerator QuickSet software.
Connect the computer running QuickSet to port F of the relay, make sure that the communications settings
are selected to read from a serial port with the correct baud rate, read the settings into QuickSet. Once read,
the settings which signal a pulse to the OUT101 and OUT102 screws can be modified by selecting the
Outputs menu and selecting Main Board in the settings tree on the left sidebar. In the SELogic equation
fields for OUT101 and OUT102, add the word bits OC1 and CC1 using the logic OR as seen in Figure 5-7.
A similar procedure was conducted for each of the relays in the system.
FIGURE 5-7: Relay Settings for the SEL-421 to signal Circuit Breaker Trips

21 | P a g e
After the tags have all been mapped in the Tag Processor, the construction of the SCADA system has been
completed, and the project moved to the creation of the HMI environment using the Diagram Builder CAD
software.
HMI Diagram To allow engineers to monitor the whole system and to use SCADA to control parts of the system, an
HMI environment has been constructed, both for the system as a whole and for each individual relay. From
the system overview page, individual circuit breakers can be tripped or closed in order to conduct experiments,
and also allows the engineer to gain access to each of the Relays, seeing system data at each bus. To construct
the HMI environment, the CAD software, Diagram Builder 64 is used. For several of the individual relay pages,
templates created by other RTAC users and engineers at SEL has been created and are available free for use
from the SEL website [7].
HMI To create a new diagram, launch the Diagram Builder software, and in File, select New Project. This
HMI has a main system page, showing the whole system one-line diagram, and an individualized page for each
of the relays in the system. To create the diagram, under the “Controls” sidebar, different types of controls and
images can be added to the diagram by clicking and dragging the item into the diagram. Some of the controls,
such as the generator and the transformers are just simple images, with no ability to map tags or execute
controls, while others like the breakers and the annunciator tiles can have detailed controls. In order to import
all of the tags mapped from the SCADA section, select the “Import” button in the top toolbar, and either
connect directly to the RTAC if the SCADA system is already online and the computer running Diagram
Builder is connected to the RTAC, or connect to the database if the computer running Diagram Builder is not
connected to the RTAC, then click the “Load Tags” button to import all the tags from the project into the
diagram.

22 | P a g e
Breakers The breaker controls in the HMI are supposed to be serving two purposes, first to show on the HMI
the status of the breaker, whether it is open or closed, and second, to send a command to the relay to trip or
close the breaker. To show the status of the breaker, the binary output of OUT102, which is wired to the trip
coil in the SEL-421, is either “True” or “False” as the binary output is a Boolean expression. When the status
of OUT102 is true then the breaker turns green, when false the breaker is red. This allows engineers at the HMI
to quickly look at the overview page and see the status of all the breakers in the system. This is done by assigning
the global variable tag to the breaker in the source section, under “Tag Name,” of the properties seen in
Figure 5-8.
To configure the control of the breaker, in the properties menu, under Control Window, click on the
Binary Outputs collection, this opens the Tag Map for the controls. Map the Breaker Bits for the relay into
the control by finding the breaker bits in the list of available tags and adding it to the selected tags window as
seen in Figure 5-9.
FIGURE 5-8: Assigning Global Variable to the Tag Name for the SEL-421 Breaker Control

23 | P a g e
FIGURE 5-9: Assigning Breaker Bits to the Control Outputs for the HMI representation of the Circuit Breaker
Annunciator Tiles
The purpose of the Annunciator Tiles in this project is to allow the HMI to easily navigate between
the main microgrid overview page to each of the individual relay pages. First, to create the separate relay
pages, by using the Project Navigation tab on the left of the screen, right clicking on the “Diagrams” branch
of the navigation tree, and selecting “Create New” for each of the relays. One of the properties of the
annunciator tiles is the ability to link from one diagram to the other by clicking on the tile. To link an
annunciator tile to a separate diagram, click on the tile, and under the properties menu, locate the “Behavior”
section, and clicking on the dropdown menu scroll through and select the appropriate diagram seen in
Figure 5-10. This allows the user to click on the tile and be taken to the diagram for the respective relay.

24 | P a g e
FIGURE 5-10: Assigning Diagrams to the Annunciator Tiles
Image Control
The addition of static images is accomplished by dragging the image control from the Control menu.
Once the image control box is on the diagram, select the empty image, and under the properties menu, select
the “Image File” and select the image from any image file on saved to the computer, such as .jpg, .bmp, .tiff,
or .gif.
Tags The other main function of the HMI is the ability to monitor the condition of the system in near-
real-time using tags mapped from the RTAC. This allows the HMI to report analog data read by the relays

25 | P a g e
and displays it on the screen. The analog data collected by the RTAC and stored in the SCADA system can
be displayed in the HMI be selecting the “Tags” menu in the left menu bar, locating the tag to be placed in
the diagram, and dragging it into the diagram. Once the tag is placed properly in the diagram, the name, units,
precision, and font can be changed using the properties menu.
The rest of the diagram was built using the in-software tools, but no other tag mapping or controls
were assigned, so the rest of the HMI is essentially a simple CAD drawing.
HMI Web Interface
To complete the HMI project, both the SCADA system updates and the HMI diagram builder must
send their files to the RTAC. The SCADA system is sent to the RTAC by clicking on the “Go Online”
button in AcSELerator RTAC under the home tab, which overwrites the current project in the RTAC. To
send the diagram to the RTAC, in Diagram Builder 64, click the “Send Current Project” button in the top
toolbar which sends the diagrams to the RTAC which uses them to build the HMI web interface.
To launch the web interface, connect a computer to the RTAC front panel, and open a web browser.
In the address bar, type the address http://172.29.131.1 to launch the SEL webpage. The web browser may
require additional authorization to launch the web page, so click on advanced, and then proceed anyway
(unsafe). The first page is a login page, use the following credentials to launch the webpage
User Name : sdittmann
Password : RM102rtac!
Once logged into the RTAC webpage, in the left sidebar, select “Microgrid Lab” from the HMI list to launch
the HMI.

26 | P a g e
Chapter 6 . Conclusion
The HMI as designed for the MPSL provides student engineers the ability to overview the
system, as a whole, to see trends in the data in real-time both on the system level, and at each relay
location in the system.
Two of the objectives of the HMI set in Chapter 3 were unsuccessful. The first is the
engineering access, which there is not a method of sending relay settings using the HMI for two
reasons: 1. the access port for sending relay settings, the Port F on each of the relays, is not
connected directly to the RTAC and the other serial ports do not have this same functionality, and 2.
the HMI does not have access to the AcSELerator QuickSet software, which is required to modify
and send relay settings. Due to these limitations of the RTAC and AcSELerator RTAC software, the
engineering access must continue using the current method which uses AcSELerator QuickSet and
connecting to the front serial port. Breaker communication between the HMI and the relays also
does not function properly, where the HMI indicates that the command to operate breaker and to
change the status of the binary output has been sent, but the relay output screws do not change or
pulse the circuit breaker trip or close coils.
The other requirements for this project did correctly perform, the HMI system data
accurately reflected data seen on the front panel of the relays; however, not fully in real-time as the
RTAC has a polling period of 1000 ms, causing a slight lag in the system data. This allows engineers
to quickly collect data without the need to go to each physical relay and read the system data from
the front LCD.
The specification for the HMI is technically possible, using code from the Tag Processor and
creating a User Logic program; however, this project was unable to attempt creating this logic, as it

27 | P a g e
is better suited for a Master’s thesis focusing on system automation, creating a digital switch for the
newly installed capacitor bank at the induction motor, as well as a new capacitor bank located at the
infinite bus intertie. The SCADA system now allows the RTAC to have access to a wide variety of
binary and analog data, which allows the RTAC to process data and store it easily without using
global RTAC variable. Other future work on this project includes the completion of the circuit
breaker open and close commands.

28 | P a g e
References
[1] Business & Manufacturing Editors., National Academy of Engineering Reveals Top Engineering
Impacts of the 20th Century: Electrification Cited as Most Important, New York, New York: Business
Wire, 2000.
[2] T. Hong and F. de León, "Controlling Non-Synchronous Microgrids for Load Balancing of Radial
Distribution Systems," IEEE Transactions on Smart Grid, vol. 8, no. 6, pp. 2608-2616, Nov. 2017.
[3] University of California San Diego, "Microgrids at Berkeley Lab," Berkeley Lab, 2017. [Online].
Available: https://building-microgrid.lbl.gov/ucsd. [Accessed 7 11 2017].
[4] K. W. Pretzer, "Protective Relaying Student Laboratory," Cal Poly San Luis Obispo, San Luis Obispo,
2017.
[5] I. Hellman-Wylie and J. Navarro, "Microgrid Protection Student Laboratory," Cal Poly San Luis
Obispo, San Luis Obispo, 2017.
[6] IEEE Recommended Practice for Monitoring Electric Power Quality, IEEE Standard 1159, 2009.
[7] R. M. Ford and C. S. Coulston, Design for Electrical and Computer Engineers : Theory, Concepts,
and Practice, New York, New York: McGraw-Hill, 2008.
[8] R. Chepesiuk, "Where the chips fall: environmental health in the semiconductor industry.,"
Environmental Health Perspectives, vol. 107, no. 9, pp. A452-A457, 1999.
[9] Institute of Electrical and Electronics Engineers, "IEEE Code of Ethics," IEEE, 2017. [Online].
Available: https://www.ieee.org/about/corporate/governance/p7-8.html. [Accessed 1 11 2017].
[10] California Polytechnic State University Electrical Engineering Department, "EE and CPE Lab Safety
Rules," 2016. [Online]. Available:
http://www.ee.calpoly.edu/media/uploads/LABSAFETYRULESJan2016.docx. [Accessed 17 11
2017].
[11] Schweitzer Engineering Laboratories, Inc, RTAC SEL-3530 Real-Time Automation Controller, SEL-
3530 datasheet, Pullman, WA, 2017.
[12] J. L. Creed, "Mobile micro-grid power system controller and method". US Patent US8315745B2, 20
November 2012.
[13] P. K. Goharshenasan, M. Joorabian and S. G. Seifossadat, "A new proposal for the designa of hybrid
AC/DC microgrids towards high power quality," Turkish Journal Of Electrical Engineering &
Computer Science, vol. 25, no. 5, pp. 4033-4049, October 2017.

29 | P a g e
[14] M. Rasheduzzaman, B. H. Chowdhury and S. Bha, "Converting an Old Machines Lab into a
Functioning Power Network With a Microgrid for Education," IEEE Transactions on Power Systems,
vol. 29, no. 4, pp. 1952-1962, July 2014.
[15] S. Nunziata, "SCADA Security: Smart Grid Growing Pains Reflect Broad Enterprise Trends," eWeek,
pp. 7-7.1, 23 March 2012.
[16] E. Padilla, K. Agbossou and A. Cardenas, "Towards Smart Integration of Distributed Energy
Resources Using Distributed Network Protocol Over Ethernet," IEEE Transactions on Smart Grid,
vol. 5, no. 4, pp. 1686-1695, July 2014.

30 | P a g e
Appendex A: ABET Senior Project Analysis
Student: Nathan Martinez Student Signature: _________________________
Advisor: Dr. Taufik Advisor Initials: ________ Date: ___/___/2018
1. Summary of Functional Requirements
The microgrid protection laboratory human-machine interface operates as a complementary
project to the microgrid protection laboratory. This project creates a user interface, which
facilitates improved experiment design for instructors and greater experiment throughput for
students via a streamlined, easily navigable, human-machine interface which eases data
collection requirements and improves analysis by students. The HMI also creates a line-of-
sight into the system which will aid in the creation of automated processes. This human-
machine interface provides a display windows for each unit under test. The display windows
supply data needed to analyze system performance and system conditions before and after
electric fault condition. The human-machine interface also provides the foundation for a
future Master’s thesis which automates routine system processes using data collected into the
SCADA database.
2. Primary Constraints
This project complements the larger microgrid project, and as such, the project must
develop within the scope of system as currently built. As the fundamental circuits and relays
have already completed construction, this project cannot make those decisions and must
work within those constraints. Many requirements from Table 3-I stem from this constraint,
for example the HMI’s compatibility with microprocessor based relays emerged because the
microgrid already contains those types of relays, and the HMI must interface via the
automated controller because the RTAC already interfaces the relays, albeit in a primitive
way. In addition to the physical constraints, this project faces temporal constraints. The HMI
acts as the foundation for a master’s thesis which automates power factor correction
protocol, and therefore must complete construction before the next phase of the project can
commence, additionally the senior project phase must conclude before the senior project
expo in June.

31 | P a g e
3. Economic
This HMI project requires an estimated 217 hours of labor to produce. Most of that time
spent in the programming of the HMI environment, and additional time to develop the
project report and the initial research into the project. The microgrid project requires
significant financial capital, however, this HMI project requires very little capital as the base
hardware has completed installation, additionally, SEL provides the software used to develop
the HMI environment at no charge. The only cost outside of labor, a power quality meter
model SEL-735, is estimated at $1,500, and like the relays that make up the microgrid, it’s
likely that SEL will donate the power quality meter as well. Cal Poly provides the real capital
needed for this project, providing the space, and the equipment needed to produce to
produce the HMI as well as many of the tools which are provided through the student
check-out window.
The costs for this system are front-loaded. This project requires a functional microgrid
system before engineering can proceed on the HMI. After the HMI’s developed and
deployed, the system requires little maintenance. Occasionally a system patch may need
development as students begin experiments and failure points become apparent. The largest
stakeholders in this project include future power electrical engineering students and Cal Poly,
the electrical engineering department, the university itself, and future employers of Cal Poly
graduates. Future electrical engineering students benefit through the developing skills needed
in modern power systems protection and additional lab equipment which improves
education, The EE department and Cal Poly benefits from an increase in reputation in
industry and with increased enrollment of potential power engineering students, attracted to
the electrical engineering program from the availability of a microgrid on campus.
4. If Manufactured on a Commercial Basis
The training of electrical engineering students in modern power systems acts as the main
purpose for this project and the entire microgrid project. As this project is educational in
nature, no effort is put into the commercialization of the HMI or the microgrid. If the
microgrid project and HMI were in fact intended for commercialization, the customer
demographic would largely consist of other universities interested in developing a microgrid
student laboratory. The HMI developed in this project could act as the foundation for many

32 | P a g e
varieties of HMIs that use SEL relays. According to the ABET website, currently 770
universities have ABET accreditation, so the predicted market for the HMI consists of 2-10
interfaces per year with a likely installation of 5 units. Using the PERT method [7], these
estimates result in 5.33 units installed per year. The HMI project requires minimal costs to
reproduce if the intended microgrid project uses SEL relays. As SEL does not charge users
for use of the AcSELerator QuickSet software, all the costs incur from labor. If using SEL
relays, the estimated costs for reproduction of the HMI comes to about 40 hours labor for
the installation and customization of the interface or $1,600. The installation essentially is
treated as contract work, and the school would assume the costs of purchasing the relays and
other equipment for their microgrid. The school would only pay for the intellectual property
and hours billed to implement the customized HMI. Assuming 40 hours of labor at
$40/hour for each installation, and 5.33 instillations/year, the profits total $8,533.33 / year.
The HMI has minimal operational costs, only requiring the cost of electricity needed to run
the engineering terminal, and, if used for a pilot project or on a commercial microgrid, the
salary of an engineering technician. Assuming a commercial rate for electricity in California
of $0.12/kWh, and a rated power of 50W, the cost for power to the terminal would follow
the following formula.
𝟓𝟎𝑾 ×𝟐𝟒 𝒉𝒐𝒖𝒓𝒔
𝟏 𝒅𝒂𝒚×
𝟑𝟔𝟓 𝒅𝒂𝒚𝒔
𝟏 𝒚𝒆𝒂𝒓×
𝟏 𝒌𝑾
𝟏𝟎𝟎𝟎 𝑾×
$𝟎.𝟏𝟐
𝒌𝑾𝒉=
$𝟓𝟐.𝟓𝟔
𝒚𝒆𝒂𝒓 EQ. 1
The cost of electricity comes to an estimated $50/year depending on usage and model of
computer terminal. Assuming an average salary for an electrical engineering technician of
$50,000 / year, the total operating costs for the HMI comes to an estimated $50,050/year,
although the costs can fluctuate dramatically depending on job market conditions and
electricity costs.
5. Environmental
The environmental impacts of this project are minimal. The only natural resource inputs, the
electricity required to run the terminal, totals about 438 kWh/year. If cleverly designed,
much of the power needs for the HMI can come from the solar panel addition to the
microgrid, an ongoing Master’s thesis working in parallel with this project. The HMI has a
minimal direct impact on the environment, but several indirect environmental impacts of the
HMI and the microgrid exist. A microgrid encourages people within the microgrid’s territory

33 | P a g e
to invest in distributed resources, most commonly rooftop solar. With more students
entering industry understanding DER fundamentals, engineers can feel more confident when
proposing engineering solutions that involve renewable resources. With more engineers
sponsoring renewable solutions, utilities can feel confident in installing these systems,
lowering the need for fossil fuel based generation. The automation of power factor decreases
required generation, as the microgrid requires less reactive power to maintain voltage. Less
generation translates to less consumed in generation, and less pollution from energy
conversion. With lower fossil fuel based electricity generation, other species benefit due to
fewer oil and natural gas wells drilled, and fewer habitats disturbed.
6. Manufacturability
Few issues present themselves regarding the manufacture of the human machine interface.
The low real capital costs needed in installing the intellectual property only requires the initial
engineering investment to customize the HMI to the specific system that the customer
requires. The biggest challenge to the manufacture of this HMI comes from the constraint
that the project must use SEL based relays. The software package for this design has
developed exclusively on SEL’s proprietary AcSELerator QuickSet Software package which
has very little portability. If the customer needed an HMI on a different software
environment, engineering must begin from scratch on the unique environment and the costs
and development time increase dramatically. The biggest problem the HMI project has, in a
manufacturability context, relates to the expense in the construction of the microgrid which
relies entirely on the customer. As stated in Appendix A section 2, the microgrid must exist
prior to the installation of an HMI and that severely restricts the manufacturability the HMI.
7. Sustainability
The HMI has a minimal detrimental effect on sustainability. The project can be called a
software program, so it requires electricity to operate, but this system helps to control a
system which encourages the use of renewable resources. The system does require resources
extracted from earth, especially rare earth metals, used to produce materials such as batteries
and semiconductors, the manufacture of semiconductors needed to create the
microprocessor based relays and solar panels often contributes significantly to pollution [8],
and oil resources needed to produce petroleum based products like the plastic enclosures can
have detrimental effects on the environment.

34 | P a g e
8. Ethical
This project specifically, and the microgrid project overall, presents interesting ethical
considerations including trade-offs in the implementation of technology which primarily
benefits wealthy customers who can afford to employ the solutions provided by a microgrid,
and the elite, in the education of a professional class of engineers in the short term, while
attempting to benefit humanity with unknown consequences over the long term. This
project exists to educate students, so they may become more effective power engineers and
produce a safe product for both the public and the system operators.
This project seeks to fulfill the values of the IEEE Code of Ethics [9], and the first and the
fifth values stated in said code particularly. The first value represents the engineer’s
responsibility to made decisions consistent with the health, safety, and welfare of the public.
This project seeks to inform engineers of the consequences of their actions both intended
and unintended, and shows students tested methods to protect a power system from the
dangers caused by faults. The fifth value in the IEEE code of ethics pertains to the
continuing understanding of technology, its applications, and potential consequences. The
implementation of microprocessor based relays lets a locally coordinated microgrid become
a feasible technology, and this laboratory strives to educate power engineering students to
their operation, design, and protection. The HMI project specifically eliminates some of the
more routine procedures in data collection and thus allows students to understand the
microgrid system more deeply, fulfilling the fifth value as well. Additionally, this project uses
the ethical frameworks of Contractarism to analyze ethical considerations.
In John Rawl’s Contractarianism, an ethical action must promote, or at the least not infringe,
equal liberty for all people, provide an equal access for an individual to advance in society,
and the action must support the difference principle, inequalities must most greatly benefit
society’s least advantaged. For this HMI project and for the microgrid project overall, the
purpose is to educate college students, and in that sense, the project cannot provide equal
access for all individuals to advance in society. Not all members of society have equal access
to a college education, and from that perspective, the project has issues fulfilling the
difference principle. For the current system of electric distribution, essentially all people have
equal access to electricity and there exist programs which subsidize low income people, so
they can afford the electric rate; however, with a system that utilizes a microgrid, the system
generally favors higher income individuals and families that have access to clear skies and
real estate in which they can install solar panels or batteries. Lower income households may

35 | P a g e
or may not benefit if they happen to fall within an area that has an established microgrid,
unfortunately, most low-income households tend to concentrate in densely populated urban
areas where the land needed to install a significant amount of distributed resources is cost
prohibitive and skies are generally obscured due to pollution and obstructions from high-rise
buildings. Other problems with microgrid potentially harming low-income households
include a dilemma where if wealthy customers have the option to break from a traditional
grid, the reduction in revenue that utilities can obtain may risk ending subsidized rates for
low-income households, while people who cannot form their own microgrid could have
rates increase as fewer people are available to spread the cost of maintaining the grid
infrastructure. Advantages, in some situations, occur when using a microgrid, but these
ethical issues exist, and those solutions would likely have to come from political action and
regulations on microgrids.
9. Health and Safety
The HMI project only has minimal safety risk, as the direct experience with the HMI takes
place through a computer terminal. Safety risks associated with the use of the HMI involve
the same risks as using a computer. Some risks exist when using the HMI to control the
microgrid, as the microgrid system uses a 240 V 3-phase system, but the system shouldn’t
cause any more risks than other laboratory classes offered at Cal Poly such as EE 295 and
EE 410. To reduce the risk to students using higher voltage laboratories, students ought to
always use the buddy system, only using the lab when two or more people in the room. The
relays themselves control the protection of the grid during faults, but some processes such as
the automation of the power factor correction, get controlled directly by the HMI. If power
factor cannot sufficiently correct, there exists a small risk of damage to the upstream
transformer. Additionally, laboratories conducted on Cal Poly grounds require that students
abide by general lab safety rules which students are obligated to follow and supervising
professors ought to uphold [10].
10. Social and Political
This project’s main stakeholders include future engineering students studying power systems
and system protection, and Cal Poly State University, specifically the electrical engineering
department who has commissioned this project as a laboratory component for the power
systems protection class. The school benefits though the availability of another laboratory
that students can conduct experiments with and develop future senior projects. The
additional facilities also increase the school’s prestige both with future students and industry.

36 | P a g e
The students benefit from the additional laboratory, allowing them to experiment the theory
they learn in class and benefit through the continuation of the tradition of “Learn by
Doing”.
11. Development
The development of this project requires me to learn how to program the SEL AcSELerator
QuickSet Software package to coordinate the relay’s data streams [11], and the operation of
each relay. Also, the performance and limitations of the relays, and relay programming. This
project also requires comprehension of power factor correction techniques to program and
coordinate the HMI automation process. Learning about the implementation of other
microgrids, both on other university campuses and as pilots for small municipal utilities
assisted greatly in the coordination of the overall HMI [12] [13] [14]. Other considerations
outside of the microgrid itself included learning about security steps in protecting the
microgrid from outside attackers, whether by rogue nations or malicious hackers, though the
use of Supervisory control and data acquisition (SCADA) control systems both at the
terminal and over a network system as the RTAC connects to a centralized server [15] [16].

37 | P a g e
Appendex B: Timeline of Tasks and Milestones
FIGURE B-1: Gnat Chart for the development of the HMI and SCADA System

38 | P a g e
Appendex C: Bill of Materials
The HMI project uses only components already implemented in the Microgrid Protection Laboratory, or
using software which has been provided by SEL. No materials were purchased for this project
Appendex D: SCADA Tag Map
The table found in Table D-I lists all of the mapping of RTAC global variables into SCADA database tags.
These SCADA tags can be used to store system information, as data for system automation and control logic,
or for display in an HMI.
Table D-I: SCADA tag processor mapping
Destination Tag Name Data Type Source Expression
SEL-387E
SCADA_MAP_DNP.AI_00000 CMV SEL_387E_1_SEL.FM_INST_I0_1
SCADA_MAP_DNP.AI_00001 CMV SEL_387E_1_SEL.FM_INST_I1_1
SCADA_MAP_DNP.AI_00002 CMV SEL_387E_1_SEL.FM_INST_I2_1
SCADA_MAP_DNP.AI_00003 CMV SEL_387E_1_SEL.FM_INST_IA1
SCADA_MAP_DNP.AI_00004 CMV SEL_387E_1_SEL.FM_INST_IAW2
SCADA_MAP_DNP.AI_00005 CMV SEL_387E_1_SEL.FM_INST_IB1
SCADA_MAP_DNP.AI_00006 CMV SEL_387E_1_SEL.FM_INST_IBW2
SCADA_MAP_DNP.AI_00007 CMV SEL_387E_1_SEL.FM_INST_IC1
SCADA_MAP_DNP.AI_00008 CMV SEL_387E_1_SEL.FM_INST_ICW2
SCADA_MAP_DNP.AI_00009 CMV SEL_387E_1_SEL.FM_INST_V0_4
SCADA_MAP_DNP.AI_00010 CMV SEL_387E_1_SEL.FM_INST_V1_4
SCADA_MAP_DNP.AI_00011 CMV SEL_387E_1_SEL.FM_INST_V2_4
SCADA_MAP_DNP.AI_00012 CMV SEL_387E_1_SEL.FM_INST_VAB4
SCADA_MAP_DNP.AI_00013 CMV SEL_387E_1_SEL.FM_INST_VAWX
SCADA_MAP_DNP.AI_00014 CMV SEL_387E_1_SEL.FM_INST_VBC4
SCADA_MAP_DNP.AI_00015 CMV SEL_387E_1_SEL.FM_INST_VBWX
SCADA_MAP_DNP.AI_00016 CMV SEL_387E_1_SEL.FM_INST_VCA4
SCADA_MAP_DNP.AI_00017 CMV SEL_387E_1_SEL.FM_INST_VCWX
SCADA_MAP_DNP.AI_00018 MV SEL_387E_1_SEL.FM_INST_P4_WATTS
SCADA_MAP_DNP.AI_00019 MV SEL_387E_1_SEL.FM_INST_Q4_VARS
SEL_387E_1_SEL.FO_BRK_BRK1 SBRC SCADA_MAP_DNP.BO_00000
SEL_387E_1_SEL.FO_BRK_BRK2 SBRC SCADA_MAP_DNP.BO_00001

39 | P a g e
SEL_387E_1_SEL.FO_BRK_BRK3 SBRC SCADA_MAP_DNP.BO_00002
SCADA_MAP_DNP.BI_00000 SPS SEL_387E_1_SEL.FM_INST_51N2T
SCADA_MAP_DNP.BI_00001 SPS SEL_387E_1_SEL.FM_INST_51P2T
SCADA_MAP_DNP.BI_00002 SPS SEL_387E_1_SEL.FM_INST_51Q2T
SCADA_MAP_DNP.BI_00003 SPS SEL_387E_1_SEL.FM_INST_87R
SCADA_MAP_DNP.BI_00004 SPS SEL_387E_1_SEL.FM_INST_OUT101
SCADA_MAP_DNP.BI_00005 SPS SEL_387E_1_SEL.FM_INST_OUT102
SCADA_MAP_DNP.BI_00006 SPS SEL_387E_1_SEL.FM_INST_PDEM2
SCADA_MAP_DNP.BI_00007 SPS SEL_387E_1_SEL.FM_INST_QDEM2
SCADA_MAP_DNP.BI_00008 SPS SEL_387E_1_SEL.FM_INST_TRIP1
SCADA_MAP_DNP.BI_00009 SPS SEL_387E_1_SEL.FM_INST_TRIP2
SCADA_MAP_DNP.BI_00010 SPS SEL_387E_1_SEL.FM_INST_TRIP3
SCADA_MAP_DNP.BI_00011 SPS SEL_387E_1_SEL.FM_INST_TRIP4
SCADA_MAP_DNP.BI_00012 SPS SEL_387E_1_SEL.FM_INST_W1
SCADA_MAP_DNP.BI_00013 SPS SEL_387E_1_SEL.FM_INST_W2
Destination Tag Name Data Type Source Expression
SEL-311L #1
SCADA_MAP_DNP.AI_00020 CMV SEL_311L_1_SEL.FM_INST_I0
SCADA_MAP_DNP.AI_00021 CMV SEL_311L_1_SEL.FM_INST_I1
SCADA_MAP_DNP.AI_00022 CMV SEL_311L_1_SEL.FM_INST_I2
SCADA_MAP_DNP.AI_00023 CMV SEL_311L_1_SEL.FM_INST_IA
SCADA_MAP_DNP.AI_00024 CMV SEL_311L_1_SEL.FM_INST_IB
SCADA_MAP_DNP.AI_00025 CMV SEL_311L_1_SEL.FM_INST_IC
SCADA_MAP_DNP.AI_00026 CMV SEL_311L_1_SEL.FM_INST_V0
SCADA_MAP_DNP.AI_00027 CMV SEL_311L_1_SEL.FM_INST_V1
SCADA_MAP_DNP.AI_00028 CMV SEL_311L_1_SEL.FM_INST_V2
SCADA_MAP_DNP.AI_00029 CMV SEL_311L_1_SEL.FM_INST_VAB
SCADA_MAP_DNP.AI_00030 CMV SEL_311L_1_SEL.FM_INST_VBC
SCADA_MAP_DNP.AI_00031 CMV SEL_311L_1_SEL.FM_INST_VCA
SCADA_MAP_DNP.AI_00032 MV SEL_311L_1_SEL.FM_INST_FREQ
SCADA_MAP_DNP.AI_00033 MV SEL_311L_1_SEL.FM_INST_P_WATTS
SCADA_MAP_DNP.AI_00034 MV SEL_311L_1_SEL.FM_INST_Q_VARS
SEL_311L_1_SEL.FO_BRK_BRK1 SBRC SCADA_MAP_DNP.BO_00003
SCADA_MAP_DNP.BI_00014 SPS SEL_311L_1_SEL.FM_INST_51G
SCADA_MAP_DNP.BI_00015 SPS SEL_311L_1_SEL.FM_INST_51GT
SCADA_MAP_DNP.BI_00016 SPS SEL_311L_1_SEL.FM_INST_51P
SCADA_MAP_DNP.BI_00017 SPS SEL_311L_1_SEL.FM_INST_51PT
SCADA_MAP_DNP.BI_00018 SPS SEL_311L_1_SEL.FM_INST_51Q
SCADA_MAP_DNP.BI_00019 SPS SEL_311L_1_SEL.FM_INST_51QT

40 | P a g e
SCADA_MAP_DNP.BI_00020 SPS SEL_311L_1_SEL.FM_INST_KEY
SCADA_MAP_DNP.BI_00021 SPS SEL_311L_1_SEL.FM_INST_M1P
SCADA_MAP_DNP.BI_00022 SPS SEL_311L_1_SEL.FM_INST_M1PT
SCADA_MAP_DNP.BI_00023 SPS SEL_311L_1_SEL.FM_INST_M2P
SCADA_MAP_DNP.BI_00024 SPS SEL_311L_1_SEL.FM_INST_M2PT
SCADA_MAP_DNP.BI_00025 SPS SEL_311L_1_SEL.FM_INST_M3P
SCADA_MAP_DNP.BI_00026 SPS SEL_311L_1_SEL.FM_INST_M3PT
SCADA_MAP_DNP.BI_00027 SPS SEL_311L_1_SEL.FM_INST_OUT101
SCADA_MAP_DNP.BI_00028 SPS SEL_311L_1_SEL.FM_INST_R1X
SCADA_MAP_DNP.BI_00029 SPS SEL_311L_1_SEL.FM_INST_SV1
SCADA_MAP_DNP.BI_00030 SPS SEL_311L_1_SEL.FM_INST_SV1T
SCADA_MAP_DNP.BI_00031 SPS SEL_311L_1_SEL.FM_INST_T1X
SCADA_MAP_DNP.BI_00032 SPS SEL_311L_1_SEL.FM_INST_TRIP
SCADA_MAP_DNP.BI_00033 SPS SEL_311L_1_SEL.FM_INST_Z1G
SCADA_MAP_DNP.BI_00034 SPS SEL_311L_1_SEL.FM_INST_Z1GT
SCADA_MAP_DNP.BI_00035 SPS SEL_311L_1_SEL.FM_INST_Z2G
SCADA_MAP_DNP.BI_00036 SPS SEL_311L_1_SEL.FM_INST_Z2GT
SCADA_MAP_DNP.BI_00037 SPS SEL_311L_1_SEL.FM_INST_Z3G
SCADA_MAP_DNP.BI_00038 SPS SEL_311L_1_SEL.FM_INST_Z3GT
SCADA_MAP_DNP.BI_00039 SPS SEL_311L_1_SEL.FM_INST_ZONE1
SCADA_MAP_DNP.BI_00040 SPS SEL_311L_1_SEL.FM_INST_ZONE2
SCADA_MAP_DNP.BI_00041 SPS SEL_311L_1_SEL.FM_INST_ZONE3
Destination Tag Name Data Type Source Expression
SEL-710
SCADA_MAP_DNP.AI_00035 MV SEL_710_1_SEL.FM_INST_FREQ
SCADA_MAP_DNP.AI_00036 MV SEL_710_1_SEL.FM_INST_IA
SCADA_MAP_DNP.AI_00037 MV SEL_710_1_SEL.FM_INST_IB
SCADA_MAP_DNP.AI_00038 MV SEL_710_1_SEL.FM_INST_IC
SCADA_MAP_DNP.AI_00039 MV SEL_710_1_SEL.FM_INST_IG
SCADA_MAP_DNP.AI_00040 MV SEL_710_1_SEL.FM_INST_IN
SCADA_MAP_DNP.AI_00041 MV SEL_710_1_SEL.FM_INST_MLOAD
SCADA_MAP_DNP.AI_00042 MV SEL_710_1_SEL.FM_INST_P
SCADA_MAP_DNP.AI_00043 MV SEL_710_1_SEL.FM_INST_PF
SCADA_MAP_DNP.AI_00044 MV SEL_710_1_SEL.FM_INST_Q
SCADA_MAP_DNP.AI_00045 MV SEL_710_1_SEL.FM_INST_S
SCADA_MAP_DNP.AI_00046 MV SEL_710_1_SEL.FM_INST_TCURTR
SCADA_MAP_DNP.AI_00047 MV SEL_710_1_SEL.FM_INST_TCUSTR
SCADA_MAP_DNP.AI_00048 MV SEL_710_1_SEL.FM_INST_UBI
SCADA_MAP_DNP.AI_00049 MV SEL_710_1_SEL.FM_INST_UBV
SCADA_MAP_DNP.AI_00050 MV SEL_710_1_SEL.FM_INST_VA
SCADA_MAP_DNP.AI_00051 MV SEL_710_1_SEL.FM_INST_VAB
SCADA_MAP_DNP.AI_00052 MV SEL_710_1_SEL.FM_INST_VB

41 | P a g e
SCADA_MAP_DNP.AI_00053 MV SEL_710_1_SEL.FM_INST_VBC
SCADA_MAP_DNP.AI_00054 MV SEL_710_1_SEL.FM_INST_VC
SCADA_MAP_DNP.AI_00055 MV SEL_710_1_SEL.FM_INST_VCA
SEL_710_1_SEL.FO_BRK_BRK1 SBRC SCADA_MAP_DNP.BO_00004
SCADA_MAP_DNP.BI_00042 SPS SEL_710_1_SEL.FM_INST_OUT102
SCADA_MAP_DNP.BI_00043 SPS SEL_710_1_SEL.FM_INST_OUT103
Destination Tag Name Data Type Source Expression
SEL-311L #2
SCADA_MAP_DNP.AI_00056 CMV SEL_311L_2_SEL.FM_INST_I0
SCADA_MAP_DNP.AI_00057 CMV SEL_311L_2_SEL.FM_INST_I1
SCADA_MAP_DNP.AI_00058 CMV SEL_311L_2_SEL.FM_INST_I2
SCADA_MAP_DNP.AI_00059 CMV SEL_311L_2_SEL.FM_INST_IA
SCADA_MAP_DNP.AI_00060 CMV SEL_311L_2_SEL.FM_INST_IB
SCADA_MAP_DNP.AI_00061 CMV SEL_311L_2_SEL.FM_INST_IC
SCADA_MAP_DNP.AI_00062 CMV SEL_311L_2_SEL.FM_INST_V0
SCADA_MAP_DNP.AI_00063 CMV SEL_311L_2_SEL.FM_INST_V1
SCADA_MAP_DNP.AI_00064 CMV SEL_311L_2_SEL.FM_INST_V2
SCADA_MAP_DNP.AI_00065 CMV SEL_311L_2_SEL.FM_INST_VAB
SCADA_MAP_DNP.AI_00066 CMV SEL_311L_2_SEL.FM_INST_VBC
SCADA_MAP_DNP.AI_00067 CMV SEL_311L_2_SEL.FM_INST_VCA
SCADA_MAP_DNP.AI_00068 MV SEL_311L_2_SEL.FM_INST_FREQ
SCADA_MAP_DNP.AI_00069 MV SEL_311L_2_SEL.FM_INST_P_WATTS
SCADA_MAP_DNP.AI_00070 MV SEL_311L_2_SEL.FM_INST_Q_VARS
SEL_311L_2_SEL.FO_BRK_BRK1 SBRC SCADA_MAP_DNP.BO_00005
SCADA_MAP_DNP.BI_00044 SPS SEL_311L_2_SEL.FM_INST_OUT101
SCADA_MAP_DNP.BI_00045 SPS SEL_311L_2_SEL.FM_INST_OUT102
Destination Tag Name Data Type Source Expression
SEL-587
SCADA_MAP_DNP.AI_00071 CMV SEL_587_1_SEL.FM_INST_I0_1
SCADA_MAP_DNP.AI_00072 CMV SEL_587_1_SEL.FM_INST_I1_1
SCADA_MAP_DNP.AI_00073 CMV SEL_587_1_SEL.FM_INST_I2_1
SCADA_MAP_DNP.AI_00074 CMV SEL_587_1_SEL.FM_INST_IAB1
SCADA_MAP_DNP.AI_00075 CMV SEL_587_1_SEL.FM_INST_IAB2
SCADA_MAP_DNP.AI_00076 CMV SEL_587_1_SEL.FM_INST_IAW2
SCADA_MAP_DNP.AI_00077 CMV SEL_587_1_SEL.FM_INST_IBC1
SCADA_MAP_DNP.AI_00078 CMV SEL_587_1_SEL.FM_INST_IBC2
SCADA_MAP_DNP.AI_00079 CMV SEL_587_1_SEL.FM_INST_IBW2

42 | P a g e
SCADA_MAP_DNP.AI_00080 CMV SEL_587_1_SEL.FM_INST_ICA1
SCADA_MAP_DNP.AI_00081 CMV SEL_587_1_SEL.FM_INST_ICA2
SCADA_MAP_DNP.AI_00082 CMV SEL_587_1_SEL.FM_INST_ICW2
SEL_587_1_SEL.FO_BRK_BRK1 SBRC SCADA_MAP_DNP.BO_00006
SEL_587_1_SEL.FO_BRK_BRK2 SBRC SCADA_MAP_DNP.BO_00007
SCADA_MAP_DNP.BI_00046 SPS SEL_587_1_SEL.FM_INST_51N2T
SCADA_MAP_DNP.BI_00047 SPS SEL_587_1_SEL.FM_INST_51P2T
SCADA_MAP_DNP.BI_00048 SPS SEL_587_1_SEL.FM_INST_51Q2T
SCADA_MAP_DNP.BI_00049 SPS SEL_587_1_SEL.FM_INST_87R
SCADA_MAP_DNP.BI_00050 SPS SEL_587_1_SEL.FM_INST_MTU1
SCADA_MAP_DNP.BI_00051 SPS SEL_587_1_SEL.FM_INST_MTU2
SCADA_MAP_DNP.BI_00052 SPS SEL_587_1_SEL.FM_INST_MTU3
SCADA_MAP_DNP.BI_00053 SPS SEL_587_1_SEL.FM_INST_OUT1
SCADA_MAP_DNP.BI_00054 SPS SEL_587_1_SEL.FM_INST_OUT2
SCADA_MAP_DNP.BI_00055 SPS SEL_587_1_SEL.FM_INST_PDEM
SCADA_MAP_DNP.BI_00056 SPS SEL_587_1_SEL.FM_INST_QDEM
Destination Tag Name Data Type Source Expression
SEL-700G #1
SCADA_MAP_DNP.AI_00083 MV SEL_700G_1_SEL.FM_INST_FREQS
SCADA_MAP_DNP.AI_00084 MV SEL_700G_1_SEL.FM_INST_FREQX
SCADA_MAP_DNP.AI_00085 MV SEL_700G_1_SEL.FM_INST_FREQY
SCADA_MAP_DNP.AI_00086 MV SEL_700G_1_SEL.FM_INST_IAX
SCADA_MAP_DNP.AI_00087 MV SEL_700G_1_SEL.FM_INST_IAY
SCADA_MAP_DNP.AI_00088 MV SEL_700G_1_SEL.FM_INST_IBX
SCADA_MAP_DNP.AI_00089 MV SEL_700G_1_SEL.FM_INST_IBY
SCADA_MAP_DNP.AI_00090 MV SEL_700G_1_SEL.FM_INST_ICX
SCADA_MAP_DNP.AI_00091 MV SEL_700G_1_SEL.FM_INST_ICY
SCADA_MAP_DNP.AI_00092 MV SEL_700G_1_SEL.FM_INST_P3X
SCADA_MAP_DNP.AI_00093 MV SEL_700G_1_SEL.FM_INST_P3Y
SCADA_MAP_DNP.AI_00094 MV SEL_700G_1_SEL.FM_INST_Q3X
SCADA_MAP_DNP.AI_00095 MV SEL_700G_1_SEL.FM_INST_Q3Y
SCADA_MAP_DNP.AI_00096 MV SEL_700G_1_SEL.FM_INST_S3X
SCADA_MAP_DNP.AI_00097 MV SEL_700G_1_SEL.FM_INST_S3Y
SCADA_MAP_DNP.AI_00098 MV SEL_700G_1_SEL.FM_INST_VABX
SCADA_MAP_DNP.AI_00099 MV SEL_700G_1_SEL.FM_INST_VABY
SCADA_MAP_DNP.AI_00100 MV SEL_700G_1_SEL.FM_INST_VAX
SCADA_MAP_DNP.AI_00101 MV SEL_700G_1_SEL.FM_INST_VBCX
SCADA_MAP_DNP.AI_00102 MV SEL_700G_1_SEL.FM_INST_VBCY
SCADA_MAP_DNP.AI_00103 MV SEL_700G_1_SEL.FM_INST_VCAX
SCADA_MAP_DNP.AI_00104 MV SEL_700G_1_SEL.FM_INST_VCAY

43 | P a g e
SEL_700G_1_SEL.FO_BRK_BRK1 SBRC SCADA_MAP_DNP.BO_00008
SEL_700G_1_SEL.FO_BRK_BRK2 SBRC SCADA_MAP_DNP.BO_00009
SCADA_MAP_DNP.BI_00057 SPS SEL_700G_1_SEL.FM_INST_OUT102
Destination Tag Name Data Type Source Expression
SEL-700G #2
SCADA_MAP_DNP.AI_00105 MV SEL_700G_2_SEL.FM_INST_FREQX
SCADA_MAP_DNP.AI_00106 MV SEL_700G_2_SEL.FM_INST_FREQY
SCADA_MAP_DNP.AI_00107 MV SEL_700G_2_SEL.FM_INST_IAX
SCADA_MAP_DNP.AI_00108 MV SEL_700G_2_SEL.FM_INST_IAY
SCADA_MAP_DNP.AI_00109 MV SEL_700G_2_SEL.FM_INST_IBX
SCADA_MAP_DNP.AI_00110 MV SEL_700G_2_SEL.FM_INST_IBY
SCADA_MAP_DNP.AI_00111 MV SEL_700G_2_SEL.FM_INST_ICX
SCADA_MAP_DNP.AI_00112 MV SEL_700G_2_SEL.FM_INST_ICY
SCADA_MAP_DNP.AI_00113 MV SEL_700G_2_SEL.FM_INST_P3X
SCADA_MAP_DNP.AI_00114 MV SEL_700G_2_SEL.FM_INST_P3Y
SCADA_MAP_DNP.AI_00115 MV SEL_700G_2_SEL.FM_INST_Q3X
SCADA_MAP_DNP.AI_00116 MV SEL_700G_2_SEL.FM_INST_Q3Y
SCADA_MAP_DNP.AI_00117 MV SEL_700G_2_SEL.FM_INST_S3X
SCADA_MAP_DNP.AI_00118 MV SEL_700G_2_SEL.FM_INST_S3Y
SCADA_MAP_DNP.AI_00119 MV SEL_700G_2_SEL.FM_INST_VABX
SCADA_MAP_DNP.AI_00120 MV SEL_700G_2_SEL.FM_INST_VABY
SCADA_MAP_DNP.AI_00121 MV SEL_700G_2_SEL.FM_INST_VAX
SCADA_MAP_DNP.AI_00122 MV SEL_700G_2_SEL.FM_INST_VBCX
SCADA_MAP_DNP.AI_00123 MV SEL_700G_2_SEL.FM_INST_VBCY
SCADA_MAP_DNP.AI_00124 MV SEL_700G_2_SEL.FM_INST_VCAX
SCADA_MAP_DNP.AI_00125 MV SEL_700G_2_SEL.FM_INST_VCAY
SEL_700G_2_SEL.FO_BRK_BRK1 SBRC SCADA_MAP_DNP.BO_00010
SEL_700G_2_SEL.FO_BRK_BRK2 SBRC SCADA_MAP_DNP.BO_00011
SCADA_MAP_DNP.BI_00058 SPS SEL_700G_2_SEL.FM_INST_OUT102
Destination Tag Name Data Type Source Expression
SEL-421
SCADA_MAP_DNP.AI_00126 CMV SEL_421_1_SEL.FM_INST_IA1
SCADA_MAP_DNP.AI_00127 CMV SEL_421_1_SEL.FM_INST_IA2
SCADA_MAP_DNP.AI_00128 CMV SEL_421_1_SEL.FM_INST_IA3
SCADA_MAP_DNP.AI_00129 CMV SEL_421_1_SEL.FM_INST_IAB
SCADA_MAP_DNP.AI_00130 CMV SEL_421_1_SEL.FM_INST_IB1
SCADA_MAP_DNP.AI_00131 CMV SEL_421_1_SEL.FM_INST_IC1

44 | P a g e
SCADA_MAP_DNP.AI_00132 CMV SEL_421_1_SEL.FM_INST_VA
SCADA_MAP_DNP.AI_00133 CMV SEL_421_1_SEL.FM_INST_VAB
SCADA_MAP_DNP.AI_00134 CMV SEL_421_1_SEL.FM_INST_VBC
SCADA_MAP_DNP.AI_00135 CMV SEL_421_1_SEL.FM_INST_VC
SCADA_MAP_DNP.AI_00136 CMV SEL_421_1_SEL.FM_INST_VCA
SCADA_MAP_DNP.AI_00137 MV SEL_421_1_SEL.FM_INST_FREQ
SCADA_MAP_DNP.AI_00138 MV SEL_421_1_SEL.FM_INST_P_WATTS
SCADA_MAP_DNP.AI_00139 MV SEL_421_1_SEL.FM_INST_Q_VARS
SEL_421_1_SEL.FO_BRK_BRK1 SBRC SCADA_MAP_DNP.BO_00012
SEL_421_1_SEL.FO_BRK_BRK2 SBRC SCADA_MAP_DNP.BO_00013
SCADA_MAP_DNP.BI_00059 SPS SEL_421_1_SEL.FM_INST_OUT101
SCADA_MAP_DNP.BI_00060 SPS SEL_421_1_SEL.FM_INST_OUT102

45 | P a g e
Appendex E: Microgrid Diagrams
The following figures show each of the menus in the HMI as designed in the Diagram Builder 64 Software.
Each of the following figures shows the build of the
FIGURE E-1: MICROGRID SYSTEM OVERVIEW PAGE

46 | P a g e
FIGURE E-2: SEL-710 RELAY PAGE
FIGURE E-3: SEL-587 RELAY PAGE

47 | P a g e
FIGURE E-4: SEL-700G RELAY PAGE
FIGURE E-5: SEL-421 RELAY PAGE

48 | P a g e
FIGURE E-6: SEL-387E RELAY PAGE

49 | P a g e
FIGURE E-7: SEL-311L RELAY PAGE