Embed Size (px)
Citation preview

UNIVERSITÄT DUISBURG-ESSEN LEHRSTUHL FÜR TECHNISCHE CHEMIE II
Microfiltration Membranes via Electrospinning of Polyethersulfone
Solutions
Dissertation
zur Erlangung des akademischen Grades
Dr. rer. nat.
der Fakultät für Chemie
der Universität Duisburg-Essen
vorgelegt von M.Sc. BINTASAN KWANKHAO
geboren am 27.02.1979 in Thailand
Essen 2013

Microfiltration Membranes via Electrospinning of Polyethersulfone
Solutions
By
M. Sc. Bintasan Kwankhao
Thesis submitted to the Department of Chemistry of University of Duisburg-Essen, in partial fulfillment of
the requirements of the degree of Dr. rer. nat.
Approved by the examining committee on Chair: Prof. Dr. Christian Mayer Advisor: Prof. Dr. Mathias Ulbricht Reviewer: Prof. Dr. Jochen S. Gutmann Date of oral examination: 12.11.2013

i
Abstract
Nanofibers or nanowebs produced by electrospinning have several
prominent properties such as high surface area to volume ratio, high porosity and
pore size in nanorange. As the porosity of electrospun nanoweb is more than 90%,
they are candidates for air filters and liquid filtration membranes. However, the
application of electrospun nanofibers membranes has yet to make breakthrough in
other avenues of separation than air filtration, especially in pressure-driven liquid
separations, such as ultrafiltration (UF) or nanofiltration (NF).
In this project, the preparation of polyethersulfone (PES) membranes by
electrospinning was studied. The influence of processing parameters, i.e., polymer
concentration, applied voltage, flow rate, spinneret-to-collector distance, relative
humidity, were investigated. The treatment of the proto-membrane formed by
immersion in an aqueous coagulation bath was also studied. More comprehensive
characterizations of the nanofiber membranes, including fiber diameter, pore size,
porosity, thickness, basic weight and tensile strength as well as air and water
permeability were investigated. Thereby, we expect that this work will open up the
avenue toward the use of nanofibers for very important applications of separation
technology. Of particular interest are membranes in water purification, e.g., pre-
filters to minimize contaminations and fouling prior to ultra- or nano-filtration.
PES (Ultrason 6020P) was dissolved in N-methyl-2-pyrrolidone (NMP) at
concentrations of 9%, 15%, 22%. The polymer solution was electrospun under
processing conditions i.e., a spinneret-to-collector distance of 10 cm, an applied
voltage of 30 kV, a flow rate of 20 µL/min, and a spinneret diameter of 0.8 mm,
stationary substrate set-up, aluminum foil and PET nonwoven served as the
substrate. The first results showed that the 22% PES solution can be electrospun into
well-defined nanofiber. The overall morphology of the membranes obtained is
changed from a fiber network into spherical particles connected by fibers with the
decrease of the polymer concentration in the solution used for electrospinning. The
properties of nanofiber can be measured on aluminum foil or PET nonwoven as
substrate. Image analyses gave a mean fiber diameter of 489 ± 142 nm but under
stationary spinning conditions that leads to a 3 dimensional fiber web on the
substrate.
When the 22% PES solution was electrospun membrane using a moving
substrate under processing conditions i.e., applied voltage of 18 kV, a spinneret-to-
collector distance of 10 cm, a flow rate of 20 µL/min, a spinneret diameter of 0.8
mm, a speed of substrates moving of 2.2 cm/min, 65% RH and served the PET
nonwoven as substrate, yielded a more planar and homogeneous membrane. The
thickness of membrane was 200 µm. The image analyses gave a mean fiber diameter
of 800 nm. However, the proto-membrane which had been treated by immersion

ii
into the water bath lead to a pronounced porosity on the nanofiber surface which
will be useful, for instance, for increasing binding capacity to the fiber surface. In
addition, the membranes which had been electrospun under processing condition at
high humidity resulted in irregular fiber formation.
All test results for membranes showed that the fiber diameter and
membrane structure and, consequently, membranes properties were clearly
affected by applied voltage and spinneret-to-collector distance. The electrospun
membrane was prepared by an applied voltage 18 kV at distance spinneret-to-
collector of 10 cm, a flow rate of 20 µL/min, a spinneret diameter of 0.8 mm, a
speed of substrates moving of 2.2 cm/min, 65% RH and served the PET nonwoven as
substrate exhibited the pore size of 1.8 µm, the porosity of 93% and basic weight of
0.169 mg/cm2. All membranes showed similar and high contact angle. The
electrospun membranes prepared by applying higher voltage have lower flux than
membranes prepared with lower voltage. The electrospun membranes which were
prepared by increasing distance between spinneret-to-collector (kept other
conditions) exhibited high water flux and clear correlation between structure and
performance that decreasing of mean pore size leads to decreasing water flux of
electrospun membranes. However the results suggested that PES electrospun
nanofiber membranes are excellent materials for high water flux MF applications.
Regarding nitrogen gas flow through electrospun membranes, the
membranes which were prepared by increasing applied voltage showed decreasing
gas permeability. Moreover with the DEHS aerosol, with particles size of 400 - 1000
nm, filtration performance of electrospun nanofiber web was much greater than
that of the 4 layers commercial nonwoven (Novatexx 2429) with pore size of 8 μm.
This result clearly demonstrated the potential of electrospun nanofiber in the
development of filter material against aerosol nanoparticles.
The filtrate fluxes of commercial membrane (Membrana MicroPES; pore size
1 μm) was much smaller than the filtrate fluxes of PES electrospun membrane with
pore size ranging between 1.7 - 4.5 μm. Overall, PES electrospun membrane showed
greater water flux than commercial membrane both before and after separation of
silica nanoparticles (size 35 nm). The water flux before separation of all membrane
was higher than after silica nanoparticles separation. The PES electrospun
membranes had higher particles rejection than PES commercial membrane. Besides,
the rejection of electrospun membranes was well above 90%, while commercial
membrane rejected the nanoparticles by only 85% in the beginning of the filtration.
Moreover, the PES electrospun membranes exhibited the rejection above 98% at the
end of rejection experiment run. Such the results showed, electrospun nanofiber
PES membranes can be used in various applications such as removal of nano or
microparticles from waste-water, e.g., pre-filters to minimize contaminations and
fouling prior to UF or NF.

iii
This dissertation is dedicated with love to
my parents (Siri & Yong Kwankhao)
for their encouragement, support and
endless love over four years during
my doctorate study.
iv
This work was performed during the period from February 2010 to March 2013 in
the Institute of Technical Chemistry II (Lehrstuhl für Technische Chemie II), Faculty of
Chemistry, University of Duisburg-Essen and Deutsche Textilforschungszentrum
Nord-West e.V. (DTNW), Krefeld, under the supervision of Prof. Dr. Mathias Ulbricht.
I declare that this dissertation represents my own work, except where due acknowledgement is made.
--------------------------------------
Bintasan Kwankhao
08 July 2013, Essen
v
Acknowledgements
This dissertation could not have been completed without the support and help
of many people and organizations that are gratefully acknowledged here.
At the very first, i would like to express my deepest gratitude to my supervisor,
Prof. Dr. M. Ulbricht for the support, supervision and giving me the great opportunity to
work in his research group. He always offered me the valuable suggestions and ideas
with his knowledge and research experiences.
Secondly, i would like to give best thanks as well to Dr. T. Bahners for giving me
the opportunity to work in his research group at Deutsche Textilforschungszentrum
Nord-West e.V. (DTNW), Krefeld. He always supported me through the difficulties of my
research work and encouraged me. I am greatly grateful Dr. A. Wego for the help,
support and very valuable discussions on my work.
I would like to thank Prof. Dr. C. Mayer for being the head of examination
committee and to Prof. Dr. J. S. Gutmann for being the co-referents of my work.
I am very thankful to Ministry of Science and Technology of Thailand for financial
support and Rajamangala University of Technology Thanyaburi, Thailand for providing
me the five-year scholarship to support my Ph.D. study in Germany. I would like to
thank Office of Education Affairs, Berlin for the help of scholarship arrangements and
extension.
I also wish to acknowledge I. Danielzik, C. Schenk, R. Nordmann-Silberg, T.
Kallweit for their support. I would like to express my appreciation to C. Bettray. She
always helped me and paid attention to my private life when i lived in Germany during
the study. I would like to thank to U. Fehrenschild for the help with electrospinning set-
up, B. Gebert for contribution to SEM observation. E. Daueber (Institut fuer Energie- und
Umwelttechnik e.V.) for air filtration measurement, Dr. Z. Pei for the helps and
suggestions, S. Frost for support with water filtration measurement and to all members
of our research group at Lehrstuhl für Technische Chemie II, Universität Duisburg-Essen.
I would like to thank S. Salehi, Dr. V. Ameri, Dr. A. Farouk and Dr. N. Mohamed
for the nice time we spent together at DTNW, Krefeld. Furthermore, i am grateful to all
my colleagues at DTNW, Krefeld for the nice discussion and environment.
Special thanks to W. Sae-Lai for encouragement through the difficult moments
of my Ph.D. study and to J. Breuer and her family, who are giving me a warm and
familial atmosphere in Germany.
Finally, i wish to express my special thanks to my family in Thailand for support,
encouragement and giving me all their endless love from far away.

vi
Contents
Abstract ....................................................................................................................... i
Acknowledgements .................................................................................................... v
Contents .................................................................................................................... vi
List of Figures .......................................................................................................... viii
List of Tables ............................................................................................................ xiv
1. Introduction ..................................................................................................... 2
1.1. Background and motivation ................................................................................ 2
1.2 Objectives of the research ................................................................................... 3
1.3 Scope of the thesis ............................................................................................... 3
2. Theory and literature review ........................................................................... 5
2.1 Electrospinning process background ................................................................... 5
2.2 Influence of parameters in electrospinning process ........................................... 7
2.2.1 Electrospinning from polymer solution ............................................................ 8
2.2.1.1 Polymer concentration ............................................................................... 8
2.2.1.2 Surface tension ........................................................................................ 10
2.2.1.3 Polymer solution conductivity................................................................. 10
2.2.1.4 Evaporation of solvents ........................................................................... 11
2.2.1.5 Flow rate .................................................................................................. 11
2.2.2 Electric field .................................................................................................... 12
2.2.3 Tip-to-collector distance ................................................................................ 17
2.2.4 Humidity ......................................................................................................... 18
2.3 Application of electrospun nanofibers ............................................................. 20
2.3.1 Filter structure and function .......................................................................... 20
2.3.2 Air filtration .................................................................................................... 24
2.3.3 Water filtration .............................................................................................. 28
2.3.3.1 Membrane classification ......................................................................... 28
2.3.3.2 Electrospun microfiltration membranes ................................................. 29
2.3.3.3 Electrospun ultrafiltration membranes ................................................... 33
3. Experimental ................................................................................................. 37
3.1 Materials and chemicals ................................................................................... 37
3.2 Experiments ...................................................................................................... 37
3.2.1 Viscosity measurement .................................................................................. 37
3.2.2 Preparation of nanofiber membranes ........................................................... 37
3.2.3 Membranes characterization ......................................................................... 38
3.2.4 Characterization of membranes performance ............................................. 41
vii
4. Results and discussion ................................................................................... 45
4.1 Optimization of PES nanofibers ........................................................................ 45
4.1.1 Influence of polymer concentration .............................................................. 45
4.1.2 Influence of spinneret-to-collector distance ................................................. 47
4.1.3 Influence of substrate in electrospun nanofibers .......................................... 50
4.1.4 Influence of parameters in process on membranes structure ...................... 50
4.2 Optimization of PES nanofiber membranes ..................................................... 51
4.2.1 Influence of relative humidity in electrospinning process ............................ 52
4.2.2 Influence of electrical potential in electrospinning process .......................... 53
4.2.3 Influence of spinneret-to-collector distance ................................................. 56
4.2.4 Homogeneity of PES electrospun membranes .............................................. 58
4.2.5 Influence of post-treatment conditions on fiber surface of electrospun
membranes ............................................................................................................. 61
4.3 Properties of PES electrospun membranes ...................................................... 62
4.3.1 Thickness of electrospun membrane ............................................................. 62
4.3.2 Porosity of electrospun membranes.............................................................. 63
4.3.3 Basic weight of electrospun membranes ....................................................... 64
4.3.4 Mean pore size of electrospun membranes .................................................. 67
4.3.5 Mechanical property of electrospun membranes ......................................... 69
4.3.6 Contact angle of electrospun membranes .................................................... 70
4.4 Performance of PES electrospun membranes .................................................. 71
4.4.1 Gas permeability ............................................................................................ 71
4.4.2 Air filtration performance .............................................................................. 73
4.4.3 Water flux ....................................................................................................... 74
4.4.4 Water filtration performance ........................................................................ 76
5. Conclusions and outlook ................................................................................ 81
5.1 Conclusions ....................................................................................................... 81
5.2 Outlook .............................................................................................................. 82
References............................................................................................................... 84
Appendix-1 .............................................................................................................. 92
List of Abbreviations ............................................................................................... 92
Appendix-2 .............................................................................................................. 94
List of Conferences .................................................................................................. 94
Appendix-3 .............................................................................................................. 95
Curriculum Vitae ..................................................................................................... 95

viii
List of Figures
Figure 2.1 Size comparisons of TiO2/PVP nanofibers and a normal human hair. ......... 5
Figure 2.2 Electrospun PES nanofibers compared to PET microfiber ........................... 6
Figure 2.3 Schematic view of electrospinning instrument. ........................................... 6
Figure 2.4 The development of the cone-jet in electrospinning, (a) photograph of
polyvinyl alcohol solution showing a fiber being electrospun from a Taylor cone, (b)
the evolution of the shape of a meniscus of polyethylene oxide–water solution
under an electric field. The meniscus is first transformed to a conical shape by the
applied electric potential (b.1, b.2). The rounded tip then becomes sharper (b.3), and
a jet is finally emitted from the tip of the cone (b.4). Then, the shape of the cone was
changed back to a new, stable rounded shape (b.5), which persists as long as the
solution carried away by the jet is replaced by fluid flowing into the meniscus (b.6). . 7
Figure 2.5 SEM images of polyurethane fibrous membranes were electrospun from
(a) 6 %, (b) 8 % and (c) 10% (w/v) solution in tetrahydrofuran (THF) and N,N-
dimethyl formamide (DMF). .......................................................................................... 9
Figure 2.6 Conventional electrical setup for electrospinning as, (a) reported by
Fridrikh et al. and (b) modified setup for more homogeneous field geometry as
studied by Bahners et al.. ............................................................................................12
Figure 2.7 (a) Distribution of the electrical potential in tip-collector-geometry and
(b) tip-collector-geometry with additional disc electrode around the capillary tip. ..14
Figure 2.8 Optical micrographs of electrospun PCL fibers. Spinning condition were:
13% PCL in methylenchoride, 16 kV and 19 cm distance from capillary tip to counter
electrode. (a) tip-plate-geometry and (b) with additional disc electrode around the
capillary tip. .................................................................................................................16
Figure 2.9 SEM images and fiber size distribution of electrospun Nylon 6,6 fiber
produced at various applied voltage: ( a) 20 kV, (b) 30 kV, (c) 50 kV. ........................17
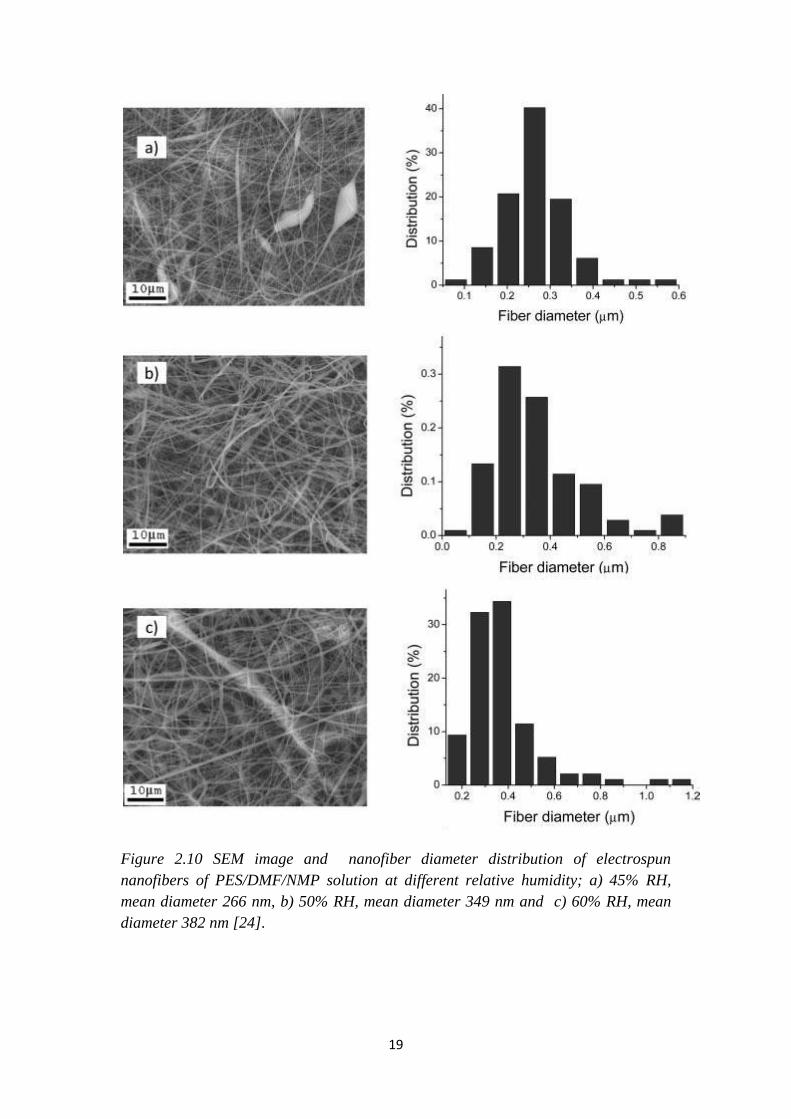
Figure 2.10 SEM image and nanofiber diameter distribution of electrospun
nanofibers of PES/DMF/NMP solution at different relative humidity; a) 45%RH, mean

ix
diameter 266 nm, b) 50%RH, mean diameter 349 nm and c) 60%RH, mean diameter
382 nm. ........................................................................................................................19
Figure 2.11 Main applications of electrospun nanofiber: (a) oil filtration, (b) air
filtration, (c) sensor, (d) wound healing and (e) tissue engineering scaffolds. ..........20
Figure 2.12 The cartoon shows an example for the combination of depth and surface
filtration, the large particle are separated via surface filtration in both cases.
Differences are seen for the smallest particles which are trapped (partially) in the
depth (a) and completely on the surface (b). .............................................................21
Figure 2.13 SEM images of electrospun PAN/PET membrane after filtration by using
the 0.20 μm particles suspension from (A) surface and (B) cross-section views. .......22
Figure 2.14 Particle trajectories around a cylindrical fiber for particle of different
Stokes number (St). A zero Stokes number denotes the actual stream line of the
transport. .....................................................................................................................23
Figure 2.15 SEM micrograph of a laser-treated textile filter, PET sieving fabric with a
mesh opening of 10 µm, after wet filtration process. .................................................24
Figure 2.16 Commercial air filter is produced by Donaldson company. ....................25
Figure 2.17 Schematic representation of different membrane morphologies. ..........28
Figure 2.18 PSU electrospun membrane after particle–challenge (polystyre with
paticle size ranging between 0.1 – 10 µm) test, a) & b) top surface, c) cross-section
and d) bottom surface. ................................................................................................30
Figure 2.19 Schematic structure of three-layer approach to fabricate high flux and
low-fouling for ultrafiltration membranes . ................................................................34
Figure 3.1 Experimental set-up for preparation of PES nanofiber membranes. .........38
Figure 4.1 SEM images of nanofiber membranes from (a) 9% PES, (b) 15% PES and (c)
22% PES, in NMP using the conditions, i.e., a spinneret-to-collector distance of 10
cm, an applied voltage of 30 kV, a flow rate of 20 µL/min, a spinneret diameter of
0.8 mm, stationary substrate set-up and PET nonwoven served as the substrate. ...46

x
Figure 4.2 SEM micrographs of nanofiber membranes obtained by electrospinning
from 22% PES in NMP using the conditions, i.e., an applied voltage of 30 kV, a flow
rate of 20 µL/min, a spinneret diameter of 0.8 mm, stationary substrate set-up and
PET nonwoven served as the substrate, but with different distance between
spinneret -to-collector : (a) 5 cm, (b) 10 cm, (c) 15 cm and (d) 20 cm. .......................49
Figure 4.3 SEM images of nanofiber membranes obtained by electrospinning from
22% PES in NMP onto: (a) aluminum foil, and (b) PET nonwoven, as the substrates
and using the conditions, i.e., a spinneret-to-collector distance of 10 cm, an applied
voltage of 30 kV, a flow rate of 20 µL/min, a spinneret diameter of 0.8 mm and with
stationary substrate set-up. ........................................................................................50
Figure 4.4 Photo image of nanofiber membranes obtained by electrospining from
22% PES in NMP using the conditions, i.e., a spinneret-to-collector distance of 10 cm,
an applied voltage of 30 kV, a flow rate of 20 µL/min, a spinneret diameter of 0.8
mm, stationary substrate set-up and PET nonwoven served as the substrate. .........51
Figure 4.5 SEM images of nanofiber membranes obtained by electrospinning
condition, i.e., a spinneret-to-collector distance of 10 cm, an applied voltage of 30
kV, a flow rate of 20 µL/min, and a spinneret diameter of 0.8 mm, a speed of
substrates moving of 2.2 cm/min and PET nonwoven served as the substrate but
different relative humidity conditions: (a) 50%, (b) 65% and (c) 80%. .......................53
Figure 4.6 SEM images of the nanofiber membranes surface and cross section with
variation of applied voltage: (a) 8 kV, (b) 10 kV, (c) 15 kV and (d) 18 kV, using
processing conditions, i.e., a spinneret-to-collector distance of 10 cm, a flow rate of
20 µL/min, a spinneret diameter of 0.8 mm, 65% RH,a speed of substrates moving of
2.2 cm/min and PET nonwoven served as the substrate. ...........................................55
Figure 4.7 SEM images of electrospun membranes using the process condition, i.e.,
an applied voltage of 18 kV, a flow rate of 20 µL/min, a spinneret diameter of 0.8
mm and 65% RH, a speed of substrates moving of 2.2 cm/min and PET nonwoven
served as the substrate but with variation of distance between spinneret-to-
collector; (a) 10 cm, (b) 12 cm, (c) 14 cm and (d) 15 cm. ............................................57
Figure 4.8 Specimen of 22% PES electrospun membrane, which was prepared under
conditions, i.e., an applied voltage of 18 kV, a spinneret-to-collector distance of 10
cm, a flow rate of 20 µL/min, a spinneret diameter of 0.8 mm, a speed of substrates
moving of 2.2 cm/min, 65% RH and using PET nonwoven as the substrate. ..............59

xi
Figure 4.9 SEM images and fiber diameter with different position on electrospun
membranes obtained by using the same electrospinning condition as Figure before;
(a) position 1, (b) position 2, (c) position 3 and (d) position 4. ...................................60
Figure 4.10 SEM micrographs of nanofiber membranes obtained by electrospinning
from 22% PES in NMP using an applied voltage of 18 kV, a spinneret-to-collector
distance of 10 cm, a flow rate of 20 µL/min, a spinneret diameter of 0.8 mm, a speed
of substrates moving of 2.2 cm/min, 65% RH and using PET nonwoven as the
substrate with different treatment conditions: (a) immersion in an aqueous
coagulation bath and (b) drying at 65 ± 5% RH and 20 °C. ..........................................61
Figure 4.11 Thickness of electrospun membranes by using the condition, a flow rate
of 20 µL/min, a spinneret diameter of 0.8 mm, a speed of substrates moving of 2.2
cm/min, 65% RH and using PET nonwoven as the substrate with different applied
voltage and distance between a spinneret-to-collector in process. ...........................62
Figure 4.12 Porosity of electrospun membranes by preparing under conditions, a flow rate of 20 µL/min, a spinneret diameter of 0.8 mm, a speed of substrates moving of 2.2 cm/min, 65% RH and using PET nonwoven as the substrate but with varying applied voltage and distance between spinneret-to-collector in electrospinning process………………………………………………………………………………………….63
Figure 4.13 Correlation between mean pore size with porosity of electrospun
membranes tunable by preparation conditions.........................................................64
Figure 4.14 Calculated basic weight of electrospun membranes by using the
condition, a flow rate of 20 µL/min, a spinneret diameter of 0.8 mm, a speed of
substrates moving of 2.2 cm/min, 65% RH and using PET nonwoven as the substrate
with different applied voltage and distance between a spinneret-to-collector in
process........................................................................................................................66
Figure 4.15 Effect of varying applied voltage and distance between spinneret- to-
collector in electrospinning process on the mean pore size of electrospun
membranes by preparing under conditions with a flow rate of 20 µL/min, a spinneret
diameter of 0.8 mm, a speed of substrates moving of 2.2 cm/min, 65% RH and using
PET nonwoven as the substrate..................................................................................68
Figure 4.16 Correlation between diameters of nanofibers with mean pore size of
electrospun membranes tunable by preparations condition.....................................69

xii
Figure 4.17 Contact angles of membranes by preparing under electrospinning
conditions, a flow rate of 20 µL/min, a spinneret diameter of 0.8 mm, a speed of
substrates moving of 2.2 cm/min, 65% RH and using PET nonwoven as the substrate
but with varying applied voltage and distance between spinneret-to- collector.......70
Figure 4.18 Schematic of the Cassie-Baxter’s model..................................................71
Figure 4.19 N2 gas permeability of PES electrospun membranes prepared by using
conditions, a spinneret-to-collector distance of 10 cm, a flow rate of 20 µL/min, a
spinneret diameter of 0.8 mm, 65% RH, a speed of substrates moving of 2.2 cm/min
and using PET nonwoven as the substrate, but with variation applied voltage in
process. ........................................................................................................................72
Figure 4.20 Correlation between mean pore size with N2 gas permeability of
electrospun membranes tunable by preparations condition. ....................................73
Figure 4.21 Aerosol (DEHS) collection efficiency of electrospun nanofiber prepared
by using conditions, a spinneret-to-collector distance of 10 cm, a flow rate of 20
µL/min, a spinneret diameter of 0.8 mm, a speed of substrates moving of 2.2
cm/min, 65% RH and using PET nonwoven as the substrate, but with variation
applied voltage, compared with commercial nonwoven (Novatexx 2429) at average
pressure drop of 350 Pa. .............................................................................................73
Figure 4.22 Water flux of PES electrospun membranes prepared by using conditions,
a flow rate of 20 µL/min, a spinneret diameter of 0.8 mm, a speed of substrates
moving of 2.2 cm/min, 65% RH and using PET nonwoven as the substrate with
variation applied voltage and distance between spinneret-to-collector in process. .75
Figure 4.23 Correlation between mean pore size with water flux of electrospun
membranes tunable by preparations condition. .........................................................76
Figure 4.24 Water filtrate flux during the measurement of rejection efficiency with
silica nanoparticles (size 35 nm) for PES electrospun membranes by using conditions,
applied voltage of 18 kV, a spinneret-to-collector distance of 10 cm, a flow rate of 20
µL/min, a spinneret diameter of 0.8 mm, a speed of substrates moving of 2.2
cm/min, 65% RH and served the PET nonwoven as the substrate, compared with
commercial membrane ( PES 12F Membrana). ...........................................................77

xiii
Figure 5.1 Morphology of electrospun membrane prepared from 22% PES with 5%
Pluronic, using the processing condition i.e., an applied voltage of 18 kV, a flow rate
of 20 µL/min, a spinneret-to-collector distance of 10 cm, a spinneret diameter of 0.8
mm, moving speed of substrate of 2.2 min/cm, 65% RH and PET nonwoven served
as the substrate. ..........................................................................................................83

xiv
List of Tables
Table 2.1 Influences of parameters in electrospinning process on the fiber
morphology .................................................................................................................... 8
Table 2.2 Pressure driven membrane processes ........................................................ 29
Table 2.3 Properties and filtration performance of electrospun microfiltration
membranes ..................................................................................................................33
Table 4.1 Viscosities of PES solutions in NMP at room temperature. ........................ 47
Table 4.2 Fiber diameter of electrospun membranes with variation applied voltage in
process ........................................................................................................................ 56
Table 4.3 Fiber diameter of electrospun membranes with variation distance
between spinneret-to-collector in process .................................................................58
Table 4.4 Correlation between area and thickness with basic weight of electrospun
membranes tunable by preparations condition (note: the length of the membrane is
30 cm in all cases)…………………………………………………………………………………………………..65
Table 4.5 Correlation between thickness and porosity with basic weight of
electrospun membranes tunable by preparations condition…………………………………..68
Table 4.6 Tensile strength and elongation at break of electrospun membranes
which were prepared under conditions, a spinneret-to-collector distance of 10 cm, a
flow rate of 20 µL/min, and a spinneret diameter of 0.8 mm, a speed of substrates
moving of 2.2 cm/min, 65% RH and using PET nonwoven as the substrate but with
variation of applied voltage in electrospinning process………………………………………….69
Table 4.7 Properties and filtration performance of PES electrospun membranes by
using conditions, applied voltage of 18 kV, a spinneret-to-collector distance of 10
cm, a flow rate of 20 µL/min, a spinneret diameter of 0.8 mm, a speed of substrates
moving of 2.2 cm/min, 65% RH and served the PET nonwoven as substrate,
compared to commercial membrane (PES 12F Membrana) and other electrospun
membranes in literature review……………………………………………………………………………..79

1
Chapter 1 Introduction

2
1. Introduction
1.1. Background and motivation
Ultrafiltration (UF) and microfiltration (MF) membranes have become the
main focus as promising separation tool in several industrial processes, covering
fractionation and concentration steps in the food, pharmaceutical and
biotechnological industries, in pure water production and in water and wastewater
treatments. Although many methods have been proposed to improve the separation
performance, the heart of UF and MF processes is the membrane itself. Important
characteristics for achieving high performance UF and MF are high flux in
combination with desired selectivity and low fouling. Because of their mechanical
strength, thermal and chemical stability as well as excellence film forming
properties, sulfone polymers, e.g., polyethersulfone (PES), have been used very
often for the fabrication of high performance commercial MF membranes [1-4].
Nowadays, electrospinning has become a multipurpose technique which is
able to generate fibers with diameters ranging from less than 100 nm to several µm
by creating a continuous filament. The extremely fine electrospun nanofibers make
them very useful in a wide range of advanced applications, covering the following
main application areas: selective liquid filtrations, affinity membranes, e.g. for
recovery of metal ions, tissue engineering scaffolds, sensors, or barrier materials for
energy storage applications. However, nanofiber membranes produced by
electrospinning have several prominent properties such as high surface area to
volume ratio, high porosity and pore size in nanorange. Therefore, electrospun
nanofibers membranes normally impart high efficiency in filtration at relatively small
decrease in water or air permeability without any permanent fouling. As the
porosity of electrospun nanowebs is more than 90%, they are candidates for air
filters and liquid filtration membranes. Moreover, the application of electrospun
nanofibers membranes has yet to make breakthrough in other avenues of
separation than airfiltration, especially in pressure-driven liquid separations, such as
ultrafiltration (UF) and nanofiltration (NF) [5-8].
Thus, in this study, the preparation of polyethersulfone (PES) membranes by
electrospinning technique was studied and nanofiber membranes were produced in
order to compare the properties and performance with commercial MF membranes.
The influence of processing parameter and the treatment of the proto-membrane
formed by electrospinning under different conditions were investigated. Thereby,
we expect that this work will open up the avenue toward the use of nanofibers for
very important applications of separation technology. Of particular interest are
membranes in water purification, e.g., pre-filters to minimize contaminations and
fouling prior to UF or NF.

3
1.2 Objectives of the research
The objectives of this research are: 1.2.1 To establish and optimize the preparation of nanofiber and electrospun membranes.
1.2.2 To investigate the influence of polymer concentration, electrical potential,
spinneret-to-collector distance, relative humidity in electrospinning process on the
resulting membrane properties and performance.
1.2.3 To study the treatment of the proto-membrane formed by electrospinning
under different conditions, i.e., drying at controlled relative humidity and
temperature or immersion in an aqueous coagulation bath.
1.2.4 To test and characterize electrospun membrane properties and separation
performances in air and water filtration.
1.3 Scope of the thesis
The structure of this Ph.D. thesis consists of 5 chapters including:
Chapter 1 – Introduction
Chapter 2 – Theory and literature review: including the brief contents regarding
electrospinning technique and the influence of parameters in process and
application of electrospun nonafiber. However, this chapter will be focused on
filtration application area.
Chapter 3 – Experimental: the experimental part of the study including preparation
of electrospun nanofiber membranes and characterization the properties and
performance of electrospun membranes.
Chapter 4 – Results and discussion: this chapter mainly deals with the results of the
optimization of the electrospun nanofiber membranes including the influence of
various parameters in electrospinning process on the resulting membrane properties
and performance as well as the results of the characterization the properties and
performance of electrospun membranes.
Chapter 5 – Conclusions and outlook: the results of this study will be summarized.
Furthermore, the outlook of the current Ph.D. study is to modify the PES nanofiber
membranes surface by macromolecular additives to the electrospinning solution.

4
Chapter 2 Theory and Literature Review
5
2. Theory and literature review
2.1 Electrospinning process background
Electrospinning process can produce the diameter of polymeric fibers from
micrometer (10-100 µm) to sub-microns or nanometer (0.01 - 0.1 µm). That led to
create some special characteristics such as high surface area to volume ratio (as
large as 103 times of microfiber), high porosity and pore size in nanorange. The
extremely fine electrospun nanofibers make them very useful in a wide range of
advanced applications, covering the following main application areas: selective
liquid filtrations, affinity membranes, e.g. for recovery of metal ions, tissue
engineering scaffolds, sensors, or barrier materials for energy storage applications.
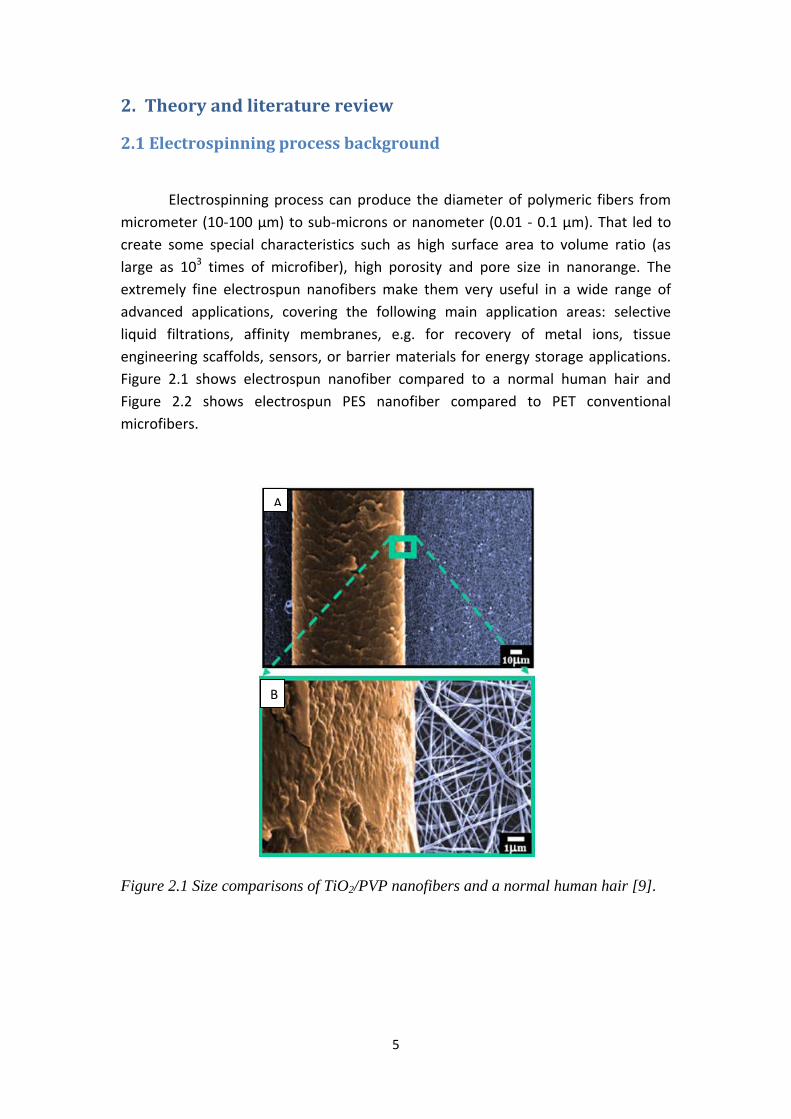
Figure 2.1 shows electrospun nanofiber compared to a normal human hair and
Figure 2.2 shows electrospun PES nanofiber compared to PET conventional
microfibers.
Figure 2.1 Size comparisons of TiO2/PVP nanofibers and a normal human hair [9].
A
B

6
Figure 2.2 Electrospun PES nanofibers compared to PET microfiber [result of
experiment during this Ph.D. project].
The basic electrospinning instruments include of a power supply, a spinneret
or needle of small diameter, an electrode collector and a capillary tube for polymer
as presented in Figure 2.3
Figure 2.3 Schematic view of electrospinning instrument.
In the electrospinning process a high voltage power supply is used in order to
create an electric field between a polymer solution held by its surface tension at the
end of a capillary tube and an electrode collector. A charge is induced on the surface
of the polymer solution by electric field. As the intensity of the electric field
increases, the hemispherical surface of the solution at the tip of the capillary tube

7
elongates to form a conical shape known as Taylor cone. When the electric field
increases and reaches a critical value at which the repulsive electric force overcomes
the surface tension force, a charged jet of the solution is ejected from the tip of the
cone, as the jet flies in air, its diameter decreases as a result of the stretching and
solvent evaporation, resulting in a nonwoven web of randomly oriented fibers with
diameters on the nanometer scale [10-19].
(a) (b)
Figure 2.4 The development of the cone-jet in electrospinning, (a) photograph of
polyvinyl alcohol solution showing a fiber being electrospun from a Taylor cone [12],
(b) the evolution of the shape of a meniscus of polyethylene oxide–water solution
under an electric field [18]. The meniscus is first transformed to a conical shape by
the applied electric potential (b.1, b.2). The rounded tip then becomes sharper (b.3),
and a jet is finally emitted from the tip of the cone (b.4). Then, the shape of the cone
was changed back to a new, stable rounded shape (b.5), which persists as long as the
solution carried away by the jet is replaced by fluid flowing into the meniscus (b.6).
2.2 Influence of parameters in electrospinning process
The polymer is generally processed in the molten state at temperatures 30 –
50 °C above the melting point and the most thermoplastics have low melting
temperatures (100 – 200 °C). Basically, the polymer is heated to the melt state by
the screw extruder and then shaped under high pressure and finally cooled down to
room temperature (below Tg or Tm) to preserve its shape. In addition, the melt
viscosity is an important factor in polymer processing [13].
An alternative is electrospinning of polymer solutions. For electrospinning
process, many parameters (e.g., polymer solution, electrical potential, distance
between spinneret and collector, humidity and temperature) can influence to
properties and performance of electrospun nanofiber. It is possible to create
nanofibers with different morphology, pore size, thickness and etc. by varying these
1 2 3
4 5 6

8
parameters. The influences of parameters in electrospinning process on the fiber
morphology are summarized in Table 2.1.
Table 2.1 Influences of parameters in electrospinning process on the fiber
morphology [18-44,102].
Parameter Effect on fiber morphology
Viscosity (polymer solution) ↑
Fiber diameter ↑ (from beads to beaded fibers to smooth fibers)
Surface tension ↑ Number of beaded fibers and beads ↑
Solution conductivity ↑ Fibers diameter ↓
Evaporation of solvents↑ Fibers exhibit microtexture (pores on fiber surfaces)
Applied voltage ↑ Fiber diameter ↓ initially, then fiber diameter↑ (not monotonic)
Spinneret to collector distance ↑
Fiber diameter ↓ (beaded morphologies occur if the distance between the capillary and collector is too short
Humidity ↑
Fiber diameter ↓ (pores on fiber surfaces), then fiber diameter ↑
Flow rate ↑
Fiber diameter ↑ (beaded morphologies occur if the flow rate is too high)
2.2.1 Electrospinning from polymer solution
2.2.1.1 Polymer concentration
Generally, the molecular weight of the polymer influences the viscosity of
the solution and when a polymer of a lower molecular weight was dissolved in a
solvent, its viscosity will be lower than a polymer of a higher molecular weight. One
of the conditions necessary for electrospinning to occur where fibers are formed is
that the solution must consists of polymer of sufficient molecular weight and the
solution must be of sufficient viscosity [14]. During electrospinning when the jet
leaves the needle, the polymer solution is stretched as it deposits towards the
collector plate. However, increasing the polymer concentration led to increasing the
viscosity of the polymer solution, an increased in the concentration results in greater
9
polymer chain entanglements of the solution that is essential to maintain the
continuity of the jet during electrospinning [15]. Furthermore, the chain
entanglement of polymer had a significant impact on whether resultant breaks up
electrospun beads-fiber form or fibers with small droplets [15,16]. Besides,
increasing viscosity of polymer solution at too high values, it will make difficult to
pump the solution through the capillary tube as well as the polymer solution will dry
at the tip of the needle before begin electrospinning process [15,17].
In the literatures, there are several experiments that have shown that the
viscosity of solution at a low values led to beads or spherical particles connected by
fiber. Whereas, increasing the viscosity of polymer solution led to the shape of the
beads change from spherical to spindle-like until well-defined nanofiber is achieved
[18 – 26,31].
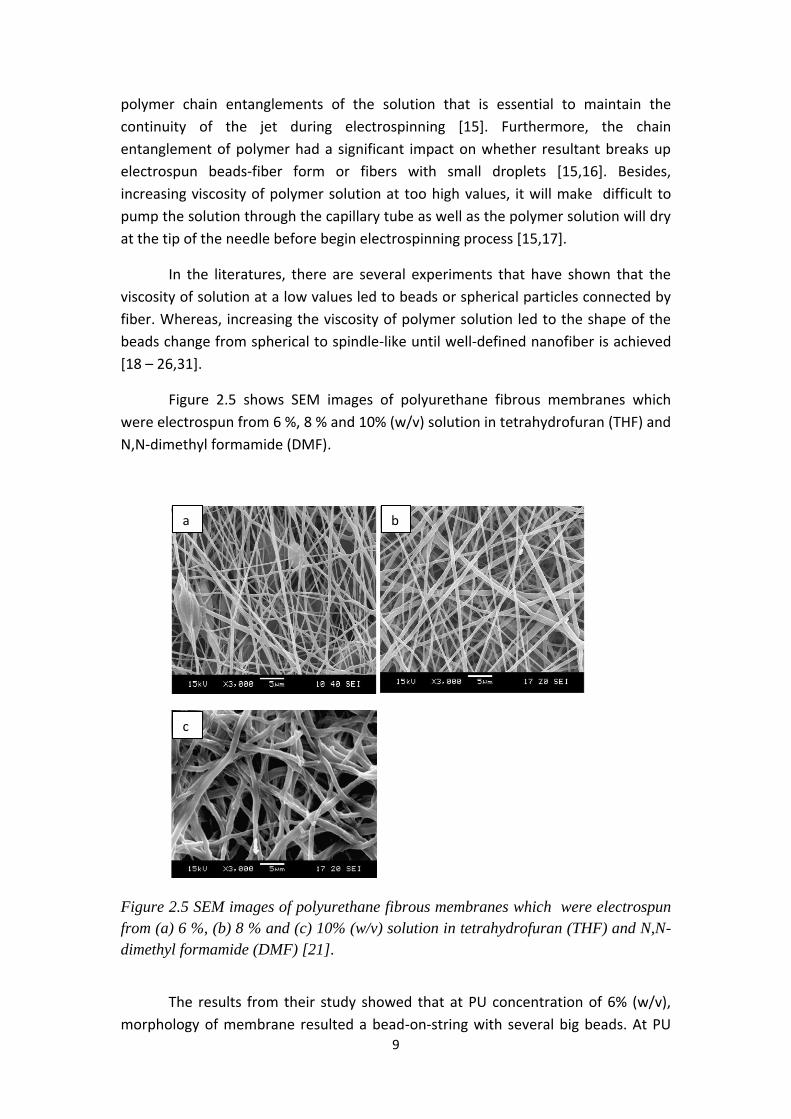
Figure 2.5 shows SEM images of polyurethane fibrous membranes which
were electrospun from 6 %, 8 % and 10% (w/v) solution in tetrahydrofuran (THF) and
N,N-dimethyl formamide (DMF).
Figure 2.5 SEM images of polyurethane fibrous membranes which were electrospun
from (a) 6 %, (b) 8 % and (c) 10% (w/v) solution in tetrahydrofuran (THF) and N,N-
dimethyl formamide (DMF) [21].
The results from their study showed that at PU concentration of 6% (w/v),
morphology of membrane resulted a bead-on-string with several big beads. At PU
a b
c

10
concentration of 8%, the shape of the beads became spindle like and the fibers were
smooth and homogeneous without beads in fiber. Nevertheless, when PU
concentration increased from 8% to 10% (w/v), the electrospun membrane became
thicker and resulted a film-like structural as shown in Figure 2.4 [21]. Furthermore,
the electrospinning solution parameter affects to the diameter of nanofiber as well.
When the viscosity increased with increasing of polymer concentration led to the
average fiber diameter increased. Therefore, the viscosity of polymer solution was
the main factor affecting the average diameter of nanofibers as well as the
formation of fiber [21,25 - 28].
Tang et al. [24] have investigated the influence of polyethersulfone
concentration in electrospinning as PES was dissolved in a mixture of DMF and NMP.
Thereafter, the 18% and 20% PES solutions was electrospun by using condition
electrospinning, i.e., voltage of 30 kV, distance between spinneret and rotating drum
collector of 10.5 cm. The result indicated that when the PES concentration increased
from 18% to 20%, the average of fiber diameter increased from 134 nm to 183 nm,
respectively.
2.2.1.2 Surface tension
In electrospinning, the charges on the polymer solution must be high enough
to overcome the surface tension of the solution. As the solution jet accelerates from
the tip of the source to the collector, the solution is stretched while surface tension
of the solution may cause the solution to breakup into droplets [15]. However, some
solvent such as ethanol was a low surface tension thus it can be added to promote
the formation of good fiber geometry [19]. Another way is to add surfactant, which
is a powder, to the polymer solution. The polymer solution was added the powder
surfactant resulted more uniform nanofiber and the diameter of fibers are also
improved [19,29].
2.2.1.3 Polymer solution conductivity
The polymer solution conductivity determines the charge carrying capacity in
a jet and thus influences the tensile forces exerted on the jet by the electric field. A
higher stresses on the jet induced by higher conductivities generally result in
reduced fiber diameters. The increased amount of charge forces the jet to elongate
as a consequence of columbic repulsion. These forces act against surface tension,
hence suppressing the Rayleigh instability favoring formation of non-beaded fibers.
Salt additives in electrospinning solutions create migrating ions in solution that
11
transport charges and on tribute to higher conductivities [17,31]. Zong et al. [17]
investigated also the effect of ions by adding ionic salt on the morphology and
diameter of electrospun fibers. The results shown that PDLA fibers with adding ionic
salts, here KH2PO4, NaH2PO4, and NaCl, produced beadless fibers and the diameter
of fiber was ranging from 200 to 1000 nm. While, Baumgarten et al.[30] found that
the jet radius varied inversely as the cube root of the electrical conductivity of the
solution.
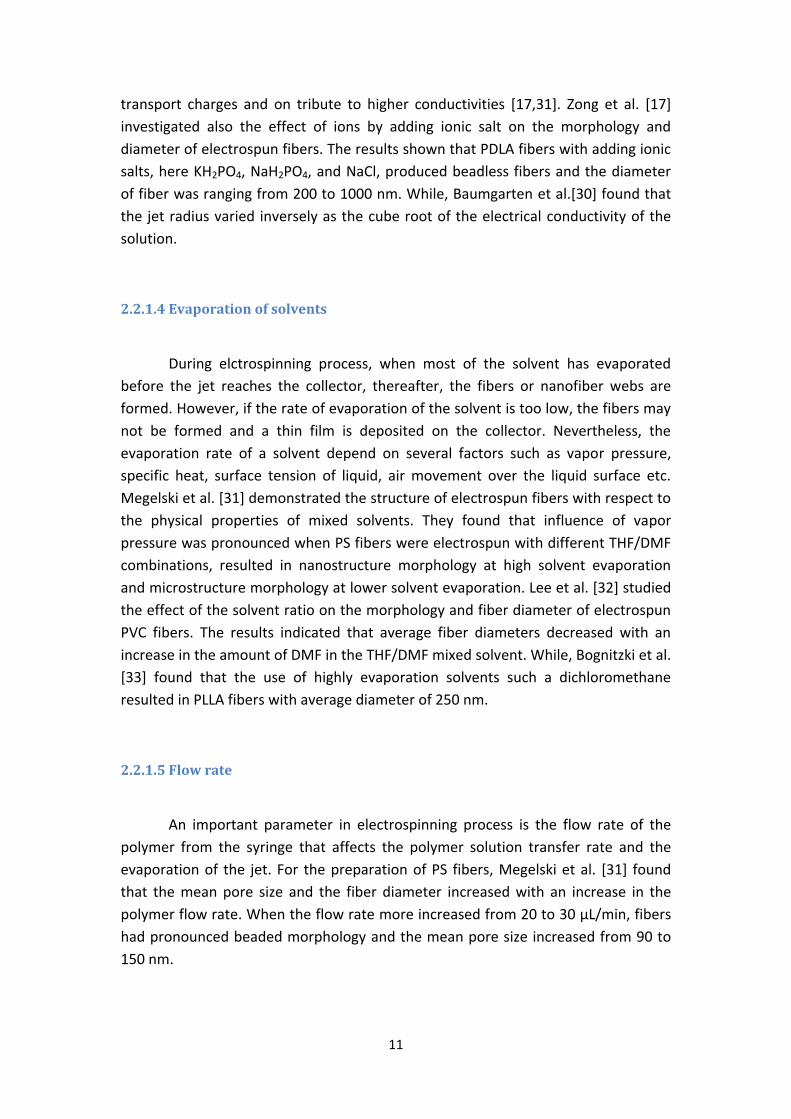
2.2.1.4 Evaporation of solvents
During elctrospinning process, when most of the solvent has evaporated
before the jet reaches the collector, thereafter, the fibers or nanofiber webs are
formed. However, if the rate of evaporation of the solvent is too low, the fibers may
not be formed and a thin film is deposited on the collector. Nevertheless, the
evaporation rate of a solvent depend on several factors such as vapor pressure,
specific heat, surface tension of liquid, air movement over the liquid surface etc.
Megelski et al. [31] demonstrated the structure of electrospun fibers with respect to
the physical properties of mixed solvents. They found that influence of vapor
pressure was pronounced when PS fibers were electrospun with different THF/DMF
combinations, resulted in nanostructure morphology at high solvent evaporation
and microstructure morphology at lower solvent evaporation. Lee et al. [32] studied
the effect of the solvent ratio on the morphology and fiber diameter of electrospun
PVC fibers. The results indicated that average fiber diameters decreased with an
increase in the amount of DMF in the THF/DMF mixed solvent. While, Bognitzki et al.
[33] found that the use of highly evaporation solvents such a dichloromethane
resulted in PLLA fibers with average diameter of 250 nm.
2.2.1.5 Flow rate
An important parameter in electrospinning process is the flow rate of the
polymer from the syringe that affects the polymer solution transfer rate and the
evaporation of the jet. For the preparation of PS fibers, Megelski et al. [31] found
that the mean pore size and the fiber diameter increased with an increase in the
polymer flow rate. When the flow rate more increased from 20 to 30 µL/min, fibers
had pronounced beaded morphology and the mean pore size increased from 90 to
150 nm.

12
2.2.2 Electric field
The electric field (applied voltage) is a parameter of electrospinning
processing that could influence behavior. In this context, Fridrikh et al. [34] and
Bahners et al. [35] reported a model for the stretching of a viscous charged fluid in
an electric field. The model predicts that there is a limiting diameter for the fluid jet,
which arises from a force balance between surface tension and electrostatic charge
repulsion. Charge separation in the polymer and acceleration is induced by the force
[35];
(2.1)
Where F is the force
q is the charge
E is the electric field strength
Figure 2.6 Conventional electrical setup for electrospinning as, (a) reported by
Fridrikh et al. [34] and (b) modified setup for more homogeneous field geometry as
studied by Bahners et al. [35].
In order to estimate the charge separation force in the case of the tip-
collector-geometry, as show in Figure 2.6(a), one needs to calculate the local field
strength E1 at the surface of a droplet of polymer solution at the capillary tip.
r1
r2

13
(2.2)
In general, σ(x,y,z) is a charge distribution
r is effects in a distance
is the permittivity
If a point charge is assumed in the center of the spherical droplet at the
capillary,
(2.3)
Where Q is the total charge
r is the distance from the tip
Hence, the field E1 is very large near the tip, i.e. r ----> 0. In the actual
experiment, a droplet of radius rd will form at the capillary. The radius rd depends on
the diameter of the capillary (radius rc), the surface tension and the flow of the
solution. The flow is often driven by gravitation force. If a droplet of a radius rd = rc is
assumed in a first approximation, the field E1 at the surface of the droplet can be
estimate to,
(2.4)
In order to calculate the total charge, one has to consider the field at the
counter electrode. For the plate geometry, Bahners et al. [35] explained that the
field can be assumed to be near homogeneous, i.e.,
(2.5)
14
At the plate, respectively, A2 denotes the area of the plate of the plate, i.e.
for a disc electrode of radius r2. If the distance d between capillary tip
and plate is large compared to the disc diameter and V is the voltage, E2 is given by
V/d and
(2.6)
Using eq. (2.4) and eq. (2.6), the field strength at the surface of the droplet
can be estimated to
(2.7)
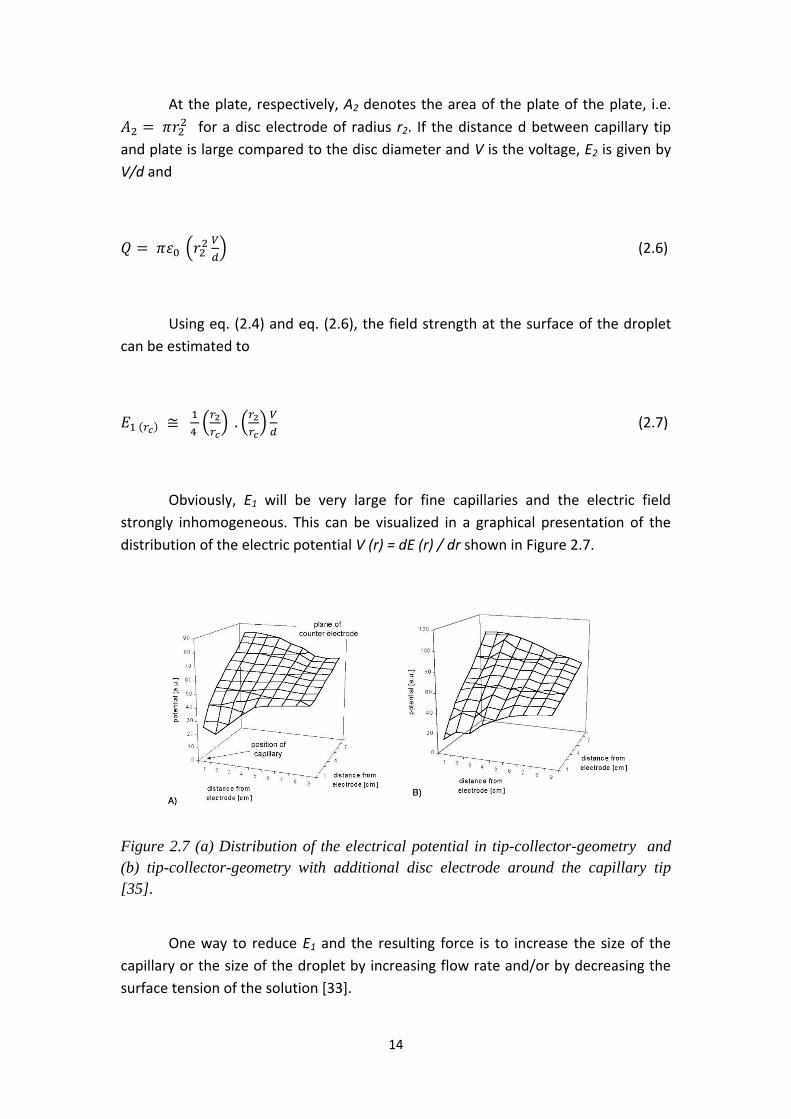
Obviously, E1 will be very large for fine capillaries and the electric field
strongly inhomogeneous. This can be visualized in a graphical presentation of the
distribution of the electric potential V (r) = dE (r) / dr shown in Figure 2.7.
Figure 2.7 (a) Distribution of the electrical potential in tip-collector-geometry and
(b) tip-collector-geometry with additional disc electrode around the capillary tip
[35].
One way to reduce E1 and the resulting force is to increase the size of the
capillary or the size of the droplet by increasing flow rate and/or by decreasing the
surface tension of the solution [33].
15
In order to discuss a collector-collector-geometry, the circular collector
electrodes with radii r1 and r2 were considered. The capillary is positioned in the
center of one of the collector, as shown in Figure 2.7 (b). Neglecting boundary
effects, the field E1 at the capillary opening in collector 1 can be approximated with
an expression similar to eq. (2.5) giving
(2.8)
According to eqs. (2.7) and (2.8), E’1 is smaller than E1 by a factor
. The reduced inhomogenity of the field is accordingly mirrored in the
distribution of the potential of the electric potential V(r) = dE (r) / dr (Figure 2.6b).
For disc electrode of identical diameter as investigated by Fridrikh et al. [32], i.e. r2 =
r1, the field is completely homogeneous. It is increasingly inhomogeneous with
decreasing radius ratio r2/r1 .
In addition, Bahners et al. [35] have been investigated the effect of the field
geometry to fiber diameter of polycaprolactone nanofibers by using a setup model
in Figure 2.5 (a) and (b). A first electrospinning experiments was set by using the tip-
collector-geometry and a 0.45 mm capillary was used in the process. The counter
electrode was a disc with a diameter of 60 mm. The results showed that fiber
diameter of 350 nm were obtained with a concentration of 14%, an applied voltage
of 14 kV and a distance (d) of approximately 16 cm, i.e. E2 = 0.875 kV/cm (cf. eq.
2.5). In case of a droplet of the polymer solution of a diameter equal to the capillary
size is assumed, eq. 2.5 gives field strength at the surface of the droplet of
approximately 15,000 kV/cm. Using these experimental parameter was employed
for the plate-plate-setup (cf. Figure 2.6 (b)). Around the capillary, disc electrodes of
various diameters were employed, which ranged from 20-60 mm and diameter of
the counter electrode was 66 mm. The morphology presented very fine fiber with
the modified field geometry. Due to the more homogeneous electric field near the
capillary tip, a constant flow without sudden breakage is obtained. As a
consequence, the fiber diameter is nearly constant over great lengths. However, the
optimum diameter of the disc electrode turned out to be 20 mm and the
experimental parameters were varied for optimization. The best results were
obtained with a concentration of 6% PCL in methylene chloride, at 20 kV and a
distance of 15 cm from capillary tip to counter electrode. Neglecting boundary
effect, the field at the capillary is only E1 = 12 kV/cm in this case.
16
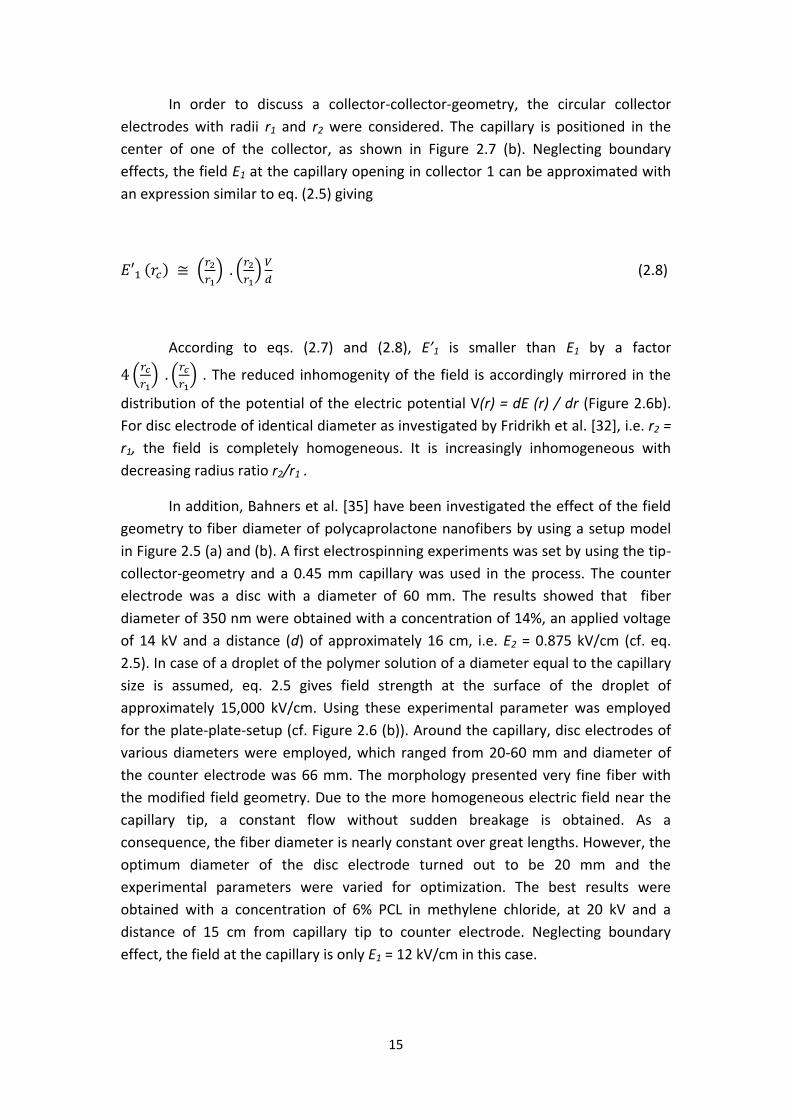
Figure 2.8 Optical micrographs of electrospun PCL fibers. Spinning condition were:
13% PCL in methylenchoride, 16 kV and 19 cm distance from capillary tip to counter
electrode. (a) tip-plate-geometry and (b) with additional disc electrode around the
capillary tip [35].
Generally, at applied voltage of more than 6 kV, the solution drop at the tip
of the needle can be changed to become deformed into the Taylor Cone shape [36].
Increasing electric charge will cause the jet to accelerate faster and more volume of
solution will be drawn from the tip of needle. This may yield in smaller Taylor cone
shape [37]. Most results indicated that high voltage lead to greater stretching of the
polymer solution due to the stronger electric field. These have the effect of
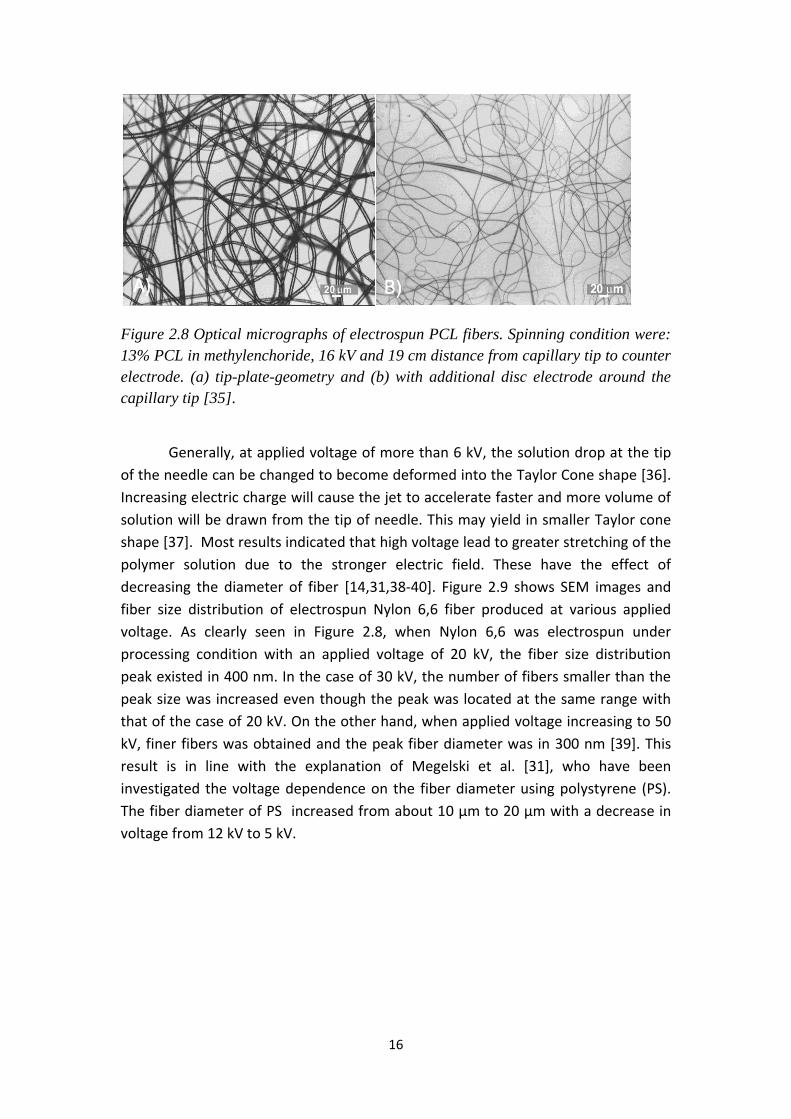
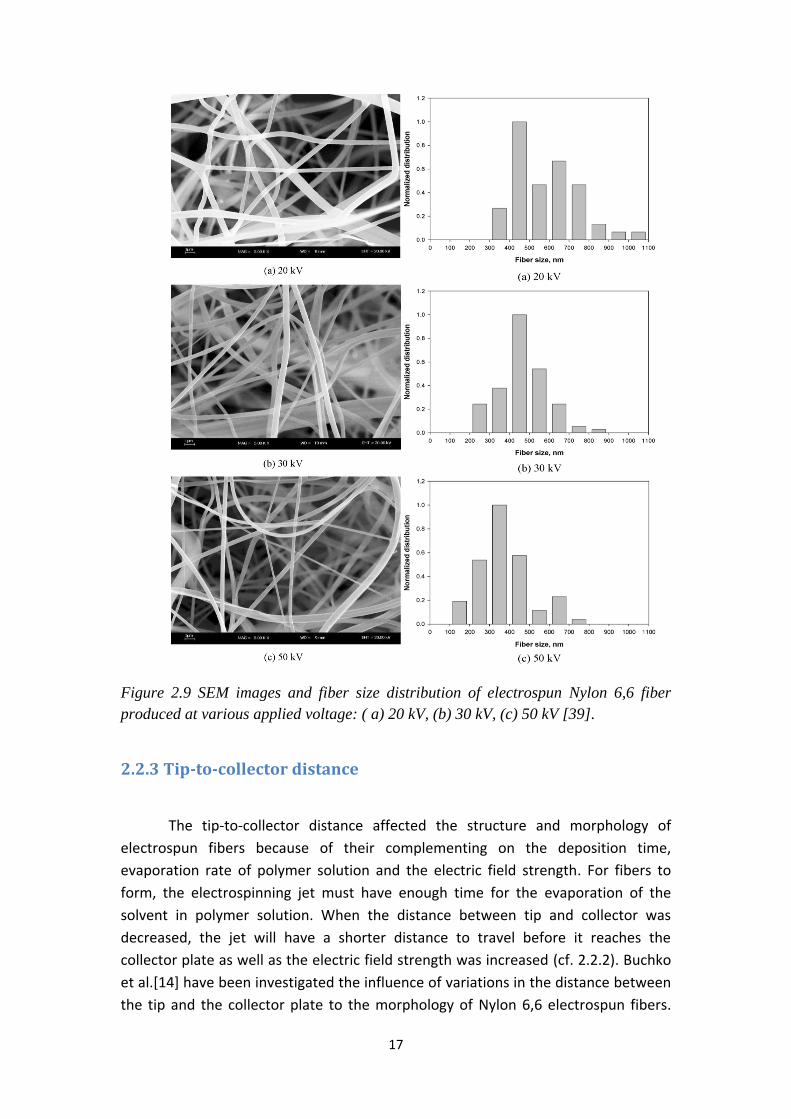
decreasing the diameter of fiber [14,31,38-40]. Figure 2.9 shows SEM images and
fiber size distribution of electrospun Nylon 6,6 fiber produced at various applied
voltage. As clearly seen in Figure 2.8, when Nylon 6,6 was electrospun under
processing condition with an applied voltage of 20 kV, the fiber size distribution
peak existed in 400 nm. In the case of 30 kV, the number of fibers smaller than the
peak size was increased even though the peak was located at the same range with
that of the case of 20 kV. On the other hand, when applied voltage increasing to 50
kV, finer fibers was obtained and the peak fiber diameter was in 300 nm [39]. This
result is in line with the explanation of Megelski et al. [31], who have been
investigated the voltage dependence on the fiber diameter using polystyrene (PS).
The fiber diameter of PS increased from about 10 μm to 20 μm with a decrease in
voltage from 12 kV to 5 kV.
17
Figure 2.9 SEM images and fiber size distribution of electrospun Nylon 6,6 fiber
produced at various applied voltage: ( a) 20 kV, (b) 30 kV, (c) 50 kV [39].
2.2.3 Tip-to-collector distance
The tip-to-collector distance affected the structure and morphology of
electrospun fibers because of their complementing on the deposition time,
evaporation rate of polymer solution and the electric field strength. For fibers to
form, the electrospinning jet must have enough time for the evaporation of the
solvent in polymer solution. When the distance between tip and collector was
decreased, the jet will have a shorter distance to travel before it reaches the
collector plate as well as the electric field strength was increased (cf. 2.2.2). Buchko
et al.[14] have been investigated the influence of variations in the distance between
the tip and the collector plate to the morphology of Nylon 6,6 electrospun fibers.

18
However, decreasing the distance between tip and collector has the similar
influence as increasing the applied voltage in process and led to increasing electric
field strength as well. Megelski et al. [31] noted that bead formation in electrospun
PS fibers decreased with increasing the tip to collector distance, while the ribbon
shaped morphology would be maintained, when the tip to collector distance was
decreased. Furthermore, Zhang et al. [26] found that when chitosan/PVA was
electrospun at distance between tip and collector of 10 cm, the average diameter of
fibers was 114 ± 35 nm. While with distance between tip and collector of 15 cm, the
amount of beads decreased and the image analyze gave the average diameter of
fiber of 99 ± 21 nm. Thereby, increasing the distance in electrospinning process
resulted in a decrease of the average fiber diameter. Nevertheless, when the
distance was too large resulted ribbon shaped morphology or no fibers deposit on
the collector [41]. That is due to the electrostatic field strength in process is too low.
2.2.4 Humidity
The humidity of the electrospinning environment has an influence in the
polymer solution during electrospinning. At higher humidity leads to more water
molecules are between the tip and collector. These molecules will increase the
conductivity of this region, therefore, changing the properties of the electric field
strength in electrospinning process due to the polarization of water molecules
[24,42]. Hence, the electrospun fiber became thick-diameter due to lose electric
field strength and smaller draw-down force at higher humidity [24,43]. Tang et al.
[24] investigated influence of relative humidity in electrospinning of PES to the
average diameter of fiber and the adhesion strength. They found that high humidity
led to large fibers as the fiber diameter increased from 266 nm (45% RH) to 492 nm
(70% RH) (cf. Figure 2.10) and humidity also affected to the adhesion strength of PES
nanofibers membrane and nonwoven substrate. At low humidity (<45%), the PES
membrane – nonwoven adhesion was low (2.6 psi) and when the humidity was
increased to 50%, the PES membrane – nonwoven adhesion increased to 40.5 psi. In
case of acrylic nanofibers, Baumgarten [44] noted that acrylic fibers electrospun in
an atmosphere of more than 60% relative humidity and resulted to ribbon shaped
morphology.
19
Figure 2.10 SEM image and nanofiber diameter distribution of electrospun
nanofibers of PES/DMF/NMP solution at different relative humidity; a) 45% RH,
mean diameter 266 nm, b) 50% RH, mean diameter 349 nm and c) 60% RH, mean
diameter 382 nm [24].

20
2.3 Application of electrospun nanofibers
The electrospun nanofiber webs have several prominent properties such as
high surface area to volume ratio, high porosity and pore size in nanorange. These
make them very useful in a wide range of applications, covering the following main
application areas, as present in Figure 2.11, such as tissue engineering scaffolds,
wound healing, release control, sensor, affinity membrane and recovery of metal
ions and the most important ones is filtration applications [45-48], However, this
thesis will focus on the researches of filtration application.
Figure 2.11 Main applications of electrospun nanofiber: (a) oil filtration [49], (b) air
filtration [50], (c) sensor [51], (d) wound healing [53] and (e) tissue engineering
scaffolds [54].
2.3.1 Filter structure and function
Filter media can be classified as depth filters, surface filters of adsorptive
filters. The depth filter consists of a fibers web with a wide pore size distribution and
a very open three-dimensional structure. Larger particles become trapped within the
tortuous path created by the maze of fiber. As particles become lodged within the
Electrospun nanofibers
a
b
c
d
e

21
depth filters structure, the openings or channels become narrower and begin to trap
finer and finer particles. Depth filters become more efficient as particles are trapped
within its structure. Moreover, depth filters have high dirt holding capacities,
nominal efficiencies, low initial pressure drops and long life. Compared to surface
filter, it consists of a non-woven with a two-dimensional structure and a uniform or
narrow pore size distribution will generally form a filter cake on its surface. As the
cake forms it performs the majority of the mechanical filtration. As more and more
solids are loaded on the surface of the filter, the pressure drop increases and the
filter becomes more efficiency [55,56].
(a) (b)
Figure 2.12 The cartoon shows an example for the combination of depth and surface
filtration, the large particle are separated via surface filtration in both cases.
Differences are seen for the smallest particles which are trapped (partially) in the
depth (a) and completely on the surface (b) [57].
In general, textile fabrics of varying construction, e.g., woven, knitted,
nonwovens, pile and combinations thereof, find increasing application in fluid
filtration on the background of their complex pore system. This characteristic pore
structure of textile fabrics effect particle separation through different mechanisms,
so called ‘geometric separation’ and ‘impact separation’. In addition, the rather
open geometry of a textile allows for high flow rates. Accordingly, the use of a textile
offers various means to ‘tune’ the separation performance of a filter. Characterized
by the separation function T(d), which gives the percentage of separated particles of
a given size d, the separation performance can be affected by the choice of fabric
construction (yarn geometry, fineness, weave etc.), by combination of fabrics of
similar of differing geometry as well as the flow direction [62,63].
22
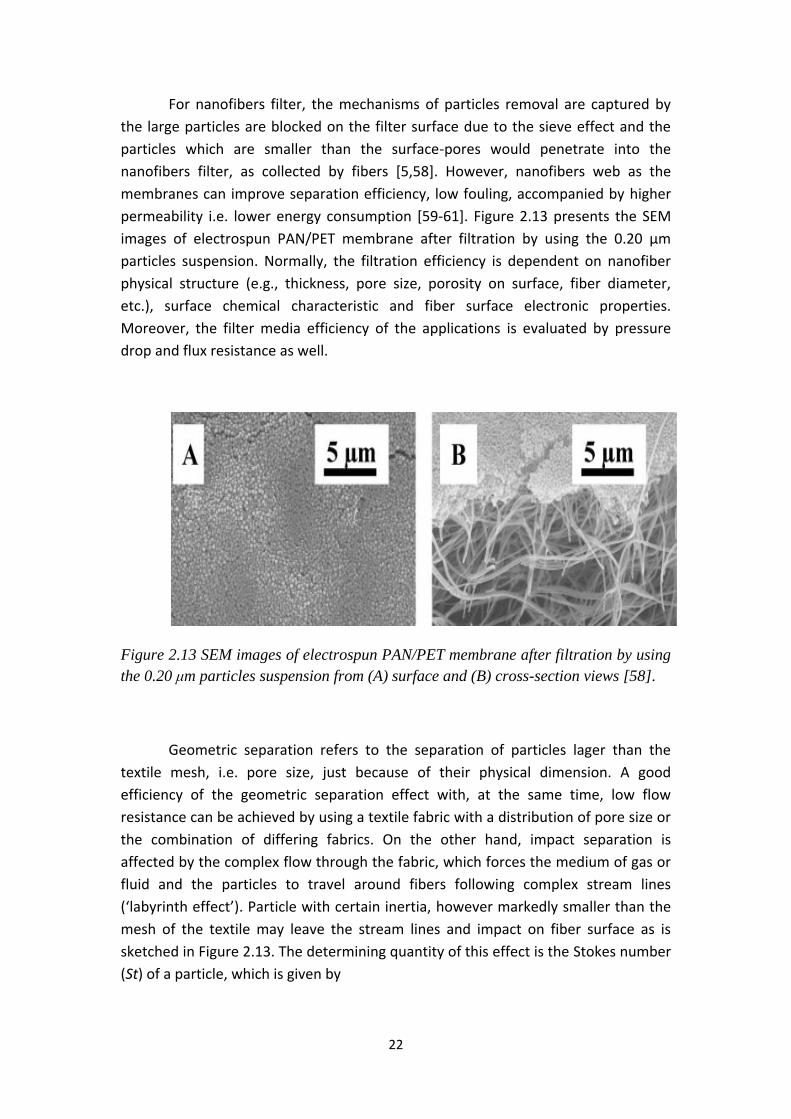
For nanofibers filter, the mechanisms of particles removal are captured by
the large particles are blocked on the filter surface due to the sieve effect and the
particles which are smaller than the surface-pores would penetrate into the
nanofibers filter, as collected by fibers [5,58]. However, nanofibers web as the
membranes can improve separation efficiency, low fouling, accompanied by higher
permeability i.e. lower energy consumption [59-61]. Figure 2.13 presents the SEM
images of electrospun PAN/PET membrane after filtration by using the 0.20 μm
particles suspension. Normally, the filtration efficiency is dependent on nanofiber
physical structure (e.g., thickness, pore size, porosity on surface, fiber diameter,
etc.), surface chemical characteristic and fiber surface electronic properties.
Moreover, the filter media efficiency of the applications is evaluated by pressure
drop and flux resistance as well.
Figure 2.13 SEM images of electrospun PAN/PET membrane after filtration by using
the 0.20 μm particles suspension from (A) surface and (B) cross-section views [58].
Geometric separation refers to the separation of particles lager than the
textile mesh, i.e. pore size, just because of their physical dimension. A good
efficiency of the geometric separation effect with, at the same time, low flow
resistance can be achieved by using a textile fabric with a distribution of pore size or
the combination of differing fabrics. On the other hand, impact separation is
affected by the complex flow through the fabric, which forces the medium of gas or
fluid and the particles to travel around fibers following complex stream lines
(‘labyrinth effect’). Particle with certain inertia, however markedly smaller than the
mesh of the textile may leave the stream lines and impact on fiber surface as is
sketched in Figure 2.13. The determining quantity of this effect is the Stokes number
(St) of a particle, which is given by
23
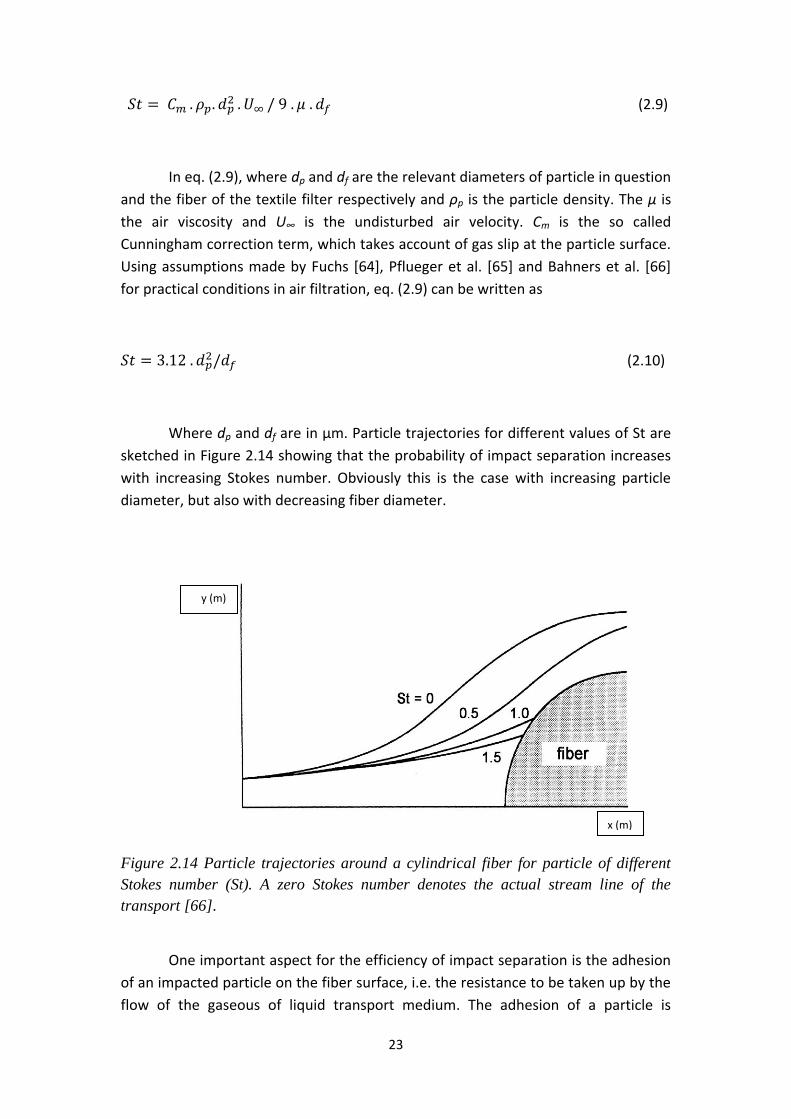
(2.9)
In eq. (2.9), where dp and df are the relevant diameters of particle in question
and the fiber of the textile filter respectively and ρp is the particle density. The µ is
the air viscosity and U∞ is the undisturbed air velocity. Cm is the so called
Cunningham correction term, which takes account of gas slip at the particle surface.
Using assumptions made by Fuchs [64], Pflueger et al. [65] and Bahners et al. [66]
for practical conditions in air filtration, eq. (2.9) can be written as
(2.10)
Where dp and df are in µm. Particle trajectories for different values of St are
sketched in Figure 2.14 showing that the probability of impact separation increases
with increasing Stokes number. Obviously this is the case with increasing particle
diameter, but also with decreasing fiber diameter.
Figure 2.14 Particle trajectories around a cylindrical fiber for particle of different
Stokes number (St). A zero Stokes number denotes the actual stream line of the
transport [66].
One important aspect for the efficiency of impact separation is the adhesion
of an impacted particle on the fiber surface, i.e. the resistance to be taken up by the
flow of the gaseous of liquid transport medium. The adhesion of a particle is
x (m)
y (m)

24
governed by van der Waals interaction, electrostatic force and H-bonding forces, the
hierarchy of these interactions varying with medium and particle size [66].
Bahners et al. [66,67] reported the effect of impact separation by increasing
particle adhesion following surface modification, e.g., micro-roughening by means of
laser treatment. The results of wet filtration efficiency as well as dust separation in
industrial filter facility showed that particle capture especially in the micron-range
could be enhanced by the characteristic surface topography, a rather regular roll-like
structure in the micrometer scale, created by an UV laser treatment of PET fibers. In
SEM analyses of the filter as shows in Figure 2.15, it was observed that a large
amount of very fine grain particles was captured, which would normally not be
captured on the smooth surfaces of commercial filter, which was attributed to very
high adhesion forces acting in the groves of the roll-like surface structure.
Figure 2.15 SEM micrograph of a laser-treated textile filter, PET sieving fabric with
a mesh opening of 10 µm, after wet filtration process [67].
2.3.2 Air filtration
Because the nanofibers filtration is pronounced by higher inertial impaction
and interception than with conventional filtration microfibers, it is offering more
optimum filtration efficiency. In case of air filtration application, the main reason for
increasing attention for usability is its very high surface area of the nanofibers
facilitating adsorption of dust or contaminant from the air [68]. For a commercial air
filter is produced by Donaldson company (Figure 2.16).

25
Figure 2.16 Commercial air filter is produced by Donaldson company [69].
Aerosol filtration is most widely applied for sampling and air cleaning. It is
also utilized in a variety of industries such as air cleaning of smelter effluents,
processing of nuclear and hazardous materials, respiratory protection and particle
collection in clean rooms [70-72]. In particular, nanofibers filters have been widely
used to separate aerosol particles/solid from air flow stream because of their low
material cost [71], high filtration efficiency, maintaining a relative low resistance to
the air flow [72], lower energy consumption [73], longer life and easy maintenance
[74].
Several studies have investigated the filtration efficiency of electrospun
nanofiber as filter media and they found that the possible ways to improve filtration
efficiency are (i) to fabricate fine fiber with diameter down to nano-scale, (ii) to
produce the multiple thin layer of nanofiber filter and (iii) to control the orientation
distribution on filter structure [73-78]. Leung et al. [79] reported that under
continuous loading of sub-micron aerosol, filtration efficiency of nanofiber filter was
much better than microfiber filtration as well as the pressure drop of nanofiber filter
rises much faster than microfiber filtration. Polyacrylonitrile (PAN) nanofibers with
mean diameters in 270 – 400 nm rang were produced by Yun et al. [72] in order to
compare to commercial filters made of polyolefin fiber and glass fiber. The
performance of PAN nanofiber filters were tested the penetration of mono-disperse
NaCl nanoparticles (below 80 nm in size) through the filters. The results showed that
the penetration of nanoparticles through PAN electrospun filters reduced by
increasing the diameter of nanofibers as well as decreasing filter thickness.
However, the penetration of nanoparticles through PAN electrospun filter was in
better agreement with theoretical predictions than was the measured penetration
through commercial filters. Recent study by Leung et al. [80] presented that the PAN
nanofiber filter, with fiber diameter of 98 – 300 nm, have higher efficiency and
Synthetic nanofibers
Cellulose fibers

26
quality factor than microfiber filter at clean state. On the other hand, microfiber
filter, which was much thicker, has higher NaCl nanoparticles holding capacity under
continuous loading of sub-micron aerosol, as justified from its much lower pressure
drop increase rate than nanofiber filter. The multi-layer of microfiber filter reduced
the pressure drop over time compared to a layer of PAN nanofiber. The novel
alumina nanofiber for effective removal and retention of Escherichia coli
bacteriophage (MS2) aerosol was demonstrated by Li et al. [77]. They found that the
physical removal efficiency of alumina nanofiber was 94.3% with diameter of MS2
aerosol in the 10 - 400 nm range. While it is viable removal efficiency was 98.8% and
yielding higher filter efficiency than HEPA commercial filter. However the pressure
drop of HEPA commercial filter was higher than alumina nanofiber and the viruses
were effectively retained in the nanofiber filter due to electrostatic attraction.
Furthermore, the performance of alumina nanofiber was not affected by RH change.
In order to improve the filtration performance, several recent studies the
filtration efficiency of multiple layers of nanofiber, Podgorski et al. [73] have
developed melt-blown technique for producing nanofiber filter (made by the fibers
diameter of 300 nm) in order to improve the filtration efficiency of the most
penetrating aerosol particles (MPPS) in fibrous filters and the nanofiber filters and
commercial filter were measured the pressure drop and efficiency of removal of
aerosol particles with diameter 10 - 500 nm. Their results confirmed the many-layer
nanofibers filter combined with a single microfibers backing layer filter have
significantly increased efficiency at the MMPS and the pressure drop rises
moderately as compared to conventional microfiber filter. Vaisniene et al. [82] have
electrospun nanofiber from 8% polyvinyl alcohol (PVA) for gas filtration. Thereafter,
three types of samples of PP nonwoven material without nanofiber filter, PP
nonwoven material with different of thickness of nanofiber filter (the mean
thickness of nanofiber of 250 nm and 300 nm, respectively) were chosen for
measuring air permeability and gas filtration of cigarette smoke. They reported that
nonwoven material with different of thickness of nanofiber filter have a lower air
permeability than without nanofiber filter. A higher fiber diameter of nanofiber
filaments makes the filter more effective. The PVA nanofiber filter, as for cigarette
application, was effective for holding organic compound with polar O-H or N-H
groups, carbonyl group (>C=O) containing compounds, ether (C-O) and compounds
with C-N bonds. IR spectrum of nonwoven without a PVA nanofiber filter before
cigarette smoke filtering was similar after filtered. It indicated that those nonwovens
are not effective with respect to the efficiency of filtration. Zhang et al. [76]
improved the filtration performance by using multiple thin layers of PAN nanofiber
mats. The filtration test results showed that the multi-layer nanofiber mat structure
had a filter efficiency factor much higher than the single thick layer nanofiber mat
tested under the same conditions. In particular, the sandwiched multi-layer of PAN

27
nanofiber mat exhibited a higher quality than the conventional glass fiber HEPA
(high efficiency particulate air) filter.
Effect of face velocity, nanofiber packing density and thickness on filtration
performance and pressure drop of filters was investigated by Leung et al. [83]. For
the experimental, they fabricated the nanofiber filters by electrospinning
polyethylene oxide (PEO) nanofiber (mean fiber diameter of 208 nm) on microfiber
substrate, thereafter, the nanofiber layer of the same packing density but different
thickness was designed. The filtration performance of nanofiber filters decreases,
when face velocity was increased from 5 to 10 cm s-1and the reduction became lager
at smaller particle size especially for the particles size below 100 nm. However, the
most penetrating particle size decreased from 140 to 90 nm when nanofiber packing
density increased from 3.9 to 36 x 10-3 g/cm3. In addition, the effect of nanofiber
layer thickness has less prominent effect on most penetrating particle size than that
of nanofiber packing density and the filtration efficiency increases in a decreasing
rate with respect to pressure drop. It indicated that nanofibers being deposited into
single layer elevate the pressure drop without improving the filtration performance
of filters. However, the efficiency of filters and reducing pressure drop can be
improved by distributing the same amount of nanofibers thinly through stacking up
multiple filter, called as “multi – layering”. Recently, Pantanaik et al. [74] also
composited PEO nanofiber mat with a microfiber nonwoven by sandwiching
structure of filters. They found that the filtration efficiency was decreased and the
pressure drop was increased after cyclic compression for the PEO nanofiber
deposited over nonwoven, whereas, changes were not significant in composite PEO
nanofiber mat with a microfiber nonwoven by sandwiching structure. Composite
PEO nanofiber by sandwiching structure showed high efficiency for long term
application. Wang et al. [83] combined a microfiber mat with a nanofiber (fiber
diameter of 150 nm) mat to a micro/nanocomposite fibrous filter structure. The
microfiber nonwoven used as the nanofiber support and the nanofiber mat acted as
the collection layer facing the airstream containing aerosols particles and four
nanofiber mat with different solidities (packing densities) were used in this
structure. The filtration efficiency of the combined microfiber mat with a nanofiber
presented close to conventional HEPA or HVAC filters. Besides when collecting the
aerosol particles of 300 nm resulted to have a better filtration efficiency than those
conventional filters.
Alternatively, recent researches [73,84] has also reported an advanced melt-
blown technique for better nanofiber filters production. The main advantages of this
technique are well-defined fiber structure, higher production rate, lower emission of
toxic vapor wastes and higher filtration quality at lower basis weight of filters. In one
recent study by Hassan et al. [84], the polypropylene polymer was fabricated by
using melt-blown technique. They reported the polypropylene nanofibers with an

28
average fiber diameter in the range of 300 - 500 nm by using melt-blown technique
were obtained. Thereafter, those nanofiber mats were measured the fiber diameter,
air permeability and aerosol (dioctylphtalate, the particles diameter range of 10 -
800 nm) filtration efficiency, respectively. Airflow through nanofibers mats resulted
much higher air permeability as well as these nanofiber filters exhibited a higher
quality filtration, at low basic weight, than the commercial fiber glass filter.
2.3.3 Water filtration
2.3.3.1 Membrane classification
A membrane is a selective barrier between two phases [85]. Depending on
the application, different membrane morphologies will be used. Several types of
membrane separation mechanisms exist. In membrane applications where the
solution diffusion mechanism plays the major role, the membrane material is chosen
based on the selective sorption and diffusion properties, membrane morphology will
be not the main factor to affect the selectivity but it is still important as regarding to
total flux. A schematic representation of various morphologies is given in Figure
2.17.
Figure 2.17 Schematic representation of different membrane morphologies [85].
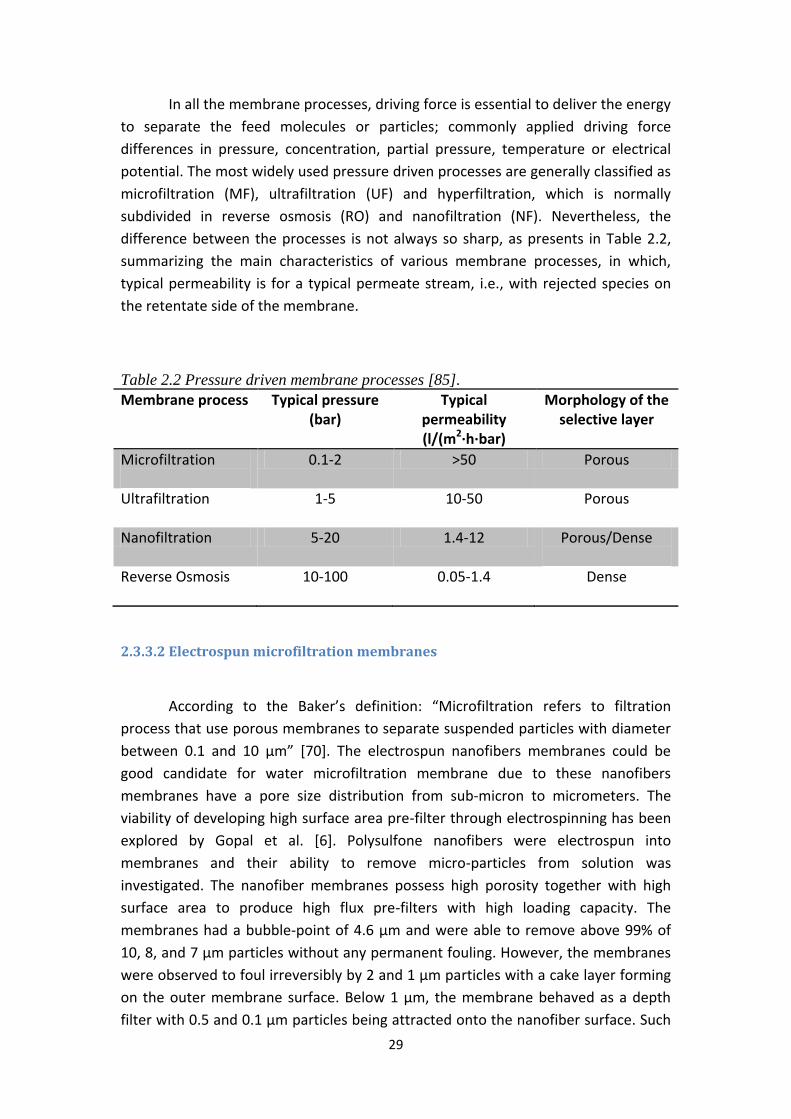
29
In all the membrane processes, driving force is essential to deliver the energy
to separate the feed molecules or particles; commonly applied driving force
differences in pressure, concentration, partial pressure, temperature or electrical
potential. The most widely used pressure driven processes are generally classified as
microfiltration (MF), ultrafiltration (UF) and hyperfiltration, which is normally
subdivided in reverse osmosis (RO) and nanofiltration (NF). Nevertheless, the
difference between the processes is not always so sharp, as presents in Table 2.2,
summarizing the main characteristics of various membrane processes, in which,
typical permeability is for a typical permeate stream, i.e., with rejected species on
the retentate side of the membrane.
Table 2.2 Pressure driven membrane processes [85].
Membrane process Typical pressure (bar)
Typical permeability (l/(m2·h·bar)
Morphology of the selective layer
Microfiltration
0.1-2 >50 Porous
Ultrafiltration 1-5 10-50 Porous
Nanofiltration 5-20 1.4-12 Porous/Dense
Reverse Osmosis 10-100 0.05-1.4 Dense
2.3.3.2 Electrospun microfiltration membranes
According to the Baker’s definition: “Microfiltration refers to filtration
process that use porous membranes to separate suspended particles with diameter
between 0.1 and 10 µm” [70]. The electrospun nanofibers membranes could be
good candidate for water microfiltration membrane due to these nanofibers
membranes have a pore size distribution from sub-micron to micrometers. The
viability of developing high surface area pre-filter through electrospinning has been
explored by Gopal et al. [6]. Polysulfone nanofibers were electrospun into
membranes and their ability to remove micro-particles from solution was
investigated. The nanofiber membranes possess high porosity together with high
surface area to produce high flux pre-filters with high loading capacity. The
membranes had a bubble-point of 4.6 µm and were able to remove above 99% of
10, 8, and 7 µm particles without any permanent fouling. However, the membranes
were observed to foul irreversibly by 2 and 1 µm particles with a cake layer forming
on the outer membrane surface. Below 1 µm, the membrane behaved as a depth
filter with 0.5 and 0.1 µm particles being attracted onto the nanofiber surface. Such

30
nanofiber pre-filters could be used in various applications such as removal of
microparticles from waste-water, prior to UF or NF.
Figure 2.18 PSU electrospun membrane after particle–challenge (polystyre with
paticle size ranging between 0.1 – 10 µm) test, a) & b) top surface, c) cross-section
and d) bottom surface [6].
The filtration of PVDF electrospun nanofiber membranes were investigated
by Gopal et al. [7] and Kaur et al. [86], their performances were compared with
commercial microfiltration membrane. For filtration performance experiment of
both membranes in equal conditions i.e., the similar pore size by heat-treating of
proto- electrospun membrane [5] or by grafting with methacrylic acid on top layer of
the electrospun membranes [86] in order to reduce its pore size to the range of the
commercial microfiltration membrane. The results indicated an up two times higher
flux for the PVDF electrospun membrane than commercial microfiltration membrane
at the same pore size distribution and applied pressure and the rejection of PVDF
electrospun membrane resulted more than 90% of the micro-particles from solution.
The higher flux for PVDF electrospun membrane confirms the better performance
and efficiency of the electrospun microfiltration membranes leading to lower energy
consumption. Recently, Zhuang et al. [87] fabricated the PVDF nanofibers
membrane by a new process so-called “solution blowing”. The nanofibers
membranes were electrospun by this process exhibited the fiber diameter mostly of
60 - 280 nm and the porosity of membrane of 95.8%. The microfiltration
performance of the hot-pressed membrane showed retention ratio more than 90%

31
against 1.0, 5.0 and 10 µm particles and presented high pure water flux at low
pressure. Meanwhile, a heat treated electrospun PAN nanofiber membrane for
particle separation from water with average fiber diameter of 165 ± 16 nm, the
porosity of 91.7%, pore size in the diameter range of less than 2 µm and specific
surface area near 40 m2g-1was obtained by Bazargan et al. [88]. The PAN nanofiber
membranes were post-heated treatment exhibited high performance such as the
mechanical strength was 4.87 MPa with 23% elongation, the water permeability was
225.6 kg/m2h and the contact angles were equal to zero. It can be concluded that
the heat treated electrospun PAN nanofiber membrane was completely hydrophilic.
For filtration efficiency, the membrane has high ability to remove more than 90% of
microparticles in the range of 1-20 µm from water.
In particular, the application of electrospun poly(ethylene terephthalate)
nanofiber membrane for apple juice filtration was demonstrated by Veleirinho et al.
[89]. Poly(ethylene terephthalate) nanofibers were electrospun into membranes as
the average fiber diameter was 420 nm and the electrospinning process was
performed until the membrane reaches the similar thickness to the ultrafiltration
membrane of 0.20 mm. The PET nanofibers membranes showed a higher flux
performance than commercial microfiltration or even ultrafiltration membrane.
However, the apple juice was obtained from PET electrospun nanofibers membranes
presented the better physic-chemical characteristic, i.e., more pronounced
reduction of free sugars, decreasing the apple juice color, low protein content,
comparable to the apple juice obtained by commercial microfiltration or by
ultrafiltration membrane. Although the protein content of the apple juice was very
low, however it will not be reduced the nutritional values of apple juice. On other
hand, that can be useful to improve juice stability as well as reduce turbidity in apple
juice. In additions, microfiltration membrane is also used for antibacterial filter
application. Cooper et al. [90] reported the development of chitosan -
polycaprolactone (PCL) nanofibers membranes. These membranes were prepared
from PCL and chitosan content of 25, 50 and 75% and utilized the natural
antibacterial property of chitosan for antibacterial water filtration. The performance
of chitosan-PCL resulted the fiber diameter of 200 – 400 nm and 25% chitosan-PCL
nanofiber membrane showed highest water flux of 6926 L/h/m2 with 100% removal
of 300 nm particles, while the 25% chitosan-PCL nanofiber membrane exhibited a
similar water flux to that of the PCL membrane (≈ 2756 L/h/m2). In a series of
bacterial test, electrospun chitosan-PCL nanofibers membrane can be reduced
Staphylococcus aureus adhesion compared to PCL nanofiber membranes.
Because PES can be considered as a model membrane material as it is widely
use for commercial MF and UF as well as its high chemical, thermal resistance and
also its appropriate mechanical properties. The preparation polyethersulfone (PES)
electrospun nanofiber membrane for MF applications had been reported by

32
Homaeeigohar et al. [91,92]. The membrane was electrospun from 20 wt% PES
solution, which PES was dissolved in N,N-dimethylformamide (DMF), by using the
electrospinning conditions i.e., applied voltage of 20 kV, feed rate of 0.5 ml/h,
spinning distance of 25 cm, inner diameter of the needle of 0.8 mm and using PES
nonwoven as substrate. Thereafter, a set of samples was heated in the oven at
temperature of 190 °C for 6 h. and then the membrane was slowly cooled in the
oven. The surface morphology of PES electrospun nanofibers membrane showed
relatively smooth and no beads or even droplet and the image analysis gave the
average fibres diameter of 260 nm. The membrane properties exhibited the
thickness of 200 µm, areal density of 0.2 -0.3 g/cm2, mean flow pore diameter of 2
µm. Moreover, in term of membrane performance, the water flux measurement
indicated that the membrane possess a high initial flux while retention test with
polystyrene suspension showed that the filtration efficiency of PES electrospun
membrane was highly dependent on size distribution of the suspended particles.
When in feed was the particle over 1 µm in size, the rejection of the particles was
performed within the first hour of the measurement with highly flux. On other hand,
in case of a feed containing only nanoparticles, the rejection was accomplished
within first hour as consequent of surface pore blocking and leading to the flux
decreased. However, the PES electrospun membrane has potential to be used in
pre-treatment of water or one step before UF and NF membranes.
Separation of polystyrene micron to sub-micron particles from water of
electrospun Nylon-6 nanofiber membranes were investigated by Aussawasathien et
al. [100]. The electrospun Nylon-6 nanofiber membrane, which fiber diameter in
range of 30 - 110 nm, membrane thickness of 0.15 mm, pore size of 6.0 µm, had
separated all particle size from 10 µm down to 1 µm unless separation efficiency was
about 90% for 0.5 µm. Nevertheless, at the smaller the particle size, the flux was low
due to the particles were able to pack closely together on the membrane surface, so
called “layer effect” and thereby reducing the effective pore size of electrospun
membrane at the surface. Furthermore, this dense “cake layer” acted as the
separation layer for electrospun membrane, leading to high filtration efficiency for
high content of ultra-small particles and the fouling mainly occurred within the
surface of electrospun membrane due to the particles were mostly retained on the
surface of the membrane. Therefore, electrospun Nylon-6 nanofiber membrane was
able for using as pre-filters prior to ultrafiltration or nanofiltration to increase the
filtration efficiency. In addition, the properties and performance of electrospun
microfiltration membranes are summarized in Table 2.3.

33
Table 2.3 Properties and filtration performance of electrospun microfiltration
membranes.
Polymer Fiber diameter
(nm)
Pore size
(µm)
Thickness (µm)
Permeability (l/m2.h.bar)
Filtration performance
(%)
Particle size
(µm)
Ref.
Nylon 6 30-110 6.0 150 9500 90 1.0 [100] PAN-PET 100 0.22 200 2189 97 0.5 [58] PCL-Chitosan
300 2.8 N.A. 17536 99 0.3 [90]
PES 280 2.0 200 2080 98 1.0 [92] PET 420 2.5 N.A. N.A. 96 N.A.
(apple juice)
[89]
PSU 470 ± 150 2.1 135 13333 94 1.0 [6] PVA 100 ± 19 0.21 100 23529 98 0.2 [103] PVDF 380 ± 106 4.1 300 4000 91 5.0 [7]
2.3.3.3 Electrospun ultrafiltration membranes
Ultrafiltration is a filtration process discriminating a diverse range of
particulates, such proteins, colloids, emulsions and viruses, as big as approximately 1
to 100 nm in the liquid environment [3]. This implies that, in order to use
electrospun nanofibers web directly for ultrafiltration, the pore size of the
electrospun nanofibers web needs to be less than 0.1 µm. Although it is possible to
produce electrospun nanofibers web with such small pore size, this is not a practical
solution for ultrafiltration membranes due to the rapid fouling of these webs. The
rapid fouling rate in neat nanofiber membranes leads to high replacement
frequency, which in turn leads to increased cost [97].
Conventional UF membranes are based on multi-layer composite structures
[82,93], including an asymmetric porous membrane (see Figure 2.17) to give
filtration functions and a nonwoven (fiber diameter of sub-micron) support to
provide structure integrity and mechanical strength. Nevertheless, the porosity in
these membranes usually results in a relatively low flux rate and high fouling
tendency due to geometric structure of pore and the corresponding pore size
distribution [94-96] and undesirable macro-void formation of pore across the
membrane thickness [95,96].
Thereby, Yoon et al. [93] proposed a new concept to fabricated high flux UF
membranes, involving to use of electrospun nanofiber membrane to replace the
asymmetric porous membrane. Their demonstration system consists of a three-tier
composite structure: (i) a non-porous hydrophilic top-layer by coating chitosan, (ii)
an PAN electrospun nanofiber membrane as mid layer and (iii) a conventional

34
polyester nonwoven microfiber as substrate support, the schematic structure of
three-tier approach to fabricate high flux and low-fouling ultrafiltration membranes
as presents in Figure 2.19. The membranes, which assembled of electrospun PAN
nanofiber membrane with average fiber diameter from 124 to 720 nm and porosity
of 70%, was coated a chitosan top layer with a thickness of 1 µm. The results
showed that these membranes had higher flux than commercial nanofiltration
membranes in 24 h of operation (e.g. NF 270 from Dow), while maintaining the same
rejection efficiency, more than 99% for oily waste-water filtration.
Figure 2.19 Schematic structure of three-layer approach to fabricate high flux and
low-fouling for ultrafiltration membranes [82].
Wang et al. [27] prepared the hydrogel PVA in order to coat on top of
nanofiber PVA scaffold. Results indicated that hydrogel PVA-PVA TFNC membrane
exhibited a flux rate, more than 130 L/m2 h, significantly higher than commercial UF
membranes but with similar filtration efficiency of 99% for oily waste-water
filtration. In addition, the mechanical property before and after cross linking of
hydrogel PVA of the electrospun scaffold fabricated by 96% hydrolyzed PVA with
relatively high molecular weight in range of 85,000-124,000 g/mol exhibited the
similar performance.
A new kind of TFNC ultrafiltration membrane was developed by You et al.
[98]. The TFNC membranes were used as an ultrafiltration membrane for oil/water
emulsion separation at low feed pressure, which TFNC membrane consisted of a
PVA thin hydrophilic barrier layer (thickness of 0.5 µm), electrospray PVA nanofiber
(fiber diameter of 250 nm) and using electrospun PAN nanofibers (fiber diameter of
300 nm) as supporting substrate. The performance of PVA/PAN TFNC membrane
resulted high flux (347 L/m2h) with high rejection rate (99.6% for oil/water emulsion

35
separation) at very low feed pressure (0.2 MPa). Tang et al. [99] reported that the
water flux of the curing of UV-PVA barrier layer on cross-linked PVA electrospun
nanofiber scaffold of TFNC membrane was 70 L/m2h with oil rejection during
filtration of oil/water of 99.5% under the operation pressure of 0.21 MPa. It
indicated that the performance of electrospray PVA/PAN TFNC membrane was
better than the UV cured PVA TFNC membrane. Besides, the water flux of
electrospray PVA/PAN TFNC membrane maintained at 309 L/m2h and kept the
rejection of oil/water emulsion separation of 99.5% and good anti-fouling property
after 12 h filtration treatment. Nevertheless, ultrafiltration membranes cannot be
achieved from a layer of electrospun nanofiber.

36
Chapter 3 Experimental

37
3. Experimental
3.1 Materials and chemicals
Commercial polyethersulfone (PES) (Ultrason E 6020 P) donated by BASF was
used and dried at 120 °C for at least 4 hours before use and N-methyl-2-pyrrolidone
(NMP) was purchased from Merck in order to prepare the electrospinning solutions.
Nanoparticles base on silicon dioxide of 35 nm purchased from sigma-aldrich chemie
GmbH were used for water filtration experimentation. In order to test air filtration,
Di-Ethyl-Hexyl-Sebacat (DEHS) was purchased from Topas GmbH. Water purified
with a milli-q system from millipore was used for all experiments. A polyethylene
terephthalate nonwoven (Type, Novatexx 2429) served as the substrates donated by
Freudenberg Filtration Technologies KG.
3.2 Experiments
3.2.1 Viscosity measurement
Polyethersulfone was dissolved in N-methyl-2-pyrrolidone at concentrations
of 9%, 15% and 22% for 24 hours. The viscosity of the dope polymer solutions were
measured with Anton Paar (Germany) model Physica MCR 301 digital rheometer. A
CP25 – 2/TG cone-plate sensor was selected. The viscosity measurements as a
function of the shear rate were performed at 25 °C. Each flow curve was obtained as
an average of at least five measurements.
3.2.2 Preparation of nanofiber membranes
The electrospinning set-up was used for preparation of nanofiber
membranes is shown in Figure 3.1. A power supply (model PNC 30000-40 UMP) was
purchased from Heinzinger electronic GmbH. A solution pump (model KDS 100 ) was
purchased from K.D. Scientific Inc., Holliston, MA, USA. Omnifix® solo plastic syringe
and a needle of inner diameter 0.8 mm were purchased from B.Braun GmbH. A tube
(Tygon Inert SE-200, size 3.2 X 6.4 mm.) was purchased from Pro Liquid-Scan. A steel
plate was used as the electrode collects the nanofiber membranes.
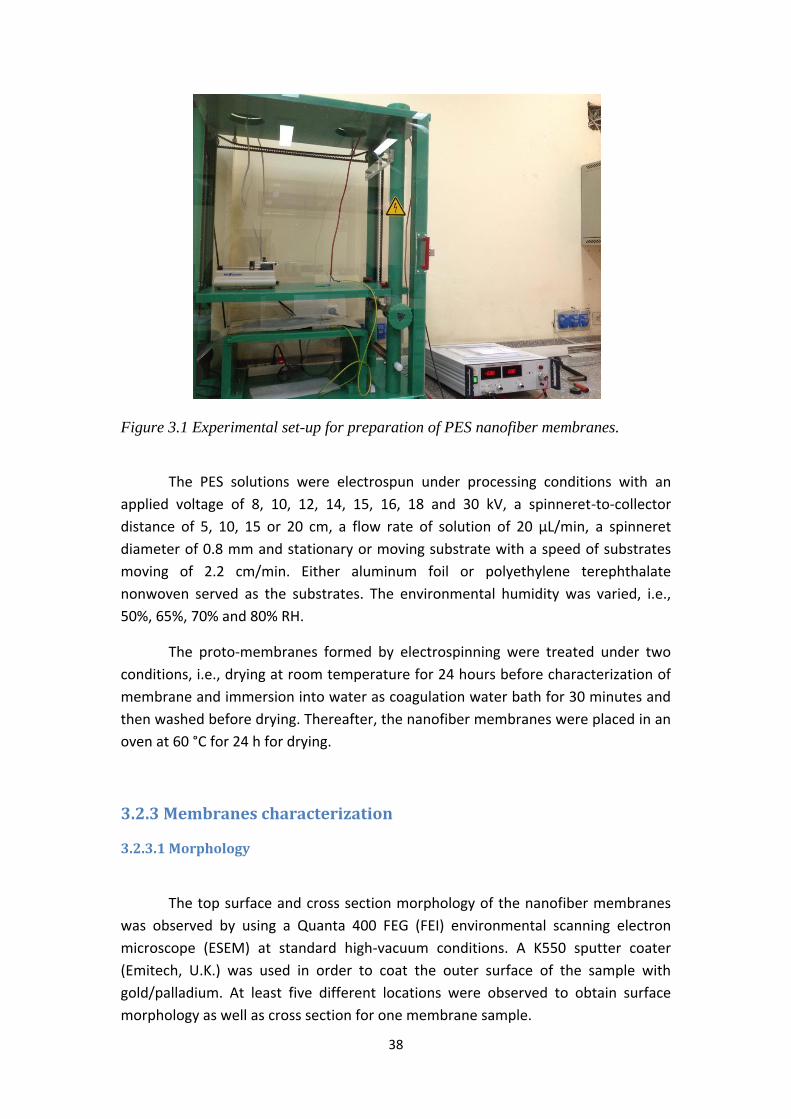
38
Figure 3.1 Experimental set-up for preparation of PES nanofiber membranes.
The PES solutions were electrospun under processing conditions with an
applied voltage of 8, 10, 12, 14, 15, 16, 18 and 30 kV, a spinneret-to-collector
distance of 5, 10, 15 or 20 cm, a flow rate of solution of 20 µL/min, a spinneret
diameter of 0.8 mm and stationary or moving substrate with a speed of substrates
moving of 2.2 cm/min. Either aluminum foil or polyethylene terephthalate
nonwoven served as the substrates. The environmental humidity was varied, i.e.,
50%, 65%, 70% and 80% RH.
The proto-membranes formed by electrospinning were treated under two
conditions, i.e., drying at room temperature for 24 hours before characterization of
membrane and immersion into water as coagulation water bath for 30 minutes and
then washed before drying. Thereafter, the nanofiber membranes were placed in an
oven at 60 °C for 24 h for drying.
3.2.3 Membranes characterization
3.2.3.1 Morphology
The top surface and cross section morphology of the nanofiber membranes
was observed by using a Quanta 400 FEG (FEI) environmental scanning electron
microscope (ESEM) at standard high-vacuum conditions. A K550 sputter coater
(Emitech, U.K.) was used in order to coat the outer surface of the sample with
gold/palladium. At least five different locations were observed to obtain surface
morphology as well as cross section for one membrane sample.

39
3.2.3.2 Fiber diameter
The diameters of the fibers were determined by using an engage software
program. At least five SEM pictures were used and the diameters of 100 fibers were
measured and calculate the mean values for one condition nanofiber membrane.
3.2.3.3 Membranes thickness
The membrane thickness was measured by Coolant Proof Micrometer IP 65,
Mutico Co., Japan and at least five measurements from different nanofiber
membrane samples were averaged.
3.2.3.4 Porosity of membranes
The electrospun membranes maintained in distilled water was weighed after
mopping superficial water with filter paper. The wet membrane was placed in an air-
circulating oven at 60 °C for 24 h and then further dried in a vacuum oven at 60 °C
for 24 h before measuring the dry weight. From the two weights (wet sample weight
and dry sample weight), the porosity of membrane was calculated using equation
following:
P (%) = [ (Q0 - Q1)/A.T ] x 100 (3.1)
Where P is the porosity of membrane, Q0 the wet sample weight (g), Q1 the
dry sample weight (g), A the square of membrane (cm2) and T is the thickness of
membrane (cm).
3.2.3.5 Basic weight
Due to the delicate handling and the compressibility of the membranes,
conventional methods for weight determination as, e.g. standard textile tests, were
expected to be not applicable. Instead, the basic weight was estimated using two
approaches. In a first approach the weight was calculated from the total polymer
mass deposited over the membrane area. The basic weight of electrospun
membranes can then be calculated as follows:

40
Basic weight (mg/cm2) = ( m-dot . τ ) / A (3.2)
Where m-dot = mass flow (mg/min)
τ = residence time (min) = size of membrane in the
direction of substrate movement (cm) / speed of
substrates (cm/min)
A = area (cm2)
In a second approach to estimate the basic weight, the specific volume of
fibers in a unit area (1 cm2) was calculated from the measured (mean) thickness,
which was measured at five spots over the membrane area and averaged, and the
porosity, which was determined as described in section 3.2.3.4. The basic weight is
given by:
Basic weight (mg/cm2) = A . T . ρ . (1 - P) (3.3)
Where A = unit area (1 cm2)
T = thickness (cm)
ρ = density of PES polymer (1.37 g/cm3)
P = porosity of membrane
3.2.3.6 Pore size of membranes
Pore size of electrospun membranes was determined by liquid dewetting of
membrane pores using the Capillary Flow Porometer CFP-34RTG8A-X-6-L4 (PMI Inc.,
Ithaca, NY, USA). Membrane samples with a diameter of 25 mm were characterized
via the “Dry up / Wet up” method. For the “Wet up” part, the membranes were
wetted with 1,1,2,3,3,3-hexafluoropropene Galwick). The maximum transmembrane
pressure for the air flow measurements was 3 bar. The mean pore was estimated
using the PMI software.

41
3.2.3.7 Mechanical property
Electrospun membranes were tested for tensile strength by using an Zwick
Roell material testing instrument (Test Expert® II, Germany) with a 10 N load cell at
25 °C and 65 ± 5% RH. The samples was cut, the size of samples was 2 cm of a width
and a length of 10 cm. A cross-head speed of 50 mm/min was used and five samples
were measured for each condition of electrospun membranes and then the mean
values were calculated.
3.2.3.8 Contact angle
Sessile drop static contact angle (CA) of electrospun membranes were
determined by using an optical contact angle measurement system (OCA 15 Plus;
Dataphysics GmbH, Filderstadt, Germany). The water of 5 µL was dropped on the
electrospun membrane surface from a microsyringe with a stainless steel needle in
room temperature approximately 21 ± 3 °C. In order to determine, at least five
measurements of drops at different location were averaged to obtain CA for one
membrane sample.
3.2.4 Characterization of membranes performance
3.2.4.1 Gas permeability
Gas permeability of electrospun membranes were determined by using the
Capillary Flow Porometer CFP-34RTG8A-X-6-L4 (PMI Inc., Ithaca, NY, USA). The
maximum transmembrane pressure for the gas flow measurements was 3 bar,
permeability of membranes were calculated by Darcy’s law such that;
KD = (µ.Q / A)(T / ∆p) (3.4)
Where KD is the permeability constant (m2), µ the gas viscosity (17.85 x 10⁻⁶
kg m-1 s for N2 at 20 °C), Q the total volumetric flow rate (m3/s), A the area of
membranes samples (m2), T the thickness (m) and ∆p the pressure drop across
membrane samples (Pa).

42
3.2.4.2 Air filtration (Aerosol collection efficiency)
Aerosol particles were produced from di-ethyl-hexyl-sebacat (DEHS) by a
pneumatic aerosol generator. In this study, aerosol of 400, 600, 800 and 1000 nm in
diameter were used. The concentration of aerosol particles was monitored with
scanning mobility particle sizer (Welas 2000 with Sensor 2100 (Palas)) and the
aerosol particles was feed through the electrospun membrane samples by Feeder
(AGF 2.0 (Palas)). The flow velocity through the electrospun membrane samples was
10 cm/s. The sample test area clamped in the holder exposed a circular diameter of
150 mm to the aerosol stream. The electrospun membranes were measured the
upstream and downstream concentration of aerosol particles (DEHS), and then
calculated the aerosol collection efficiency, E, of electrospun membranes using
equation following:
E = (Cp - Cf) / Cp (3.5)
Where Cf is the concentration downstream of the filter test sample and Cp is
the aerosol particle concentration upstream.
3.2.4.3 Water flux
All electrospun membranes were characterized the water permeability by
using a dead-end stirred cell filtration system (Amicon cell, model 8010) equipped
with a reservoir (~450 mL) and pressurized by nitrogen from gas tank. The diameter
of the membrane samples were 25 mm. Nanofiber membranes compaction were
performed by filtration of pure water at 0.03 bar. The membranes were firstly
compacted for at least 30 min. At least three measurements with the same pressure
(0.03 bar) from different membrane sample were averaged for one membrane
condition.
3.2.4.4 Water filtration
Silica nanoparticles of 35 nm were used for water filtration measurement.
For preparation feed solution, a calibration curve was determined for each
nanoparticles feed solution using Particlemetrix Stabisizer model 200CS. All the
water filtration measurements were carried out using a dead-end stirred cell

43
filtration system connected to a reservoir and pressurized by nitrogen from gas tank
at 0.1 bar. The flux of pure water was first determined, followed by separation of
silica particles solution and feed solution concentration of 1.5 %. The stirring rate
was 300 rpm. The separation flux was measured for every 5 cm3 of permeate
collected. The separation experiment was stopped at 50 mL or cm3 of permeate was
collected. The remaining nanoparticles solution was removed and the cell rinsed
without removing the membrane. The cell was refilled the pure water and the water
flux was determined again. Presence of any silica nanoparticles in permeate was
detected with Particlemetrix Stabisizer model 200CS. The rejection (R, %) was
determined using the formula following:
R = (1 - Cp / Cf) x 100 (3.6)
Where Cp and Cf are the silica solution concentration of permeate collected
and the original solution feed, respectively.
44
Chapter 4 Results and Discussion

45
4. Results and discussion
The results in this work are shown in following parts: i. optimization of the
nanofibers, ii. optimization of the nanofiber membranes, iii. nanofiber membranes
properties and iv. nanofiber membranes performance.
4.1 Optimization of PES nanofibers
The polyethersulfone solution was electrospun into nanofibers under
investigation the influence of parameters on electrospinning process with the
stationary substrate set-up. The PES nanofibers were firstly observed the
morphology. Thereafter, the diameters of fibers were measured.
4.1.1 Influence of polymer concentration
Figure 4.1 shows the morphology of electrospun nanofiber membranes with
variation of polymer concentration.
(a)

46
(b)
(c)
Figure 4.1 SEM images of nanofiber membranes from (a) 9% PES, (b) 15% PES and
(c) 22% PES, in NMP using the conditions, i.e., a spinneret-to-collector distance of
10 cm, an applied voltage of 30 kV, a flow rate of 20 µL/min, a spinneret diameter of
0.8 mm, stationary substrate set-up and PET nonwoven served as the substrate.
The influence of PES concentration on viscosity had been studied because
this property is important for the behavior of the polymer solution in
electrospinning (Table 4.1).

47
Table 4.1 Viscosities of PES solutions in NMP at room temperature.
PES (%) Viscosity (Pa s)
9 0.10 15 0.53
22 3.82
Figure 4.1 shows SEM images of PES electrospun nanofiber membranes from
different solutions, using the same processing conditions, with stationary substrate
set-up and PET nonwoven served as the substrate. The solution with 22% PES in
NMP can be electrospun into well-defined nanofiber membranes (cf. Figure 4.1(c))
and the image analyses gave a mean fiber diameter of 489 ± 142 nm. As shown in
Figure 4.1 (a) and (b) for PES concentration of 9% and 15%, respectively, the overall
morphology of the web obtained is changed from a fiber network into spherical
particles connected by fibers with the decrease of the polymer concentration in the
solution used for electrospinning. This coincides with the results of previous works in
literature review [14-22,25-29].
The results could be explained in terms of the viscosity of the solution effect
(cf. section 2.2.1.1). As clearly seen in Table 4.1, it was presented that the viscosity
of the 22% PES electrospinning solution (3.82 Pa s) was higher than those of 9% PES
(0.10 Pa s) and 15% PES (0.53 Pa s) electrospinning solutions. However, increasing
the polymer concentration led to increasing the viscosity of the polymer solution, an
increased in the concentration results in greater polymer chain entanglements of
the solution that is essential to maintain the continuity of the jet during
electrospinning [15]. Furthermore, the chain entanglement of polymer had a
significant impact on whether resultant jet breaks up into electrospun nanofibers
[15,16].
4.1.2 Influence of spinneret-to-collector distance
The nanofiber membranes surface morphology with variation of distance
between spinneret-to-collector are presented in Figure 4.2

48
(a)
(b)
(c)
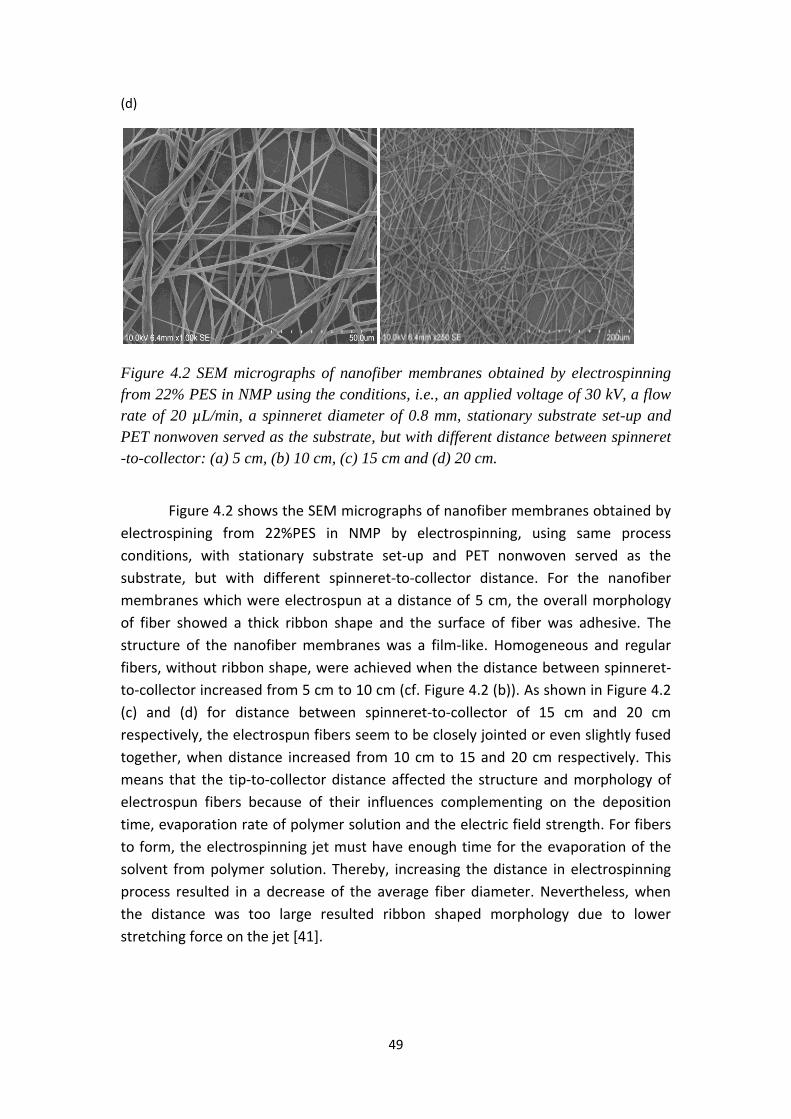
49
(d)
Figure 4.2 SEM micrographs of nanofiber membranes obtained by electrospinning
from 22% PES in NMP using the conditions, i.e., an applied voltage of 30 kV, a flow
rate of 20 µL/min, a spinneret diameter of 0.8 mm, stationary substrate set-up and
PET nonwoven served as the substrate, but with different distance between spinneret
-to-collector: (a) 5 cm, (b) 10 cm, (c) 15 cm and (d) 20 cm.
Figure 4.2 shows the SEM micrographs of nanofiber membranes obtained by
electrospining from 22%PES in NMP by electrospinning, using same process
conditions, with stationary substrate set-up and PET nonwoven served as the
substrate, but with different spinneret-to-collector distance. For the nanofiber
membranes which were electrospun at a distance of 5 cm, the overall morphology
of fiber showed a thick ribbon shape and the surface of fiber was adhesive. The
structure of the nanofiber membranes was a film-like. Homogeneous and regular
fibers, without ribbon shape, were achieved when the distance between spinneret-
to-collector increased from 5 cm to 10 cm (cf. Figure 4.2 (b)). As shown in Figure 4.2
(c) and (d) for distance between spinneret-to-collector of 15 cm and 20 cm
respectively, the electrospun fibers seem to be closely jointed or even slightly fused
together, when distance increased from 10 cm to 15 and 20 cm respectively. This
means that the tip-to-collector distance affected the structure and morphology of
electrospun fibers because of their influences complementing on the deposition
time, evaporation rate of polymer solution and the electric field strength. For fibers
to form, the electrospinning jet must have enough time for the evaporation of the
solvent from polymer solution. Thereby, increasing the distance in electrospinning
process resulted in a decrease of the average fiber diameter. Nevertheless, when
the distance was too large resulted ribbon shaped morphology due to lower
stretching force on the jet [41].

50
4.1.3 Influence of substrate in electrospun nanofibers
The morphology of nanofiber membranes which were electrospun from the
same PES solutions under identical conditions onto different substrates are shown in
Figure 4.3
(a) (b)
Figure 4.3 SEM images of nanofiber membranes obtained by electrospinning from
22% PES in NMP onto: (a) aluminum foil, and (b) PET nonwoven, as the substrates
and using the conditions, i.e., a spinneret-to-collector distance of 10 cm, an applied
voltage of 30 kV, a flow rate of 20 µL/min, a spinneret diameter of 0.8 mm and with
stationary substrate set-up.
Figure 4.3 shows the SEM micrographs of nanofiber membranes obtained
from solution of 22% PES in NMP by electrospinning using same processing
conditions, the stationary substrate set-up, but with different substrates. Because
the morphologies are identical, it can be concluded that these PES solutions can also
be directly electrospun onto a porous PET nonwoven support which will enable the
straight forward characterization of trans-membrane pore structure and filtration
properties.
4.1.4 Influence of parameters in process on membranes structure
The photo of nanofiber membrane structure that was electrospun from the
same PES solutions under identical conditions as in section 4.1.3 is presented in
Figure 4.4.
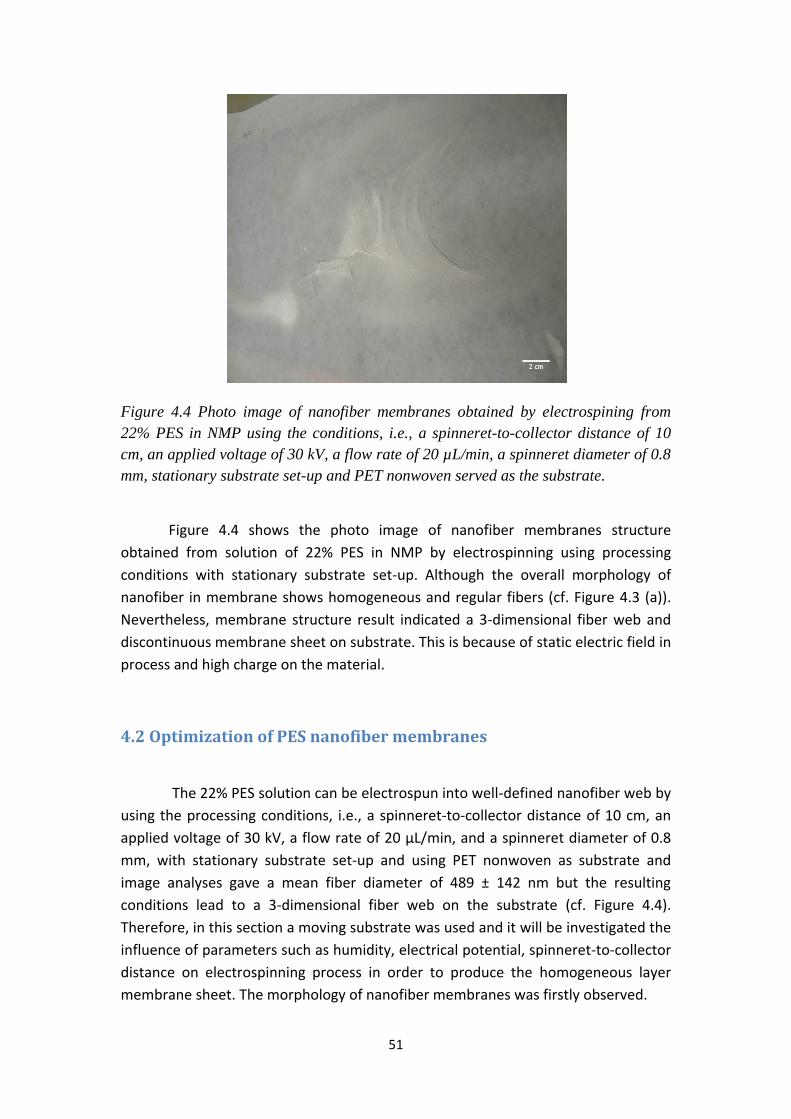
51
Figure 4.4 Photo image of nanofiber membranes obtained by electrospining from
22% PES in NMP using the conditions, i.e., a spinneret-to-collector distance of 10
cm, an applied voltage of 30 kV, a flow rate of 20 µL/min, a spinneret diameter of 0.8
mm, stationary substrate set-up and PET nonwoven served as the substrate.
Figure 4.4 shows the photo image of nanofiber membranes structure
obtained from solution of 22% PES in NMP by electrospinning using processing
conditions with stationary substrate set-up. Although the overall morphology of
nanofiber in membrane shows homogeneous and regular fibers (cf. Figure 4.3 (a)).
Nevertheless, membrane structure result indicated a 3-dimensional fiber web and
discontinuous membrane sheet on substrate. This is because of static electric field in
process and high charge on the material.
4.2 Optimization of PES nanofiber membranes
The 22% PES solution can be electrospun into well-defined nanofiber web by
using the processing conditions, i.e., a spinneret-to-collector distance of 10 cm, an
applied voltage of 30 kV, a flow rate of 20 µL/min, and a spinneret diameter of 0.8
mm, with stationary substrate set-up and using PET nonwoven as substrate and
image analyses gave a mean fiber diameter of 489 ± 142 nm but the resulting
conditions lead to a 3-dimensional fiber web on the substrate (cf. Figure 4.4).
Therefore, in this section a moving substrate was used and it will be investigated the
influence of parameters such as humidity, electrical potential, spinneret-to-collector
distance on electrospinning process in order to produce the homogeneous layer
membrane sheet. The morphology of nanofiber membranes was firstly observed.

52
4.2.1 Influence of relative humidity in electrospinning process
The nanofiber membranes were electrospun from 22% PES in NMP using
same condition as before, but with different relative humidity conditions. The
morphology of nanofiber membranes are presented in Figure 4.5.
(a)
(b)
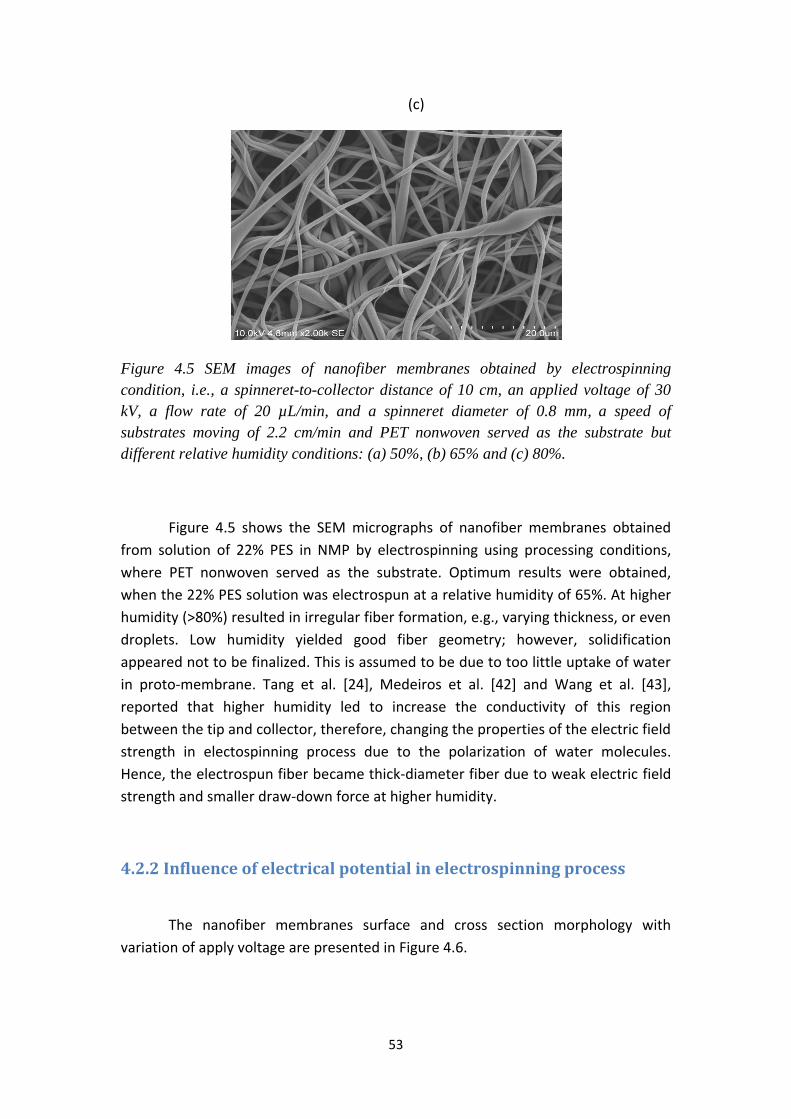
53
(c)
Figure 4.5 SEM images of nanofiber membranes obtained by electrospinning
condition, i.e., a spinneret-to-collector distance of 10 cm, an applied voltage of 30
kV, a flow rate of 20 µL/min, and a spinneret diameter of 0.8 mm, a speed of
substrates moving of 2.2 cm/min and PET nonwoven served as the substrate but
different relative humidity conditions: (a) 50%, (b) 65% and (c) 80%.
Figure 4.5 shows the SEM micrographs of nanofiber membranes obtained
from solution of 22% PES in NMP by electrospinning using processing conditions,
where PET nonwoven served as the substrate. Optimum results were obtained,
when the 22% PES solution was electrospun at a relative humidity of 65%. At higher
humidity (>80%) resulted in irregular fiber formation, e.g., varying thickness, or even
droplets. Low humidity yielded good fiber geometry; however, solidification
appeared not to be finalized. This is assumed to be due to too little uptake of water
in proto-membrane. Tang et al. [24], Medeiros et al. [42] and Wang et al. [43],
reported that higher humidity led to increase the conductivity of this region
between the tip and collector, therefore, changing the properties of the electric field
strength in electospinning process due to the polarization of water molecules.
Hence, the electrospun fiber became thick-diameter fiber due to weak electric field
strength and smaller draw-down force at higher humidity.
4.2.2 Influence of electrical potential in electrospinning process
The nanofiber membranes surface and cross section morphology with
variation of apply voltage are presented in Figure 4.6.
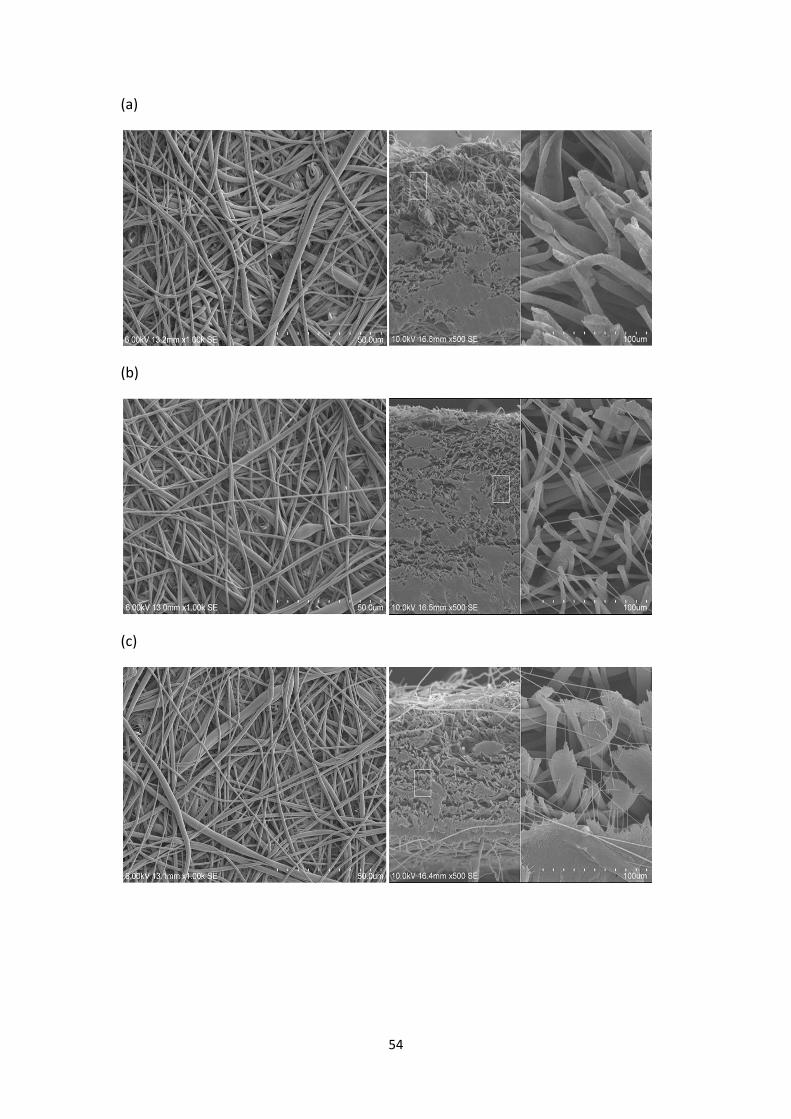
54
(a)
(b)
(c)
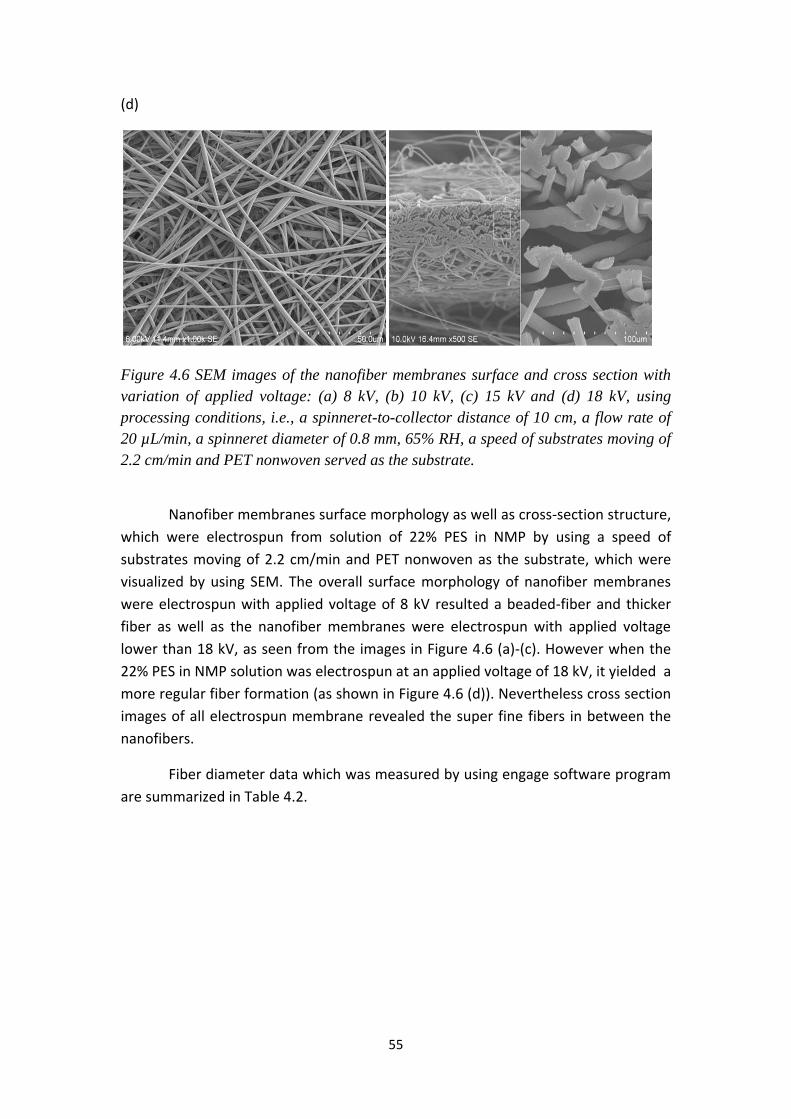
55
(d)
Figure 4.6 SEM images of the nanofiber membranes surface and cross section with
variation of applied voltage: (a) 8 kV, (b) 10 kV, (c) 15 kV and (d) 18 kV, using
processing conditions, i.e., a spinneret-to-collector distance of 10 cm, a flow rate of
20 µL/min, a spinneret diameter of 0.8 mm, 65% RH, a speed of substrates moving of
2.2 cm/min and PET nonwoven served as the substrate.
Nanofiber membranes surface morphology as well as cross-section structure,
which were electrospun from solution of 22% PES in NMP by using a speed of
substrates moving of 2.2 cm/min and PET nonwoven as the substrate, which were
visualized by using SEM. The overall surface morphology of nanofiber membranes
were electrospun with applied voltage of 8 kV resulted a beaded-fiber and thicker
fiber as well as the nanofiber membranes were electrospun with applied voltage
lower than 18 kV, as seen from the images in Figure 4.6 (a)-(c). However when the
22% PES in NMP solution was electrospun at an applied voltage of 18 kV, it yielded a
more regular fiber formation (as shown in Figure 4.6 (d)). Nevertheless cross section
images of all electrospun membrane revealed the super fine fibers in between the
nanofibers.
Fiber diameter data which was measured by using engage software program
are summarized in Table 4.2.

56
Table 4.2 Fiber diameter of electrospun membranes with variation of applied voltage
in process (note: the length of the membrane is 30 cm in all cases).
Applied Voltage
(kV)
Diameter of fiber (nm) Avg. width of membranes
(cm) Average Max Min
8
1047 ± 348
2353
598
15
10 2218 ± 1587 5858 534 15 12 1039 ± 224 1635 470 15 14 993 ± 264 1554 399 15 15 992 ± 312 3142 598 15 16 909 ± 236 2225 548 15 18 875 ± 156 1179 400 15
From Table 4.2 can be seen that the electrospun membranes which were
prepared with an applied voltage of 18 kV exhibited the finest fiber diameter (875
nm), when compared with nanofiber membranes that were prepared of lower
applied voltage. As seen in Table 4.2, it indicated that decreasing of applied voltage
could increase the diameter of fiber (cf. SEM, Figure 4.6). As the results, it was found
that the diameter of electrospun fibers decreases with increasing electric field.
These results accord with the results of Buchko et al. [14], Fong et al. [19] and Park
et al. [39]. The thin nanofibers obtained in the electrospinning process are produced
as a result of spiral motion and elongation of a polymer jet driven by stronger
stretching force at higher electrical potential between the polymer solution in
capillary and the collector. When the electrostatic force in the polymer jet become
large enough to overcome the cohesive force within the jet, then the spiral motion
and elongation of the polymer jet in process with higher electric field strength
become more active, and consequently finer nanofibers are achieved [14,39].
4.2.3 Influence of spinneret-to-collector distance
The surface morphology of electrospun membranes with variation distance
between spinneret-to-collector are shown in Figure 4.7.

57
(a) (b)
(c) (d)
Figure 4.7 SEM images of electrospun membranes using the process condition, i.e.,
an applied voltage of 18 kV, a flow rate of 20 µL/min, a spinneret diameter of 0.8
mm and 65% RH, a speed of substrates moving of 2.2 cm/min and PET nonwoven
served as the substrate but with variation of distance between spinneret-to-collector;
(a) 10 cm, (b) 12 cm, (c) 14 cm and (d) 15 cm.
Figure 4.7 shows the influences of variation distance between spinneret- to –
collector on the PES electrospun membrane morphology, which were electrospun by
using a speed of substrates moving of 2.2 cm/min and PET nonwoven served as the
substrate. As clearly seen in Figure 4.7 (a), when 22% PES was electrospun at 10 cm
resulted homogeneous and well-defined nanofiber membranes. From Figure 4.7 (b),
a few bead fibers appeared when the distance between spinneret-to-collector was
12 cm. Nevertheless at higher distance between spinneret-to-collector (14 and 15
cm), beaded and thicker fiber were formed on structure of electrospun membranes
(Figure 4.7 (b)-(d).
In addition, fiber diameter data, which was measured by using engage
software program, are summarized in Table 4.3.

58
Table 4.3 Fiber diameter of electrospun membranes with variation of distance
between spinneret-to-collector in process (note: the length of the membrane is 30 cm
in all cases).
Distance (cm)
Diameter of fibers (nm) Avg. width of membranes
(cm)
Average Max Min
10 875 ± 156 1179 400 15 12 896 ± 204 1342 579 17 14 1010 ± 312 1987 468 18 15 973 ± 334 1814 148 19
Table 4.3 showed the influence of distance between spinneret-to-collector
variations on the fiber diameter of electrospun membranes. It was seen that when
membranes were electrospun at distance spinneret-to-collector of 10 cm led to
lowest average fiber diameter, which the image analyses gave an average fiber
diameter of 875 nm. Whereas the electrospun membranes were prepared at higher
distance between spinneret-to-collector of 12, 14 and 15 cm, the image program
analyses gave the average diameter of fiber of 896, 1010 and 973 nm, respectively.
It can be concluded that decreasing of spinneret-to-collector distance leads to
decreasing diameter of the fibers because of increasing electric field strength in
electrospinning process due to stronger stretching force on the jet. Furthermore,
increasing of spinneret-to-collector distance leads to increasing size of the
electrospun membranes. The influences of variation distance between spinneret-to-
collector in process were discussed by many researchers (see section 2.2.3).
4.2.4 Homogeneity of PES electrospun membranes
The photo of electrospun membrane structure that was prepared from the
22% PES solutions under the same conditions with a speed of substrates moving of
2.2 cm/min, 65% RH and using PET nonwoven as substrate, is presented in Figure
4.8.
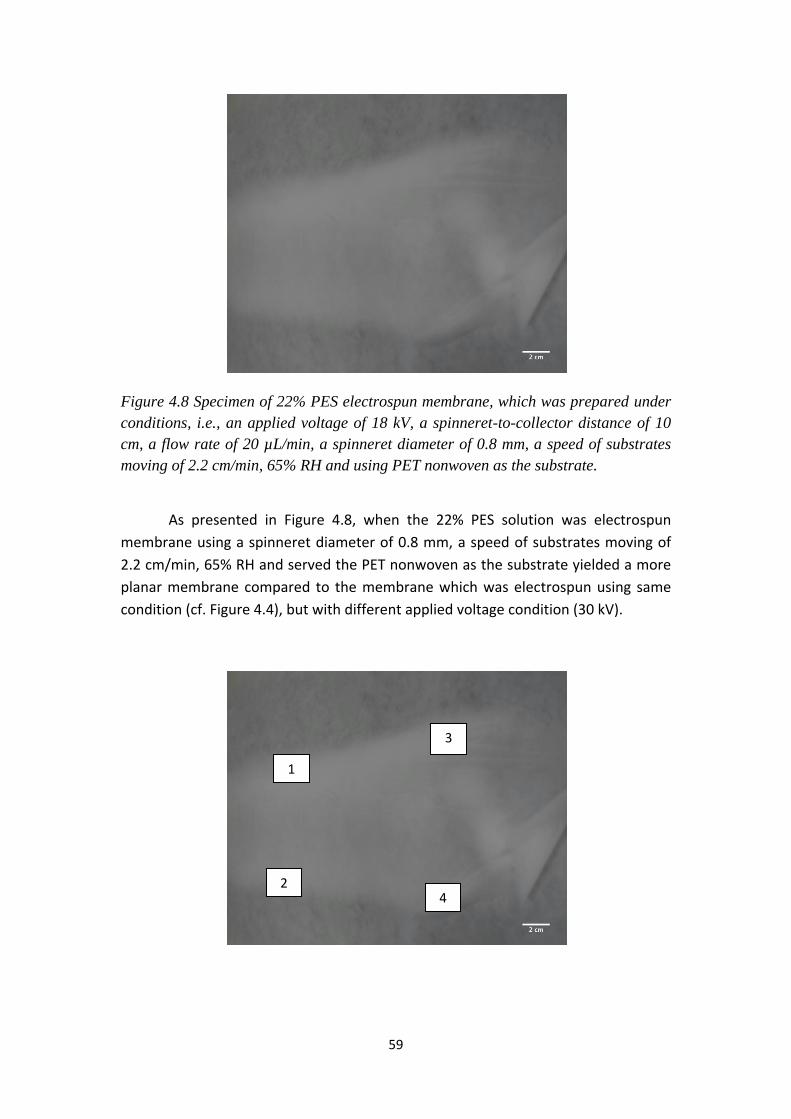
59
Figure 4.8 Specimen of 22% PES electrospun membrane, which was prepared under
conditions, i.e., an applied voltage of 18 kV, a spinneret-to-collector distance of 10
cm, a flow rate of 20 µL/min, a spinneret diameter of 0.8 mm, a speed of substrates
moving of 2.2 cm/min, 65% RH and using PET nonwoven as the substrate.
As presented in Figure 4.8, when the 22% PES solution was electrospun
membrane using a spinneret diameter of 0.8 mm, a speed of substrates moving of
2.2 cm/min, 65% RH and served the PET nonwoven as the substrate yielded a more
planar membrane compared to the membrane which was electrospun using same
condition (cf. Figure 4.4), but with different applied voltage condition (30 kV).
1
4
3
2
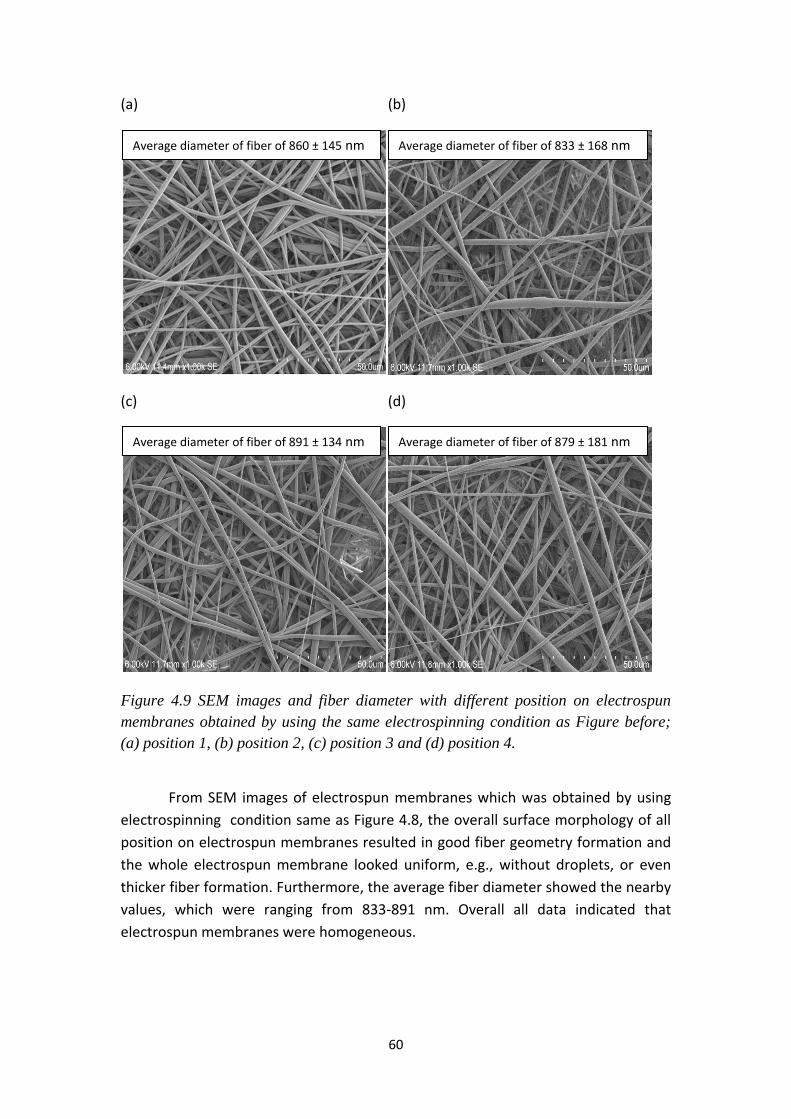
60
(a) (b)
(c) (d)
Figure 4.9 SEM images and fiber diameter with different position on electrospun
membranes obtained by using the same electrospinning condition as Figure before;
(a) position 1, (b) position 2, (c) position 3 and (d) position 4.
From SEM images of electrospun membranes which was obtained by using
electrospinning condition same as Figure 4.8, the overall surface morphology of all
position on electrospun membranes resulted in good fiber geometry formation and
the whole electrospun membrane looked uniform, e.g., without droplets, or even
thicker fiber formation. Furthermore, the average fiber diameter showed the nearby
values, which were ranging from 833-891 nm. Overall all data indicated that
electrospun membranes were homogeneous.
Average diameter of fiber of 860 ± 145 nm Average diameter of fiber of 833 ± 168 nm
Average diameter of fiber of 891 ± 134 nm Average diameter of fiber of 879 ± 181 nm

61
4.2.5 Influence of post-treatment conditions on fiber surface of
electrospun membranes
The proto-membranes formed by electrospinning were treated under
different conditions in order to investigate the influence of post-treatment
conditions on surface morphology of membranes. The morphology of electrospun
membranes are presented in Figure 4.10.
(a) (b)
Figure 4.10 SEM micrographs of nanofiber membranes obtained by electrospinning
from 22% PES in NMP using an applied voltage of 18 kV, a spinneret-to-collector
distance of 10 cm, a flow rate of 20 µL/min, a spinneret diameter of 0.8 mm, a speed
of substrates moving of 2.2 cm/min, 65% RH and using PET nonwoven as the
substrate with different treatment conditions: (a) immersion in an aqueous
coagulation bath and (b) drying at 65 ± 5% RH and 20 °C.
Figure 4.10 shows the SEM micrographs of fiber surface obtained from
solutions of 22% PES in NMP by electrospinning using same processing conditions
but with different treatment conditions. It is clearly seen in Figure 4.10 (a) that the
proto-membrane which had been treated by immersion into the water bath leads to
a pronounced porosity on the fiber surface as compared to the another treatment
condition (cf. Figure 4.10 (b)). It is assumed that this is due to a phase separation
induced by the exchange of the residual solvent NMP in the proto-membrane with
water in the aqueous coagulation bath, acting as non-solvent for PES.

62
4.3 Properties of PES electrospun membranes
PES solutions were electrospun by using various conditions in the process.
Thereafter, they were tested with respect to the properties such as thickness,
porosity, basic weight, pore size, mechanical property and contact angle.
4.3.1 Thickness of electrospun membrane
The thickness of electrospun membranes are shown in Figure 4.11.
Figure 4.11 Thickness of electrospun membranes by using the condition, a flow rate
of 20 µL/min, a spinneret diameter of 0.8 mm, a speed of substrates moving of 2.2
cm/min, 65% RH and using PET nonwoven as the substrate with different applied
voltage and distance between a spinneret-to-collector in process.
As clearly seen in Figure 4.11, the thickness of electrospun membranes
tended to decrease slightly when the applied voltage and distance between
spinneret-to-collector in process increased.
0
50
100
150
200
250
300
6 8 10 12 14 15 16 18 20
Thic
kne
ss (
µm
)
Applied voltage (kV) @ Dis 10 cm
Distance (cm) @ 18 kV

63
4.3.2 Porosity of electrospun membranes
The calculated porosity of electrospun membranes are summarized in Figure
4.12.
Figure 4.12 Porosity of electrospun membranes by preparing under conditions, a
flow rate of 20 µL/min, a spinneret diameter of 0.8 mm, a speed of substrates moving
of 2.2 cm/min, 65% RH and using PET nonwoven as the substrate but with varying
applied voltage and distance between spinneret-to-collector in electrospinning
process.
Figure 4.12 showed the porosity of electrospun membranes at varied applied
voltage and distance between spinneret-to-collector. The porosities of electrospun
membranes are high for membranes prepared by high applied voltage and at low
spinneret-to-collector distance. The electrospun membranes were prepared with an
applied voltage of 18 kV presented the highest porosity of 93%, when compared
with electrospun membranes that were prepared of lower applied voltage. It can be
explained that increasing of applied voltage could decrease the diameter of fiber
and then led to decreasing mean pore size of membranes (cf. Figure 4.6 and Figure
4.16). From these phenomenon led to increasing porosity of electrospun
membranes (cf. Figure 5.13).
Figure 4.12 also showed the effect of distance between spinneret-to-
collector variations on porosity of electrospun membranes. The calculated results
showed that when membranes were electrospun at distance spinneret-to-collector
of 10 cm led to highest porosity of electrospun membrane of 93%. While the
50
55
60
65
70
75
80
85
90
95
100
6 8 10 12 14 15 16 18 20
% p
oro
sity
Applied voltage (kV) @ Dis 10 cm
Distance (cm) @ 18 kV

64
electrospun membranes were prepared at higher distance between spinneret-to-
collector, the porosity was slightly decreased. As the result, it was found that the
porosity of electrospun membranes decreased with increasing distance between
spinneret-to-collector. Correlating these results with the mean pore size as well as
fiber diameter (cf. 4.2.3) of the electrospun membranes in Figure 4.13, it clearly
indicated that the mean pore size is the crucial parameter to determining the
porosity of the electrospun membranes. Increasing of mean pore size leads to
decreasing porosity of electrospun membranes [cf. 105, 106].
Figure 4.13 Correlation between mean pore size with porosity of electrospun
membranes tunable by preparation conditions.
4.3.3 Basic weight of electrospun membranes
Since spinning parameters were found to have an effect on membrane size,
thickness and porosity, it was important to try and establish the basic weight, which
is a major parameter of a membrane. The delicate handling and problematic sample
preparation, the basic weight was not measured but estimated on the basic of other
process or sample parameters. Two different approaches for this calculation were
chosen (cf. 3.2.3.5). Based on the mass flow during spinning and the spinning time,
the total maximum mass spread over the membrane area was calculated and
related to the membrane area. The calculated basic weight of electrospun
membranes are presented in Table 4.4 and Figure 4.14.
50
55
60
65
70
75
80
85
90
95
100
1 1.5 2 2.5 3 3.5 4 4.5 5
% P
oro
sity
Mean pore size (um)
Applied voltage (kV) @ Dis 10 cm
Distance (cm) @ 18 kV

65
The data in Table 4.4 shows that area increased with increasing spinneret-to-
collector, whereas thickness and basic weight decreased. This is logic, as the same
amount of polymer has to cover an increasing area or size of membrane; hence the
(mean) thickness decreases. The model assumes a uniform deposition of fiber over
the area. This simple assumption obviously does not relate to the actual geometry of
the membrane, where the thickness changes across the membrane roughly
according to a Gaussian shape.
Table 4.4 Correlation between area and thickness with basic weight of electrospun
membranes tunable by preparations condition (note: the length of the membrane is
30 cm in all cases).
Distance spinneret-to-collector
(cm)
Width of membrane (cm)
Thickness (µm)
Basic weight (mg/cm2)
10 15 205 0.169
12 17 180 0.149
14 18 163 0.141
15 19 122 0.134
The influence of varying distance between spinneret-to-collector and applied
voltage on the calculated basic weight of electrospun membrane is shown in Figure
4.14. It can be seen that when membranes were electrospun at distance spinneret-
to-collector of 10 cm led to highest basic weight of 0.169 mg/cm2. Moreover, it was
found that the basic weight of electrospun membranes decreased with increasing
distance between spinneret-to-collector. While the electrospun membranes with
varying of applied voltage showed similar the calculated basic weight.

66
Figure 4.14 Calculated basic weight of electrospun membranes by using the
condition, a flow rate of 20 µL/min, a spinneret diameter of 0.8 mm, a speed of
substrates moving of 2.2 cm/min, 65% RH and using PET nonwoven as the substrate
with different applied voltage and distance between a spinneret-to-collector in
process.
In a second approach to estimate the basic weight, the specific volume of
fibers in a unit area (1 cm2) was calculated from the measured (mean) thickness and
the porosity, which was determined in section 3.2.3.5 (cf. eq. 3.3). The basic weight
was then calculated using the PES density of 1.37 g/cm3. The resulting numbers are
given in Table 4.5.
Table 4.5 Correlation between thickness and porosity with basic weight of
electrospun membranes tunable by preparations condition.
Distance spinneret-to-collector
(cm)
Thickness (µm)
Porosity (%)
Basic weight (mg/cm2)
10 205 93 1.9
12 180 88 3.0
14 163 85 3.3
15 122 75 4.1
It is clearly seen that there is no agreement the basic weight calculated by
the two models. The actual values differ by one order of magnitude, and the
estimated weight follows an opposing trend in dependence on distance between
0.1
0.11
0.12
0.13
0.14
0.15
0.16
0.17
0.18
6 8 10 12 14 15 16 18 20
Bas
ic w
eig
ht
(mg/
cm2)
Applied voltage (kV) @ 10 cm
Distance (cm) @ 18 kV

67
spinneret-to-collector. In order to judge the significance of both models (see eq. 3.2
and 3.3), several aspects shall be discussed.
First, it has to be noted that in the above calculations, the thickness was an
average value derived from multiple measurements over the whole membrane, the
stated porosity (cf. Table 4.5) characterizes the central area of the membrane. This is
due to the necessary size of the samples for the determination of the porosity in the
chosen way. Again, one has to point out that at least the membrane thickness is not
constant and varies from edge to central area to edge. It may be assumed that the
stated porosity will not be significant for the edge portions of the membrane.
Second, if we make use of the weight values derived from mass flow and as
stated in Table 4.4 to calculate membrane porosity using eq. 3.3, we obtain
porosities of the order of 99% for all of four samples.
Third, typical porosities of technical textiles and nonwovens made of micro-
fibers with diameter of 5 µm and larger area of the order of 90%. Given this
background, it is reasonable to assume far higher porosities for nanofibrous
membranes, whereas values like 85 or 75% as given in Table 4.5 are highly unlikely.
It has to be concluded that the basic weight value in Table 4.4 are quite
representative, but also that the chosen way to characterize porosity (cf. 3.2.3.4)
may be doubtful in the case of these specific samples.
4.3.4 Mean pore size of electrospun membranes
The mean pore size of the electrospun membranes is a factor for
determining the filtration performance of the membranes. Basically, smaller pore
size leads to higher aerosol collection efficiency or particle separation efficiency,
both of which are the most critical performance criteria of air filtration and water
filtration, respectively [30]. The measured mean pore sizes are presented in Figure
4.15 and the correlation between diameters of nanofibers with mean pore size of
electrospun membranes tunable by preparations condition is shown in Figure 4.16.

68
Figure 4.15 Effect of varying applied voltage and distance between spinneret- to-
collector in electrospinning process on the mean pore size of electrospun membranes
by preparing under conditions with a flow rate of 20 µL/min, a spinneret diameter of
0.8 mm, a speed of substrates moving of 2.2 cm/min, 65% RH and using PET
nonwoven as the substrate.
It can be seen in Figure 4.15 that increasing applied voltage and decreasing
distance in the electrospinning process leads to decreasing mean pore size of
membranes. The mean pore size of electrospun membranes by preparing at high
applied voltage is lower than electrospun membranes by preparing at low applied
voltage. The electrospun membranes were prepared with an applied voltage of 18
kV exhibited the pore size of 1.7 µm, when compared with nanofiber membranes
were prepared of lower applied voltage. As seen in Figure 4.15, it indicated that
increasing of applied voltage could decrease the diameter of fiber (cf. Table 4.2) and
hence mean pore size of membranes decrease (cf. Figure 4.16).
The influence of varying distance between spinneret- to- collector on the
mean pore size of electrospun membranes also is shown in Figure 4.15. It was seen
that when membranes were electrospun at distance spinneret-to-collector of 10 cm
led to lowest mean pore size of 1.7 µm. Besides, it found that the mean pore size of
electrospun membranes increased with increasing distance between spinneret-to-
collector. Correlating these results with the fiber diameter of the electrospun
membranes in Figure 4.16, it could be seen that the fiber diameter is the crucial
parameter to determining the mean pore size of the electrospun membranes.
Increasing of fibers diameter leads to increasing mean pore size of electrospun
membranes. This result was similar to the results of Park et al. [39].
0
0.5
1
1.5
2
2.5
3
3.5
4
4.5
5
6 8 10 12 14 15 16 18 20
Me
an p
ore
siz
e (
µm
)
Applied voltage (kV) @ Dis 10 cm
Distance (cm) @ 18 kV

69
Figure 4.16 Correlation between diameters of nanofibers with mean pore size of
electrospun membranes tunable by preparations condition.
4.3.5 Mechanical property of electrospun membranes
The electrospun membranes were tested for their tensile strength and
elongation at break. The results are reported in Table 4.6.
Table 4.6 Tensile strength and elongation at break of electrospun membranes which
were prepared under conditions, a spinneret-to-collector distance of 10 cm, a flow
rate of 20 µL/min, and a spinneret diameter of 0.8 mm, a speed of substrates moving
of 2.2 cm/min, 65% RH and using PET nonwoven as the substrate but with variation
of applied voltage in electrospinning process.
Applied voltage
(kV)
Porosity (%)
Thickness (µm)
Fiber diameter
(nm)
Tensile Strength (N)
Elongation (%)
14 88 228 993 6.9 ± 1.0 7.2 ± 1.7 16 91 218 909 4.7 ± 1.3 7.9 ± 1.8 18 93 205 875 4.6 ± 1.2 14.8 ± 1.2
The tensile strength and elongation at break properties testing results of
electrospun membrane samples preparing under the conditions but with variation of
applied voltage are shown in Table 4.6. It was found that tensile strength of
electrospun membrane that was prepared by an applied voltage of 14 kV exhibited
0
0.5
1
1.5
2
2.5
3
3.5
4
4.5
800 850 900 950 1000 1050 1100 2000 2050
Me
an p
ore
siz
e (
µm
)
≈ Diameter of fibers (nm)
Applied voltage (kV) @ Dis 10 cm
Distance (cm) @ 18 kV
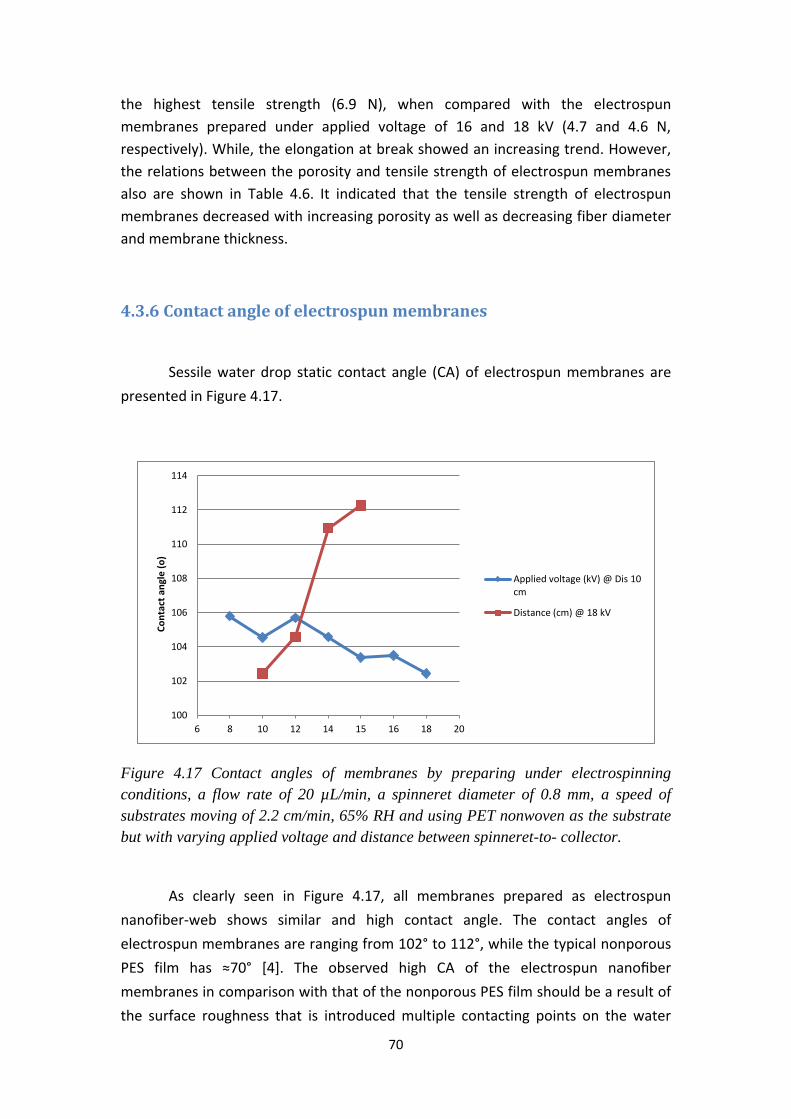
70
the highest tensile strength (6.9 N), when compared with the electrospun
membranes prepared under applied voltage of 16 and 18 kV (4.7 and 4.6 N,
respectively). While, the elongation at break showed an increasing trend. However,
the relations between the porosity and tensile strength of electrospun membranes
also are shown in Table 4.6. It indicated that the tensile strength of electrospun
membranes decreased with increasing porosity as well as decreasing fiber diameter
and membrane thickness.
4.3.6 Contact angle of electrospun membranes
Sessile water drop static contact angle (CA) of electrospun membranes are
presented in Figure 4.17.
Figure 4.17 Contact angles of membranes by preparing under electrospinning
conditions, a flow rate of 20 µL/min, a spinneret diameter of 0.8 mm, a speed of
substrates moving of 2.2 cm/min, 65% RH and using PET nonwoven as the substrate
but with varying applied voltage and distance between spinneret-to- collector.
As clearly seen in Figure 4.17, all membranes prepared as electrospun
nanofiber-web shows similar and high contact angle. The contact angles of
electrospun membranes are ranging from 102° to 112°, while the typical nonporous
PES film has ≈70° [4]. The observed high CA of the electrospun nanofiber
membranes in comparison with that of the nonporous PES film should be a result of
the surface roughness that is introduced multiple contacting points on the water
100
102
104
106
108
110
112
114
6 8 10 12 14 15 16 18 20
Co
nta
ct a
ngl
e (
o)
Applied voltage (kV) @ Dis 10 cm
Distance (cm) @ 18 kV

71
surface such that the interface area between the water droplet and the nanofiber
membranes surface becomes smaller. However, correlation of contact angle of
rough surfaces relation to the normal smooth surface have been proposed by using
contact angle model for explanation regarding those phenomenon, which the well
known is the Cassie-Baxter’s model. The assumption of the Cassie-Baxter’s model
(see Figure 4.18) is when measuring contact angle on the highly rough surface such
as a hydrophobic electrospun nanofiber membrane, the liquid drop is rested upon a
composite surface of polymer fiber and air gaps between them [cf. 107,108]. This
could be also explained because the PES electrospun membrane had high surface
porosity (see Figure 4.6 and 4.7).
Figure 4.18 Schematic of the Cassie-Baxter’s model.
4.4 Performance of PES electrospun membranes
4.4.1 Gas permeability
Gas permeability of electrospun membranes are summarized in Figure 4.19.

72
Figure 4.19 N2 gas permeability of PES electrospun membranes prepared by using
conditions, a spinneret-to-collector distance of 10 cm, a flow rate of 20 µL/min, a
spinneret diameter of 0.8 mm, 65% RH, a speed of substrates moving of 2.2 cm/min
and using PET nonwoven as the substrate, but with variation applied voltage in
process.
Gas flow through electrospun membranes could be explained with the
theory that assumes that porous media is a bundle of cylindrical tubes passing from
one surface of the membranes to the other surface, and not necessarily
perpendicular to the surface [84]. Figure 4.19 showed that increasing applied
voltage led to decreased gas permeability of electrospun membranes. It is to be
noted here that there is a close relationship between the applied voltage and fiber
diameter and also mean pore size of membranes. As the diameter of electrospun
fibers decreases with increasing electric field, hence the mean pore size also
decreases. Consequently, the mean pore size has affected the gas permeability that
decreasing of mean pore size leads to decreasing gas permeability of electrospun
membranes as well (see Figure 4.20). In addition, decreasing of thickness (see Figure
4.11) and increasing of porosity (see Figure 4.12) also lead to decreased gas
permeability of electrospun membranes.
0
0.5
1
1.5
2
2.5
3
3.5
6 8 10 12 14 15 16 18 20
KD
[*1
0-1
5]
(m
2)
Applied voltage (kV)

73
Figure 4.20 Correlation between mean pore size with N2 gas permeability of
electrospun membranes tunable by preparations condition.
4.4.2 Air filtration performance
The air filtration data of PES electrospun membranes are presented in Figure
4.21.
Figure 4.21 Aerosol (DEHS) collection efficiency of electrospun nanofiber prepared
by using conditions, a spinneret-to-collector distance of 10 cm, a flow rate of 20
µL/min, a spinneret diameter of 0.8 mm, a speed of substrates moving of 2.2 cm/min,
65% RH and using PET nonwoven as the substrate, but with variation applied
0
0.5
1
1.5
2
2.5
3
3.5
1 1.5 2 2.5 3 3.5 4 4.5 5
KD
[*1
01
5]
(m
2)
Mean pore size (um)
0
10
20
30
40
50
60
70
80
90
100
4 Layers Nonwoven 18 kV [1.7 µm] 16 kV [2 µm] 14 kV [2.7 µm]
% R
eje
ctio
n 400 nm
600 nm
800 nm
1000 nm
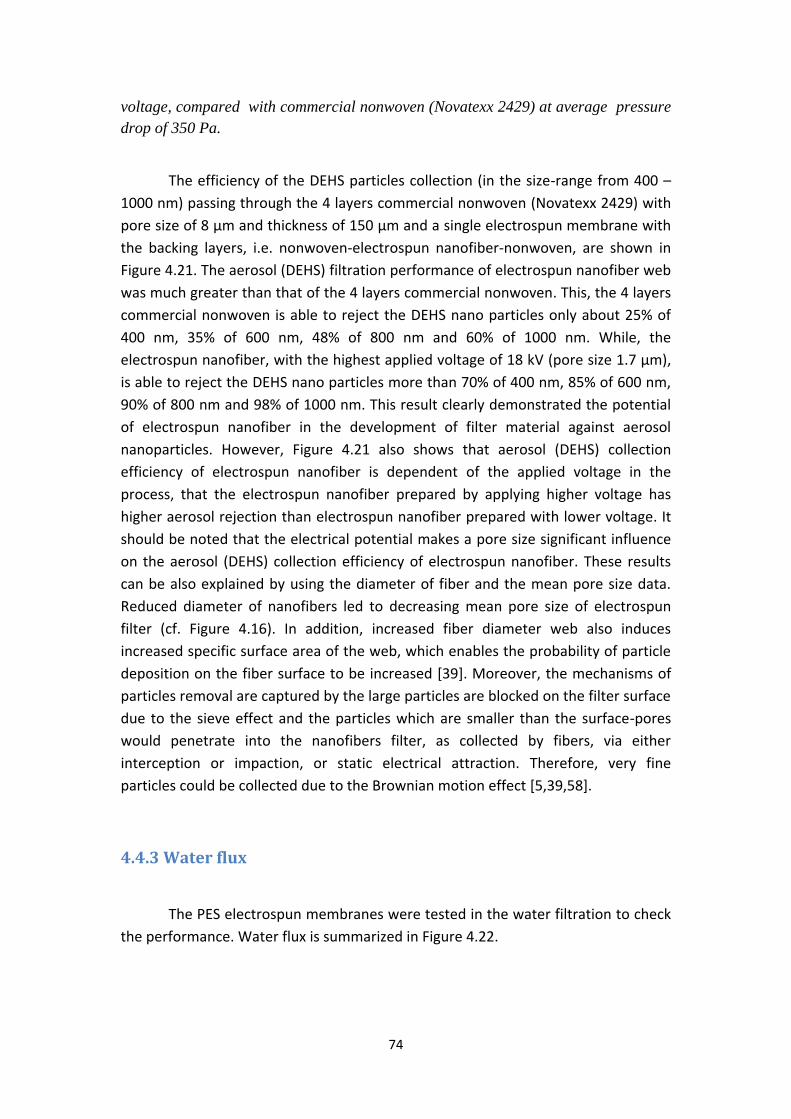
74
voltage, compared with commercial nonwoven (Novatexx 2429) at average pressure
drop of 350 Pa.
The efficiency of the DEHS particles collection (in the size-range from 400 –
1000 nm) passing through the 4 layers commercial nonwoven (Novatexx 2429) with
pore size of 8 µm and thickness of 150 µm and a single electrospun membrane with
the backing layers, i.e. nonwoven-electrospun nanofiber-nonwoven, are shown in
Figure 4.21. The aerosol (DEHS) filtration performance of electrospun nanofiber web
was much greater than that of the 4 layers commercial nonwoven. This, the 4 layers
commercial nonwoven is able to reject the DEHS nano particles only about 25% of
400 nm, 35% of 600 nm, 48% of 800 nm and 60% of 1000 nm. While, the
electrospun nanofiber, with the highest applied voltage of 18 kV (pore size 1.7 µm),
is able to reject the DEHS nano particles more than 70% of 400 nm, 85% of 600 nm,
90% of 800 nm and 98% of 1000 nm. This result clearly demonstrated the potential
of electrospun nanofiber in the development of filter material against aerosol
nanoparticles. However, Figure 4.21 also shows that aerosol (DEHS) collection
efficiency of electrospun nanofiber is dependent of the applied voltage in the
process, that the electrospun nanofiber prepared by applying higher voltage has
higher aerosol rejection than electrospun nanofiber prepared with lower voltage. It
should be noted that the electrical potential makes a pore size significant influence
on the aerosol (DEHS) collection efficiency of electrospun nanofiber. These results
can be also explained by using the diameter of fiber and the mean pore size data.
Reduced diameter of nanofibers led to decreasing mean pore size of electrospun
filter (cf. Figure 4.16). In addition, increased fiber diameter web also induces
increased specific surface area of the web, which enables the probability of particle
deposition on the fiber surface to be increased [39]. Moreover, the mechanisms of
particles removal are captured by the large particles are blocked on the filter surface
due to the sieve effect and the particles which are smaller than the surface-pores
would penetrate into the nanofibers filter, as collected by fibers, via either
interception or impaction, or static electrical attraction. Therefore, very fine
particles could be collected due to the Brownian motion effect [5,39,58].
4.4.3 Water flux
The PES electrospun membranes were tested in the water filtration to check
the performance. Water flux is summarized in Figure 4.22.

75
Figure 4.22 Water flux of PES electrospun membranes prepared by using conditions,
a flow rate of 20 µL/min, a spinneret diameter of 0.8 mm, a speed of substrates
moving of 2.2 cm/min, 65% RH and using PET nonwoven as the substrate with
variation applied voltage and distance between spinneret-to-collector in process.
According to the water flux profile shown in Figure 4.22, the electrospun
membranes prepared by applying higher voltage have lower flux than membranes
prepared with lower voltage. At the applied voltage of 8 kV, the water flux was very
high at 212 L/m2 h. As the applied voltage in process was increased from 10 kV to 18
kV, the water flux of the electrospun PES membrane was decreased from 175 to 90
L/m2 h. This can be explained in term of the decreased pore size of the electrospun
PES membrane.
Figure 4.22 also showed the water flux profile of PES electrospun membranes
prepared by variation of distance between spinneret-to-collector in process. It was
seen that the electrospun membranes prepared by increasing distance between
spinneret-to-collector leads to increasing water flux of membranes, when
membranes were electrospun at distance spinneret-to-collector of 15 cm led to
highest water flux (183 L/m2 h). Whereas, the water flux of electrospun membranes
reduced from 183 to 94 L/m2 h, when the distance between spinneret-to-collector
was decreased from 14 cm to 10 cm.
The mean pore size of the electrospun PES membrane, (cf. Figure 4.15), by
preparing at high applied voltage is lower than electrospun membranes by preparing
at low applied voltage. Furthermore, the result in Figure 4.15, it was found that the
mean pore size of electrospun membranes increased with increasing distance
between spinneret-to-collector. Correlating these results between mean pore size
with water flux of electrospun membranes are shown in Figure 4.23, it could be
explained that the mean pore size of electrospun membranes are the crucial
0
20
40
60
80
100
120
140
160
180
200
220
240
6 8 10 12 14 15 16 18 20
flu
x @
0.0
3 b
ar (
L/m
2 h
)
Applied voltage (kV) @ Dis 10 cm
Distance (cm) @ 18 kV
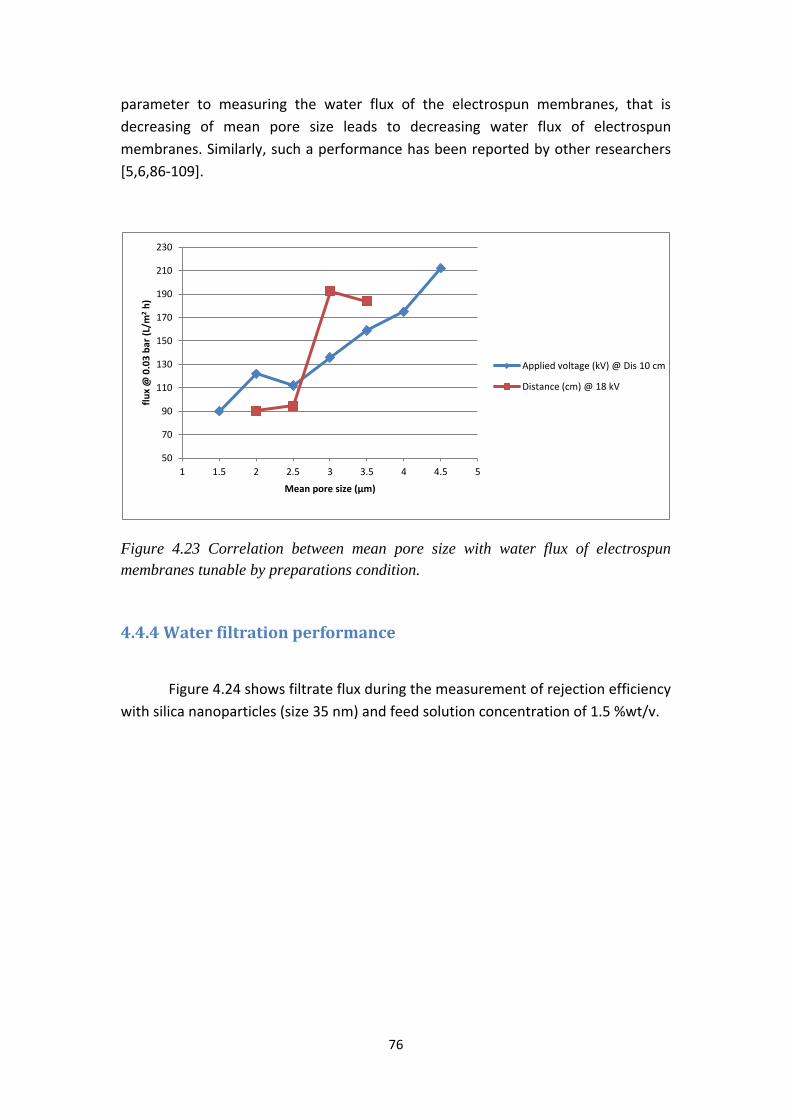
76
parameter to measuring the water flux of the electrospun membranes, that is
decreasing of mean pore size leads to decreasing water flux of electrospun
membranes. Similarly, such a performance has been reported by other researchers
[5,6,86-109].
Figure 4.23 Correlation between mean pore size with water flux of electrospun
membranes tunable by preparations condition.
4.4.4 Water filtration performance
Figure 4.24 shows filtrate flux during the measurement of rejection efficiency
with silica nanoparticles (size 35 nm) and feed solution concentration of 1.5 %wt/v.
50
70
90
110
130
150
170
190
210
230
1 1.5 2 2.5 3 3.5 4 4.5 5
flu
x @
0.0
3 b
ar (
L/m
2 h
)
Mean pore size (µm)
Applied voltage (kV) @ Dis 10 cm
Distance (cm) @ 18 kV

77
Figure 4.24 Filtrate flux during the measurement of rejection efficiency with silica
nanoparticles (size 35 nm) for PES electrospun membranes by using conditions,
applied voltage of 18 kV, a spinneret-to-collector distance of 10 cm, a flow rate of 20
µL/min, a spinneret diameter of 0.8 mm, a speed of substrates moving of 2.2 cm/min,
65% RH and served the PET nonwoven as the substrate, compared with commercial
membrane ( PES 12F Membrana).
As clearly seen in Figure 4.24, the fluxes through the commercial membrane
(PES 12F) dropped very rapidly in the beginning of filtration for silica nanoparticles.
The filtrate fluxes of commercial membrane (PES 12F Membrana) were much
smaller than the filtrate fluxes of PES electrospun membrane. It should be noted
that the mean pore size (1 µm) and porosity (65%) of the commercial membrane
were smaller than PES electrospun membrane. However, the filtrate fluxes of
varying layer of PES electrospun membrane were in the following order: ESM 1 layer
> ESM 2 layers > ESM 3 layers. This indicated that the thickness of electrospun
membrane increased, lower flux was obtained. Such phenomenon had been
observed in the previous reported literature [95]. The 3 layers electrospun
membrane also showed the longest filtration time to reach the value of 200 L/m2 h
at 0.1 bar (120 min) compared to the 2 layers (90 min), 1 layer (80 min) of
electrospun membrane and commercial membrane (50 min), respectively.
0
200
400
600
800
1000
1200
1400
1600
1800
0 10 20 30 40 50 60 70 80 90 100 110 120 130
flu
x @
0.1
bar
(L/
m2 h
)
Filtration time (min)
PES 12 F
ESM 1 layer
ESM 2 layers
ESM 3 layers
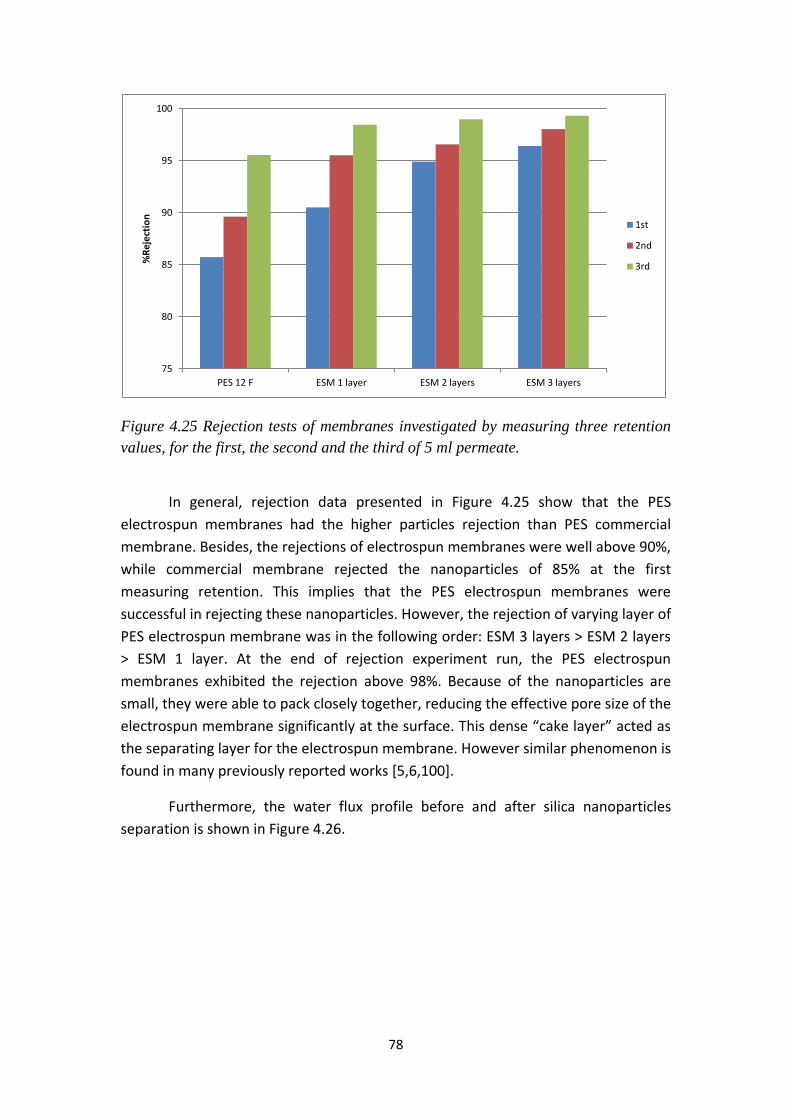
78
Figure 4.25 Rejection tests of membranes investigated by measuring three retention
values, for the first, the second and the third of 5 ml permeate.
In general, rejection data presented in Figure 4.25 show that the PES
electrospun membranes had the higher particles rejection than PES commercial
membrane. Besides, the rejections of electrospun membranes were well above 90%,
while commercial membrane rejected the nanoparticles of 85% at the first
measuring retention. This implies that the PES electrospun membranes were
successful in rejecting these nanoparticles. However, the rejection of varying layer of
PES electrospun membrane was in the following order: ESM 3 layers > ESM 2 layers
> ESM 1 layer. At the end of rejection experiment run, the PES electrospun
membranes exhibited the rejection above 98%. Because of the nanoparticles are
small, they were able to pack closely together, reducing the effective pore size of the
electrospun membrane significantly at the surface. This dense “cake layer” acted as
the separating layer for the electrospun membrane. However similar phenomenon is
found in many previously reported works [5,6,100].
Furthermore, the water flux profile before and after silica nanoparticles
separation is shown in Figure 4.26.
75
80
85
90
95
100
PES 12 F ESM 1 layer ESM 2 layers ESM 3 layers
%R
eje
ctio
n
1st
2nd
3rd

79
Figure 4.26 Pure water flux of membranes before and after silica nanoparticles
separation.
Overall, PES electrospun membrane showed greater water flux than
commercial membrane both before and after separation. The layer increase leads to
decreasing water flux of electrospun membranes. Importantly, it is clearly shown
that the water flux before particles separation of all membrane was higher than the
water flux after particles separation. As the nanoparticles were small, they were able
to pack closely together giving a so-called “layer effect”, and hence reducing the
effective pore size of electrospun membrane after particles separation.
Consequently, the water flux of electrospun membrane after particles separation
would result in lower flux. Moreover, as the data shows in Table 4.7, it indicated that
PES electrospun membranes, which were achieved in this work, are competitive
with a state-of-art of microfiltration membranes with similar pore diameter.
Table 4.7 Properties and filtration performance of PES electrospun membranes by
using conditions, applied voltage of 18 kV, a spinneret-to-collector distance of 10 cm,
a flow rate of 20 µL/min, a spinneret diameter of 0.8 mm, a speed of substrates
moving of 2.2 cm/min, 65% RH and served the PET nonwoven as substrate,
compared to commercial membrane (PES 12F Membrana) and other electrospun
membranes in literature review. Polymer Fiber
diameter (nm)
Pore size (µm)
Thickness (µm)
Permeability (l/m2.h.bar)
Filtration performance
(%)
Particle size
(µm)
Ref.
PES 875 1.7 205 18860 98 0.035 this work PES 12F (film) 1 110 10000 85 0.035 this work PES 280 2.0 200 2080 98 1.0 [92] PSU 470 ± 150 2.1 135 13333 94 1.0 [6] PVDF 380 ± 106 4.1 300 4000 91 5.0 [7] PAN-PET 100 0.22 200 2189 97 0.5 [58]
0
200
400
600
800
1000
1200
1400
1600
1800
2000
PES 12 F ESM 1 layer ESM 2 layers ESM 3 layers
flu
x @
0.1
bar
(L/
m2 h
)
Before
After

80
Chapter 5 Conclusions and Outlook
81
5. Conclusions and outlook
5.1 Conclusions
Through this work, nanofiber membranes were produced from
polyethersulfone (PES) by means of electrospinning process. The effect of 5
processing variables, including polymer concentration, applied voltage, spinneret-to-
collector distance, substrate and humidity, were thoroughly investigated. The first
results demonstrated that with a voltage of 30 kV, a spinneret-to-collector distance
of 10 cm and a PES solution concentration of 22%, the formation of uniform
nanofibers without any beads could be achieved in a stationary substrate set-up.
Remaining process parameters were constant with a flow rate of 20 µL/min and a
spinneret diameter of 0.8 mm. A PET nonwoven served as the substrate. Electrospun
nanofibers with fiber diameter as small as 489 nm were produced.
The ambient humidity proved to be of major importance, which can be
explained by its influence on solvent evaporation. In contrast to other polymer
systems, the optimum electrospinning conditions were given at a high humidity of
the order of 65% RH.
Actual nanofiber membranes could be manufactured by electrospinning PES
on moving substrates as, e.g., PET nonwoven. Compared to the stationary
experiment, the spinning conditions had to be further adapted to produce fibers of
constant diameter. Namely, the voltage had to be decreased further. Typical
spinning conditions were a voltage of 18 kV and a spinneret-to-collector distance of
10 cm. Under these spinning conditions, electrospun membranes with a mean fiber
diameter of 875 ± 156 nm, a thickness of 205 µm and a calculated basic weight of
0.169 mg/cm2 were obtained. The mean pore size was found to be 1.7 µm, and a
porosity of 93% was determined by water emersion test. The tensile strength of the
membrane was 4.6 N and contact angles in excess of ≈102°.
By variation of voltage and distance the characteristics of the membranes
could be controlled to a certain degree.
Filtration membrane properties, such as N2 gas flow and the efficiency of the
DEHS particles collection (in the size-range from 400 – 1000 nm) as well as the pure
water flux, the filtrate flux and rejection of 35 nm silica nanoparticles were
investigated.
With regard to air filtration, it was found that the PES electrospun
membranes, which were prepared by increasing applied voltage, showed decreasing
N2 gas permeability with decreasing mean pore size. Besides, the aerosol (DEHS in
the size-range from 400 – 1000 nm) filtration performance of PES electrospun

82
nanofiber web was much greater than that of the 4 layers commercial nonwoven
with pore size of 8 µm (Novatexx 2429). This result clearly demonstrated the
potential of electrospun nanofiber in the development of filter material against
nano-sized particles and aerosols.
Water flux of the electrospun membranes can be controlled by the spinning
conditions. Membranes prepared with higher voltage have lower flux than
membranes prepared with lower voltage. The electrospun membranes, which were
prepared at an increased distance between spinneret-to-collector, exhibited high
water flux. Both effects can easily be explained by the influence on the spinning
parameters onto pore size. The filtrate fluxes of PES commercial membrane with
pore size of 1 µm (12F Membrana) was much smaller than the filtrate fluxes of all
investigated PES electrospun membranes. Overall, PES electrospun membrane
showed greater water flux than commercial membrane (12F Membrana) both
before and after silica nanoparticles of 35 nm. In spite of their rather large pore sizes
and the high water flux, the PES electrospun membranes had the higher particles
rejection than PES commercial membrane (12F Membrana). At the first retention
measurement, the rejection of PES electrospun membranes was well above 90%,
while PES commercial membrane (12F Membrana) rejected the silica nanoparticles
by 85%. Moreover, the PES electrospun membranes exhibited the rejection above
98% at the end of rejection experiment run. It can be concluded from these results
that electrospun nanofiber PES membranes can be used in various applications such
as removal of nano or micro-particles from waste-water, e.g., pre-filters to minimize
contaminations and fouling prior to UF or NF. In summary, the results suggest that
PES electrospun nanofiber membranes are excellent materials for high flux MF
applications.
5.2 Outlook
Generally, high performance MF membranes can be made from PES but the
main limitation of this material is that it is prone to fouling due to its relatively
hydrophobic character (cf. section 4.3.6). Therefore, membrane modification is
usually done to increase the membrane resistance towards fouling. Common
methods used to manufacture low fouling membranes are blending membrane
polymer with hydrophilic additive (e.g., PVP). Moreover, polymeric additives (usually
hydrophilic polymers) in a casting solution are also used in order to increase both
pore size and porosity (performing agent) and to suppress macrovoid formation and
increases membrane hydrophilicity.

83
Figure 5.1 Morphology of electrospun membrane prepared from 22% PES with 5%
Pluronic, using the processing condition, i.e., an applied voltage of 18 kV, a flow
rate of 20 µL/min, a spinneret-to-collector distance of 10 cm, a spinneret diameter of
0.8 mm, moving speed of substrate of 2.2 min/cm, 65% RH and PET nonwoven
served as the substrate.
A first experiment in this direction conducted as a proof of principle was
performed in the further work of this research. 5% Pluronic (31R1) was added to a
standard spinning solution and spun under same conditions as before. The result
from SEM images (Figure 5.1) of the electrospun 22% PES and 5% Pluronic
nanofibers membrane using the same processing condition as before and PET
nonwoven served as substrate, exhibited in irregular fiber formation and the
diameter of fibers were varying thickness. These results could be explained in term
of the viscosity of the solution effect (cf. section 2.2.1.1). When the processing
conditions, i.e., an applied voltage, a flow rate and a spinneret-to-collector distance,
are varied and the resulting fiber diameter becomes into nano range. Then, the
electrospun membranes would be expected to improve the wetability and filtration
performance. Therefore, this work is worth continuous research.
84
References
85
[1] W.S. Winston Ho, K.K. Sirkar, Membrane handbook, Van Nostrand Reinhold, New
York, 1992.
[2] M. Cheryan, Ultrafiltration and microfiltration handbook, Technomic Publishing
Company Inc., Pennsylvania, 1998.
[3] R.W. Baker, Membrane technology and applications, 2nd ed., John Wiley & Sons,
Ltd., Chichester, 2004.
[4] H. Susanto, M. Ulbricht, Characteristic, performance and stability of poly(ether
sulfone) ultrafiltration membranes prepared by phase separation method using
different macromolecular additive, J. Membr. Sci., 327 (2009) 125-135.
[5] F. Jian, N. Haitao, L. Tong and W. Xungai, Application of electrospun nanofibers, J.
Chin. Sci. Bull., 53 (2008) 2265-2286.
[6] R. Gopal, S. Kaur, C. Y. Feng, C. Chan, S. Ramakrishna, S. Tabe and T. Matsuura,
Electrospun nanofibrous polysulfone membranes as pre-filters: Particular removal, J.
Membr. Sci., 289 (2007) 210-219. [7] R. Gopal, S. Kaur, Z. Ma, C. Chan, S. Ramakrishna and T. Matsuura, Electrospun nanofibrous filtration membrane, J. Membr. Sci., 281 (2006) 581-586. [8] T. Uyar, R. Havelund, Y. Nur and J. Hacaloglu, Molecular filters based on
cyclodextrin functionalized electrospun fibers, J. Membr. Sci., 332 (2009) 129-137.
[9] http://www.nano.kku.ac.th
[10] M. Ziabari, V. Mottaghiable, A. K. Haghi, Application of direct tracking method
for measuring electrospun nanofiber diameter, Braz. J. Chem. Eng., 26 (2009).
[11] Z. M. Huan, Y. Z. Zhan, M. Kotaki, S. Ramakrishna, A review on polymer
nanofibers by electrospinning and their applications in nanocomposites, J. Comp.
Sci., 63 (2003) 2223-2253.
[12] http://www.chromacademy.com/Electrospray-Ionization-ESI-for-LC-MS.asp
[13] N. G. McCrum, C. P. Buckley, C. B. Bucknall, Principles of polymer engineering,
Oxford University Press, USA, 1997.
[14] C. J. Buchko, L. C. Chen, S. Y. Martin, Processing and microstructural
characterization of porous biocompatible protein polymer thin films, D. C. Polym., 40
(1999) 7397.
[15] S. Ramakrishna, K. Fujihara, W. E. Teoteik, C. Lim, Z. Ma, An Introduction to
electrospinning and nanofibers, World Scientific Publishing, 2005.
[16] S. L. Shenoy, W. D. Bates, H. L. Frisch, G. E. Wnek, Role of chain entanglements
on fiber formation during electrospinning of polymer solutions: good solvent, non-
specific polymer–polymer interaction limit, Polymer, 46 (2005) 3372-3384.

86
[17] X. Zong, K. Kim, D. Fang, S. Ran, B. S. Hsiao, B. Chu, Structure and process
relationship of electrospun bioabsorbable nanofiber membranes, Polymer, 43 (2002)
4403-4412.
[18] M. Ma, G. C. Rutledge, Nanostructured electrospun fibers, Polym. Sci., 7 (2012)
187-208.
[19] H. Fong, D. H. Reneker, Elastomeric nanofibers of styrene-butadiene-styrene
blocks copolymer, J. Polym. Sci. Pt. B-Polym. Phys., 37 (1999) 3488-3493.
[20] C. Mituppatham, M. Nithitanakul, P. Supaphol, Ultrafine electrospun polyamide-
6 fibers: effect of solution conditions on morphology and average fiber diameter.
Macromol. Chem. Phys., 205 (2004) 2327-2338.
[21] C. Yao, X. Li, K. G. Neoh, Z. Shi, E. T. Kang, Surface modification and antibacterial
activity of electrospun polyurethane, J. Membr. Sci., 320 (2008) 259-267.
[22] K. Tan, S. K. Obendorf, Fabrication and evaluation of electrospun nanofiberrous
antimicrobial Nylon 6 membrane, J. Membr. Sci., 305 (2007) 287-298.
[23] X. Li, X. Hao, D. Xu, G. Zhang, S. Zhong, H. Na, D. Wang, Fabrication of
sulfonated poly(ether ether ketone ketone) membrane with high proton
conductivity, J. Membr. Sci., 281 (2006) 1-6.
[24] Z. Tang, C. Qiu, J. R. McCutcheon, K. Yoon, H. Ma, D. Fang, E. Lee, C. Kopp, B. S.
Hsiao, B. Chu, Design and fabrication of electrospun poly(ether sulfone) nanofibrous
scaffold for high-flux nanofiltration, J. Polym. Sci. Pt. B-Polym. Phys., 47 (2009) 2288-
2300.
[25] K. Nakata, S. H. Kim, Y. Ohkoshi, Y. Gotoh, M. Nagura, Electrospinning of poly
(ether sulfone) and evaluation of the filtration efficiency, Society of Fiber Sci. and
Technol. Japan, 63 (2007) 307-312.
[26] M. Kang, H.J. Jin, Electrically conducting electrospun silk membranes fabricated
by adsorption of carbon nanotube, Coll. Polym. Sci., 285 (2007) 1163-1167.
[27] B. Wang, Y. Sun, H. Wang, Preparation and properties of electrospun PAN/Fe3O4
magnetic nanofibers, J. Appl. Polym. Sci., 115 (2010) 1781-1786.
[28] H. Fong, I. Chun, D. H. Reneker, Beaded nanofibers formed during
electrospinning, Polymer, 40 (1999) 4585.
[29] J. Zeng, X. Xu, X. Chen, Q. Liang, X. Bian, L. Yang, X. ling, Biodegradable
electrospun fibers for drug delivery, J. Contr., 92 (2003) 227-231.
[30] P. K. J. Baumgarten, Electrostatic spinning of acrylic microfibers, Colloid
Interface Sci., 36 (1971) 71.
[31] S. Megelski, J. S. Stephens, D. B. Chase, J. F. Rabolt, Micro- and nano-structured
surface morphology on electrospun polymer fibers, Macromolecules, 35 (2002)
8456-8466.

87
[32] K. H. Lee, H. Y. Kim, La, Y. M. Lee, N. H. Sung, Influence of a mixing solvent with
tetrahydrofuran and N,N-dimethylformamide on electrospun poly(vinyl chloride)
nonwoven mats, J. Polym. Sci.: Part B: Polym. Phys., 40 (2004) 2259.
[33] M, Bognitzki, W. Czado, T. Frese, A. Schaper, M. Hellwig, M. Steinhart, A.
Greiner, H. Wendorff, Nanostructured fibers via electrospinning, Adv. Mater., 13
(2001) 70.
[34] S.V. Fridrikh, J.H. Yau, M.P. Brenner, G.C. Rutledge, Controlling the fiber
diameter during electrospinning, Phys. Rev. Lett., 90 (2003) 144-502.
[35] T. Bahners, U. Schlosser, E. Schollmeyer, Field modification for optimized fiber
production by electrospinning, Chem. F. Inter., 4 (2006) 246-249.
[36] G. Taylor, Disintegration of Water Drops in an Electric Field. Proc. R. Soc. Lond.,
280 (1964) 383-397.
[37] X. Zong, K. Kim, D. Fang, S. Ran, B. S. Hsiao, B. Chu, Structure and process
relationship of electrospun bioabsorbable nanofiber membranes, Polymer, 43 (2002)
4403-4412.
[38] J. S. Lee, K.H. Choi, D. H. Ghim, S. S. Kim, D. H. Chun, H. Y. Kim, W. H. Lyoo, Role
of molecular weight of a tactic poly(vinyl alcohol) (PVA) in the structure and
properties of PVA nanofabric prepared by electrospinning, J. Appl. Polym. Sci., 93
(2004) 1638-1646.
[39] H. S. Park, Y. O. Park, Filtration properties of electrospun ultrafine fiber webs,
Korean J. Chem. Eng., 22 (2005) 165-172.
[40] R. S. Barhate, C. K. Loong, S. Ramakrishna, Preparation and characterization of
nanofibrous filtering media, J. Membr. Sci., 283 (2006) 209-218.
[41] S. L. Zhao, X. H. Wu, L. G. Wang, Y. Huang, Electrospinning of ethyl-Cyanoethyl
cellulose/tetrahydrofuran solutions, J. Appl. Polym. Sci., 91 (2004) 242-246.
[42] E. S. Medeiros, L. H. C. Mattoso, R. D. Offeman, D. F. Wood, W. J. Can, J Chem.,
86 (2008) 590-599.
[43] C. Wang, C. H. Hsu, L. H. Lin, Macromolecules, 39 (2006) 7662-7672.
[44] P. K. Baumgarten, Electrostatic spinning of acrylic microfibers, J. Colloid
Interface Sci., 36 (1971) 71.
[45] R. Gopal, S. Kaur, Z. Ma, C. Chan, S. Ramakrishna, T. Matsuura, Electrospun
nanofibrous filtration membrane, J. Membr. Sci., 281 (2006) 581-586.
[46] J. He, Y. Wan, J. Yu, Application of vibration technology to polymer
electrospinning, Inter. J. Nonli. Sci. and Numer. Simul., 5 (2004) 253-262.
[47] V. Beachley, X. Wen, Polymer nanofibrous structures: Fabrication,
biofunctionalization, and cell interactions, Prog. Polym. Sci., 35 (2010) 868-892.
88
[48] Z. Huang, Y. Z. Zhang, M. Kotaki, S. Ramakrishna, A review on polymer
nanofibers by electrospinning and their applications in nanocomposites, Composites
Sci. and Technol., 63 (2003) 2223-2253.
[49] http://www.smartsynthetics.com/amsoil-filters
[50] http://www.downdraft.com/filters/filters.htm
[51] http://www.freedm.ncsu.edu
[52] http://www.stevens.edu
[53] http://www.nanowerk.com
[54] http://www.epa.gov
[55] K. Sutherland, Filters and filtration handbook, 5th, Elsevier, USA, 2008.
[56] http://www.lydallfiltration.com/
[57] http://www.filtsep.com/view/30721/
[58] R. Wang, Y. Liu, B. Lia, B. S. Hsiao, Electrospun nanofibrous membranes for high
flux microfiltration, J. Membr. Sci., 392-393 (2012) 167-174.
[59] A. Holzmeister, M. Rudisile, A. Greiner, J. H. Wendorff, Structurally and
chemically heterogeneous nanofibrous nonwovens via electrospinning, Euro. Polym.
J., 43 (2007) 4859-4867.
[60] K. Yoon, B. S. Hsiao and B. Chu, Functional nanofibers for environmental
applications, J. Mater. Chem., 18 (2008) 5326-5334.
[61] P. P. Tsaia, H. Schreuder-Gibson, P. Gibson, Different electrostatic methods for
making electrets filters, J. Electrost., 54 (2002) 333-41.
[62] T. Bahners, E. Schollmeyer, Multi-layer deep bed filter for micron/submicron
separation, Filtration, 8 (2008) 135-139.
[63] T. Bahners, E. Schollmeyer, Technische textilien, 44 (2001) 130.
[64] N. Fuchs, The mechanics of aerosols, Pergamon Press, Oxford, 1946.
[65] G. Pflueger, A. Bossman, W. Ringens, T. Bahners, H. Fissan, E. Schollmeyer,
Textil Praxis Int., 40 (1985) 1300.
[66] T. Bahners, E. Schollmeyer, J. Aerosol Sci., 17 (1986) 191.
[67] T. Bahners, E. Schollmeyer, Staub-Reinh. Luft., 47 (1987) 115.
[68] V. Thavasi, G. Singh, S. Ramakrishna, Electrospun nanofibers in energy and
environmental applications, Energy Environ. Sci., 1 (2008) 205-221.
[69] http://www2.donaldson.com
[70] R. W. Baker, Membrane Technology and Applications, 2nd ed., Wiley, 2004.
[71] W. C. Hinds, Aerosol technology, 2nd ed., Wiley, New York, 1999.

89
[72] K. M. Yun, C. J. Hogan, Y. Matsubayashic, M. Kawabec, F. Iskandara, K.
Okuyama, Nanoparticle filtration by electrospun polymer fibers, Chem. Eng. Sci., 62
(2007) 4751-4759.
[73] A. Podgórski, A. Bałazy, L. Grado´n, Application of nanofibers to improve the
filtration efficiency of the most penetrating aerosol particles in fibrous filters, Chem.
Eng. Sci., 61 (2006) 6804-6815.
[74] A. Patanaika, V. Jacobsa, Rajesh, D. Anandjiwala, Performance evaluation of
electrospun nanofibrous membrane, J. Membr. Sci., 352 (2010) 136-142.
[75] J. Pich, Theory of aerosol filtration by fibrous and membrane filters, in: C. N.
Davies (Ed.), Aerosol Science, Academic Press, London, (1966) 223-283.
[76] Q. Zhang, J. Welch, H. J. Park, C. Yuwu, W. Sigmund, C.M. Marijnissen,
Improvement in nanofiber filtration by multiple thin layers of nanofiber mats, J.
Aero. Sci., 41(2010) 230-236.
[77] K. Soukup, D. Petrs, P. Kluson, O. Solcov, Nanofiber membranes evaluation of
gas transport, Catalysis Today, 156 (2010) 316-321.
[78] S. Fotovati, H. V. Tafreshi, B. Pourdeyhimi, Influence of fiber orientation
distribution on performance of aerosol filtration media, Chem. Eng. Sci., 65 (2010)
285-5293.
[79] W. W. F. Leung, C. H. Hung, Investigation on pressure drop evolution of fibrous
filter operating in aerodynamic slip regime under continuous loading of submicron
aerosols, Sep. Purif. Technol., 63 (2008) 691-700.
[80] W. W. F. Leung, C. H. Hung, Skin effect in nanofiber filtration of submicron
aerosols, Sep. Purif. Technol., 92 (2012) 174-180.
[81] H. W. Lia, C. Y. Wua, F. Tepperb, J. H. Leea, C. N. Leec, Removal and retention of
viral aerosols by a novel alumina nanofiber filter, Aero. Sci., 40 (2009) 65-71.
[82] A. D. Vaisniene, J. Ktunskis, G. Buika, Electrospun PVA nanofiber for gas
filtration applications, Fiber&Textile in East. Euro., 77 (2009) 40-43.
[83] W. W. F. Leung, C. H. Hung, P. T. Yuen, Effect of face velocity, nanofiber packing
density and thickness on filtration performance of filters with nanofibers coated on
a substrate, Sep. Purif. Technol., 71 (2010) 30-37.
[84] M. A. Hassan, B. Y. Yeom, A. Wilkie, B. Pourdeyhimi, S. A.Khan, Fabrication of
nanofiber meltblown membranes and their filtration properties, J. Membr. Sci., 427
(2013) 336-344.
[85] M. H. V. Mulder, Basic Principles of Membrane Technology, 2nd ed., Kluwer
Academic Publishers, 1996.
[86] S. Kaur, Z. Ma, R. Gopal, G. Singh, S. Ramakrishna, T. Matsuura, Plasma-induced
graft copolymerization of poly(methacrylic acid) on electro spun poly(vinylidene
fluoride) nanofiber membrane, Langmuir, 23 (2007) 13085-13092.

90
[87] X. Zhuang, L. Shi, K. Jia, B. Cheng, W. Kang, Solution blown nanofibrous
membrane for microfiltration, J. Membr. Sci., 429 (2013) 66-70.
[88] A. M. Bazargan, M. Keyanpour-rad, F. A. Hesari, M. E. Ganji, A study on the
microfiltration behavior of self-supporting electrospun nanofibrous membrane in
water using an optical particle counter, Desalination, 265 (2011) 148-152.
[89] B. Veleirinho, J. A. Lopes-da-Silva, Application of electrospun poly(ethylene
terephthalate) nanofiber mat to apple juice clarification, Proc. Biochem., 44 (2009)
353-356.
[90] A. Cooper, R. Oldinski, H. Ma, J. D. Bryers, M. Zhang, Chitosan – based
nanofibrous membranes of antibacterial filter applications, Carbohydrate Polymer,
92 (2013) 254-259.
[91] S. Sh. Homaeiogohar, K. Buhr, K. Ebert, Polyethersulfone electrospun
nanofibrous composite membrane for liquid filtration, J. Membr. Sci., 365 (2010) 68-
77.
[92] S. Sh. Homaeiogohar, J. Koll, E. T. Lilleodden, M. Elbahri, The solvent induced
interfiber adhesion and its influence on the mechanical and filtration properties of
poly(ether sulfone) electrospun nanofibrous microfiltration membranes, J. Membr.
Sci., 98 (2012) 456-463.
[93] K. Yoon, K. Kim, X. Wang, D. Fang, B. S. Hsiao, B. Chu, High flux ultrafiltration
membranes based on electrospun nanofibrous PAN scaffolds and chitosan coating,
Polymer, 47 (2006) 2434-2441.
[94] W. J. Wrasidlo, K. J. Mysels, J. Parentral Sci. Technol., 38 (1984) 24.
[95] F. G. Paulsen, S. S. Shojaie, W. B. Krantz, Effect of evaporation step on macro-
void for formation in wet-cast polymeric membranes, J. Membr. Sci., 91 (1994) 265
[96] R. S. Barhate, S. Ramakrishna, Nanofibrous filtering media: Filtration problems
and solution from tiny materials, J. Membr. Sci., 296 (2007) 1-8.
[97] T. Eugene Cloete, M. D. Kwaadsteniet, M. Botes, Nanotechnology in water
treatment applications, Caister Acadamic Press, Norfolk, UK, 2010.
[98] H. You, Y. Yin, X. Li, K. Zhanga, X. Wang, M. Zhua, B. S. Hsiao, Low pressure high
flux thin film nanofibrous composite membranes prepared by electrospraying
technique combined with solution treatment, J. Membr. Sci., 394– 395 (2012) 241-
247.
[99] Z. Tang, J. Wei, L. Yung, B. Ji, H. Ma, C. Qui, K. Yoon, F. Wan, D. Fang, B. S. Hsiao,
B. Chu, UV-cured poly(vinyl alcohol) ultrafiltration nanofibrous membrane based on
electrospun nanofiber scaffolds, J. Membr. Sci., 328 (2009) 1-5.
[100] D. Aussawasathien, C. Teerawattananon, A. Vongachariya, Separation of
micron to sub-micron particles from water: Electrospun Nylon-6 nanofibrous
membranes as pre-filters, J. Membr. Sci., 315 (2008) 11-19.

91
[101] N. N. Bui, M. L. Lind, E. M. V. Hoek, J. R. Mccutcheon, Electrospun nanofiber
supported thin film composite membranes for engineered osmosis, J. Membr. Sci.,
385-386 (2012) 10-19.
[102] T. J. Sill, H. A. von Recum, Electrospinning: Applications in drug delivery and
tissue engineering, Biomaterials, 29 (2008) 1989-2006.
[103] Y. Liu, R. Wang, H. Ma, B. S. Hsiao, B. Chu, High-flux microfiltration filters based
on electrospun poly(vinyl alchhol) nanofibrous membranes, Polymer, 54 (2013) 548-
556.
[104] Z. Ma, M. Kotaki, S. Ramakrishna, Electrospun cellulose nanofiber as affinity
membrane, J. Membr. Sci., 265 (2005) 115-123.
[105] A. I. Gopalan, P. Santhosh, K. M. Manesh, J. H. Nho, S. H. Kim, C. G. Hwang, K.
P. Lee, Development of electrospun PVdF-PAN membranes-based polymer
electrolytes for lithium batteries, J. Membr. Sci., 325 (2008) 683-690.
[106] J. R. Kim, S. W. Choi, S. M. Jo, W. S. Lee, B. C. Kim, Electrospun PVdF-based
fibrous polymer electrolytes for lithium ion polymer batteries, Electrochem. Acta.,
50 (2004) 69.
[107] P. Roach, N. J. Shirtcliffe, M. I. Newton, Progress in super-hydrophobic surface
development, The Royal Society of Chem., 4 (2008) 224-240.
[108] J. M. Lim, G. Y. Yi, J. H. Moon, C. J. Heo, S. M. Yang, Super hydrophobic films of
electrospun fibers with multiple-scale surface morphology, Langmuir., 23 (2007)
7981-7989.
[109] S. Sh. Homaeiogohar, J. Koll, E. T. Lilleodden, M. Elbahri, The solvent induced
interfiber adhesion and its influence on the mechanical and filtration properties of
poly(ether sulfone) electrospun nanofibrous microfiltration membranes, J. Membr.
Sci., 98 (2012) 456-463.

92
Appendix-1
List of Abbreviations
µL microlitre
µm micrometer
Avg average
DEHS di-ethyl-hexyl-sebacat
DMF dimethylformamide
ESM electrospun membrane
HEPA high efficiency particulate air
kV kilovolts
MF microfiltration
N2 nitrogen
NF nanofiltration
nm nanometer
NMP n-methyl-2-pyrrolidone
Pa s pascal-second
PAN polyacrylonitrile
PCL polycaprolactone
PDLA polylactic acid
PEO polyethylene oxide
PES polyethersulfone
PET polyethylene terephthalate
PLLA poly-L-lactide acid

93
PS polystyrene
PSU polysulfone
PU polyurethane
PVA polyvinyl alcohol
PVC polyvinyl chloride
PVDF polyvinylidene fluoride
RH relative humidity
SEM scanning electron microscope
St stokes number
TFNC thin film nanocomposite
Tg glass-transition temperature
THF tetrahydrofuran
Tm melting temperature

94
Appendix-2
List of Conferences
2011 International Congress on Membranes and Membrane Processes
(ICOM) , Amsterdam, Netherlands.
“Preparation of Electrospun Polyethersulfone Nanofiber Membranes”
(poster paper)
2011 International Conference The World’s Most Established Textile and
Garment Machinery Technology Exhibition (ITMA), Barcelona, Spain
2010 Aachen- Dresden International Textile Conference, Dresden, Germany
“Preparation of Electrospun Polyethersulfone Nanofiber Membranes”
(poster paper)
2009 Aachen- Dresden International Textile Conference, Aachen, Germany

95
Appendix-3
Curriculum Vitae
Personal information:
Name Bintasan KWANKHAO Place of Birth Trang, Thailand
Birth Date February 27,1979 Nationality Thai
Education:
2009-2013 Doctoral study at the University of Duisburg-Essen, Lehrstuhl für
Technische Chemie II, Germany
2002-2004 Master of Science (Applied Polymer Science and Textile Technology),
Chulalongkorn University, Thailand
Thesis: Changes of Color and Physical Properties of Fabrics after UV
Protection Finishing
1998-2002 Bachelor of Engineering (Textile Engineering), Rajamangala Institute
of Technology, Thailand
Project: A Study of Possibility of Bagasse Paper Pulp to Made Textile
Fiber
Related job experience:
April 2005 – Current Lecturer, Department of Textile Engineering, Faculty of
Engineering, Rajamangala University of Technology
Thanyaburi, Thailand
2003 – 2004 Assistant researcher, Center of Excellence in Textiles,
Department of Material Science, Faculty of Science,
Chulalongkorn University, Thailand
Research:
2007 – 2009 Co-researcher, “A Study of Producing Bullet Proof Vest from
Man Made Fiber for Commercial Purposes”, Thailand Textile
Institute, Ministry of Industry (in patent) Training:
April – May, 2008 Swiss Textile College, Zurich and Wattwil, Switzerland
![Electrospinning for Bone Tissue Engineering · solution electrospinning and melt electrospinning to produce a 3D cell-invasive scaffold has been described [20]. While melt electrospinning](https://img.dokumen.tips/doc/110x75/5e2f2481450bb928ad6e34c6/electrospinning-for-bone-tissue-engineering-solution-electrospinning-and-melt-electrospinning.jpg)